Reprinted by U.S. Forest Service for official use from Proceedings of the Federal Inter-Agency Sedimentation Conference, 1963 U.S. Dep. Agr. Misc. Pub. 970. 1965. SEDIMENTATION AFTER LOGGING ROAD CONSTRUCTION IN A SMALL WESTERN OREGON WATERSHED [Paper No. 81 By R. L. FREDRICKSEN, research forester, Pacific Northwest Forest and Range Experiment Station, Forest Service, Portland, Oreg. las-fir timber from these watersheds, the con- struction activities expose considerable raw soil, often resulting in increased sedimentation. In 1952, the Forest Service began a watershed ex- periment designed to measure the effect of in- tensive forest land management upon the sedi- ment load carried by streams in the western Cascade Range of Oregon. The first treatment phase began in 1959 when logging roads were built in one experimental watershed. This paper presents an estimate of the change in suspended sediment concentration after construction of these roads. Colby, Hembre, and Rainwater,' in a thor- ough investigation of the Wind River basin of Wyoming, found annual sediment yield ranged from 1.11 to 0.70 ton per acre during a 5-year period. They found large differences in the sediment load carried from watersheds drain- ing different types of geologic materials. Care must be taken when projecting sedimentation rates from small watershed studies to larger watersheds, particularly where there is a change in geologic material. Anderson 2 was able to segregate sediment load in the Willamette River basin of western Oregon into three sources : (1) 24 percent from forest lands comprising 77 percent of the drain- age area, (2) 22 percent from agricultural land comprising 23 percent of the area, and (3) 54 percent from 205,000 feet of eroding main chan- nel. He predicted that if forest land develop- ment continued at the rate existing at the time of the study, sediment discharge would increase to three times the rate that was estimated for the watershed condition in 1950. The progress of erosion from a small water- shed was measured for 3 years after logging in the Sierra Nevada of California. Here Ander- 56 Abstract During the summer of 1959, 1.65 miles of log- ging road were constructed in a 250-acre for- ested watershed that rises 2,000 feet in a distance of 1 mile. This study evaluates the change in sedimentation subsequent to road construction. Runoff from undisturbed water- sheds in this area remains clear during the summer low-flow months and reaches concen- trations of 100 parts per million during winter storm peaks. Runoff from the first rainstorms after road construction carried 250 times the concentration carried in an adjacent undis- turbed watershed. Two month; after construc- tion, sediment had diminished to levels slightly above those measured before construction. Sediment concentrations for the subsequent 2- year period were significantly different from preroad levels. In about 10 percent of the samples, sediment concentrations were far in excess of predicted values, indicating a stream- bank failure or mass soil movement. Annual bedload volume the first year after construction was significantly greater than the expected yield, but the actual increase was small. A trend toward normalcy was evident the second year. Introduction Streams flowing from undisturbed mountain watersheds of western Oregon normally carry very small sediment loads. But when logging roads are built to harvest the old-growth Doug- 1 COLBY, B. R., HEMBRE, C. H., and RAINWATER, F. H. SEDIMENTATION AND CHEMICAL QUALITY OF SURFACE WATER IN THE WIND RIVER BASIN, WYOMING. U.S. Geol. Survey Water-Supply Paper 1373, 336 pp. 1956. 2 ANDERSON, H. W. SUSPENDED SEDIMENT DISCHARGE AS RELATED TO STREAM FLOW, TOPOGRAPHY, SOIL, AND LAND USE. Amer. Geophys. Union Trans. 35(2) : 268-281. 1954.
Transcript
Reprinted by U.S. Forest Service for official use
from
Proceedings of the Federal Inter-Agency Sedimentation Conference, 1963U.S. Dep. Agr. Misc. Pub. 970. 1965.
SEDIMENTATION AFTER LOGGING ROAD CONSTRUCTION
IN A SMALL WESTERN OREGON WATERSHED[Paper No. 81
By R. L. FREDRICKSEN, research forester, Pacific Northwest Forest and Range Experiment Station, Forest Service,Portland, Oreg.
las-fir timber from these watersheds, the con-struction activities expose considerable raw soil,often resulting in increased sedimentation. In1952, the Forest Service began a watershed ex-periment designed to measure the effect of in-tensive forest land management upon the sedi-ment load carried by streams in the westernCascade Range of Oregon. The first treatmentphase began in 1959 when logging roads werebuilt in one experimental watershed. This paperpresents an estimate of the change in suspendedsediment concentration after construction ofthese roads.
Colby, Hembre, and Rainwater,' in a thor-ough investigation of the Wind River basin ofWyoming, found annual sediment yield rangedfrom 1.11 to 0.70 ton per acre during a 5-yearperiod. They found large differences in thesediment load carried from watersheds drain-ing different types of geologic materials. Caremust be taken when projecting sedimentationrates from small watershed studies to largerwatersheds, particularly where there is achange in geologic material.
Anderson 2 was able to segregate sedimentload in the Willamette River basin of westernOregon into three sources : (1) 24 percent fromforest lands comprising 77 percent of the drain-age area, (2) 22 percent from agricultural landcomprising 23 percent of the area, and (3) 54percent from 205,000 feet of eroding main chan-nel. He predicted that if forest land develop-ment continued at the rate existing at the timeof the study, sediment discharge would increaseto three times the rate that was estimated forthe watershed condition in 1950.
The progress of erosion from a small water-shed was measured for 3 years after logging inthe Sierra Nevada of California. Here Ander-
56
AbstractDuring the summer of 1959, 1.65 miles of log-
ging road were constructed in a 250-acre for-ested watershed that rises 2,000 feet in adistance of 1 mile. This study evaluates thechange in sedimentation subsequent to roadconstruction. Runoff from undisturbed water-sheds in this area remains clear during thesummer low-flow months and reaches concen-trations of 100 parts per million during winterstorm peaks. Runoff from the first rainstormsafter road construction carried 250 times theconcentration carried in an adjacent undis-turbed watershed. Two month; after construc-tion, sediment had diminished to levels slightlyabove those measured before construction.Sediment concentrations for the subsequent 2-year period were significantly different frompreroad levels. In about 10 percent of thesamples, sediment concentrations were far inexcess of predicted values, indicating a stream-bank failure or mass soil movement. Annualbedload volume the first year after constructionwas significantly greater than the expectedyield, but the actual increase was small. Atrend toward normalcy was evident the secondyear.
IntroductionStreams flowing from undisturbed mountain
watersheds of western Oregon normally carryvery small sediment loads. But when loggingroads are built to harvest the old-growth Doug-
1 COLBY, B. R., HEMBRE, C. H., and RAINWATER, F. H.SEDIMENTATION AND CHEMICAL QUALITY OF SURFACEWATER IN THE WIND RIVER BASIN, WYOMING. U.S. Geol.Survey Water-Supply Paper 1373, 336 pp. 1956.
2 ANDERSON, H. W. SUSPENDED SEDIMENT DISCHARGEAS RELATED TO STREAM FLOW, TOPOGRAPHY, SOIL, AND LANDUSE. Amer. Geophys. Union Trans. 35(2) : 268-281.1954.
0 1 4 1/2 3 4
FOEND
zcmt ROADS
- STREAMS
SYMPOSIUM 1.—LAND EROSION AND CONTROL 57
son and Richards 3 found that, once logging wascompleted and the area began to recover, meansediment concentration during high streamflowdecreased markedly. During the second andthird years after logging, it decreased to abouthalf what it had been the previous year.
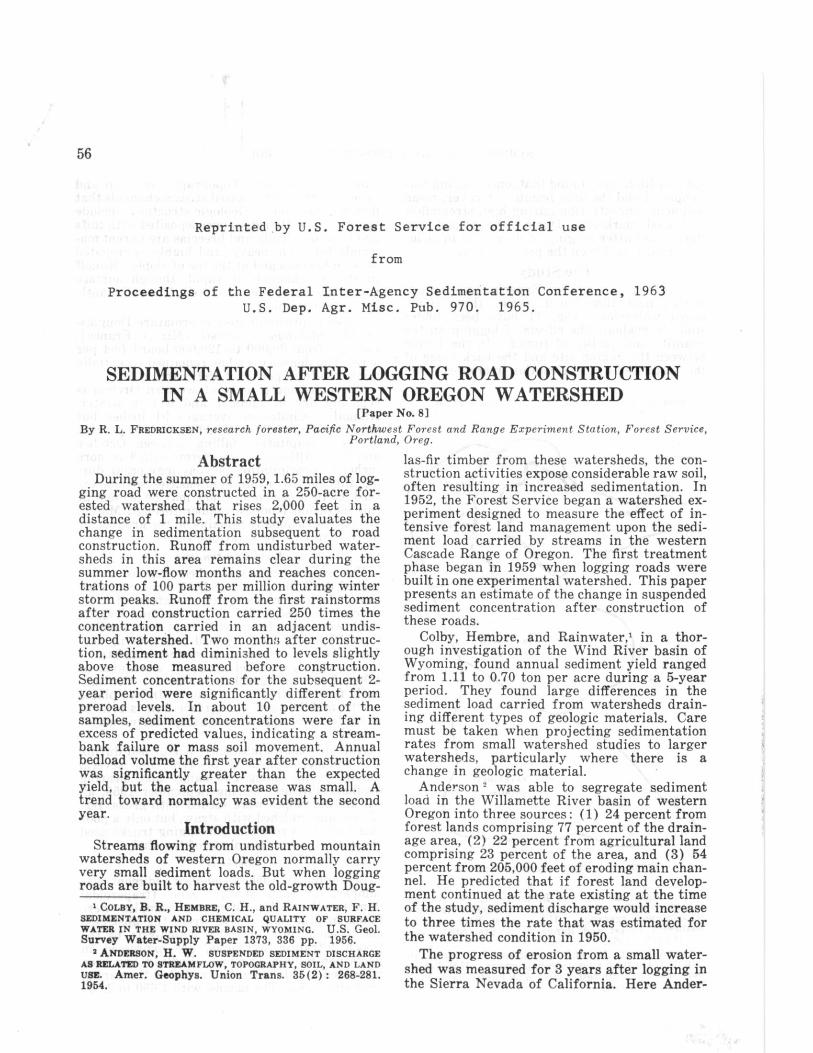
The StudyOn the H. J. Andrews Experimental Forest,
located near Blue River, Oreg., three small,gaged watersheds (fig. 1) have been understudy to evaluate the effects of logging on thequantity and quality of runoff.' In the 1 milebetween the gaging site and the back ridge ofthe watersheds, the elevation increases from
SC•LE IN MILES
FIGURE 1. — Experimental watersheds.
3 ANDERSON, H. W., and RICHARDS, L. G. FOURTHPROGRESS REPORT, 1960 -61, CALIFORNIA COOPERATIVE SNOWMANAGEMENT RESEARCH. U.S. Forest Serv., PacificSouthwest Forest and Range Expt. Sta. Study 112,pp. 154-155. 1961.
4 BERNSTEN, C. M., and ROTHACHER, J. A GUIDE TOTHE H. J. ANDREWS EXPERIMENTAL FOREST. U.S. ForestServ. Pacific Northwest Forest and Range Expt. Sta.,21 pp., illus. 1959.
1,500 to 3,000 feet. Topography is steep andbroken with deeply incised stream channels thatflow northwesterly. Geologic structures includebasaltic-andesite ridges overdeposited with tuffsand breccias. Tuffs and breccias are parent ma-terials for deep, heavy, and highly aggregatedsoils on benches and at the toe of slopes. Runoffin stream channels is rapid, though surfacerunoff has never been observed. The soil mantleis very permeable.
Cover is predominately overmature Douglas-fir [Pseudotsuga menziesii (Mirb.) Franco] ,varying from 20,000 to 120,000 board feet peracre. The dense cover has remained essentiallyunbroken for a period of 450 years.
The maritime climate of western Oregon istypically dry in summer and wet in winter.Annual precipitation averages 91 inches butmay vary from 56 to 114 inches, with 95 percentof the precipitation falling between Octoberand May. Although large storms with 3 or moreinches of precipitation per day may occur dur-ing this period, rainfall intensities seldom ex-ceed 0.3 inch per hour. Snow may be present atthis elevation from November through March,but only occasionally remains on the ground formore than two weeks at one time.
turbed until the spring of 1959 when construc-tion of logging roads began in watershed 3. ByOctober 1, 1.65 miles of all-weather loggingroad were completed with a 14-foot roadbedtopped by a 10-foot, crushed-rock driving sur-face. This transportation system consists ofthree roughly parallel roads at elevations of1,900, 2,400, and 2,800 feet. (fig. 1). Continu-ously flowing streams are crossed in two placesby the middle road. No surface flow is evidentat the lower or upper roads except during majorstorms.
Annual road maintenance, performed duringthe summer, consisted of removing severalminor slumps along cut banks and clearingdrainage ditches. During September 1959, allcut and fill slopes were seeded with grass, fer-tilized, and mulched with straw, but only a poorstand of grass resulted. No logging trucks usedthe roads during this phase of the study.
MethodsBeginning in 1955, suspended sediment was
sampled at each stream gage (trapezoidalflume) . Vertically integrated samples weretaken in pint milk bottles from the upstreamend of each flume. Results of analysis, by theGooch filtration technique, are expressed inparts per million (p.p.m.). Bedload has beenmeasured in catchment basins below the gagingsites since 1957. The basins, with 1,650 to 2,050
200
100
58 MISCELLANEOUS PUBLICATION 970, U.S. DEPARTMENT OF AGRICULTURE
square feet of surface area, have a low trap effi-ciency. Bedload volume was calculated annuallyfrom the mean rise in pond-bottom elevation,measured on intersections of a 3-foot grid.
ResultsAnnual Sediment Distribution From
Undisturbed WatershedsDistribution of annual sediment concentra-
tions measured in the experimental watershedsfollows a pronounced cyclic pattern. Sedimentconcentration of samples plotted in figure 2show considerable variation caused by majorstorms and the short 6-year period of record.But the figure shows clearly that sediment con-centrations are small during low runoff sum-mer months and rise in autumn to a peak dur-ing high runoff in winter months. Sedimentseldom rose above 100 p.p.m. from these undis-turbed watersheds, though greater concentra-tions have been measured. Localized failuresof streambanks during storm peaks probablyaccount for the short-lived surges to slightlyover 200 p.p.m.
FIGURE 2. — Annual distribution of suspended sedimentsamples and monthly runoff from undisturbed water-sheds, 1957-62.
Changes in Suspended SedimentAfter Road Construction
A drastic change in sedimentation was ap-parent immediately following road construction.
5 GUY, H. P. EFFECTS OF URBANIZATION ON THE SUP-PLY OF FLUVIAL SEDIMENT. U.S. Geol. Survey Res. Prof.Paper 424-A, p. 85. 1961.
Samples were considered paired if both were col-lected within a 1-hour interval.
The increase, measured when the rainy seasonbegan in autumn of 1959, compares with resultsreported by Guy ' during the construction phaseof urban development.
Sediment loads, when streams were near peakflows, are shown as ratios (watershed 3 towatershed 1) in figure 3. Before road construc-tion, peak sediment loads in watershed 3 were2.3 times those in watershed 1. During the firststorm of September 21, 1959, when roads werenearing completion, sediment reached a maxi-mum concentration of 1,780 p.p.m., 250 timesthe concentration in watershed 1. Two monthslater, the initial effect of road construction hadapparently passed. By November 23, 1959, sedi-ment concentrations in watershed 3 subsided tolevels slightly above those measured before con-struction and remained at about these levels forthe following 2 years.
11
II
III\I \I1
\I
1958 1959 ag 1960 1961
BEFORE ROAD CONSTRUCTION AFTER ROAD CONSTRUCTION
14,
FIGURE 3. — Relative suspended sediment loads nearpeak flows : Watersheds 1 and 3, before and afterroad construction.
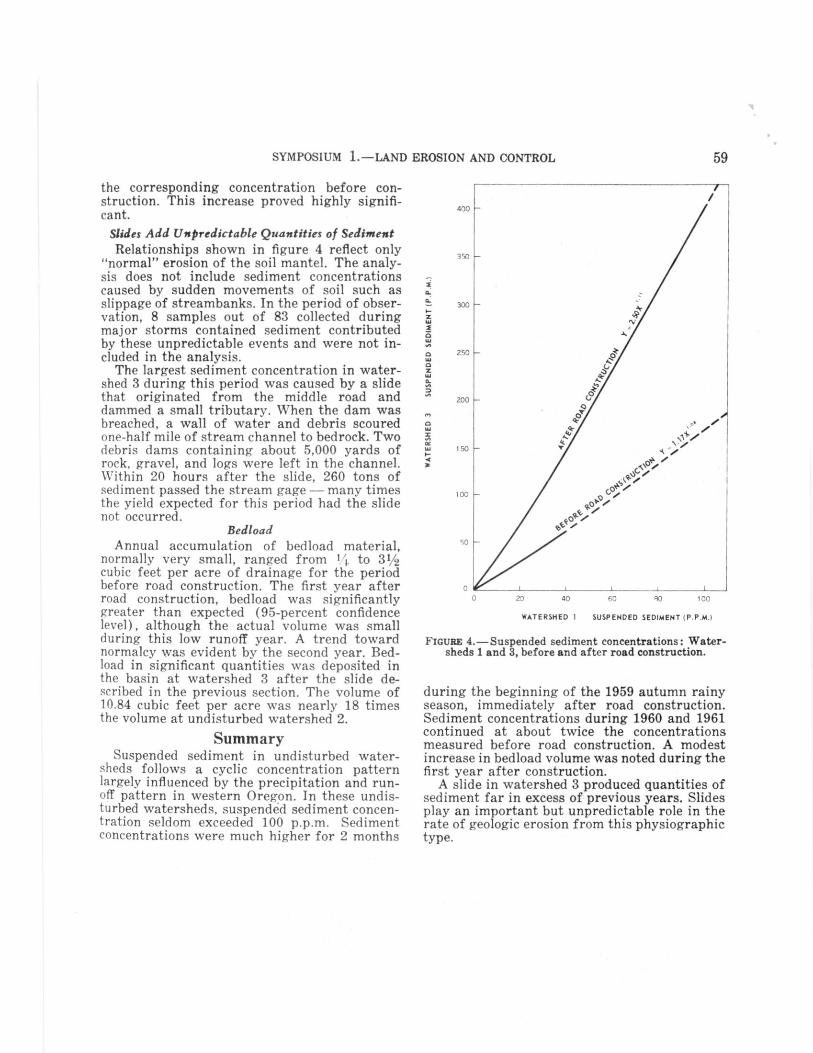
Data for this 2-year period after road con-struction were analyzed to determine their rela-tion to data collected before construction. Tworegressions of paired samples 6 from watersheds1 and 3 were calculated and are comparedgraphically in figure 4. Sediment concentrationsin watershed 3 were slightly more than twice
II
0 20 40 60 100
400
350
300
ti
250
200
4- n. /
4- ,N /
A. •■\ r-/150
k •■„.•1r A4/04 /
\NC/
100 0/C.C)/
9-S) //
50
U
SYMPOSIUM 1. — LAND EROSION AND CONTROL
59
the corresponding concentration before con-struction. This increase proved highly signifi-cant.
Slides Add Unpredictable Quantities of SedimentRelationships shown in figure 4 reflect only
"normal" erosion of the soil mantel. The analy-sis does not include sediment concentrationscaused by sudden movements of soil such asslippage of streambanks. In the period of obser-vation, 8 samples out of 83 collected duringmajor storms contained sediment contributedby these unpredictable events and were not in-cluded in the analysis.
The largest sediment concentration in water-shed 3 during this period was caused by a slidethat originated from the middle road anddammed a small tributary. When the dam wasbreached, a wall of water and debris scouredone-half mile of stream channel to bedrock. Twodebris dams containing about 5,000 yards ofrock, gravel, and logs were left in the channel.Within 20 hours after the slide, 260 tons ofsediment passed the stream gage — many timesthe yield expected for this period had the slidenot occurred.
BedloadAnnual accumulation of bedload material,
normally very small, ranged from to 31/2cubic feet per acre of drainage for the periodbefore road construction. The first year afterroad construction, bedload was significantlygreater than expected (95-percent confidencelevel), although the actual volume was smallduring this low runoff year. A trend towardnormalcy was evident by the second year. Bed-load in significant quantities was deposited inthe basin at watershed 3 after the slide de-scribed in the previous section. The volume of10.84 cubic feet per acre was nearly 18 timesthe volume at undisturbed watershed 2.
SummarySuspended sediment in undisturbed water-
sheds follows a cyclic concentration patternlargely influenced by the precipitation and run-off pattern in western Oregon. In these undis-turbed watersheds, suspended sediment concen-tration seldom exceeded 100 p.p.m. Sedimentconcentrations were much higher for 2 months
WATERSHED 1 SUSPENDED SEDIMENT (P.P.M.1
FIGURE 4.— Suspended sediment concentrations : Water-sheds 1 and 3, before and after road construction.
during the beginning of the 1959 autumn rainyseason, immediately after road construction.Sediment concentrations during 1960 and 1961continued at about twice the concentrationsmeasured before road construction. A modestincrease in bedload volume was noted during thefirst year after construction.
A slide in watershed 3 produced quantities ofsediment far in excess of previous years. Slidesplay an important but unpredictable role in therate of geologic erosion from this physiographictype.