From Reunification to Economic Integration: Productivity and the Labor Market in Eastern Germany IT IS DIFFICULT TO FIND A MORE dramatic episode of economic disloca- tion in peacetime during the twentieth century than that associated with the reunification of Germany. It is a sad irony of history that the plucky East Germans who toppled the dictatorship of the proletariat in the bloodless revolution of 1989 were rewarded with an economic bloodletting on such a vast scale. From 1989 to 1992, GDP in the former German Democratic Republic declined by roughly 30 percent, value added in industry by more than 60 percent, and employment by 35 percent. During the same period, unemployment rose from officially zero to more than 15 percent. That figure, moreover, is based on registered unemployment only; joblessness 1 MICHAEL C. BURDA Humboldt-Universität zu Berlin JENNIFER HUNT University of Montreal For excellent research assistance we thank Silke Anger, Almut Balleer, Anja Schneider, and Nils Schulze-Halberg, as well as Bianca Brandenburg, Anja Heinze, and Tom Krüger. We received helpful comments from Patricia Anderson, Antonio Ciccone, Helmut Seitz, Harald Uhlig, Holger Wolf, Janet Yellen, and participants at the Brookings Papers confer- ence. We received valuable data from Martin Rosenfeld, Rupert Kawka, Harald Kroll, and Udo Ludwig (all at the Institut für Wirtschaftsforschung, Halle), from Bernd Seidel, Dieter Vesper, and Erika Schulz (all at the Deutsches Institut für Wirtschaftsforschung), from Steffen Maretzke (Bundesamt für Bauwesen und Raumordnung), from the state statistical offices of Saxony and Mecklenburg-Vorpommern, from the Federal Statistical Office (Sta- tistisches Bundesamt), and from Irwin Collier. This research was supported by the Deutsche Forschungsgemeinschaft (Project BU 921/1-1, “Transfers im Gefolge der deutschen Wiedervereinigung”; Sonderforschungsbereich 373, Quantifikation und Simulation wirtschaftlicher Prozesse) and was performed while Jennifer Hunt was at Yale University.
Transcript
From Reunification to Economic Integration: Productivity and the Labor Market in Eastern Germany
IT IS DIFFICULT TO FIND A MORE dramatic episode of economic disloca-tion in peacetime during the twentieth century than that associated with thereunification of Germany. It is a sad irony of history that the plucky EastGermans who toppled the dictatorship of the proletariat in the bloodlessrevolution of 1989 were rewarded with an economic bloodletting on sucha vast scale. From 1989 to 1992, GDP in the former German DemocraticRepublic declined by roughly 30 percent, value added in industry by morethan 60 percent, and employment by 35 percent. During the same period,unemployment rose from officially zero to more than 15 percent. Thatfigure, moreover, is based on registered unemployment only; joblessness
1
M I C H A E L C . B U R D AHumboldt-Universität zu Berlin
J E N N I F E R H U N TUniversity of Montreal
For excellent research assistance we thank Silke Anger, Almut Balleer, Anja Schneider,and Nils Schulze-Halberg, as well as Bianca Brandenburg, Anja Heinze, and Tom Krüger.We received helpful comments from Patricia Anderson, Antonio Ciccone, Helmut Seitz,Harald Uhlig, Holger Wolf, Janet Yellen, and participants at the Brookings Papers confer-ence. We received valuable data from Martin Rosenfeld, Rupert Kawka, Harald Kroll, andUdo Ludwig (all at the Institut für Wirtschaftsforschung, Halle), from Bernd Seidel, DieterVesper, and Erika Schulz (all at the Deutsches Institut für Wirtschaftsforschung), fromSteffen Maretzke (Bundesamt für Bauwesen und Raumordnung), from the state statisticaloffices of Saxony and Mecklenburg-Vorpommern, from the Federal Statistical Office (Sta-tistisches Bundesamt), and from Irwin Collier. This research was supported by the DeutscheForschungsgemeinschaft (Project BU 921/1-1, “Transfers im Gefolge der deutschenWiedervereinigung”; Sonderforschungsbereich 373, Quantifikation und Simulationwirtschaftlicher Prozesse) and was performed while Jennifer Hunt was at Yale University.
0332-02-Burda 1/3/02 15:29 Page 1
rose to 33 percent if hidden unemployment (early retirement, involuntarypart-time work, makework, training schemes for the unemployed, and soon) is included.
Ten years after East Germany came in from the cold, the success ofthe transition from socialism cannot easily be summarized. By 2000, GDPper capita in the eastern states (Länder) of the reunited Germany includingBerlin had risen to 65.3 percent of that in the western states (if Berlin isexcluded, the figure is 60.6 percent). That is an impressive accomplish-ment by the yardstick of economists’ more pessimistic forecasts a decadeago. Thanks to generous transfers from the west, consumption per capitahas converged even more. Miriam Beblo, Irwin Collier, and ThomasKnaus report that 81 percent of easterners have seen their incomes riseduring the transition.1 However, convergence in productivity has slowedsharply, implying the need for continuing transfers, and the labor markethas yet to recover from the initial shock. Even the unemployment rate can-not easily be summarized, since, again, it depends on whether people inmakework and training programs are included. The eastern unemploymentrate based on registered unemployed was 18.8 percent in 2000, more thantwice the rate in the west; it was 27 percent in 1997 if hidden unemploy-ment is included. Measures based on survey data, taking search and avail-ability into account, show that the unemployment rate averaged 13 percentfrom 1994 to 1999. The employed share of the eastern working-age pop-ulation (those aged eighteen to sixty-five) declined from 83 percent in1990 to 65.2 percent in 1999, compared with a steady 73 percent in thewest over the same period.
German reunification is paradigmatic of the economic integration ofany two neighboring regions at different levels of economic development.The mixed success of the transition shows the difficulty of developmenteven under the most auspicious circumstances. The former East Germanywas immediately able to import sound institutions, including political,legal, monetary, banking, and industrial relations systems, from its moredeveloped partner. At a minimum, these have enabled eastern Germany toavoid the anarchic equilibrium in which Russia finds itself today. Further-more, eastern Germany has benefited from the largesse, labor market, andexpertise of a rich neighbor sharing a culture and language. Its experi-ence serves as a crucible for understanding the ramifications of other,
2 Brookings Papers on Economic Activity, 2:2001
1. Beblo, Collier, and Knaus (2001).
0332-02-Burda 1/3/02 15:29 Page 2
larger-scale regional integration projects. The milestone achievement ofGerman monetary, economic, and social union now stands as a benchmark(and perhaps as a foil) not only for the economic integration of the rest ofcentral and eastern Europe with the European Union, but also for theimmediate consequences of European Monetary Union.
Although the eastern German transition has attracted the continuousattention of economists, the issues have changed. The one-for-one con-version of East German ostmarks for deutsche marks, the privatization andrestructuring of state enterprises, and the striking initial jump in real wagesare no longer matters of policy debate, although they may have left theirmark on the economy. We take the position that the ultimate measure ofthe economic success of German reunification is no longer the introduc-tion of a market economy, but rather the attainment of an efficient pro-duction pattern made possible by the union of the two regions. This mustbe accomplished by growth in eastern GDP per capita, which is by defini-tion the sum of growth in labor productivity and the employment rate.For this reason, the analysis of this paper focuses on two issues: the firstis the dramatic slowdown in productivity growth in eastern Germany sincethe early 1990s, and the second is the dysfunctional nature of its labormarket—why unemployment, or more precisely the underutilization oflabor, is so high.
Our original analysis has three core components. We construct mea-sures of capital stocks in each of the eastern German states and proceedto estimate total factor productivity (TFP) in both eastern and westernstates. We then use microeconometric evidence to assess the sources ofpoor employment and unemployment performance in the east. Finally,we assess the mobility of labor in an empirical study of migration pat-terns in unified Germany.
These components fit into our two-pronged inquiry as follows. We iden-tify TFP, rather than the quantity or the quality of inputs, as the key tounderstanding the slowdown in convergence in output per worker. Fromavailable microdata we observe that the east-west productivity gap is nowconstant across skill levels, leading us to speculate that poor infrastruc-ture and lack of business skills in the east, rather than lack of capital,explain the gap. We then seek the inefficiencies behind the low employ-ment rate, which is associated with a smaller capital stock and lower out-put than would be consistent with full convergence. The wage structureis surprisingly similar in east and west, suggesting that the breakdown
Michael C. Burda and Jennifer Hunt 3
0332-02-Burda 1/3/02 15:29 Page 3
in the industrial relations system adopted upon reunification is allowingmore flexibility in the labor market. We believe, however, that wages in theeast are still too high. Our analysis of migration flows within Germanysuggests that high wages have kept easterners at home, despite the relatedrise in unemployment. We conclude with policy recommendations.2
German Reunification a Decade Later
The Berlin Wall was irrevocably breached on November 9, 1989.3 InMarch 1990 the first free elections in East Germany since 1932 broughtto power a conservative, market-friendly government allied with then-Chancellor Helmut Kohl. The election of a government favoring rapidreunification reduced uncertainty about the future, and the economic,social, and monetary union of July 1, 1990, ushered in the key economicchanges. The decision to exchange ostmarks for deutsche marks at a rateof one for one was a source of controversy. Political unification occurredon October 3, 1990, bringing the eastern states of Berlin, Brandenburg,Mecklenburg–Western Pomerania, Saxony, Saxony-Anhalt, and Thuringiainto the Federal Republic of Germany.4
Already by the spring of 1990 it had become evident that the East Ger-man economy was in shambles, belying even the most pessimistic esti-
4 Brookings Papers on Economic Activity, 2:2001
2. Statistics in this introduction are from the Deutsches Institut für Wirtschafts-forschung, or DIW (Vierteljährliche Volkswirtschaftliche Gesamtrechnung des DIW, variousyears) and are somewhat more conservative than those reported by the Federal StatisticalOffice (Statistisches Bundesamt). The employment and unemployment statistics are fromthe Federal Employment Office (Bundesanstalt für Arbeit) and the Sachverständigenrat zurBegutachtung der gesamtwirtschaftlichen Entwicklung. The unemployment numbers basedon International Labour Organisation concepts come from the German Socio-EconomicPanel (GSOEP), described later in the paper.
3. As the facts related here are now a matter of economic history, we refer the reader tothe now-classic “zero hour” analyses for more details: Akerlof and others (1991), Sinn andSinn (1991), Collier and Siebert (1991), and Siebert (1992).
4. We include Berlin as an eastern state because reunification has stripped this metrop-olis, with a population roughly three times that of the next largest German city, of the pri-macy that usually characterizes large metropolitan areas in advanced economies. WhereasHamburg, western Germany’s largest city, boasted a GDP per capita of 170 percent of thenational average in 2000, Berlin’s was only 91 percent.
0332-02-Burda 1/3/02 15:29 Page 4
mates of the Central Intelligence Agency and other U.S. intelligencesources. Economic and monetary union meant instant trade integration:not only could curious easterners visit the west, but they could buy goodsfrom enterprising western German traders. Domestic demand and foreigndemand from other former communist countries slumped. Industrial pro-duction in the east fell by two-thirds within eighteen months of the Wall’sopening,5 even though much unprofitable production was propped up bya combination of subsidies to involuntary part-time employment and tomoney-losing enterprises. Unemployment rose quickly. Those who kepttheir jobs benefited from rapid wage increases bargained by the westernGerman labor unions. Others obtained large wage increases simply bymoving to the west: more than 1 million people (6 percent of the easternpopulation) did so in the period 1989–91.
The collapse of the labor market was cushioned by the introduction ofthe western social welfare system and by active labor market programs(training programs and the like). The 18-percentage-point difference, citedin the introduction, between the unemployment rate and the underem-ployment rate in 1992 shows the initial impact of these measures.6 Stateenterprises meanwhile were taken over by the Treuhandanstalt, a publictrust set up to manage, hold, and ultimately dispose of state property in theeast. Privatization was rapid by transition standards.7 The Treuhandanstalthad wound down officially by 1995 and been replaced by a much slimmerversion with a fatter name, the Bundesanstalt für vereinigungsbedingte Son-deraufgaben, whose primary task was to control and enforce the thousandsof contracts under which the assets of central planning had been privatized,as well as to sell off the last dregs of East German industry and real estate.
Table 1 summarizes three of the usual “headline” economic indica-tors—GDP growth, unemployment, and nonemployment—for easternGermany since reunification. From 1992 through 1994 eastern GDPgrowth was impressive, despite the loss of population. Its fascination formonetary economists notwithstanding, the currency conversion resultedmerely in a blip in the growth trend of broad money (M3), and subsequent
Michael C. Burda and Jennifer Hunt 5
5. Siebert (1992).6. As early retirees gradually entered the normal retirement programs, the difference
between the unemployment and underemployment rates fell to 7.5 percentage points in1998.
7. Roland (2000) argues that it was indeed too fast.
0332-02-Burda 1/3/02 15:29 Page 5
corrective action by the Bundesbank ensured that German reunificationwould go down in history as a nonmonetary event. Growth slowed after1994, however, and then fell below the western German level in 1997.The rise of the eastern unemployment rate based on registered unem-ployed to almost 20 percent has already been mentioned. The westernunemployment rate on the same measure peaked at 11 percent in 1997,but this rate is known to overstate unemployment, as is shown by thecolumn in table 1 reporting U.S. Bureau of Labor Statistics estimates ofwestern unemployment according to U.S. concepts (this series has sincebeen discontinued).8 The sharp rise in nonemployment in the east wasaccompanied by declining participation rates: from 1991 to 2000 laborforce participation for eastern males fell from 86 percent to 79.8 per-cent, and that for females from 77.2 percent to 72.2 percent (comparedwith overall constancy in the west).
6 Brookings Papers on Economic Activity, 2:2001
8. The western unemployment rate based on the GSOEP survey (not reported here) islower than the U.S. Bureau of Labor Statistics estimate by about 2 percentage points; thusthe eastern rate cited in the introduction may be similarly underestimated.
Table 1. Real GDP Growth, Unemployment, and Nonemployment in Eastern andWestern Germany, 1990–2000a
Sources: Deutsches Institut für Wirtschaftsforschung (DIW), German Federal Statistical Office, U.S. Bureau of Labor Statis-tics, and Sachverständigenrat zur Begutachtung der gesamtwirtschaftlichen Entwicklung.
a. Berlin is included with eastern Germany for GDP measures after 1990, but split into east and west for the unemploymentmeasures.
b. Measured at market prices (including subsidies and net interest) using the European System of National Accounts in 1995prices (after 1990) and the German national income and product accounts (for 1990).
c. Measured according to the U.S. Bureau of Labor Statistics’ concept of unemployment.d. Defined as 100 minus the employed share of the working-age population.
GDPb
Non-employmentd
0332-02-Burda 1/3/02 15:29 Page 6
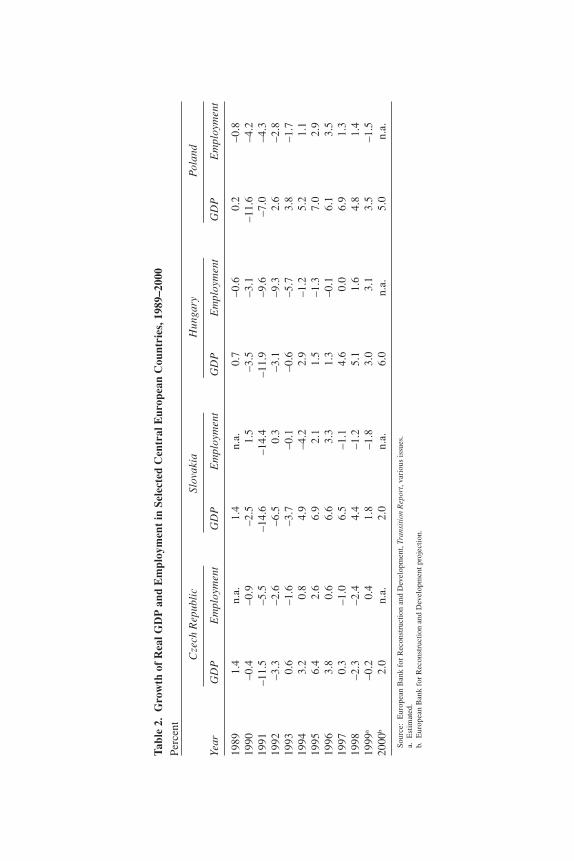
Table 2 indicates how Germany’s central European neighbors havefared on similar indicators. All the countries considered suffered a sharpinitial output fall, which Gérard Roland believes was precipitated by priceliberalization.9 But eastern Germany’s initial output fall and its employ-ment fall were both more severe than those of its neighbors.10
How Much Convergence Has Occurred?
The meteoric recovery of West Germany from the ashes of World WarII inspired many commentators to expect the same from the eastern statesafter 1990. An important difference, however, is that whereas the postwarWest German capital stock survived the war largely intact, post-Wall east-ern Germany had to start from scratch. Nevertheless, many saw the initialgrowth spurt, evident in table 1, as a harbinger of convergence within adecade.11 At the gloomier end of the spectrum, Robert Barro and XavierSala-i-Martin invoked the prediction of the Solow growth model aroundthe steady state, as well as empirical observation of the United States,Europe, and Japan, to argue that GDP growth closes at most only 2 percenta year of any gap in GDP per capita over long periods, conditioning onthe usual variables.12 This implied that convergence would require two ormore generations.
CONVERGENCE IN CONSUMPTION. One of the most important measuresof the success of transition must be living standards, proxied in the data byaggregate consumption expenditure in the national income accounts.Unfortunately, the Federal Statistical Office stopped reporting disaggre-gated expenditure by region after 1995, in a move that appears politically
Michael C. Burda and Jennifer Hunt 7
9. Roland (2000).10. The Czech experience is informative because of the real economic similarities with
the former East Germany at the outset of the transformation (Burda, 1991). Even beforethe “velvet divorce” of the Czech and Slovak Republics in 1991, the Czechoslovak currency(the koruna) had been devalued sharply; its fall was celebrated at the time as a cleverdemand management strategy. But although a cheap koruna helped exporters and keptunemployment low for some time, it also led firms to postpone restructuring and contributedto a sharp deterioration in banks’ loan portfolios, culminating in a crisis in 1996–97.
11. See the extensive discussion in Giersch, Paqué, and Schmieding (1992) and Dorn-busch and Wolf (1992).
12. Robert Barro, “Eastern Germany’s Long Haul,” Wall Street Journal, May 3, 1991,p. A10, and “Why Eastern Germany Still Lags,” Wall Street Journal, June 11, 1998, p.A22; see also Barro and Sala-i-Martin (1991, 1992, 1995).
0332-02-Burda 1/3/02 15:29 Page 7
Tab
le 2
.G
row
th o
f R
eal G
DP
and
Em
ploy
men
t in
Sel
ecte
d C
entr
al E
urop
ean
Cou
ntri
es, 1
989–
2000
Per
cent
Cze
ch R
epub
lic
Slov
akia
Hun
gary
Pola
nd
Year
GD
PE
mpl
oym
ent
GD
PE
mpl
oym
ent
GD
PE
mpl
oym
ent
GD
PE
mpl
oym
ent
1989
1.4
n.a.
1.4
n.a.
0.7
–0.6
0.2
–0.8
1990
–0.4
–0.9
–2.5
1.5
–3.5
–3.1
–11.
6–4
.219
91–1
1.5
–5.5
–14.
6–1
4.4
–11.
9–9
.6–7
.0–4
.319
92–3
.3–2
.6–6
.50.
3–3
.1–9
.32.
6–2
.819
930.
6–1
.6–3
.7–0
.1–0
.6–5
.73.
8–1
.719
943.
20.
84.
9–4
.22.
9–1
.25.
21.
119
956.
42.
66.
92.
11.
5–1
.37.
02.
919
963.
80.
66.
63.
31.
3–0
.16.
13.
519
970.
3–1
.06.
5–1
.14.
60.
06.
91.
319
98–2
.3–2
.44.
4–1
.25.
11.
64.
81.
419
99a
–0.2
0.4
1.8
–1.8
3.0
3.1
3.5
–1.5
2000
b2.
0n.
a.2.
0n.
a.6.
0n.
a.5.
0n.
a.
Sou
rce:
Eur
opea
n B
ank
for
Rec
onst
ruct
ion
and
Dev
elop
men
t, Tr
ansi
tion
Rep
ort,
vari
ous
issu
es.
a.E
stim
ated
.b.
Eur
opea
n B
ank
for
Rec
onst
ruct
ion
and
Dev
elop
men
t pro
ject
ion.
0332-02-Burda 1/3/02 15:29 Page 8
motivated; the only data available since then are indirect estimates gener-ated by research institutes and state statistical offices. The first column oftable 3 reports some estimates by Ulrich Blum and Simone Scharfe anddocuments the great strides that have been made, especially when the ini-tial conditions are considered.13 On top of that, infrastructure in easternGermany was modernized to the tune of more than DM 140 billion dur-ing 1992–98; this amounted to a third of all infrastructure spending in allof Germany over that period, raising it to western German levels in manyconsumption-related categories.14 Table 4 documents the same point atthe microeconomic level, also showing the striking similarities in house-hold behavior in the two regions after an initial adjustment period.15
CONVERGENCE IN WAGES. A highly visible consequence of the integra-tion of the two Germanys’ labor markets was an unprecedented rise in bothnominal and real wages in the east. The second column of table 3 givesdetails for the period 1991–2000 for gross weekly nominal wages. At thetime of monetary union, earnings in East Germany were about a third ofthose in West Germany, given the one-for-one exchange rate, havingalready risen by severalfold in ostmark terms up to June 1990.16 By 1996eastern wages had reached three-quarters of western levels. (Since thenthey have not increased in relative terms and indeed have actually fallen abit since 1997.) This increase was not observed in any of the other transi-tion economies, even in the Czech Republic, whose initial conditions werequite similar to those in East Germany.17
CONVERGENCE IN PRODUCTIVITY. The last two columns of table 3 doc-ument the development of productive economic activity, that is, the extentto which the eastern German region can generate value added at worldmarket prices. The first indicator, labor productivity, grew rapidly through-out the period from less than 45 percent of the western level in 1991 to73 percent in 2000. In many sectors and establishments, eastern Germanproductivity now exceeds that in the west, a result of having the newest
Michael C. Burda and Jennifer Hunt 9
13. Blum and Scharfe (2001). 14. See Vesper (2001). An excellent example is the telephone system, which before
1990 was characterized by rotary dialing, poor connections, unavailability of service, andunwanted third-party crosstalk. Today, in contrast, eastern Germany’s ISDN and fiber opticnetworks are the envy of most of Europe.
15. This finding has been recently confirmed with detailed expenditure data by Grunert(2000).
16. See Sinn and Sinn (1991, p. 147) and the references cited therein. 17. Burda (1991).
0332-02-Burda 1/3/02 15:29 Page 9
10 Brookings Papers on Economic Activity, 2:2001
Table 3. Measures of Eastern German Convergence, 1991–2000Percent of corresponding western German measure
Consumption Gross weekly Labor GDP Year per capitaa nominal wageb productivityc per capitad
Sources: Blum and Scharfe (2001), German Federal Statistical Office, and Arbeitskreis Volkswirtschaftliche Gesamtrechnun-gen der Länder (AKVGRL, 2001).
a. Uses average of successive year-end population values. Berlin is included with western Germany.b. East Berlin is included with eastern Germany and West Berlin with western Germany.c. Total value added at 1995 prices per employed person. Berlin is included with eastern Germany.d. Total value added at 1995 prices per person. Berlin is included with eastern Germany.
Table 4. Household Ownership of Selected Consumer Goods in Eastern and WesternGermany, 1991 and 1998a
Source: Institut der Deutschen Wirtschaft (2000).a. East Berlin is included with eastern Germany and West Berlin with western Germany.b. Four-person middle-income households.
0332-02-Burda 1/3/02 15:29 Page 10
investment and infrastructure available, as will be discussed below. Onthe other hand, a large part of the increase in productivity simply reflectsfirms discharging less productive labor and moving up along the marginalproduct of labor schedule.18 The wide disparity in productivity perfor-mance in the first years after reunification (documented by Burda andMichael Funke19) suggests that firms were far from their efficient produc-tion frontiers and could achieve some efficiency gain without layoffs. Still,employment reductions as high as 80 to 90 percent at some firms show thatlabor-intensive production was not in the cards. These unemployed, mostof them entitled to generous social benefits, are a major source of mas-sive financial transfers from west to east. As long as there are many unem-ployed in eastern Germany, the transfer problem and the problem oflagging GDP per capita will continue to haunt the region. The last col-umn of table 3 shows that GDP per capita is below the levels implied bywages, labor productivity, and consumption.
The Cost of German Reunification
By any measure, German reunification has been an expensive propo-sition: over the period 1990–2000, total financial transfers from thewest—in the sense of a “current account deficit” of the east—exceededDM 1.5 trillion. The persistent failure of the east to produce enough tocarry its own weight means that transfers from the richer west have beenand remain necessary. Although such transfers were expected at the outset,their persistence has come as a surprise, raising the specter of easternGermany becoming a “problem region” like the Appalachians in theUnited States, Canada’s maritime provinces, or the Mezzogiorno in Italy.20
The annual net transfer burden remains about 775 billion a year, or about5 percent of German GDP. The lion’s share (about 40 to 45 percent) rep-resents social entitlements, which cannot be cut without fundamentallychanging the nature of the German social contract. These transfers resultdirectly from the inherent generosity of the German welfare state and were
Michael C. Burda and Jennifer Hunt 11
18. See Hunt (forthcoming) for a description of this phenomenon for low-wage femaleworkers in 1990–91.
19. Burda and Funke (1995).20. For an analysis of the Mezzogiorno issue, see Hughes-Hallet and Ma (1993).
0332-02-Burda 1/3/02 15:29 Page 11
triggered automatically by conditions following reunification.21 The risk offurther transfers and dependency still exists.22
It should be emphasized, however, that these transfers, both public andprivate, have not gone merely to support eastern German consumption.East Germany was a threadbare economy in 1989, using obsolete tech-nologies and machines that were past their productive prime. A numberof posthumous analyses have argued that its collapse was accelerated bymisguided investment policies starting in the 1970s.23 Early back-of-the-envelope calculations forecast a need of roughly $50 billion to $100 billiona year to rebuild the capital stock,24 and these estimates have beenvalidated.
Table 5 documents the remarkable extent to which eastern Germany hasaccumulated physical capital: since 1990, easterners have installed morethan half a trillion marks worth of equipment, and more than twice thatamount in structures. Taken together, this is roughly DM 100,000 for everyinhabitant of the region. It is thus incorrect to claim that the region’s mas-sive “current account deficits” since 1990 have been used solely to financeconsumption; in fact, the sum of the transfers roughly equals the cumula-tive investment undertaken. Like the collapse of production in 1989–92,the intense capital accumulation seen in eastern Germany finds few paral-lels in modern economic history.
This remarkable achievement is not without its blemishes, however.One salient fact revealed in the table is the lopsided pattern of investmentin structures in the east when compared with the west. This is mostly res-idential housing, but much of it consists of infrastructure and buildings thathouse productive activity.25
Convergence and Integration: A Framework for Analysis
In what follows we adopt a two-pronged approach to understandingthe stall in productivity per capita in the east. Since overall productivity
12 Brookings Papers on Economic Activity, 2:2001
21. Burda and Busch (forthcoming).22. In the summer of 2001 the federal and state governments agreed to a new revenue-
sharing plan, which would guarantee more than DM 300 billion in transfers to the easternstates from 2005 to 2020.
23. Wenzel (1992); Grosser (1998); Ludwig and Stäglin (1999).24. Burda (1990); Collins and Rodrik (1991); Siebert (1992).25. Sinn (1995, 2000) and Begg and Portes (2001), among others, have sharply criti-
cized the overly intensive subsidization of construction.
0332-02-Burda 1/3/02 15:29 Page 12
Tab
le 5
.In
vest
men
t E
xpen
ditu
re in
Eas
tern
and
Wes
tern
Ger
man
y, b
y St
ate,
199
1–98
a
Uni
ts a
s in
dica
ted
Ave
rage
ann
ual
Ave
rage
ann
ual
Cum
ulat
ive
inve
stm
ent
inve
stm
ent
inve
stm
ent p
er c
apit
a(b
illi
ons
of 1
995
(per
cent
of G
DP
)(1
995
deut
sche
mar
ks)
deut
sche
mar
ks)
Stat
eE
quip
men
tSt
ruct
ures
Equ
ipm
ent
Stru
ctur
esE
quip
men
tSt
ruct
ures
Eas
tern
sta
tes
13.2
28.3
3,56
27,
745
503.
61,
094.
4B
erli
n 8.
816
.03,
495
6,37
296
.217
5.4
Bra
nden
burg
14
.733
.93,
591
8,41
773
.317
2.0
Mec
klen
burg
–Wes
tern
Pom
eran
ia13
.940
.13,
333
9,61
848
.914
1.1
Sax
ony
15.3
30.2
3,72
97,
586
136.
427
7.2
Sax
ony-
Anh
alt
16.6
33.7
3,82
27,
900
84.6
174.
5T
huri
ngia
14.0
33.0
3,20
67,
707
64.2
154.
3M
emor
andu
m: G
DP,
all
eas
tern
sta
tes,
200
0 =
DM
544
.5 b
illi
on.
Wes
tern
sta
tes
9.3
12.4
4,06
35,
424
2,07
1.5
2,76
6.5
Bad
en-W
ürtt
embe
rg8.
912
.94,
064
5,86
533
3.5
481.
3B
avar
ia9.
315
.94,
289
7,28
240
8.2
693.
4B
rem
en8.
78.
24,
693
4,40
225
.523
.9H
ambu
rg
10.1
8.0
6,76
65,
460
93.6
74.4
Hes
se9.
011
.04,
446
5,39
421
2.4
257.
7L
ower
Sax
ony
10.2
13.3
3,87
65,
026
237.
130
7.9
Nor
th R
hine
–Wes
tpha
lia
9.1
10.1
3,80
24,
224
541.
660
2.1
Rhi
nela
nd-P
alat
inat
e9.
214
.43,
445
5,39
310
8.5
170.
0S
aarl
and
9.9
12.9
3,63
34,
762
32.5
42.4
Sch
lesw
ig-H
olst
ein
9.4
13.5
3,62
05,
215
78.6
113.
4M
emor
andu
m: G
DP,
all
wes
tern
sta
tes,
200
0 =
DM
3,1
20.7
bil
lion
.
Sou
rce:
Aut
hors
’cal
cula
tion
s ba
sed
on d
ata
from
Arb
eits
krei
s V
olks
wir
tsch
aftl
iche
Ges
amtr
echn
unge
n de
r L
ände
r (2
001)
.a.
All
num
bers
cor
resp
ond
to th
e E
urop
ean
Sys
tem
of
Nat
iona
l Acc
ount
s de
fini
tion
. GD
P is
val
ue a
dded
less
impu
ted
bank
pro
fit (
net i
nter
est)
and
sub
sidi
es.
0332-02-Burda 1/3/02 15:29 Page 13
is the product of labor productivity and the employment rate, the firstavenue is to investigate why labor productivity remains lower in the east,given the current functioning of the labor market. The second, equallyimportant avenue is to ask why the eastern German labor market fails toput people to work in the same way that its western counterpart does. Wethus seek inefficiencies in the labor market, that is, the causes of highunemployment.
At the same time, eastern Germany’s stalled productivity per capitamust be put into the context of the economic integration of the two regions.Economic integration can be defined as the achievement by two or moregeographic regions of the efficient production pattern made possible bytheir union, using world market prices for output and inputs as the appro-priate metric.26 Whether these regions are within Germany or acrossEurope, large gaps in GDP per capita (adjusting for purchasing power) orin factor prices are usually taken as evidence of incomplete integration.Integration may be achieved by any of five mechanisms or their combina-tion: internal accumulation of productive factors such as physical orhuman capital in the backward regions; labor mobility from capital-poor tocapital-rich regions (migration); capital mobility from capital-rich tocapital-poor regions (investment); Heckscher-Ohlin trade among regions,which in the absence of complete specialization implies the equalization offactor prices;27 and adoption of leading technologies by the backwardregions.
Our model of integration stresses the first three mechanisms.28 Figure 1depicts the outset of the integration process between a capital-rich westand a capital-poor east, whose union creates a single small, open econ-omy. For the moment, assume that both regions operate under the same
14 Brookings Papers on Economic Activity, 2:2001
26. See, for example, Eichengreen (1990). 27. Mundell (1957) stressed the equivalence, under certain conditions, of factor mobil-
ity and trade in achieving economic integration. If goods are produced with different factorintensities at common factor prices, and if regions have different relative factor allocations,a region’s exports will reflect those differences. In the case of Germany, the east could exportthose goods that are relatively less intensive in physical capital or relatively more intensivein human capital inputs. However, given the overall capital intensity of production meth-ods in Germany, the similarity of the two regions’ human capital endowments, and thehigh complementarity of human and physical capital, we think that any cone of specializa-tion is likely to be of second-order importance, so that the efficient allocation of capitaland labor can be adequately approximated by a diagonal.
28. The model is described in more detail in Burda (2001).
0332-02-Burda 1/3/02 15:29 Page 14
constant-returns production function F(K,L) using capital (K) and labor(L). The economy can borrow and lend freely for projects with positive netpresent value at the given world interest rate r; for simplicity, mobility oflabor from the rest of the world is set to zero. As a result, the steady stateof the economy in figure 1 lies along the common capital-labor ratio givenby the slope of the factor price frontier of the economy at the world inter-est rate. Integration is represented by various adjustment paths to thisdiagonal. Path A represents an adjustment process in which capital rapidlylocates in the east, but labor moves from east to west slowly; the result-ing total size of the eastern economy is not much affected by the integra-tion process. Since the west is assumed to operate at its steady-statecapital-labor ratio from the outset, this is equivalent to bringing capitalfrom abroad. In path B, in contrast, labor moves rapidly from east to west,but capital moves sluggishly to the east and instead locates mostly in thewest. Along path C, so little investment occurs in the east that the net
Michael C. Burda and Jennifer Hunt 15
Figure 1. Possible Integration Paths When Both Regions Have a Common Production Function
Source: Authors’ model as described in the text.
kEK E
West
East
LE
Initial capital gapA
B
C
LW
K W
kW: FK = r
0332-02-Burda 1/3/02 15:29 Page 15
accumulation of capital there is negative, leading to what some havecalled the “national park” phenomenon as the east largely empties out.
The assumption of constant returns suggests that there is no unique rest-ing point of the economy; with identical production technologies, anypoint along the diagonal represents a potential steady state, with no lossof productivity per capita, since both regions are producing at the samecapital-labor ratio.29 The normative guidelines for selecting the appropri-ate point in the case of Germany are beyond the scope of this paper;instead, in the rest of this paper we seek simply to examine how TFP,capital accumulation, and labor mobility have characterized Germanintegration.
Assessing Labor Productivity
Convergence in productivity—one of the key open questions in macro-economics—remains the central policy question for eastern Germany’seconomic convergence. In their seminal paper, George Akerlof and hiscoauthors showed convincingly that productivity in East Germany wasmuch lower than in West Germany when the borders were opened.30 Evenafter a decade of economic integration and remarkable strides, productiv-ity remains lower in the east, as table 3 documented. Yet an analysis bysector reveals that the story is not clear-cut. Table 6 examines sectoralgrowth in labor productivity over the past decade.31 Not only has devel-opment been uneven across sectors; it has not been monotonic within allsectors as well. Most striking is the contrast between the gradual rise in theaggregate (a pattern matched in most service sectors) and the patternsobserved in agriculture, manufacturing, and construction. Labor produc-tivity in agriculture (including forestry and fishing) quickly reached par-ity with the west; in manufacturing it has risen slowly since 1995, aftersharp initial increases; and in construction it rose sharply at first but hasdeclined since 1996 by 13 to 14 percentage points. The last result mirrors
16 Brookings Papers on Economic Activity, 2:2001
29. In the event that TFP is permanently higher in one region, the national park outcomewill be inevitable, unless subsidies are employed to increase the lower factor returns in thelow-TFP region.
30. Akerlof and others (1991).31. This issue has also been examined in detail by Klodt (2000). The elimination of subsi-
dies to western German–based hard coal mining causes the jump in table 6 from 1995 to 1996.
0332-02-Burda 1/3/02 15:29 Page 16
Tab
le 6
.E
aste
rn G
erm
an L
abor
Pro
duct
ivit
y, b
y Se
ctor
, 199
1–20
00a
Per
cent
of
wes
tern
Ger
man
leve
l
Sect
or19
9119
9219
9319
9419
9519
9619
9719
9819
9920
00
All
sec
tors
34
.648
.359
.564
.365
.167
.167
.767
.367
.568
.5A
gric
ultu
re, f
ores
try,
and
fish
ing
42.6
59.7
97.6
88.0
82.1
84.0
90.1
99.0
101.
010
2.6
Indu
stry
, exc
ludi
ng c
onst
ruct
ion
24.1
34.8
47.8
53.4
56.5
63.6
65.7
67.2
68.9
71.0
Min
ing
and
quar
ryin
g54
.459
.689
.199
.483
.818
6.2
183.
519
5.5
n.a.
n.a.
Man
ufac
turi
ng
18.0
27.9
39.1
46.3
49.8
54.4
58.2
60.5
62.5
64.9
Ene
rgy
and
wat
er
49.1
53.3
63.3
63.3
68.6
78.8
76.4
74.2
n.a.
n.a.
Con
stru
ctio
n 49
.462
.570
.279
.480
.082
.179
.772
.771
.168
.5T
rade
, res
taur
ants
and
hot
els,
tr
ansp
ort
43.1
57.0
65.9
69.0
66.7
67.5
66.9
67.0
67.1
66.6
Tra
de, r
epai
r w
ork,
res
taur
ants
an
d ho
tels
45.6
67.0
74.8
75.1
71.5
73.4
70.8
69.8
n.a.
n.a.
Tra
nspo
rt a
nd c
omm
unic
atio
ns36
.138
.547
.754
.453
.952
.855
.657
.9n.
a.n.
a.F
inan
ce, l
easi
ng, a
nd o
ther
bu
sine
ss s
ervi
ces
30.0
40.7
55.4
60.9
63.2
65.8
68.1
69.2
70.0
73.4
Ban
king
and
insu
ranc
e 73
.558
.160
.063
.067
.668
.370
.771
.1n.
a.n.
a.R
eal e
stat
e, le
asin
g an
d re
ntal
, bus
ines
s se
rvic
es
21.3
35.7
51.7
57.5
59.4
62.5
65.1
66.3
n.a.
n.a.
Pub
lic
and
priv
ate
serv
ices
54.3
67.9
76.1
80.0
81.3
82.1
82.9
81.5
81.2
83.1
Sou
rce:
Rag
nitz
(20
01).
a.N
omin
al v
alue
add
ed f
or e
ach
wor
ker.
Ber
lin
is in
clud
ed w
ith
wes
tern
Ger
man
y.
0332-02-Burda 1/3/02 15:29 Page 17
a drop in relative wages and a decline in employment in the constructionsector over the period. In short, the decade of the 1990s was not one of sta-ble catch-up.
In this section we attempt to explain labor productivity in Germanyfrom both a microeconometric and a macroeconomic perspective. In addi-tion to analyzing TFP in the German states, we study data from the Ger-man Socio-Economic Panel (GSOEP).32 The initial western sample wasdrawn in 1984, whereas the initial eastern sample was taken in June 1990,just before monetary union. We use the sample years 1990–99, primarilyas cross sections. The wage measure used is monthly earnings divided by4.33 times weekly hours. Unless otherwise specified, wages are deflatedwith separate consumer price indices for east and west and made compa-rable in purchasing power using results reported by Peter Krause.33 Thesamples of workers include those aged eighteen to fifty-four who are notself-employed, serving an apprenticeship, or employed in agriculture. Weexclude older workers since their employment rates are low because ofearly retirement.
Quantity of Inputs
PHYSICAL CAPITAL. From the perspective of a neoclassical, constant-returns technology, a gap in labor productivity can result from too littlephysical capital per unit of labor in the economy. This was certainly the sit-uation in 1990 in East Germany and elsewhere in central and easternEurope, when the downward revaluation of national capital stocks led toa radical upward revision of the time necessary for convergence.34
Any study of the role of private capital in productivity trends shouldfocus on investment expenditure on equipment (as opposed to structures).Equipment capital is known to be the key bottleneck for development,and high rates of investment in equipment are robustly associated withrapid economic growth.35 The importance of equipment investment is sup-ported by the fact that individual western German states evidence little orno time-series or cross-sectional variation of equipment capital–to–GDP
18 Brookings Papers on Economic Activity, 2:2001
32. These data are described in detail in Holst, Lillard, and DiPrete (2001).33. Krause (1994).34. See, for example, Collins and Rodrik (1991).35. DeLong and Summers (1991, 1992).
0332-02-Burda 1/3/02 15:29 Page 18
ratios over the past two decades, whereas the same ratio for structuresvaries widely across states. The capital-output ratio in the western states,computed using capital stocks estimated by the Federal Statistical Office at1991 prices, is roughly 0.9 to 1.0 and has been so for two decades.36
Low capital-output and capital-labor ratios for equipment imply thatrapid catch-up in capital intensity is technically feasible, especially if thereis a lot of outside help. To put things in perspective, table 5 showed thatcumulative investment in equipment in the period 1991–98 totaledDM 504 billion at 1995 prices; real GDP in the eastern states includingBerlin was DM 544 billion in 2000. Assuming an initial equipment stockof zero in the east and an annual depreciation rate of 7.5 percent, the stan-dard accumulation equation already implies a lower bound for the aggre-gate eastern capital-output ratio of 75 to 90 percent. The actual outcomeis more favorable, since some eastern equipment could in fact be used inmarket activities in 1990. Many eastern enterprises already worked withwestern capital goods, and foreign investment was already occurring in1990 and has continued since 1998.
To generate estimates of equipment capital that are comparable withthose of other analysts of the eastern German economy, we assume thatthe capital coefficient (capital-output ratio) in the east had reached thelower range of western levels by 1998 (for details see the appendix).37 Wefocus on the capital coefficient because both growth theory and empiri-cal observation say it should be stable along a stationary growth path.38
Our assumption does not imply that the capital-labor ratio is the same inboth east and west, nor does it imply that there is already enough capitalaround to bring eastern Germany up to western employment rates. It does,however, imply that one can expect only marginal productivity gains
Michael C. Burda and Jennifer Hunt 19
36. These data are based on estimates of capital stocks in the western states by theFederal Statistical Office on the basis of 1991 prices; this series was discontinued in 1998.Other reasons for placing less emphasis on structures include the extensive tax breaksgiven to construction of residential structures in the east.
37. Our estimates appear to be at least as good as those of other researchers. Our impliedestimate of the 1991 equipment capital stock in all of Germany, at 1995 prices, is DM 2.86trillion. The equivalent at 1991 prices is DM 2.51 trillion. Subtracting the estimate of theDIW at 1991 prices for infrastructural equipment capital yields DM 2.42 trillion, which isonly about 3 percent less than Müller’s (2001) estimate for the private equipment capitalstock (DM 2.50 trillion).
38. Barro and Sala-i-Martin (1995).
0332-02-Burda 1/3/02 15:29 Page 19
among those currently employed from increasing their endowment of pro-ductive equipment.39
HUMAN CAPITAL. Eastern workers might also be less productive becausethey possess less human capital. However, the means of the GSOEPworker samples reported in table 7 show that, in both 1990 and 1999,eastern workers were in fact more educated on average than western work-ers.40 Although a smaller share of easterners than of westerners havedegrees from tertiary institutions, a larger share have vocational degreesthat typically imply study beyond the usual dual-system apprenticeship,and the proportion with none of these degrees (those who have only “gen-eral schooling”) is much lower than in the west. The unweighted meansreflect oversampling of foreigners residing in the west, but the last obser-vation is true even if only German nationals in the west are considered.(Other variables are little affected by the oversampling.) Although it isnot possible to measure actual work experience for the eastern sample,the average for women in particular was much higher in the east in 1990,because female employment rates were higher under communism than inthe west. This is reflected in table 7 in the data on average tenure with thecurrent employer in 1990. Burda and Christoph Schmidt show more for-mally, using a Oaxaca decomposition, that average worker characteristicstended to favor the east in 1990.41
Total Factor Productivity
Eastern workers might also be less productive conditional on inputquantities: that is, TFP could be lower in the east. To assess this possibil-ity, we apply the standard Solow decomposition of output growth since1991 in both the west and the east, using our own estimates of the totalequipment capital stock for each state (the appendix provides details).42
20 Brookings Papers on Economic Activity, 2:2001
39. This judgment is shared by Klodt (2000), Ragnitz (2001, p. 182), and Ragnitz,Müller, and Wölfl (2001, pp. 71ff.), all of whom include structures in their capital stockmeasure.
40. This is confirmed by a number of other observers, including Scheuer (1990), Sinnand Sinn (1991), and Weiss (1991).
41. Burda and Schmidt (1997). In the east, average female tenure overtook average maletenure in the 1990s, probably because males are concentrated in construction and females inthe public sector. It is also possible that women include spells of maternity leave in theirreported tenure.
42. See Solow (1957), Denison (1967), and Jorgenson, Gollop, and Fraumeni (1987).
0332-02-Burda 1/3/02 15:29 Page 20
Tab
le 7
.C
hara
cter
isti
cs o
f E
aste
rn a
nd W
este
rn W
orke
rs, 1
990
and
1999
a
Per
cent
of
wor
kers
, exc
ept w
here
not
ed o
ther
wis
e
1990
1999
Eas
tern
Wes
tern
Eas
tern
Wes
tern
Wor
ker
char
acte
rist
icM
enW
omen
Men
Wom
enM
enW
omen
Men
Wom
en
Wag
e (l
ogar
ithm
s)2.
242.
073.
042.
742.
812.
783.
092.
83(0
.29)
(0.3
1)(0
.35)
(0.4
4)(0
.39)
(0.4
9)(0
.39)
(0.4
0)A
ge (
year
s)37
.237
.237
.736
.038
.938
.337
.437
.3(9
.8)
(9.5
)(1
0.0)
(10.
1)(8
.4)
(8.8
)(8
.6)
(9.0
)Te
nure
(m
onth
s)15
013
213
292
9510
412
096
(121
)(1
05)
(108
)(8
6)(9
5)(1
00)
(106
)(9
1)E
duca
tion
Gen
eral
sch
ooli
ng in
Ger
man
y3
611
193
411
14G
ener
al s
choo
ling
abr
oad
00
1212
00
77
Uni
vers
ity
139
127
1512
1612
App
rent
ices
hip
6460
4443
6452
4444
Voc
atio
nal t
rain
ing
2126
1517
1831
1820
Civ
il s
ervi
ce tr
aini
ng0
05
20.
40.
74
3Fo
reig
n na
tion
al0.
60.
331
250.
20.
221
17E
mpl
oyed
par
t tim
e1
231
291
222
33E
mpl
oyed
spo
radi
call
y0
00
20
21
6E
mpl
oyed
by
firm
wit
hF
ewer
than
20
empl
oyee
s9
1314
2431
2918
2920
to 1
99 e
mpl
oyee
s22
2925
2835
2927
2720
0 to
1,9
99 e
mpl
oyee
s36
3526
2717
2627
252,
000
or m
ore
empl
oyee
s34
2335
2118
1528
19Su
mm
ary
stat
isti
cN
o. o
f ob
serv
atio
ns99
21,
039
1,97
81,
261
528
564
1,65
91,
250
Sou
rce:
Aut
hors
’cal
cula
tion
s ba
sed
on d
ata
from
the
Ger
man
Soc
io-E
cono
mic
Pan
el.
a. D
ata
are
unw
eigh
ted
aver
ages
of
nonz
ero
obse
rvat
ions
. Sam
ple
incl
udes
wor
kers
age
d ei
ghte
en to
fift
y-fo
ur w
ho a
re n
ot a
ppre
ntic
es, s
elf-
empl
oyed
, or
empl
oyed
in a
gric
ultu
re. “
Eas
tern
” an
d “w
est-
ern”
ref
er t
o ea
ster
ners
wor
king
in
the
east
and
wes
tern
ers
in t
he w
est,
res
pect
ivel
y. E
ast
Ber
lin
is i
nclu
ded
wit
h ea
ster
n G
erm
any
and
Wes
t B
erli
n w
ith
wes
tern
Ger
man
y. S
tand
ard
devi
atio
ns a
rere
port
ed in
par
enth
eses
.
0332-02-Burda 1/3/02 15:29 Page 21
Table 8 presents summary statistics. In addition to the growth attributableto changes in output at constant prices, we report in the first columnchanges in the terms of trade (the price of each state or region’s outputrelative to the overall German GDP deflator). This addresses the possibil-ity that value added at constant prices neglects an important element ofconvergence, namely, that a region’s output may become more valuablerelative to that of other regions.43 Finally, we estimate TFP growth (theSolow residual) in each state and region.
The most salient finding is a dramatic slowdown in TFP growth in theeast in the latter half of the 1990s. This development is systematic, affect-ing all states in the same qualitative fashion (although Saxony-Anhalt, astate in which the capital-intensive chemical, machinery, and energy sec-tors are well represented, exhibits negative TFP growth for almost theentire period).44 The Solow decomposition also reveals that although over-all factor input growth in the east grew by only 2.4 percent a year overthe 1992–95 period, employment’s annual contribution fell by 1.8 percent,while that of capital rose by 4.2 percent. Not only was the eastern Ger-man isoquant shifting, but a massive move was taking place along that iso-quant in the western direction. It is also noteworthy that the west as awhole—and almost all of the individual western German states—remainedhardly affected during the postunification decade. The second half of theperiod saw a return to normal TFP growth in the west. Furthermore, therapid increase in the relative price of eastern output came to a sudden haltin the second half of the period.
The Solow decomposition for the eastern German economy since 1992points to deficient TFP growth as the main culprit in slowing convergence.We proceed now to examine possible reasons for the slowdown in TFPgrowth.
Quality of Inputs
A first approach to explaining lower TFP in the east is to ask whetherthe quality of the inputs on which output growth is conditioned is as highas in the west. Although, as documented, the amount of capital is lower
22 Brookings Papers on Economic Activity, 2:2001
43. This issue is raised by Ragnitz (1999).44. This finding resembles those of Young (1992) for Singapore, where despite very
high investment rates, growth in TFP was not sustainable.
0332-02-Burda 1/3/02 15:29 Page 22
Tab
le 8
.E
stim
ates
of T
otal
Fac
tor
Pro
duct
ivit
y G
row
th fo
r E
aste
rn a
nd W
este
rn G
erm
any,
199
2–99
a
Per
cent
a y
ear
1992
–95
1995
–99
Gro
wth
in
TF
P
Gro
wth
in
TF
P
valu
e-G
row
th in
Gro
wth
in
grow
th
valu
e-G
row
th in
G
row
th in
gr
owth
ad
ded
valu
e ob
serv
ed
(Sol
ow
adde
d va
lue
obse
rved
(S
olow
St
ate
defla
torb
adde
dc
inpu
tsre
sidu
al)
defla
torb
adde
dc
inpu
tsre
sidu
al)
Eas
tern
sta
tes
3.2
6.8
2.4
4.4
–0.1
1.2
2.0
–0.8
Ber
lin
0.9
1.8
0.3
1.5
0.1
–1.0
0.0
–1.0
Bra
nden
burg
4.
49.
03.
45.
6–0
.42.
82.
70.
1M
eckl
enbu
rg–
Wes
tern
Pom
eran
ia4.
38.
43.
15.
3–0
.31.
82.
1–0
.3S
axon
y4.
29.
25.
83.
5–0
.11.
43.
4–2
.0S
axon
y-A
nhal
t 4.
68.
111
.7–3
.7–0
.22.
12.
9–0
.7T
huri
ngia
5.0
9.9
1.5
8.4
–0.1
2.7
2.1
0.6
Wes
tern
sta
tes
–0.4
0.5
0.5
0.0
0.0
1.9
0.8
1.1
Bad
en-W
ürtt
embe
rg–0
.40.
00.
3–0
.30.
12.
10.
81.
3B
avar
ia–0
.31.
00.
80.
20.
02.
60.
91.
7B
rem
en–0
.4–0
.2–0
.80.
50.
01.
50.
01.
5H
ambu
rg
–0.5
0.9
0.7
0.2
0.0
2.1
0.6
1.5
Hes
se–0
.40.
70.
70.
0–0
.32.
20.
91.
3L
ower
Sax
ony
–0.3
0.5
1.0
–0.5
0.2
1.6
0.7
0.9
Nor
th R
hine
–W
estp
hali
a–0
.50.
40.
20.
30.
01.
41.
00.
4R
hine
land
-Pal
atin
ate
–0.4
0.4
0.4
0.0
0.0
1.3
0.8
0.5
Saa
rlan
d–0
.60.
20.
20.
0–0
.21.
11.
10.
0S
chle
swig
-Hol
stei
n–0
.40.
90.
60.
30.
01.
60.
51.
1
All
Ger
man
y 0.
01.
40.
50.
90.
01.
80.
90.
9
Sou
rce:
Aut
hors
’cal
cula
tion
s ba
sed
on d
ata
from
AK
VG
RL
(20
01).
a.G
row
th in
obs
erve
d in
puts
and
TF
P m
ay n
ot s
um to
gro
wth
in v
alue
add
ed b
ecau
se o
f ro
undi
ng.
b.R
elat
ive
to o
vera
ll G
erm
an G
DP
defl
ator
.c.
Gro
ss v
alue
add
ed a
t 199
5 pr
ices
exc
ludi
ng s
ubsi
dies
and
net
inte
rest
.
0332-02-Burda 1/3/02 15:29 Page 23
in the east, its quality is almost surely higher than that in the west becauseit is so much newer.
Several aspects of the quality of labor must be considered. Experiencegained under communism may be less valuable than experience gained ina capitalist economy. Using the GSOEP data, Alan Krueger and Jörn-Steffen Pischke document that the return to (potential) experience in theeast fell from 1989 to 1990,45 and we have confirmed this using our sam-ple and definitions (although the problem arises that only the wage and notits covariates are known for 1989). Curiously, however, Krueger and Pisch-ke also document, using a 1988 dataset, that the return was lower in that year than in 1989. It is thus not quite clear whether the low return in1990 reflected a decline or not. Nevertheless, the experience gap in favorof the east may be less than it appears. At the same time, case study evi-dence suggests that, at least in some contexts (and possibly with positivelyselected workers), the cooperative brigade system under which East Ger-man workers operated prepared them well for new production techniques.Eastern workers adapted more readily to the team-based production sys-tems introduced in manufacturing in the 1990s than western workers did.46
The schooling system worked somewhat differently in the communisteast than in the west; for example, there was less tracking in secondaryclassroom schooling, and more coordination between the classroom andfirm components of apprenticeship training, in East Germany. Apprentice-ships generally lasted two years there, compared with three in the west,and took place in less well equipped firms. On the other hand, easternerstended to complete more apprenticeships in high-skill occupations thanwesterners. Tertiary education in practice was completed in less time in theeast, but this reflects to some degree the inefficiencies of the western uni-versity system, where students repeat many courses.47
Productivity Gaps by Skill Level
We can exploit the GSOEP data to gain more insights into possiblecauses of the productivity gap, in particular by measuring how the gapvaries with worker skill. We assume that the wage in both east and westrepresents the marginal product of labor, which will be the measure of pro-
24 Brookings Papers on Economic Activity, 2:2001
45. Krueger and Pischke (1995).46. Turner (1998).47. See Scheuer (1990) and Krueger and Pischke (1995).
0332-02-Burda 1/3/02 15:29 Page 24
ductivity for the analysis. We also assume that western wages reflect thetrue market skill of a worker. We assign a skill level to each eastern workerby predicting what a worker with the same characteristics would earn inthe west, as described below. We then plot the actual wage that workerearns in the east against the wage predicted in this manner (which wethen call skill). If skill were rewarded as in the west, actual wages wouldcluster along the 45-degree line. In reality, we expect eastern wages tofall below the 45-degree line, indicating a productivity gap, and we areinterested in the size of that gap at different skill levels. Since we are con-ditioning on worker characteristics, differences in composition of theregions’ work forces are removed as a source of productivity differences.We cannot, however, condition on capital available to the worker, and soproductivity gaps here cannot be thought of as TFP gaps.
To calculate the skill measure, we first perform median log wage regres-sions for the west, for men and women separately, pooling annual data for1984 through 1989. A set of “basic” variables is included in all regressions,augmented by one or more (or no) “extended” control variables. The formerinclude year dummies, age, age squared, a dummy for whether the worker isa foreign national, dummies for education levels, and variables interactingthe education dummies with age. The extended controls include tenure withthe firm and dummies for firm size, industry, and whether the respondentreports being employed part time or sporadically. The coefficients from theseregressions are then used to predict the wage that each easterner in the sam-ple would earn in the west, and we take this to be that worker’s skill. We set thevalue of the year dummy for 1988 to 1 for prediction purposes.
Figure 2 shows the results using the extended controls for men and forwomen, for both 1990 and 1999.48 Easterners working in the west areexcluded from the eastern sample. Rather than plotting actual easternwages against measured skill for each individual, we have plotted themedian regression line through the observations (solid line) and the asso-ciated 95 percent confidence intervals (dotted lines). The 45-degree lineis also shown. As expected, the regression line is below the 45-degreeline in 1990 for both men and women and is flatter. This indicates that east-erners were less productive than westerners, especially at high skill levels
Michael C. Burda and Jennifer Hunt 25
48. Here and in subsequent analyses the 1999 sample of easterners is limited to thoseresiding in the east in June 1990. All the analyses were repeated for a sample covering allworkers in the east (including immigrant and commuting westerners and members of anew sample added to refresh the panel). The results are very similar.
0332-02-Burda 1/3/02 15:29 Page 25
(that is, high predicted wages): the return to skill was lower in the east. By1999, for both men and women, the line has shifted upward and becomesteeper. The productivity gap has thus clearly diminished, especially forthe more skilled: the return to skill has risen.49
26 Brookings Papers on Economic Activity, 2:2001
49. An alternative explanation for the line being flatter than 45 degrees is that the mea-sured components of skill are of inferior but rising quality in the east. For experience, firm
Figure 2. Productivity Gap by Skill for Easterners Working in Eastern Germany, 1990 and 1999a
Source: Authors’ calculations based on data from the German Socio-Economic Panel.a. The 45-degree line represents the locus of points where skill is rewarded equally in eastern and western Germany. Standard
errors are reported in parentheses, and 95 percent confidence intervals are shown.b. Wage (in logarithms) predicted for easterners based on western skill coefficients.
2.0
2.5
3.5
3.0
2.0
2.5
3.5
3.0
Men, 1990 Men, 1999
Actual wage (logarithms)
2.0 2.5 3.0 3.5
Women, 1990
2.0
2.5
3.5
3.0
2.0
2.5
3.5
3.0
Actual wage (logarithms)
2.0 2.5 3.0 3.5
Women, 1999
Skillb Skillb
Slope: 0.64 (0.04)Median gap: 0.80 (0.01)
Slope: 0.98 (0.10)Median gap: 0.23 (0.02)
Slope: 0.79 (0.04)Median gap: 0.77 (0.01)
Slope: 1.26 (0.06)Median gap: 0.08 (0.01)
0332-02-Burda 1/3/02 15:30 Page 26
Each panel in figure 2 indicates the slope of the estimated productivityline (a slope of one would indicate a constant productivity gap by skill),and the log wage gap between the productivity line and the 45-degree lineat the median skill level, as well as their standard errors. Men and womenboth begin with a median gap of about 0.8 (80 log points, or a wage ratioof 2.2), which shrinks to 0.23 for men (a gap of 22 percent) and to only0.08 for women (8 percent) in 1999. The slope for male workers rises from0.64 to 0.98; the latter number is not significantly different from one. Theslope for females rises from 0.79 to 1.26, which is significantly greaterthan one. We also attempted to incorporate bonuses into the wage measure,although this reduced the sample size (results not shown). For 1999 thisincreases the median gap by 0.02 and raises the female productivity slopeto 1.31 and the male slope to 1.05.
Given the strong labor force attachment of eastern women, it is arguablymore appropriate to compare them with western men than with westernwomen. In results using data without bonuses (not shown), we found aslope of 0.77 (with a standard error of 0.06) in 1990 and a gap of 0.88(0.01). In 1999 the slope was 1.22 (0.08), steeper than for eastern men(although insignificantly), and the gap was smaller (also insignificantly) at0.20 (0.02).50
To address the question of how productive eastern workers are in theeast, we restricted the analysis in figure 2 to those working there. It mightbe argued that following up on easterners who have relocated (or are com-muting) to the west would reveal more about the true productive potentialof easterners. The difficulty is that these workers are not a random sam-ple of easterners but are likely to be positively self-selected, and in anycase the sample is small and changes over time. Nevertheless, in figure 3we repeat the analysis for the sample of easterners working in the west,whether as emigrants or as commuters. For this analysis we simply usenominal wages for all workers, rather than real wages calculated using
Michael C. Burda and Jennifer Hunt 27
size, and to some extent industry, this is really another way of looking at the samephenomenon.
50. By 1999, conditional on characteristics, eastern women earned a statisticallyinsignificant 1 percent more than eastern men working in the east. Franz and Steiner (2000)point out that eastern women benefit from public sector pay scales. They claim, however,that this success is fragile, because of its dependence on makework jobs. Since, in 1999,50 percent of women worked in the public sector but only 5 percent of women had make-work jobs, the claim of fragility seems exaggerated.
0332-02-Burda 1/3/02 15:30 Page 27
28 Brookings Papers on Economic Activity, 2:2001
Figure 3. Productivity Gap by Skill for Easterners Working in Western Germany, 1991 and 1999a
Source: Authors’ calculations based on data from the German Socio-Economic Panel.a. The 45-degree line represents the locus of points where skill is rewarded equally in eastern and western Germany. Standard
errors are reported in parentheses, and 95 percent confidence intervals are shown.b. Wage (in logarithms) predicted for eastern emigrants and commuters using western skill coefficients.
3.5
3.0
2.5
2.0
3.5
3.0
2.5
2.0
2.0 2.5 3.0 3.5 2.0 2.5 3.0 3.5
3.5
3.0
2.5
2.0
3.5
3.0
2.5
2.0
Actual wage (logarithms) Actual wage (logarithms)
Men, 1991
Women, 1991 Women, 1999
Skillb Skillb
Men, 1999
Slope: 0.52 (0.21)Median gap: 0.25 (0.05)
Slope: 0.83 (0.49)Median gap: 0.24 (0.12)
Slope: 1.07 (0.13)Median gap: –0.00 (0.03)
Slope: 1.18 (0.13)Median gap: 0.05 (0.04)
0332-02-Burda 1/3/02 15:30 Page 28
separate deflators for east and west. The initial year is 1991, because byconstruction of the sample there are no emigrants in 1990, and because thecommuting question was first asked in 1991. In 1991 eastern men had avery low return to skill (a slope of 0.52) and a 0.25 median gap (25 logpoints). Large standard errors make it difficult to say anything about east-ern women in 1991. By 1999, however, both the slopes and the gaps areinsignificant for both men and women.
Implications of a Constant Productivity Gap by Skill Level
Overall, it seems appropriate to characterize the eastern return to skill in1999 as fairly similar to that in the west, with the productivity gap thusconstant across skill levels. This constancy rules out certain possibleexplanations for the remaining productivity gap. It is unlikely to be dueto deficiencies in capital, for example, which would be expected to leadto a larger productivity gap for the more skilled. We have deliberately notset a moving target for the east, but rather have compared it with the pre-unification West Germany of 1988. Results by Henning Klodt imply that,by 1999, the east had reached the western capital-labor ratio of 1988.51 Asimilar capital-labor ratio does not imply, however, that eastern capital isat a level consistent with full convergence, because eastern employmentis too low. The inefficiencies, discussed in the next section, that causeemployment to be low will also have implications for the capital stock.
It is also unlikely that the remaining productivity gap could beexplained by a mismatch between eastern skills and imported westerntechnology, since this is likely to affect different skill levels differently.52
We therefore concentrate below on explanations that could plausibly affectthe productivity of all skills equally, such as differences in infrastructureand in business skills.
It is important to bear in mind that the wage structure and the declinein employment in the east are unlikely to be independent of one another.For example, Hunt documents the large decline in the male-female wagegap in eastern Germany and shows that several percentage points of therelative wage gain for women are due to employment declines among low-paid women.53 The employment decline will affect the median gap in the
Michael C. Burda and Jennifer Hunt 29
51. Klodt (2000).52. See Acemoglu and Zilibotti (2001).53. Hunt (forthcoming).
0332-02-Burda 1/3/02 15:30 Page 29
graph if such declines are disproportionately among people whose actualwage is above or below their predicted wage. If this selection effect variesby skill, the slope of the line could be affected, too.
Other Factors in the TFP Growth Slowdown
LABOR HOARDING AND THE BUSINESS CYCLE. The data in table 1 showthat the eastern states experienced a sharp slowdown in growth starting in1995. In the following year unemployment began rising. One standardexplanation of the TFP slowdown might therefore be labor hoarding, asfirms attempt to hold onto their best workers and avoid severance costs inthe event the downturn is brief.
To account for possible effects of the business cycle on the Solow resid-ual, we regressed the benchmark estimates of the Solow residual summa-rized in table 8 on a complete set of fixed effects (time and state), plus aset of time effects for eastern Germany, plus contemporaneous and laggedvalues of the first difference of the logarithm of the number of unem-ployed in the state. We also interacted the unemployment variables witha dummy for eastern Germany. The regressions reported in columns 9-1and 9-2 of table 9 show that indeed there is an effect of unemployment.This effect is negative for the west, which is consistent with labor hoard-ing. For the east, however, the total effect is positive: for the regressionin column 9-2, the sum of all four coefficients is positive but insignifi-cantly different from zero (p = 0.061). The hoarding effect must be over-whelmed by the impact of firms restructuring and moving to the efficientfrontier, which may well be a transitory deviation from western Germanbehavior.
INFRASTRUCTURE. Another candidate explanation for the systemic TFPgrowth slowdown in eastern Germany after 1995 is the changing trendsin the growth of economic infrastructure in the east. By infrastructure wemean the stock of public and semipublic goods that contribute to produc-tion outcomes. Examples are highways, roads, bridges, telecommunica-tions networks, airports, and harbor terminals, as well as universities,hospitals, police and fire departments, and utilities (utilities in Germanytend to be publicly funded and highly regulated). Although the point iscontroversial, there is some evidence that sustained infrastructure invest-ment may promote economic growth.54
30 Brookings Papers on Economic Activity, 2:2001
54. See Aschauer (1989); for evidence on Germany see Seitz (1994).
0332-02-Burda 1/3/02 15:30 Page 30
Tab
le 9
.E
xpla
inin
g th
e So
low
Res
idua
l in
Ger
man
y w
ith
Une
mpl
oym
ent
and
Infr
astr
uctu
re, 1
992–
99a
Inde
pend
ent v
aria
ble
9-1
9-2
9-3
9-4
9-5
9-6
9-7
Une
mpl
oym
ent
–0.0
56–0
.110
–0.0
96–0
.099
–0.1
01–0
.095
–0.0
98(0
.043
)(0
.050
)(0
.048
)(0
.046
)(0
.046
)(0
.046
)(0
.047
)L
agge
d un
empl
oym
ent
0.02
70.
036
0.02
80.
032
0.03
10.
028
0.02
9(0
.036
)(0
.042
)(0
.040
)(0
.039
)(0
.038
)(0
.039
)(0
.039
)E
ast d
umm
y ×
unem
ploy
men
t0.
228
0.22
20.
223
0.21
50.
208
0.21
0(0
.096
)(0
.091
)(0
.089
)(0
.087
)(0
.089
)(0
.090
)E
ast d
umm
y ×
lagg
ed u
nem
ploy
men
t0.
022
–0.0
27–0
.123
–0.1
02–0
.108
–0.0
19(0
.080
)(0
.077
)(0
.089
)(0
.086
)(0
.087
)(0
.076
)R
eal i
nfra
stru
ctur
e pe
r ca
pita
b0.
306
0.29
4(0
.097
)(0
.096
)R
eal e
quip
men
t inf
rast
ruct
ure
per
capi
ta0.
083
0.08
00.
074
(0.0
31)
(0.0
30)
(0.0
32)
Rea
l abo
ve-g
roun
d in
fras
truc
ture
–0
.005
–0.0
990.
034
per
capi
tac
(0.2
12)
(0.2
15)
(0.2
14)
Rea
l bel
ow-g
roun
d in
fras
truc
ture
0.
190
0.09
80.
164
per
capi
tad
(0.1
68)
(0.1
71)
(0.1
69)
Fra
ctio
n of
firm
s w
ith
few
er th
an
–0.0
75–0
.071
20 e
mpl
oyee
s(0
.038
)(0
.038
)F
ract
ion
of e
mpl
oyed
wor
king
in fi
rms
–0.2
33w
ith
few
er th
an 2
0 em
ploy
ees
(0.1
90)
Sum
mar
y st
atis
tic
Adj
uste
d R
20.
680.
700.
730.
740.
750.
740.
74N
o. o
f ob
serv
atio
ns11
211
211
211
211
211
211
2
Sou
rce:
Aut
hors
’cal
cula
tion
s ba
sed
on d
ata
from
DIW
and
Ins
titu
t für
Wir
tsch
afts
fors
chun
g, H
alle
.a.
The
dep
ende
nt v
aria
ble
for
all s
peci
fica
tion
s is
TF
P g
row
th ta
ken
from
tabl
e 8.
All
inde
pend
ent v
aria
bles
exc
ept t
he la
st tw
o ar
e ex
pres
sed
as f
irst
-dif
fere
nced
nat
ural
loga
rith
ms.
All
spe
cifi
cati
ons
incl
ude
fixe
d ti
me
and
stat
e ef
fect
s pl
us a
n ea
st ×
tim
e fi
xed
effe
ct. T
he r
efer
ence
cat
egor
y is
Bad
en-W
ürtt
embe
rg in
the
firs
t per
iod
of th
e sa
mpl
e. B
erli
n is
incl
uded
wit
h ea
ster
n G
erm
any.
Sta
ndar
d er
rors
are
repo
rted
in p
aren
thes
es.
b.In
fras
truc
ture
is th
e st
ock
of p
ubli
c an
d se
mip
ubli
c go
ods
that
con
trib
ute
to p
rodu
ctio
n.c.
Bui
ldin
g co
nstr
ucti
on.
d.E
xcav
atio
n, s
ite
prep
arat
ion,
and
und
ergr
ound
wor
ks.
0332-02-Burda 1/3/02 15:30 Page 31
As with private productive capital, it is widely agreed that infrastructurein East Germany in 1990 was severely deficient compared with that inWest Germany. Despite immense outlays, infrastructure in the east is oftenregarded as inferior in the productive dimension.55 Moreover, the evi-dence indicates that a decrease in spending by states and local authoritiesset in during the mid-1990s.56 Because it is thought to affect the produc-tivity of all factors, infrastructural backwardness could affect productiv-ity in a skill-neutral way and thus account for our findings above. In theregressions in columns 9-3 through 9-7 in table 9, therefore, we add thefirst difference in log per capita infrastructure stocks as estimated by theDeutsches Institut für Wirtschaftsforschung (DIW).57 We find a robust pos-itive coefficient on total infrastructure and, when the data are disaggre-gated, on equipment infrastructure capital stocks (as opposed to streets,buildings, sewerage, and tunnels). The point estimate associates a 10 percentdecline in equipment growth—not a large magnitude in recent experience—with a decline in TFP growth of approximately 0.83 percentage point.
MANAGERIAL TALENT, ENTREPRENEURSHIP, AND MARKETING SKILLS.Certain business skills either did not exist under communism or did nottransfer well to the postcommunist period; these deficiencies could explainpart of the TFP gap. Authors of case studies have noted that eastern man-agerial and organizational skills fell short of those in the west in the earlyyears of transition. Managers had to adapt to working in much smallerfirms and working more cooperatively with employees. Managers who hadbeen successful under communism also had to deal with workers whoresented that fact. The move to capitalism also demanded knowledge ofmarketing, law, economics, and foreign languages (other than Russian)and a culture of entrepreneurial risk taking.58
32 Brookings Papers on Economic Activity, 2:2001
55. Siedel and Vesper (2000); Vesper (2001). In a controversial pair of studies, theDIW first asserted the existence of an infrastructure shortfall, then partly reversed itself,citing the neglected and large public enterprise sector and consolidating a number of het-erogeneous accounts. A robust finding appears to be that a large gap persists in street androad construction, sewage treatment, and schools; in terms of cultural and social infra-structure, in contrast, the east appears to lead the west. Initial estimates of the total infra-structure gap ranged from DM 200 billion to DM 300 billion, but current estimates indicatethat it is more likely in the vicinity of DM 160 billion at replacement cost, or roughly DM10,000 per inhabitant of eastern Germany.
56. Siedel and Vesper (2000); Vesper (2001). 57. Siedel and Vesper (2000); Vesper (2001); unpublished DIW data. 58. This section draws on the case studies of Bode and Hirschmann (1992), Nickel,
Kühl, and Schenk (1994), and Turner (1998).
0332-02-Burda 1/3/02 15:30 Page 32
Many analysts believe these considerations are still relevant a decadelater. Joachim Ragnitz argues that a continuing lack of marketing skillsleads to eastern products being sold at a discount, which directly influ-ences the productivity statistics.59 The interesting question, however, iswhy such deficiencies have not been remedied in the eleven years sincemonetary union. A high return to these scarce skills should have inducedinvestment by easterners and perhaps mobility by westerners. In the earlytransition, western firms sent managers on temporary assignments to theeast, and we provide evidence below that easterners were sent west fortraining. It may be that building up easterners’ stock of business knowl-edge is simply a very slow process, and western managers could be aninefficient solution if they impose management structures that are inap-propriate given the skill mix of the workers.
CREDIT CONSTRAINTS. Another hypothesis to explain low productivityin the east is that firms there suffer from credit constraints. This couldalso have a skill-neutral effect. Doris Neuberger, for example, finds thatthere is a “finance gap” between eastern and western firms.60 In line withthe new literature on financial multipliers and credit squeezes, firms tendto get credit as an increasing function of their capitalization, meaning thatthe new firms in the east are at a natural disadvantage. In a 1998 paper,Lowell Turner cites the example of the Niles machine tools plant in Berlin,which had difficulties obtaining credit before it was privatized in May 1993.
SECTORAL SHIFTS AND FIRM SIZE. Many analysts point to the industrialstructure of eastern Germany and the predominance of small firms as rea-sons for its low productivity. It is well known that observationally similarworkers are paid more in larger firms (or at least in large firms that are prof-itable in market economies) and in certain capital-intensive industries.The GSOEP means in table 7 show that, in 1990, eastern workers tended tobe in larger firms than western workers, but by 1999 the reverse was true.Data from the Institut für Wirtschaftsforschung, Halle, confirm this trend.
Table 10 shows a collapse of manufacturing’s share in employment toonly 15 percent, and a rise in construction’s share to 17 percent, in the eastin 1995. Employment in services has risen, but its share still lags behindthat in the west (some of the rise represents the outsourcing of servicesthat manufacturers used to provide for themselves). The data also show,
Michael C. Burda and Jennifer Hunt 33
59. Ragnitz (1999, 2001).60. Neuberger (2000).
0332-02-Burda 1/3/02 15:30 Page 33
however, that the construction boom has peaked. Thus the relatively con-stant level of employment since 1993 conceals significant sectoral shifts.It is interesting to note, also in table 10, that the shifts in value added bysector have sometimes exceeded the shifts in employment. These shiftsare the most promising sign we can detect that more aggregate indicatorsfor eastern Germany may yet resume convergence.
34 Brookings Papers on Economic Activity, 2:2001
Table 10. Composition of Employment and Value Added in Eastern and WesternStates and Berlin, 1991, 1995, and 2000a
Percent
Employment Value added
Sector 1991 1995 2000 1991 1995 2000
Eastern states excluding BerlinAgriculture and forestry 7.3 4.0 3.6 3.4 2.3 2.4Industry, excluding construction 29.3 16.9 16.1 21.6 15.4 18.6
business services 12.5 16.6 19.9 28.2 32.8 36.7Public and private services 32.2 35.7 38.5 27.4 27.8 29.7
Source: Authors’ calculations based on data from AKVGRL (2001).a. Numbers may not sum to 100 because of rounding.
0332-02-Burda 1/3/02 15:30 Page 34
It is not clear to what extent small firms and a poor industrial mix arecauses or symptoms of slow convergence. Firms in the east may be smallbecause they are unsuccessful, possibly specializing in nontradables orsmall markets for goods with high transport costs.61 Alternatively, theirsmall size may reflect policy errors, such as policies that keep wages arti-ficially high, that have led to low investment from abroad. As for industrialcomposition, if it is not a policy choice, noting that the industrial mix ispoor may not advance analysis very far. Hans-Werner Sinn and Klodt,however, both stress that to some degree the industrial mix has indeed beena policy choice through the medium of subsidies to capital investment.62
Our wage-based analysis controlled for industry and firm size directly.Controls for industry and firm size reduce the 1999 median productivitygaps by only 0.01 (results not shown). In the last columns of table 9 welook explicitly for the effect of firm size on TFP growth. Although weaklysignificant, the association is hardly large: an observed move in the shareof small firms in the east (from 1.4 percent in 1991 to 6.6 percent in 1999)is linked to a decrease in growth of 0.37 percent (column 9-7). By contrast,Ragnitz finds, using a different methodology, that firm size alone accountsfor 17 percentage points of the raw productivity gap.63
Despite our finding that industry and firm size are not so important ina static accounting sense, we believe that insights for long-run growthcan be gained by considering the industry mix. Hunt observes that, afterthe first year of transition, incentives to change jobs and industries appearto have been low, and job-changing rates fell.64 Using GSOEP data, shecalculates that over 1990–96 only 18 percent of real wage growth went tojob changers within the east, and 7 percent was due to movement to andfrom jobs in the west. This is surprisingly low compared with the 22 per-cent of real wage growth in the west that went to job changers. In the firstyear of transition, voluntary movers within the east gained 15 percent morethan similar workers who stayed with the same employer, and the wholegain was due to changing industry. Wages continued to rise subsequently,but movers experienced no significant gain over stayers.
These results suggest that wage growth patterns after 1991 were notconducive to sectoral shifts, as stayers were too well rewarded. For the
Michael C. Burda and Jennifer Hunt 35
61. This has been suggested by von Hagen and Strauch (2000).62. Sinn (1995); Klodt (2000).63. Ragnitz (2001).64. Hunt (2001a).
0332-02-Burda 1/3/02 15:30 Page 35
period 1990–93 it may be appropriate to think of the labor unions aschoosing wages (this is discussed further below). In some industries wageincreases for 1990–94 were laid out in advance as early as 1990. Theunions, bargaining at the industry level, did take the industries’ prospectsinto account when setting wages, but it is nevertheless possible that theydid not pick the right relative wages across industries. High wages in “bad”industries could have delayed restructuring in a fashion similar to that inthe model of Philippe Aghion and Olivier Blanchard.65 However, after1993 the power of the unions declined significantly. In order to inculpatethe unions, it is necessary to argue that nominal wage rigidities and lowinflation, coupled with a high overall wage level, made it hard for relativewages to adjust.
Could the overall TFP slowdown be concealing very different trendsby sector?66 In particular, if construction experienced a fall in TFP similarto the fall in its labor productivity, it could obscure TFP growth in othersectors. In addition, government and other state service sectors may haveseen slower growth. Unfortunately, there are no good benchmarks for sec-toral capital stocks that are also broken down into equipment and struc-tures. We performed a cruder Solow calculation using annual estimatesby Bernd Görzig and Gerda Noack of the total capital stock for “produc-ing industry and manufactures,” an aggregate that includes mining, man-ufacturing, and the energy sector but excludes construction.67 The resultsshow a pattern almost identical to that of the broader economy: TFPgrowth during 1993–95 averaged 11.8 percent a year but fell to 4.3 percenta year during 1996–98, with a value of 0.5 percent in 1998.
MIGRATION AND COMPOSITION EFFECTS. It may be that migration hasremoved the most productive individuals from the eastern sample. In thisrespect we can identify an important link between productivity and migra-tion: if the most productive individuals leave or have the greatest propen-sity to leave, the Solow residual as calculated in table 8 will mismeasureinputs (by failing to weight workers by their human capital). An obviousmodification is to redo the Solow analysis for more disaggregated labortypes. Using employment data by age available from the GermanMikrozensus from 1991 on, we construct an extended version of the Solow
36 Brookings Papers on Economic Activity, 2:2001
65. Aghion and Blanchard (1994).66. This question is raised by Holger Wolf in his comment.67. Görzig and Noack (1999).
0332-02-Burda 1/3/02 15:30 Page 36
decomposition, which weights different employment-age groups by theirshare of labor income, estimated using GSOEP data (for details see theappendix). The results, presented in table 11, show little difference fromthe unadjusted results.
Assessing Labor Market Performance
Low output per capita may also reflect an inability to mobilize laborresources. We now examine labor market issues in eastern Germany, withan emphasis on whether wages are too high to allow full employment.We begin by discussing how wages came to be so high, and then we assessthe structure and level of wages and other issues related to unemployment.
Why Did Wages Initially Rise So Quickly Given Low Productivity?
It is generally assumed that, in the early years of transition, labor unionswere able to choose the level of wages. The western labor unions estab-lished themselves in the east beginning in 1990, replacing the disbandedcommunist union, and quickly built up a large membership. The West Ger-man system of industrial relations was introduced, and the new, western-led unions bargained at the industry level. The eastern enterprises wereinitially unprivatized, and so the unions’ bargaining partners were theexisting enterprise managers, advised in some cases by western employers.In certain industries periodic wage increases were immediately agreed toas far ahead as 1994, when, in the metalworking industry, parity with thewest was supposed to be reached. However, an employers’ revolt in 1993restrained the growth of wages, and thereafter the unions moved onto thedefensive. Some firms began illegally paying below the negotiated wage,some left the employers’ federation to avoid being bound by the unionagreements, and new firms declined to join the federation.
The motivations of the managers and the western employers are notclear, but it seems likely they were less inclined to resist wage increasesthan private enterprise owners would have been. The unions were certainlymotivated in part by concerns for equity and the welfare of eastern work-ers. Wage rises benefited both those keeping their jobs and those whowould have lost their jobs anyway, since losing a higher-wage job enti-tled them to higher unemployment benefits. At the same time, the unions
Michael C. Burda and Jennifer Hunt 37
0332-02-Burda 1/3/02 15:30 Page 37
Table 11. Estimates of Total Factor Productivity Using Alternative Labor Inputs,1992–99 Percent a year
1992–95 1995–99
With With Benchmark employment Benchmark employment
State estimatea age correctionb estimatea age correctionb
Source: Authors’ calculations based on data from AKVGRL (2001) and the German Federal Statistical Office.a. From table 8. Uses one homogeneous labor input.b. Employment data are disaggregated into four age groups (see appendix for details).
38 Brookings Papers on Economic Activity, 2:2001
may also have been acting in the perceived interests of western workers.They may have wanted to reduce competition from the east by raising pro-duction costs there and by reducing migration flows to the west.68
In addition to the labor unions, another intervention was the introduc-tion of the western welfare and social insurance systems. These presum-ably raised reservation wages and allowed unions to bargain higher wagesfor the low skilled. We have already mentioned the channel through whichunemployment insurance allowed this. The basic means-tested welfare
68. See Burda and Funke (2001) for more details on how and why wages rose.
0332-02-Burda 1/3/02 15:30 Page 38
allowance (Sozialhilfe) was introduced at a level below that in the richerwest but was soon raised to the same level.
One could argue, however, that even in the absence of powerful unionsand generous welfare benefits, wages would have risen greatly as integra-tion proceeded. Factor price equalization through free trade would haveled to equal wages once the technologies employed were the same and fac-tor endowments sufficiently similar. The rapid transfer of technology andcapital from west to east would have boosted the wages of workers withsimilar skill endowments. Furthermore, the option of moving to the westmeant that to some degree the western wage provided a reservation wage.A naïve interpretation of figure 3 suggests that, in 1991, easterners whomoved could have earned about 75 percent of western wages. Turner pro-vides evidence that some large manufacturing employers supported largewage rises as a way of retaining skilled workers who might otherwise emi-grate.69 Nevertheless, the unprecedented employer revolt in 1993, whenemployers’ federations abrogated their collectively bargained agreements,and the fact that in this period the firm-based works councils acceptedslower wage growth to save jobs, suggest that wages grew faster than theywould have in the absence of institutional intervention.
A good example of the difference mobility makes is the fact that theambitious aim of wage equality across eastern and western Germany by1995 has succeeded only in Berlin, and even there convergence has beenincomplete in sectors where mobility is low or the concentration of spe-cific human and physical capital is high. Table 12 shows earnings ratiosbetween East and West Berlin in various sectors for 1993–2000. Conver-gence has been achieved in the printing and paper industries, whilemachinery and construction are the laggards, but even there eastern wagesare 81 percent of western wages. It is not clear whether this is due to lag-ging capital intensity or, in the case of construction, to public works pro-curement policies and tax subsidies.
Is the Wage Structure Inappropriate?
The consequences of high wages depend on why wages are high. Inthe simplest model, unemployment results if unions push wages abovethe market-clearing level. If, as is commonly the case in rich countries,
Michael C. Burda and Jennifer Hunt 39
69. Turner (1998).
0332-02-Burda 1/3/02 15:30 Page 39
unions have a distaste for wage inequality and raise the wages of the lessskilled more, unemployment will be higher for these workers. However,more sophisticated models can be devised in which the union-initiatedwage rise pushes the economy onto a high-productivity path because ofresponses in human capital investment.70 If instead wages are high becausereservation wages have risen above the market-clearing wage, employmentwill fall, but there will be no unemployment. An exception would be ifunemployment were due in part to efficiency wages. In this case a rise inthe reservation wage would raise the wage paid and raise unemployment.71
Given the possible link between wages and unemployment insurance, itis worth noting that, under most circumstances, theory predicts that unem-ployment insurance will speed a successful transition.72
In the integration context, wages could rise as a result of factor priceequalization, which would be an efficient outcome. Finally, we havealready discussed the possibility that inappropriate sectoral differentia-tion of wages may prevent the reallocation of labor across sectors, whichin the longer run would prevent a recovery of employment.
The behavior of wages and employment at various skill levels shouldreveal more about the source of unemployment. The first two rows oftable 13 show 90-10 log wage differentials (the difference between thelog wage at the 90th percentile of the wage distribution and that at the 10thpercentile) within eastern and western Germany, for both men and women,
40 Brookings Papers on Economic Activity, 2:2001
70. Burda and Funke (2001).71. We thank Janet Yellen for this observation.72. See Roland (2000). Boeri (2000) provides empirical support for this argument.
Table 12. Convergence of Earnings in Selected Industries in East Berlin, 1993–2000a
machinery, data processing 79.2 89.5 93.2 91.9 92.0 91.1Food and kindred products 69.7 77.8 89.8 92.9 94.8 94.5Machinery 71.0 77.8 81.1 83.0 80.0 81.4Printing and paper 74.3 93.6 98.8 107.7 112.5 100.8
Source: Authors’ calculations based on data from the Berlin Statistical Office.a. Nominal gross monthly earnings.
0332-02-Burda 1/3/02 15:30 Page 40
in both 1990 and 1999. The table shows that eastern inequality has reachedthe stable western level,73 and thus no signs of institutional interferencein the convergence to western inequality.
We can probe further by looking at the inequality of predicted wages(between-group inequality) and the inequality of residuals (within-groupinequality), based on a log wage regression. Between-group inequalityrefers to inequality between groups of workers with the same observablecharacteristics, whereas within-group inequality reflects inequality withinthese groups. The last two panels of table 13 show results based on meanregressions for east and west, using the set of control variables includingtenure, firm size, industry, and part-time status. Eastern men and womenhave similar increases in the within-group differential of 0.13 to 0.15, withthe result that within-group inequality is 0.69 for both sexes. This value is
Michael C. Burda and Jennifer Hunt 41
73. Using data for men only, Burda and Schmidt (1997) and Prasad (2000) also docu-ment a remarkably stable western German wage structure in the 1980s and 1990s, despitethe turbulence occurring in the east and migration to the west.
Table 13. Wage Inequality in Eastern and Western Germany, 1990–99a
Difference between 90th percentile and 10th percentile log wages
Eastern Western
Type of inequality Men and Men and and year Men Women women Men Women women
Source: Authors’ calculations based on data from the German Socio-Economic Panel.a. East Berlin is included with eastern Germany and West Berlin with western Germany. Sample weights are used for western
Germany. Table 7 reports characteristics of the sample.b. Actual difference between hourly wages (expressed in logarithms) paid at the 90th percentile and those paid at the 10th
percentile.c. Difference in hourly wages predicted by regressions for 1990 and 1999 that explain log hourly wages with age, age squared,
education, part-time and sporadic work, tenure, firm size, industry dummies, and, for the west, a dummy for foreign nationals.d. Difference in the residuals from the above regressions.
0332-02-Burda 1/3/02 15:30 Page 41
above that for western men and below that for western women. Between-group inequality rises much more for eastern women than for eastern men,leaving eastern women with the highest between-group inequality in 1999and eastern men with the lowest. This is consistent with the results on thereturns to skill shown in figure 2. Decomposing the variance of log wagesinto additive between- and within-group components reveals that the risein eastern inequality is due in equal parts to between- and within-groupinequality (results not shown).
Changes in between- and within-group inequality can be due to changesin returns or changes in endowments (that is, worker characteristics). Wecan quantify the contribution of each by performing Oaxaca decomposi-tions.74 The change in the mean eastern log wage ( ) may be decomposedinto a change in mean characteristics and a change in the returns tothose characteristics (β):
We performed Oaxaca decompositions for men and women separately,based on mean log wage regressions for 1990 and 1999. These regres-sions are limited to a few simple control variables (age, age squared, edu-cation dummies, and dummies for part-time or sporadic employment);others also include tenure with the firm, or also include tenure, firm sizedummies, and industry dummies. The results (table 14) show a rise in themean log wage of 0.56 for men and 0.71 for women. The next two rowsreport results from the decomposition of the wage increase into changes inthe observed characteristics and changes in their return. The rise in wagesis almost entirely due to changes in the return to characteristics, whichincludes the coefficient on the constant term. In the regressions with thecomplete set of controls, changes in average characteristics tend rather toreduce wages slightly, because of the reduction in tenure and firm size.75
Straightforward log wage regressions show most easily which compo-nents of skill are behind the rise in return seen in figure 2 and table 14, andthe rise in between-group inequality seen in table 13. We present resultsin table 15 for both east and west, for men and women separately. The east-ern regressions are for 1990 and 1999, whereas for consistency with the
( ) – – ( – ) ( – ).1 1 1 1 1 1 1w w X X X X Xt t t t t t t t t t t t+ + + + + += = +β β β β β
( )Xw
42 Brookings Papers on Economic Activity, 2:2001
74. See Oaxaca (1973) and Oaxaca and Ransom (1994). 75. See Burda and Schmidt (1997) and Franz and Steiner (2000) for more extensive
Oaxaca analyses.
0332-02-Burda 1/3/02 15:30 Page 42
figures the western regressions use preunification data. A disadvantage ofthe smaller sample sizes for the east, especially when split by sex, is thatstandard errors are somewhat large, so that not all the changes discussedare statistically significant.76
The return to age (at age thirty-five, reported at the bottom of the table)has risen considerably for eastern men and women, to equal the return forwestern men (0.011). The return to schooling in the east, in contrast, haschanged little, except that the quality of the omitted apprenticeship cate-gory has risen for women because of selection in employment.77 The returnto vocational training is higher in the east, whereas the return to a univer-sity education is similar for both sexes in both east and west. The returnto tenure has risen in the east, especially for men. It is about 0.07 percenta month in 1999 for all groups except western men, for whom it is lower.The return to firm size has risen for both men and women in the east, andthat for men may be slightly higher than in the west.
It seems safe to conclude that the rise in the eastern return to skill rep-resents a rise in the return to age or experience, as well as increases in thereturns to tenure and firm size. It is more difficult to assess returns toindustry, and we do not attempt it. Generally, wage regressions and the
Michael C. Burda and Jennifer Hunt 43
76. A large literature performs similar regressions. See Franz and Steiner (2000) for arecent example.
77. This argument is based on Hunt (forthcoming).
Table 14. Oaxaca Decomposition of Hourly Wages for Eastern Germany, 1990–99a
Men, controlling for Women, controlling for
Same + Same + Age, tenure, Age, tenure,
education, Same + firm size, education, Same + firm size, Change in part timeb tenurec industryd part timeb tenurec industryd
Average wagee 0.56 0.56 0.56 0.71 0.71 0.71Observable
characteristics 0.04 –0.02 –0.06 0.04 0.01 –0.03Return to
characteristics 0.52 0.59 0.62 0.67 0.70 0.74
Source: Authors’ calculations based on data from the German Socio-Economic Panel.a. Sample includes workers aged eighteen to fifty-four who are not apprentices, self-employed, or employed in agriculture.
For 1990 there are 992 observations for men and 1,039 for women; for 1999 there are 528 for men and 564 for women. East Berlinis included with eastern Germany and West Berlin with western Germany.
b. Controls for age and age squared and includes dummies for education and part-time and sporadic work.c. Adds tenure in months.d. Adds firm size and industry dummies.e. Expressed in logarithms.
0332-02-Burda 1/3/02 15:30 Page 43
44 Brookings Papers on Economic Activity, 2:2001
Table 15. Explaining Wages in Eastern and Western Germany with Age, Education,Employment Status, and Firm Sizea
Source: Authors’ calculations based on data from the German Socio-Economic Panel.a. The dependent variable is the hourly wage (expressed in logarithms). Each specification includes dummy variables for
years and industry (results not reported). Samples are described in table 7. East Berlin is included with eastern Germany andWest Berlin with western Germany. Standard errors are reported in parentheses.
b. Divided by 100.
0332-02-Burda 1/3/02 15:30 Page 44
analysis of between- and within-group inequality confirm the impressionthat the eastern wage structure has become very similar to that of the west,so that explanations for high unemployment must be sought elsewhere.
Employment and the Wage Structure
The convergence of the wage structure is occurring in the context of alarge decline in employment in eastern Germany. The behavior of employ-ment by skill should therefore be examined for further evidence on theappropriateness of the wage structure. It is possible that the wage struc-tures should differ between east and west because of differing labor forceendowments, possibly influenced also by differing participation rates.Hunt, using longitudinal data from the GSOEP, notes that the employ-ment fall was largest for low-paid workers, whereas wage gains were thegreatest for this group.78 This would appear to support the hypothesis thatunions have caused unemployment by raising wages, particularly for thelow skilled. However, the equivalent analysis for the west revealed thatalthough wage gains were flat in initial earnings, employment losses wereaffected by initial earnings in the same way as in the east. As in otheradvanced market economies, employment in Germany appears much lessstable for the low skilled.
It is more appropriate to examine changes in wages and employment byskill using the data as cross sections, since wage floors affect jobs ratherthan individuals. We seek evidence of wage floors using a technique closeto that of David Card, Francis Kramarz, and Thomas Lemieux, andKrueger and Pischke.79 We use the same measure of skill for easterners ascalculated above, based on predicted wages in the west. Wages are pre-dicted this time for all individuals, not just those working.80 Skill groupsare then defined using the skill cutoffs that result from dividing the indi-viduals in the 1990 sample into twenty equally sized groups.81 For eachskill group in any year, the employment rate and the average wage (for
Michael C. Burda and Jennifer Hunt 45
78. Hunt (2001b).79. Card, Kramarz, and Lemieux (1999); Krueger and Pischke (1998).80. For this reason, the sample here is restricted to twenty-two- to fifty-four-year-olds.
If eighteen- to twenty-one-year-olds are included, the two lowest skill cells are paid farless than the others and experience little employment change. This must be due to the largenumber of students in this age group.
81. Remember that skill is always based on 1980s western coefficients, so that it doesnot drift as wages rise in the 1990s.
0332-02-Burda 1/3/02 15:30 Page 45
those working) may be calculated. We plot the growth in the employmentrate and the wage in the 1990–99 period for each skill group. We performa parallel analysis for the west, using westerners’ predicted wages in thewest as the skill measure.
Figures 4 and 5 show the results for east and west, respectively, basedon only basic controls in the regressions predicting skill (note the differentscales). The graph for eastern workers appears somewhat consistent withthe rising-wage-floor explanation of unemployment: the low skilled havethe largest employment falls but appear to have slightly larger wageincreases. The graph for western workers confirms the result of Kruegerand Pischke,82 since employment growth is essentially flat in skill despitehigher wage growth for the less skilled. The western data thus show thatwages can rise for the low skilled with no apparent employment effects.
For the east, the relationship between wage growth and skill is sensitiveto the definition of skill. In particular, if skill is predicted with tenure,
46 Brookings Papers on Economic Activity, 2:2001
82. Krueger and Pischke (1998).
Figure 4. Change in Wage and Employment for Easterners Working in EasternGermany, 1990–99a
Source: Authors’ calculations based on data from the German Socio-Economic Panel.a. East Berlin is included with eastern Germany and West Berlin with western Germany.b. Expressed in natural logarithms.c. Wage (in logarithms) predicted for easterners using western skill coefficients.
–0.4
–0.2
0.0
0.2
0.4
0.6
0.8
2.5 2.6 2.7 2.8 2.9 3.0 3.1 3.2 3.3 3.4
Skillc
Hourly wageb
Employment rate
0332-02-Burda 1/3/02 15:30 Page 46
firm size, industry, and part-time status among the controls, wage growthis higher for the high skilled (figure 6). (The graph for western workers isnot sensitive to this change, and therefore the equivalent graph is notshown.) With these controls, only workers can be included in the sample,and hence employment growth is equal to zero for each cell and is notmeaningful. This does not mean that the data are inconsistent with therising-wage-floor story, since the wage floor could have made the growthin inequality less than it would have been, but neither do these graphsprovide particularly strong support for the story.
Employment and Wage Levels
None of the above analyses were able to find conclusive evidence fromrelative wages or employment of distortionary effects of wage floors, bethey union wages or welfare benefits. However, the tests are rather weak,given the absence of a clear expectation of what would have happened inthe absence of these institutions. Chronically lower employment rates in
Michael C. Burda and Jennifer Hunt 47
Figure 5. Change in Wage and Employment for Westerners Working in WesternGermany, 1990–99a
Source: Authors’ calculations based on data from the German Socio-Economic Panel.a. East Berlin is included with eastern Germany and West Berlin with western Germany.b. Expressed in natural logarithms.c. Wage (in logarithms) predicted for westerners using western skill coefficients.
–0.20
–0.15
–0.10
–0.05
0.00
0.05
0.10
0.15
2.5 2.6 2.7 2.8 2.9 3.0 3.1 3.2 3.3 3.4
Skillb
Hourly wageb
Employment rate
0332-02-Burda 1/3/02 15:30 Page 47
the east than in the west, as well as high unemployment rates in the easteven when accounting for search and availability, point to a labor demandproblem in the east. One possibility is that unions have pushed wages forall skill groups above the market-clearing wage, and that sharper employ-ment falls for the less skilled are due to another labor demand factor com-mon to market economies. Indeed, discussions of wage growth in theindustrial relations crisis of 1993 were about the overall wage level, ratherthan about wages for the less skilled. Funke and Jörg Rahn demonstratewith firm-level data that eastern firms have more heterogeneous within-industry TFP than do western firms, implying that imposing a uniformwage might have worse efficiency consequences in the east.83 Using datafrom another firm survey, however, Lutz Bellmann and Martin Brussigreject this argument.84
In sum, despite the difficulty of demonstrating it concretely, we areinclined to believe that wages have risen too fast and, as discussed earlier,
48 Brookings Papers on Economic Activity, 2:2001
83. Funke and Rahn (forthcoming).84. Bellmann and Brussig (1998).
Figure 6. Change in Hourly Wage for Easterners Working in Eastern Germany,Using Extended Controls, 1990–99a
Source: Authors’ calculations based on data from the German Socio-Economic Panel.a. Expressed in natural logarithms. East Berlin is included with eastern Germany and West Berlin with western Germany.b. Wage (in logarithms) predicted for easterners using western skill coefficients.
0.1
0.2
0.3
0.4
0.5
0.6
0.7
0.8
2.5 2.6 2.7 2.8 2.9 3.0 3.1 3.2 3.3 3.4
Skillb
0332-02-Burda 1/3/02 15:30 Page 48
with the wrong distribution across firms and industries. That the overallwage level is too high and has caused unemployment is a commonly heldview. Economists such as Akerlof and others, Klaus-Dietrich Bedau, Bell-mann, and David Begg and Richard Portes have called for wage subsi-dies.85 Dennis Snower calls for profit-sharing schemes.86
Some insight into unemployment has been gained by considering theextremely high unemployment rate for women. The GSOEP search andavailability–based measure indicates a 10 percent unemployment rate formen and a 15 percent rate for women. Hunt notes that lower rates of com-muting to the west among married female workers with children havehurt the wage growth of female workers.87 Pressure to be at home in theevenings thus restricts job options and therefore must also raise the femaleunemployment rate. Hunt shows that a commonly advanced supply-sideexplanation for the greater employment declines for women, namely, thedecline in the availability of child care, does not explain any of the male-female gap in durations of employment or nonemployment spells.88 Someauthors appear to suggest that the high eastern unemployment rate (asmeasured by registered unemployment) is an illusion created by womencollecting benefits while out of the labor force. Were this the case, theGSOEP search and availability–based measure of unemployment wouldshow similar rates for men and women, which it does not.
Has Eastern Germany Become a Right-to-Work Region?
If the overall level of wages is too high given the demand for labor, itis natural to look for labor market rigidities, and collective bargainingarrangements in particular, that might be keeping wages high. Yet a sur-prising side effect of the transformation of eastern Germany has been thecollapse of the collective bargaining system imported from the west. Thiscan explain the halt in wage convergence that began in 1995, evident fromtable 3. Part of this is simply the fact that promises were made but not kept;eastern German workers were not happy with trade union federation chiefDieter Schulte’s promise of a high unemployment benefit as the result of
Michael C. Burda and Jennifer Hunt 49
85. Akerlof and others (1991); Bedau (1996); Bellmann (1994); Begg and Portes(2001).
the rapid increase of wages in the early years.89 The punishment for the risein unemployment and incomplete wage convergence was a massivedecline in union membership in the east, from just under 50 percent ofworkers in 1991 to about 22 percent in 2000, compared with a drop from25 percent to 18 percent in the west over the same period.
More decisive for coverage of collective agreements than the declinein membership, however, is the fall in membership in the employers’ asso-ciations, which function as bargaining intermediaries for large industrialcollective wage agreements; low and declining membership vitiates thecredibility of wage agreements and of the collective bargaining systemitself. Table 16 documents the sharp decline in the share of firms that areparty to collective agreements and, more important, the rising fraction ofworkers not covered by such agreements. Even those firms that remain—one-third of all eastern German enterprises by most guesses—have the option ofinvoking an opt-out clause (Öffnungsklausel), although this was originallyconceived in the west as an escape valve for rare and dramatic cases.
This decline in influence has resulted in an increased readiness on thepart of workers and works councils to engage in U.S.-style plant-level“concession bargaining,” in which workers accept wages below minimum(industry-wide) contract-determined levels in order to save their enter-prises from bankruptcy. Under western German collective bargaining con-ventions, this development would have been unthinkable, as members of
50 Brookings Papers on Economic Activity, 2:2001
89. Akerlof and others (1991); Burda and Funke (1995).
Table 16. Membership in Employers’ Associations and Below-Union Wages inEastern Germany, 1993–2000a
Percent
Item 1993 1995 1998 2000
Share of all firms that are members of an employers’ association 36 27 21 16
Share of all employees employed by firms that are members of an employers’ association 76 64 45 34
Share of firms paying below the union wage for their industry and region 35 33 41 40
Share of employees who are paid below the union wage for their industry and region 12 16 28 29
Source: DIW, Wochenbericht, various issues.a. East Berlin is included with eastern Germany and West Berlin with western Germany.
0332-02-Burda 1/3/02 15:30 Page 50
employers’ federations are joint signatories to collective wage agreementsand thus bound to pay at least the minimum wages specified in the con-tract. Yet an increasing number of firms, no longer able to pay wagesdecided on in the west, have implicitly or explicitly defected from col-lective bargaining agreements and have abandoned their employers’associations in the east, leaving open the possibility of enterprise-levelbargaining.90 Susanne Kohaut and Claus Schnabel estimate that this typeof bargaining is becoming more and more important over time.91 The resulthas been a schism in collective bargaining between east and west and theestablishment of a right-to-work region similar to that in the southernUnited States in the 1970s.92
The Role of Migration in German Integration: An Empirical Analysis
In a free labor market, workers can vote with their feet. Householdscan escape unsatisfactory conditions by simply moving to other labor mar-kets where jobs are more plentiful or pay is better. Thus migration is anessential component of the integration process. In the absence of mobilitycosts and externalities, it is unequivocally more efficient to allow mobility,whether in the form of commuting or of migration. In more general set-tings one must weigh the cost of sending capital to the capital-poor regionagainst that of sending workers to the capital-rich region. How muchmobility can be observed between the poor east and the rich west? Doesit respond to wages only, or also to differences in the unemployment rate?
In this section we evaluate the extent of labor mobility in eastern Ger-many. We present evidence based on a sample of adults from the GSOEPdata, and on official data from the German Federal Statistical Office ongross migration flows to and from all the states of Germany for 1991–99.From the Bundesamt für Bauwesen und Raumordnung we have migra-
Michael C. Burda and Jennifer Hunt 51
90. See Schnabel (1999). This situation can be changed only to the extent that the min-ister of labor declares a contract binding on all firms and workers in a particular sector,should he or she deem this to be in the public interest. The possibility of such an actionseems remote at present.
91. Kohaut and Schnabel (1999).92. The Industrial Investment Council, founded to promote foreign direct investment
in the east, has recently touted labor market flexibility as a central advantage of the regionover western European locations.
0332-02-Burda 1/3/02 15:30 Page 51
tion data by age for 1991–94 and 1997, based on flows among ninety-fivesmaller regions (Raumordnungsregionen), and from the state statisticaloffices we have all flows by age to and from Saxony and Mecklenburg–Western Pomerania for 1991–99. Because definitions are slightly incon-sistent across years for the city-states Hamburg, Bremen, and Berlin inthe data by age, for regressions by age we aggregate Berlin and Branden-burg into one state, and Schleswig-Holstein, Hamburg, Lower Saxony, andBremen into another. Variables for these aggregates are obtained byweighting or summing those of the component states, as appropriate.
The Scale of East-West Migration
Eastern Germans have had access to the western German labor marketever since Hungary began allowing citizens of East Germany to cross intoAustria in August 1989. This access became significantly less costly inNovember 1989.93 Figure 7 gives a long-term perspective on flows between
52 Brookings Papers on Economic Activity, 2:2001
93. Grundmann (1998) gives more detail on the events of 1989–90.
Figure 7. Migration between Eastern and Western Germany, 1957–99a
Source: German Federal Statistical Office.a. East Berlin is included with eastern Germany and West Berlin with western Germany.
50
100
150
200
250
300
350
400
1960 1965 1970 1975 1980 1985 1990 1995
Thousands
East to west
West to east
0332-02-Burda 1/3/02 15:30 Page 52
east and west from 1957 to 1999. The outflows in 1989 and 1990 each rep-resent 2.5 percent of the East German population at the time and were ofthe same magnitude as the outflows in the 1950s that led first to a ban onemigration and then to the construction of the Wall. Emigration from the eastfell quickly after 1990, to almost zero on net, but has risen once again inrecent years. The figure underlines that at least some proportion of hetero-geneous labor can move instantaneously, which is less true of capital.
The outflow of people to the west has contributed to a remarkabledecline—by 8.7 percent between 1989 and 1999—in the eastern Germanpopulation, with a significant drop in the birth rate being the other main con-tributor. Table 17 decomposes the population change into three components:the excess of deaths over births, net emigration to the west, and net immi-gration from abroad. Excess deaths have reduced the population by 4.7 per-cent, and net emigration to the west by 7.2 percent. Net immigration fromabroad has offset the population decline slightly, contributing 2.5 percent.
Since the mid-1990s the eastern states have been accepting ethnic Ger-man immigrants (Aussiedler) from Russia and from central and easternEurope, who are allocated among the states on arrival. These immigrantshave shown a tendency to move to the west soon after being officially
Michael C. Burda and Jennifer Hunt 53
Table 17. Decomposition of Population Decline in Eastern Germany, 1989–99a
Moved to western Germany, 1989–99 –2.448 –14.7Moved from western Germany, 1989–99 1.244 7.5
Change –1.204 –7.2
Net migration from abroad, 1989–99c 0.422 2.5
Calculated population, 1999 15.114 90.6
Difference between registered and calculated population 0.103 0.6
Sources: Statistical Yearbook of the German Democratic Republic, 1989; and German Federal Statistical Office data.a. East Berlin is included with eastern Germany and West Berlin with western Germany.b. End-of-year value.c. Data on outside migration are not available for 1990.
0332-02-Burda 1/3/02 15:30 Page 53
settled in the east, and have hence contributed to east-west flows as well asto the inflows from abroad. The number of Aussiedler officially establishedin the east through 1998 (assuming equal shares in East and West Berlin)represented 1.9 percent of the 1989 eastern population.94
Consistent with the theory of migration as human capital investment,95
the young are much more likely to move than older people. Figure 8 showsnet annual emigration rates by age for each of four large areas: easternGermany excluding Berlin, Berlin (which is aggregated with its suburbsinto a single region), Bavaria and Baden-Württemberg, and the rest of
54 Brookings Papers on Economic Activity, 2:2001
94. Dietz (1999).95. Sjaastad (1962).
Figure 8. Net Emigration Rates, by Region and Age, 1991–97
Source: Unpublished data from Bundesamt für Bauwesen und Raumordnung.a. Excludes Baden-Württemberg and Bavaria.
–1
1
0
2
3
4
–1
1
0
2
3
4
1992 1994 1996
Aged 50–64Aged 30–49
Aged 25–29
Aged 18–24
Percent
–1
1
0
2
3
4
–1
1
0
2
3
4
Percent
1992 1994 1996
Baden-Württembergand Bavaria
Eastern Germany(excluding Berlin) Berlin
Western Germanya
0332-02-Burda 1/3/02 15:30 Page 54
western Germany. Net annual emigration of eighteen- to twenty-four-year-olds from the east excluding Berlin has been above 1 percent throughoutthe transition. Net emigration of twenty-five- to twenty-nine-year-oldsdipped to zero in 1993–94 but then began rising again. Greater Berlin isthe only other area with similarly sustained high net flows: in this casehigh net immigration of eighteen- to twenty-four- and twenty-five- totwenty-nine-year-olds. A complete picture must include flows to and fromabroad, but the numbers in table 17 show that they cannot be large enoughto reverse the general picture of high net emigration of young people fromthe east. The high net emigration rates in the east are due to high gross emi-gration and normal gross immigration; the net flows disguise higher grossflows for Bavaria and Baden-Württemberg than for the rest of the west.
Characteristics of Migration and Commuting
Migration is only one aspect of labor mobility between east and west.The existence of the enclave of West Berlin and the long border betweenthe two Germanys meant that commuting has been a feasible substitutefor emigration for many easterners. Table 18 uses the GSOEP data toshow for various periods the relative importance of emigrants and com-muters. These data record a considerable number of movers, particularlycommuters, who emigrate or begin to commute but report staying withthe same employer.96 We refer to these as “transferred” commuters oremigrants. Over the whole period 1990–99, 62 percent of people who
Michael C. Burda and Jennifer Hunt 55
Table 18. Composition of Easterners Working in Western Germany, 1990–99a
Source: Authors’ calculations based on data from the German Socio-Economic Panel.a. The sample consists of 385 persons aged eighteen or over. East Berlin is included with eastern Germany and West Berlin with
western Germany. Columns may not sum to 100 because of rounding.b. “Transferred” refers to those who emigrated or who began commuting to western Germany but report working for the same
employer as before.
96. Pischke, Staat, and Vögele (1994) also observe this in the Arbeitsmarktmonitordata for 1991.
0332-02-Burda 1/3/02 15:30 Page 55
moved either their home or their workplace to the west were commuters.Thirty-one percent of commuters (19 percent of all movers) were trans-ferred, whereas 19 percent of emigrants (7 percent of all movers) weretransferred, and the share of transferred commuters rose over time.
Commuters tend to work in the west for a less extended period thanemigrants live in the west, however, and they account for only 35 percentof mover time in the west (total years spent in the west by emigrants andcommuters combined). In the GSOEP data, the number of commuters whostop working in the west is 64 percent of the number of commuters whostart working in the west in the same period (1990–99). If commuterswho ultimately emigrate are included in the sample, the proportion ofcommuters who cease commuting is 73 percent. Calculations that we per-formed (but that are not reported in detail here) indicate that transferredcommuters stay a shorter time in the west than do ordinary commuters,suggesting that many have been sent by their firm temporarily for train-ing or experience in the west.
The number of easterners moving back from the west is 29 percent ofthe number emigrating to the west. This number is sensitive to the use ofthe sample weights: the unweighted ratio is 18 percent. The unweightedratio is likely to be an underestimate, however, since movers are morelikely to be lost by the survey than stayers, and double movers even morelikely. There is thus substantial return migration of 18 to 29 percent, butmost emigrants have remained in the west.
Consistent with the theory developed in the previous section, we findstrong evidence of sizable wage gains by migrants. Table 19 shows realwage growth (the ratio of wages in two consecutive years) for stayers andfor all mover types among eastern Germans. Commuters, who benefitedfrom the low consumption prices in the east, doubled their monthly wagesby working in the west. This compares with average wage growth of14 percent for stayers. Transferred commuters gained much less, 31 per-cent on average, because they were earning western wages to start with.Emigrants gained 83 percent on average. (This estimate is sensitive toweighting. Their unweighted wage growth is 51 percent.) As a check, thewage growth for those who stop commuting or who return to live in theeast is also reported, despite the small sample. Returning commuters expe-rience wage growth of only 2 percent (again compared with 14 percentfor stayers), whereas returning emigrants lose almost a third of their wage.Wage growth slowed considerably in the latter part of the decade.
56 Brookings Papers on Economic Activity, 2:2001
0332-02-Burda 1/3/02 15:30 Page 56
Determinants of Migration
Up until the parliamentary elections in East Germany in March 1990,the main motivation for emigration was political, with family reunificationsecond in importance.97 At that point it became clear that reunificationwould come rapidly, and economic reasons became dominant. Any analy-sis with the GSOEP data begins shortly after this change, whereas anyanalysis with state-level data from government sources begins in 1991,when emigration was still high but past its peak.
Hunt, using the GSOEP to follow individuals, conducted a detailedanalysis of which easterners emigrate and which commute.98 Three com-mon types of mover are young people moving to study in the west, ter-tiary education graduates who move immediately after graduation, andpeople who have recently been laid off. The updated GSOEP data showthat movers of all kinds are on average eleven to fifteen years younger thanstayers, and that 30 percent of commuters and 15 percent of emigrants
Michael C. Burda and Jennifer Hunt 57
97. See the references to surveys of emigrants in Grundmann (1998).98. Hunt (2000).
Table 19. Real Wages of Easterners Working in Western Germany and Returnees, 1990–99a
Source: Authors’ calculations based on data from the German Socio-Economic Panel.a. Change computed only for individuals aged eighteen or older with nonzero wages in both years. East Berlin is included
with eastern Germany and West Berlin with western Germany. Standard errors are reported in parentheses.b. “Transferred” refers to those who emigrated or who began commuting to western Germany but report working for the same
employer.
0332-02-Burda 1/3/02 15:30 Page 57
have recently been laid off, compared with 6 percent of stayers. People liv-ing in a county on the border with the west tend to commute rather thanemigrate. East Berliners are an exception, since they both commute andmigrate more than nonborder residents. People living around West Berlinmake up 32 percent of commuters and 35 percent of transferred com-muters (in years where they can be identified, those commuting once aweek make up one-third of commuters).99
The data on individuals cannot be used to distinguish factors at homethat push emigrants out from factors in the destination that attract workers.For this it is necessary to use the aggregate data on gross flows betweenstates, and variables describing all the states. We present results here thatupdate the analysis by Hunt to include the recent increase in east-westmigration,100 and we extend it by comparing age groups.
The econometric approach we adopt is to use migration flows within thewest as a point of comparison for the magnitude of east-to-west flows.We wish to see whether wage and unemployment variables can explainhow east-to-west flows diverge from within-west flows. We use a fixed-effects model with two dummy variables for each pair of states (one foreach direction):
where M is the number of individuals moving from source state s to des-tination state d, w is the wage, U is the number of unemployed, Tj are yeardummies, and αsd are the fixed effects. The specification allows a qua-dratic relationship in time in east-to-west flows (EW) relative to within-west flows, and linear trends in west-to-east flows (WE) and within-eastflows (EE). Berlin is treated as a special case, neither east nor west; toeliminate clutter in equation 2, we suppress mention of the trends forflows between the east and Berlin and between the west and Berlin (EB,BE, WB, BW).
( )
ln ln ln ln ln
,
20 1 2 3
4 52
6
7
M w w U U
EW t EW t WE t
EE t T
sdt sd st dt st dt
sd sd sd
sd j j j sdt
= + + + ++ × + × + ×+ × + +
α β β β ββ β ββ γ εΣ
58 Brookings Papers on Economic Activity, 2:2001
99. Other papers using GSOEP data to examine emigration include Burda (1993), Burdaand others (1998), and Schwarze (1996).
100. Hunt (2000).
0332-02-Burda 1/3/02 15:30 Page 58
We do not attempt to deal with endogeneity issues. If the path of wages(at least for 1991–93) is viewed as being set exogenously by the laborunions, who chose that wage path in 1990–91, the main endogeneity prob-lems are composition effects and unemployment. Any solutions wouldhave to depend on lagged independent variables, which, given the forward-looking nature of the problem, we feel would be inappropriate. The endo-geneity should bias the coefficients on the economic variables toward zero,and thus make them less able to explain the east-to-west pattern.
The results of the estimation for all ages together are presented intable 20. We present the coefficients on the most important variables,
Michael C. Burda and Jennifer Hunt 59
Table 20. Explaining Migration Patterns with Wages and Unemployment, 1991–99a
Full sampleb Sample Ac Sample Bd
Independent variable 20-1 20-2 20-3 20-4 20-5
EW × years since unificatione –0.204 –0.091 –0.080 –0.081 –0.098(0.014) (0.023) (0.023) (0.027) (0.033)
EW × years since unification 0.023 0.012 0.011 0.011 0.016squared (t 2) (0.002) (0.002) (0.002) (0.003) (0.003)
Source: Authors’ calculations based on data from the German Federal Statistical Office and Bundesamt für Bauwesen undRaumordnung.
a. The dependent variable is the number of internal migrants (expressed in logarithms). Wage data for Bremen are not availablefor 1992. Migration flows, wages, and number of unemployed are expressed in logarithms. All specifications include fixedeffects for each state pair in each direction, year dummies, and terms interacting a time trend and migration direction dummies (allnot reported). Robust standard errors are reported in parentheses.
b. Regressions use flow data for all states and city-states individually.c. Aggregates flow data for Berlin and Brandenburg into one state, and Bremen, Hamburg, Lower Saxony, and Schleswig-
Holstein into another.d. As in the full sample but drops observations for city-states for 1991–93.e. EW is a dummy variable indicating a flow of migrants from east to west.
0332-02-Burda 1/3/02 15:30 Page 59
and at the bottom of the table we calculate the slope, in 1992 and 1998, ofthe quadratic capturing east-to-west flows. The specification reported incolumn 20-1 includes no economic control variables. In 1992 east-to-westflows were falling at a rate of 15.7 log points (14.5 percent) a year,whereas in 1998 they were rising at a rate of 11.9 percent a year. In theregression in column 20-2 we add as independent variables the logarithmsof the source and the destination wages. Wage differentials explain a littlemore than half the 1992 slope (the remaining, unexplained downwardslope is 6.7 percent) and less than half the 1998 slope. Adding sourceand destination unemployment in column 20-3 helps only a little inexplaining more of the trend. The puzzling insignificant coefficient onsource unemployment replicates the results of Hunt and several otherstudies.101
In the remaining two columns of table 20, we run the same regressionon two samples with fewer observations, which we will then use forregressions by age. In the first sample we combine some states asdescribed above (sample A). In the second sample we instead omit obser-vations from the city-states in the early years when the state boundaries areinconsistently defined; this leads to more observations, but fewer in themore interesting early years (sample B). The results for sample A are moresimilar to those for the full sample, and so we present results from thissample for the regressions by age, although the results for sample B aresimilar. The main difference between the sample A and the full-sampleresults is the larger coefficient on the source wage for sample A.
Table 21 presents results of the same regression for three subsamplesgrouped by age: young, prime-aged, and older individuals. The youngerthe group, the more sensitive it is to the source wage. There are no statis-tically significant differences by age in the response to the destinationwage or destination unemployment. Older workers respond statisticallysignificantly in the expected direction to source unemployment: the mainsource of the puzzling coefficient in the table for all ages comes from theyoung, for whom source unemployment has a negative sign but is insignif-icant (the result is significant for sample B, not shown). The results forprime-aged workers are in between.
60 Brookings Papers on Economic Activity, 2:2001
101. Hunt (2000); other studies include Lundborg (1991) for Sweden, Pissarides andWadsworth (1989) for the United Kingdom, and Bentivogli and Pagano (1999) for the euro zone.
0332-02-Burda 1/3/02 15:30 Page 60
Wages and unemployment explain the whole 1992 trend for young peo-ple, two-thirds of the trend for prime-aged people, and most of the smallertrend for older people. Results not presented here show that the explana-tory power comes entirely from wages, as in table 20. One could summa-rize these results by saying that the labor unions were correct in expectingthat high wages would keep people in the east. These results clarify themechanism for this wage effect, first noted by Hunt102; they also explainthe discrepancy between the individual-level results showing that laid-offworkers emigrate and the aggregate results showing that source unem-ployment is not a push factor. Source unemployment apparently only
Michael C. Burda and Jennifer Hunt 61
102. Hunt (2000).
Table 21. Explaining Migration Patterns with Wages and Unemployment, by Age ofMigrant, 1991–99a
Source: Authors’ calculations based on data from the German Federal Statistical Office and Bundesamt für Bauwesen undRaumordnung.
a. The dependent variable is the number of internal migrants (expressed in logarithms). The sample is sample A as describedin table 20. Wage data for Bremen are not available for 1992. Migration flows, wages, and number of unemployed are expressedin logarithms. All specifications include fixed effects for each state pair in each direction, year dummies, and terms interacting atime trend and migration direction dummies (all not reported). Robust standard errors are reported in parentheses.
b. EW is a dummy variable indicating a flow of migrants from east to west.
0332-02-Burda 1/3/02 15:30 Page 61
affects those experiencing a layoff; this is mainly an age group older thanthe eighteen- to twenty-four-year-olds who are most likely to move, sincethe young are typically moving west to study or take a first job. An unre-ported tabulation shows that the average emigrant who has been laid off isfive years older than the average emigrant who has not been laid off(although the sample is small). Thus, in the data on individuals, laid-offpeople emigrate, but the coefficient in the aggregate data is dominated bythe high-emigration young group, which does not respond to layoffs. Thehigh wages may have caused layoffs among older workers early in thetransition but apparently kept young students at home in the hope of latergetting a high-paying job. Thus, on balance, high wages in the east reducedemigration.
Wages and unemployment are less successful in explaining the 1998rise in immigration, accounting in the various specifications and samplesfor at most half the rise, and often less. In this case, however, the explana-tory power of wages and that of unemployment are much more equal. Thefailure of the contemporaneous variables to explain fully the 1998 rise inemigration to the west does not surprise us. A plausible interpretation ofthe upturn is that it reflects a realization that wage convergence will notresume in the near future. The expectation of future relative wages hasbeen adjusted downward in the mean, and the variance of future conver-gence scenarios has fallen, reducing the option value of waiting, that is,of postponing migration.103
All regressions were rerun using the weekly rather than the hourlywage, hence capturing differences in weekly hours. Weekly wages aremore successful in explaining both the 1992 slope and the 1998 slope; forexample, in the regressions for all ages the unexplained 1992 slope isonly –0.016, and the unexplained 1998 slope is 0.060.
Conclusions and Policy Recommendations
The transition in eastern Germany may be viewed as successful alongmany dimensions. Convergence in GDP per capita has exceeded the
62 Brookings Papers on Economic Activity, 2:2001
103. See Bauer (1995), Burda (1995), and O’Connell (1997) for models that apply thenotion of the option value of waiting to the migration decision.
0332-02-Burda 1/3/02 15:30 Page 62
expectations of most economists, convergence in consumption is evenmore impressive, and all institutions of the west have been successfullytransferred, conferring social stability and aiding the economy. However,the gap between consumption and GDP per capita means that the eastremains dependent on transfers from the west, the labor market is still indisarray, GDP convergence has halted, and TFP growth has slumped tobelow the western level and in some states has even turned negative.
Some indicators give grounds for optimism that convergence may soonresume. The almost full convergence of the wage structure, which contin-ued in the last two years for which data were available (1997–99), is anencouraging sign that wages are becoming more flexible. This shouldallow wages across firms and industries to be set more appropriately thanin the past, which should allow more sectoral restructuring, in turn boost-ing employment and efficiency. This is confirmed by the current expansionof activity other than construction, offsetting the sharp decline in that sec-tor. Once the construction decline is complete, the greater wage flexibil-ity should boost employment. Signs that wages are falling overall couldalso presage a rise in employment. Although we believe that wages wouldhave risen quickly soon after reunification because of westward migra-tion and generous social benefits, we argue that labor unions caused themto rise still further. The subsequent weakening of the labor unions in theeast has allowed wages to become more flexible, and higher employmentshould be one of the medium-term benefits. A recession in western Ger-many would naturally postpone these gains.
Our findings suggest some recommendations for policy action to raiseeastern productivity. We find that, controlling for worker characteristics,firm size, and industry (but not capital), the east-west productivity gap isapproximately constant across skill levels. This leads us to search for skill-neutral explanations for the productivity gap, such as inferior infrastruc-ture. Indeed, recent data show that although some types of infrastructureare at least as good in the east as in the west, in other areas the east stilllags behind. Given the public good nature of infrastructure, we recom-mend continued investment in this area. Another intriguing factor thatcould reduce productivity at all skill levels is a deficiency of businessskills. We provide no original evidence on this but believe it warrants fur-ther investigation and possibly policy action. Credit constraints on firmscould also play a role. This notwithstanding, we recommend that the
Michael C. Burda and Jennifer Hunt 63
0332-02-Burda 1/3/02 15:30 Page 63
reduction in subsidies to capital continue, and that distortions that favorcertain sectors for investment or certain types of investor be phased out oreliminated. The nature of past subsidies has led to overinvestment in struc-tures and underinvestment in equipment.104
We find that those who emigrate tend to be better educated and possi-bly better workers in unobservable ways than stayers, which may reduceTFP in the east. These observations would warrant policy action only ifone cared more about the east than about Germany as a whole, sincemigration should increase overall efficiency. Nevertheless, the ongoingefforts to make the eastern universities more attractive to students couldeventually raise eastern TFP, since students are an important category ofemigrant.
In addition to the expectation that more flexibility in the industrial rela-tions system will help unemployment on the demand side, we offer somerecommendations that address other inefficiencies and should allow theeast to use its labor more efficiently. The first is that public training pro-grams be scaled back significantly. As our analysis has shown, it isunlikely that the source of the east’s difficulties is an unskilled labor force.Furthermore, in a series of careful papers, Michael Lechner demonstratesthat these programs have little detectable benefit.105 And despite easternGermany’s high unemployment, we are also uneasy about the role of pub-lic works jobs, despite a cautiously optimistic evaluation of their impact onindividuals by Martin Eichler and Lechner.106 The government feelsobliged to offer 90 percent of the union wage on these jobs, even thoughmany private firms pay less than 90 percent of the union wage for theirindustry. The incentives for individuals who can obtain public works jobsto look for a private sector job are thus not high, and public works jobssurely crowd out private employment, reducing productivity. We thus rec-ommend a gradual reduction in these programs.107
To help on the supply side, we recommend increasing spending on ser-vices offered to the unemployed through the public labor offices. Some
64 Brookings Papers on Economic Activity, 2:2001
104. Our recommendations on infrastructure and capital subsidies echo the recent coun-try report on Germany by the Organization for Economic Cooperation and Development(OECD Economic Survey: Germany, 2001).
105. See, for example, Lechner (2000).106. Eichler and Lechner (1999).107. Here we echo some recommendations of Schmidt and others (2001).
0332-02-Burda 1/3/02 15:30 Page 64
pilot projects already under way are reducing the numbers of unemployedper case worker, and these should be evaluated and extended.108 It is rea-sonable to expect the unemployed to show evidence that they are indeedsearching for work, and we approve of measures taken to limit the abilityof the unemployed to receive benefits after rejecting job offers.
The textbook response to unemployment caused by high wages is awage subsidy. Before making such a recommendation, however, we wouldhave to devote more study to this issue specifically. In his survey of U.S.wage subsidy schemes, Lawrence Katz calls the overall results “highlyuncertain.”109 French wage subsidy schemes are even more difficult toevaluate than those in the United States, since France has several employ-ment promotion projects operating concurrently.110
We have made some other interesting discoveries. First, we have clari-fied the mechanism by which high wages were successful in keeping peo-ple in the east despite rising unemployment. The high unemployment ratespurs those actually laid off to emigrate or commute, but those laid offare generally not in the youngest age group, which has the highest propen-sity to move. High wages in the east convince these youngest easternersto continue studying or looking for a first job there, even if unemploy-ment is high. Thus, even if the sharp rise in wages caused unemployment,it kept people in the east through its effect on mobile youth.
Second, the labor market behavior of eastern female workers is strik-ingly similar to that of eastern male workers, and thus rather different inmany regards from that of western female workers. This similarity iscaused by a combination of several factors: the strong labor force attach-ment of eastern women, their low birth rate, their high representation inpublic sector employment, and a selection effect whereby the lowest paidwere forced to leave employment. The much greater employment diffi-culties of women mean that their labor market outcomes are very unevenlydistributed. They also mean that a return to full employment would bringless skilled women back to work, which would make a TFP measure thatdoes not control for skill appear to fall.
Michael C. Burda and Jennifer Hunt 65
108. See Jerger, Pohnke, and Spermann (2001) for a positive assessment of theMannheim site.
109. Katz (1998).110. Schmidt and others (2001) have argued in favor of wage subsidies and endorsed the
scaling back of active labor market policies in Germany.
0332-02-Burda 1/3/02 15:30 Page 65
A P P E N D I X
Capital Stock Estimates and the Solow Decomposition
HERE WE APPLY a version of the familiar Solow growth accounting methodto the recent growth of both eastern and western German states. Assumethat real gross value added per year Y in state j during period t is gener-ated according to the following constant-returns production function F:
where Kt is the stock of productive equipment and L is the stock of laborinput for i = 1, …, N age classes. The Solow decomposition in this case isgiven by
where the carat denotes the time derivative of the logarithm of the vari-able (which can be approximated by percentage changes), and s denotesthe elasticity of F with respect to each of the two inputs, which undercompetitive conditions in factor markets also equal income shares.
is the relevant measure of total factor productivity, the
Solow residual.
Data
For reasons of data availability, it was only possible to focus on capi-tal and labor as observable production inputs for tracking the sources ofgrowth. In particular, we considered only capital equipment as a mea-sure of capital input. As noted in the text, eastern Germany has experi-enced a massive buildup of structures, especially housing, so that anySolow residual relying on these numbers would be biased downward tothe extent that structures do not contribute to measured GDP. Tostrengthen the case against a TFP slowdown, we omit this variableentirely. In doing so we rely on the evidence adduced by DeLong andSummers (1991, 1992) that productivity and growth effects stem primar-ily from equipment investment.
ˆ ˆ – ˆA Y s Xt t i iti
≡ ∑
( ) ˆ ˆ ˆ ˆ ,A2 Y A s K s Ljt jt K it Li iti
= + + ∑
( ) ( , ,..., ),A1 1Y F K L Lt t t Nt=
66 Brookings Papers on Economic Activity, 2:2001
0332-02-Burda 1/3/02 15:30 Page 66
For the labor input, three different measures were considered. The firstassumes a single homogeneous labor input (N = 1), which is total employ-ment estimated in the German Mikrozensus survey. The second disaggre-gates employment into five age classes (twenty-four years and younger,twenty-five to thirty-four, thirty-five to forty-four, forty-five to fifty-four,and fifty-five to sixty-five); the third considers instead the entire working-age population, using the age classes adopted by the Federal StatisticalOffice (Statistisches Bundesamt; the age classes are eighteen to twenty-five, twenty-five to forty, forty to fifty, and fifty to sixty-five). We use theworking-age population to obtain a crude measure of supply-side potentialand to abstract from currently large differences in participation and unem-ployment rates across regions.
The output, investment, and price data come from the ArbeitskreisVolkswirtschaftsliche Gesamtrechnung der Länder (Working Group forState Income and Product Accounts), or AKVGRL, in Stuttgart. These dataare series of real investment (at 1995 prices) and of output (at current and1995 prices) for all sixteen states from 1991 to 1998.111
Estimating Capital Stocks in Eastern Germany
One important limitation of the data is the lack of publicly availableestimates of the capital stock for the individual eastern German states(Berlin, Brandenburg, Mecklenburg–Western Pomerania, Saxony, Saxony-Anhalt, and Thuringia). Here we describe several approaches for estimat-ing real capital stocks comprising both equipment and structures, publicand private. It should be noted that the Solow analysis will focus on equip-ment capital stocks, although the method described below will be appliedto both equipment and structures.
Capital stocks were estimated for each eastern state in each year usingavailable investment data for equipment and structures. The first issue isthe relevant transition equation for the capital stocks. For lack of a betteralternative—statistical agencies employ detailed information on vintagesand estimated lifetimes of equipment, but these were not available to us—
Michael C. Burda and Jennifer Hunt 67
111. The limited availability of investment data for the west is related to the introduc-tion of the new European System of National Income Accounts, which, as in the UnitedStates, modifies traditional investment data to include spending on software and relateditems.
0332-02-Burda 1/3/02 15:30 Page 67
we estimated depreciation rates using data for the western German statesreported by the Federal Statistical Office over the period 1991–98 (at 1991prices, from the old national income accounts). In particular, let Kt be thestock of capital at the end of period t available for use in production int + 1 (where t is a year), and let It be the flow of investment purchases overperiod t. Depreciation rates were estimated as the ordinary least squarescoefficients resulting from regressing (∆Kt – It) on Kt–1. The results were asfollows (standard errors are in parentheses):112
The second issue is that of the boundary condition for the estimation.One approach is to assume some initial condition sufficiently far back intime to be largely irrelevant.113 Another is to impose a long-run conditionon the average capital-output ratio implied by the resulting estimate, butthis is clearly inappropriate in an economy in transition. Furthermore, theremarkably poor condition of information on the value of the eastern cap-ital stock makes it impossible at present to assess how much of the pre-1990 capital stock is still in use, not to mention its market valuation, atthe state level. We proceed nonetheless under the assumption that it ismore important to set a bound on possible errors than not to generate anyresults at all.
In a first set of capital stock estimates, we simply impose the boundarycondition that the value of eastern German equipment was zero in 1990.This is likely to be an underestimate, since some capital, especially struc-tures, dating from before the fall of the Wall is still in use today. A secondset of estimates assumes that the eastern German states reached a level ofequipment capital intensity (K/Y) equivalent to that in the western Ger-man state with the lowest capital intensity in 1998, namely, Bavaria (0.89).The second method attributes all of the observed east-west productivity
68 Brookings Papers on Economic Activity, 2:2001
112. It is surprising that the depreciation rate for structures exceeds that for equip-ment. It suggests that depreciation in the German accounts used to estimate the capitalstocks may come from financial data reported to the tax authorities (which are acceleratedfor certain types of structures).
113. The capital stock at t + 1 is given by Kt+1 = (1 – δ)Kt + It = (1 – δ)i Kt–T + Σ0
T–1(1 – δ)i It–i.
0332-02-Burda 1/3/02 15:30 Page 68
gap in 1998 to TFP differentials. Thus, by the end of 1998, the capital-output ratios in all states are assumed to have converged to that of Bavaria.In this case the benchmark calculation simplifies to
K*E = (K/Y)BavariaYE.
Using this method generates the following benchmark values of K/Y:
The second approach is likely to result in an overestimate, since someconvergence of productivity at a given capital endowment has certainlyoccurred: some eastern German plants are now more productive than theirwestern counterparts. It does, however, reflect an increasingly widespreadopinion that the east has already accumulated an adequate physical capi-tal stock and that its problems lie elsewhere.115 Nevertheless, it is possi-ble, using these estimates, to backcast an implicit value of the 1990 capitalstock consistent with the observed investment series and our depreciationrate for equipment. We will consider these two estimates of the initialcapital stock as extremes that set a bound on actual performance in theeastern German states, at least for equipment. We use 7.52 percent as thedepreciation rate in estimating the two series for the eastern Germanequipment capital stocks, which we denote henceforth as and .
For consistency we applied the same estimation technique to the west-ern data, using the 1990 year-end values of the capital stocks, with a pricedeflator adjustment, as initial conditions. As a check we also conducted theanalysis using discontinued western capital stock data, at 1991 prices,constructed by the Federal Statistical Office.
KK
Michael C. Burda and Jennifer Hunt 69
114. A third set of estimates, not presented here, assumes that the remaining produc-tivity gap in 1998 in eastern vis-à-vis western Germany is a function of a deficient capitalintensity only. Assume a common Cobb-Douglas technology in both regions in 1998, so thatthe ratio of labor productivities θi with respect to some benchmark western state W is givenby (Y/L)i/(Y/L)W = [(K/L)i/(K/L)W]α = [(K/Y)i/(K/Y)W]α/(1–α). Setting α = 0.27, the equationfor the benchmark year 1998 is K*
E = θ(1–α)/α(K/Y)WYE . This approach led to low capital-output ratios in 1998 and, in half of the cases, to negative initial values of the capital stockin 1990. Evidently, the assumption of common technology is rejected by the data.
115. See Ragnitz (2000, 2001) and Heimpold (2001).
0332-02-Burda 1/3/02 15:30 Page 69
There is a remarkable variance of K/Y among the western states, origi-nating almost entirely from structures, which we take to reflect differinghousing stocks and population densities. This vindicates our exclusion ofthis variable from the analysis, since it is not a first-order indicator offuture productive potential (DeLong and Summers, 1991, 1992).
Solow Decomposition over Time and Space
Using the data generated above, we then carried out the Solow decom-position exercise given by equation A2 for the single homogeneous laborinput, for labor disaggregated by age, and for the working-age populationdisaggregated by age. Only the results for are reported, since thesewould tend to be less biased toward detecting a productivity growth slow-down. Factor shares were estimated from the GSOEP and from the Ger-man national income and product accounts.116 The output data correspondto those reported in AKVGRL (2001) for gross value added less subsidiesand net interest. These data span the period 1991–2000. For the westernstates, output data are available before this but do not correspond to thenew European System of National Accounts. For lack of a better alterna-tive, we simply chained the pre-1991 output data after equating the val-ues of both series in 1991.
We also used a spatial variant of the Solow calculation, explaining devi-ations in the logarithm of output across units at a given point in time ratherthan accounting for increments to output over time.117 The advantage ofthis approach is that it yields levels of multiplicative TFP as an immedi-ate result; its main disadvantage is that it is much more sensitive to mea-surement errors in the capital stock data, which are differenced away in thetime-based Solow procedure. The approach also imposes a common pro-duction function on the two regions, which strictly speaking is not neces-sary for computing TFP growth with individual units. For the jth sector,then, we have
K
70 Brookings Papers on Economic Activity, 2:2001
116. The national capital and labor shares are averages over the period 1991–99, takenfrom Sachverständigenrat zur Begutachtung der gesamtwirtschaftlichen Entwicklung(2000), and equal 0.274 and 0.726, respectively.
117. Robert Hall suggested this approach during the general discussion of the paper atthe Brookings Panel conference, and Janet Yellen employs essentially the same approachin the back-of-the-envelope estimates of TFP gaps presented in her comment.
0332-02-Burda 1/3/02 15:30 Page 70
where sK and sLi now represent arithmetic averages of the eastern and west-ern factor shares. We were not able to obtain factor shares information byage group at the sectoral level, and so we approximate it by taking thenational values employed in the computation of the time-based Solowresiduals. Since production is linear homogeneous, equation A3 can berewritten with one type of labor as
Using Ragnitz’s (2000) estimate of the east-west K/L in 1998 for miningand manufacturing (0.955), the east-west ratio of labor productivity (perperson employed) in the same year (0.723), and a value for sK of 0.274,we obtain a value for the left-hand side of equation A4 of ln(0.72) –(0.274) × ln(0.955) = –0.3117, which yields an east-west TFP ratio ofexp(–0.3117) = 0.732. Clearly, at given factor shares, the capital gap mustbe large to explain much of any productivity gap.
( ) ln ln/
/– ln
/
/.A4
A
A
Y L
Y Ls
K L
K LjWEST
jEAST
jWEST jWEST
jEAST jEAST
KjWEST jWEST
jEAST jEAST
=
( ) ln ln ln ln ,A31
A
A
Y
Ys
K
Ks
L
LjWEST
jEAST
jWEST
jEAST
KjWEST
jEAST
LijiWEST
jiEASTi
N
=
−
+
=
∑
Michael C. Burda and Jennifer Hunt 71
0332-02-Burda 1/3/02 15:30 Page 71
Comments and Discussion
Holger Wolf: This paper by Michael Burda and Jennifer Hunt takes a thor-ough and instructive look at labor market developments in eastern Ger-many over the last decade, ending on a refreshingly optimistic note.
One of the debates at the beginning of the unification process concernedthe relative economic merits (or demerits) of transition with and withoutunification. Ex post, the glass is both half full and half empty. Sustainedfiscal transfers have avoided a consumption slump; indeed, consumptionper capita has increased consistently to reach the preunification standard inthe former West Germany. Public sector infrastructure investments, partlyfinanced by these transfers and the diffusion of market economy exper-tise and integration into the European Union, have also provided the for-mer East Germany with substantial competitive advantages relative to theother central European transition economies. Following a very sharp initialdecline, growth performance since 1991 has been in line with that in theother transition economies.
Yet unification, which largely took the form of East Germany adopt-ing West German institutions, also imposed costs. Although this provedhighly advantageous in some fields, including accounting and taxation,institutions in other sectors were not adapted to the special needs of a tran-sition economy. In particular, the western German labor market systemwith its low degree of wage differentiation was quite inappropriate forthe conditions of an early-stage transition economy. Coupled with thestrong political push for income equalization and the initial lack of capi-tal, job losses far exceeded those in other transition economies, althoughthe social consequences were buffered by the extension of the socialsafety net.
72
0332-02-Burda 1/3/02 15:30 Page 72
A second early debate focused on likely convergence scenarios. Underthe neoclassical scenario, integration would lead to rapid convergencedue to factor mobility and the free flow of technology. A less optimisticscenario envisaged a small, lower-productivity economy joining a larger,high-productivity economy enjoying economies of scale, and ending uplosing its manufacturing sector and specializing in sectors with relativelyslow productivity growth.
The aggregate evidence on convergence suggests an initial spurt fol-lowed by a stabilization of relative productivity in eastern Germany at alevel significantly below that in western Germany, alongside a dramaticrelative shrinkage of the manufacturing sector and a relative underrepre-sentation of large firms. Is this cause for concern? After all, certain regionsin other countries have displayed prolonged gaps in total factor produc-tivity. Why, then, should one be surprised at, or concerned about, a per-sistent productivity gap between eastern and western Germany? Yeteastern Germany is arguably different from Appalachia or the Mezzo-giorno, for two reasons. First, whereas those regions have a long history ofGerschenkronian relative backwardness, and may thus be seen as sufferingfrom other growth-impeding factors, large areas of eastern Germany hadbeen part of the industrial heart of prewar Germany. Second, there havebeen few historical instances of as large and as rapid an increase in thecapital-labor ratio as in eastern Germany over the last decade, with cumu-lative investment per worker close to $100,000.
How believable are the data on convergence? A few points are note-worthy. The first concerns the point of reference. The original expecta-tion—and hope—voiced after the breaching of the Berlin Wall was that theeast would soon attain Western living standards, which one might interpretas the western German living standard at the time. A decade later, easternGermany has in fact reached the material living standards of West Ger-many in 1989, and even productivity is catching up to the West Germanlevel of that year. A good part of the remaining gap thus reflects not somuch subpar growth in eastern Germany, but rather the acceleration ofgrowth in western Germany since unification. This was, of course, endoge-nous: the lion’s share of the transfers from western to eastern Germanywas spent on goods produced in western Germany, generating a first-orderdemand effect.
Second, statistical problems must be kept in mind. Some data, in par-ticular those for initial GDP per capita, are subject to a wide confidence
Michael C. Burda and Jennifer Hunt 73
0332-02-Burda 1/3/02 15:30 Page 73
interval, as is, consequently, the measured speed of convergence; the con-vergence picture is also somewhat rosier when data based on the EuropeanSystem of National Accounts are used.
Third, differentiating the convergence pattern by sector as well as bystate reveals dramatic differences. The early 1990s witnessed both a rapidexpansion of public sector construction and a private construction boom,partly reflecting very generous tax provisions. Measured productivity rosesharply. Following the winding down of the construction boom in the sec-ond half of the decade, however, some of the initial gains have beenreversed. To what extent this measured productivity increase should beinterpreted as organic convergence, rather than as a temporary marginexpansion, is an open question. The public sector likewise displayed rapidinitial convergence in measured productivity, partly reflecting productivitygains, but partly reflecting the push toward wage equalization. Followingwage equalization, relative measured productivity has been stable.
Much of the initial sharp increase in measured productivity, as well asa good deal of the subsequent stagnation, reflects developments in thesetwo sectors, both of which are arguably influenced by one-time factors. Asharply different picture emerges for the manufacturing sector, which,after an initial steep decline, has shown more steady, if small, productiv-ity gains. To the extent that one believes that the convergence in produc-tivity primarily reflects technological adaptation rather than wageagreements or public construction programs, the convergence picturelooks rather more promising, although the importance of manufacturing intotal output has sharply declined.
A very interesting part of the paper is the attempt to estimate produc-tivity gaps between east and west. The approach is based on a regressionlinking wages to observable characteristics within western Germany.Applying the regression coefficients to the characteristics of eastern Ger-man workers permits the computation of the hypothetical wage that theseworkers would be earning in western Germany. Comparing these hypo-thetical wages with actual wages results in an estimate of the residualproductivity gap at each skill level. The authors find that this gap hasshrunk over time for all skill levels but remains significant.
The methodology rests on strong assumptions, notably that differencesin characteristics provide significant explanatory power for wages in west-ern Germany; that the same characteristics are relevant, and have the samerelative importance, for eastern as for western workers; and that actual
74 Brookings Papers on Economic Activity, 2:2001
0332-02-Burda 1/3/02 15:30 Page 74
wages reflect individual productivity. Although the explanatory power ofthe wage regression allows one to gauge the validity of the first assump-tion, the other two are more difficult to assess. In this light, the evidencethat convergence is substantially less apparent for jobs requiring rela-tively high skill is of interest, given the paper’s observation that firm head-quarters are relatively underrepresented in the eastern states, suggesting arelative scarcity of managerial jobs.
Janet Yellen discusses many of the potential explanations of the remain-ing productivity gap. One that might be added, and which Michael Burdamentioned in his presentation, is migration. In particular, if, among a set ofindividuals with the same measurable characteristics, those with the high-est overall productivity (including productivity differences not attributableto measurable characteristics) are more likely to move to the west, a sys-tematic bias may arise. On the other hand, the inverse argument appliesto the policies used to reduce labor supply: one might suppose that, againamong a subgroup of individuals with the same observable characteristics,those with the lowest productivity might have been more likely to availthemselves of financial incentives to leave the labor force.
The authors make a convincing case against a capital stock gap as acomplete explanation of the remaining productivity gap. Here a sectoralperspective might again be worthwhile, as tax incentives and the initiallyhigh relative unit labor costs have tilted the production structure towardrelatively more capital-intensive sectors.
In conclusion, the paper presents an excellent discussion of the evolu-tion of labor market institutions and performance in the decade after uni-fication, painting a refreshingly optimistic picture. Going forward, one ofthe most interesting questions is whether the reform of labor markets frombelow that the paper documents will mitigate the persistent unemploymentproblem, particularly among lower-wage workers.
Janet L. Yellen: A decade ago, economists debated whether eastern Ger-many would become another German Wirtschaftswunder or, instead,another Mezzogiorno. This fascinating paper details the verdict, which isthat both extreme views were simultaneously right and wrong. The authorsshow that substantial progress was made between 1991 and 1995 in clos-ing the productivity gap with western Germany.
But then productivity growth stalled. A gap of around 25 to 30 percentstill remains. Growth accounting shows that the remaining gap is mainly
Michael C. Burda and Jennifer Hunt 75
0332-02-Burda 1/3/02 15:30 Page 75
due to lower total factor productivity than in the west. Eastern wages fol-lowed a path similar to productivity, rising rapidly following unification,then stabilizing at around 75 percent of western levels after 1995. The skillstructure of wages in the east also changed after unification. Whereas ini-tially wage inequality was lower than in the west, now the return to skillis strikingly similar. All is not well in the labor market, however: employ-ment has declined, labor force participation is down, and unemploymenthas risen to about 19 percent of the work force. A higher nonemploymentrate in the east than in the west translates into a gap in GDP per capitathat exceeds the gap in productivity. The shortfall in consumption percapita (about 27 percent) is smaller than the gap in GDP per capita (about35 percent), however, thanks to substantial and continuing social insurancetransfers from the west. With high unemployment and a continuing wagegap in the east, net migration to the west continues, particularly amongyoung people, but the pace of outward migration has slowed substantially.
The authors pose three interesting questions concerning these develop-ments: Why did productivity rise rapidly, then stall? Why does unem-ployment remain stubbornly high? Did high eastern wages diminishoutmigration or increase it? I will discuss the authors’ analysis of each ofthese issues.
Why did labor productivity rise rapidly, then stall? The collapse of theBerlin Wall triggered three adjustments, which were responsible for therapid productivity gains that followed: massive capital spending financedby the west, the closure of unproductive eastern German firms, and aninflux of ideas. In 1991 labor productivity in the east was 44 percent ofwestern levels. Very little of the gap, in the authors’ estimation, reflected ashortfall in human capital: eastern German levels of education and train-ing were close to, indeed arguably higher than, those in the west. But asubstantial portion of the gap reflected the huge shortfall in physical cap-ital. As soon as the Wall collapsed, western Germany began the expen-sive task of rebuilding the east. It provided massive support, whichcontinues today. Aggregate investment between 1991 and 1998 exceededDM 1.5 trillion and averaged over DM 11,000 per eastern German resi-dent a year. Some 30 percent of this consisted of equipment investment(according to the authors’ table 5). Large investment subsidies inducedsome prominent western German firms to establish capital-intensive facil-ities in the new states.
76 Brookings Papers on Economic Activity, 2:2001
0332-02-Burda 1/3/02 15:30 Page 76
To apportion the improvement in eastern German productivity after1991 between factor accumulation and TFP, the authors perform a stan-dard growth accounting analysis. Their analysis focuses on equipmentinvestment, ignoring structures, but their conclusion, that the bulk of theremaining productivity gap—about 28 percent—is due to TFP, is quiterobust. Consider, for example, a back-of-the-envelope exercise using arecent estimate that, by 1998, capital per worker (including both equip-ment and structures) had reached 76 percent of western levels.1 With anassumed capital share of one-third, a 24 percent shortfall in capital perworker translates into only an 8 percent shortfall in output per worker.The remainder of the current productivity shortfall—the lion’s share, about20 percent—must be due to TFP.
In addition to triggering a surge of investment to rebuild the east, uni-fication produced an improvement in TFP through two separate channels.The first channel involved rapid liquidation of unproductive eastern activ-ities. The Treuhandanstalt was charged with privatizing eastern industry. Itaccomplished its task quickly, closing or downsizing inefficient operationsin the process. Since eastern German wages were high at the outset andscheduled to rise to parity with the west, very few eastern jobs turned outto be viable. A significant portion of the initial TFP surge thus reflectedone-shot gains from closing low-productivity eastern activities.
I witnessed an example of this survival of the fittest on a 1991 visit tothe Eisenhüttenstadt Steel Works. The old part of the mill, which hademployed most of the workers, was an idle, rusting hulk. Production con-tinued in the far corner of the mill, sparsely staffed and controlled by com-puter. This remaining portion of the plant contained equipment recentlypurchased from Austria. It awaited sale to a western buyer. This steel millat Eisenhüttenstadt is paradigmatic of the eastern German manufacturingsector as a whole: out with the old, preserve the new, and reap very largegains in productivity, as manufacturing shrinks rapidly in size. Between1991 and 2000, labor productivity in manufacturing relative to the westmore than tripled.
The collapse of the Wall also raised TFP through a third mechanism:the importation of new ideas, new methods of production, and new inputs.The Wall had placed constraints on the movement of ideas and inputs,
Michael C. Burda and Jennifer Hunt 77
1. Ragnitz (2000).
0332-02-Burda 1/3/02 15:30 Page 77
not just on the movement of people. When it came down, western firms,managers, ideas, and equipment went east. Firms were quickly reorga-nized, raising efficiency. New firms were established in the east to satisfygrowing (western-subsidized) eastern German spending on nontradablesand for construction. Productivity improved where eastern firms weretaken over by western enterprise. It also improved in eastern enterprises.For example, by 1996 the fraction of self-employed service workers in theeast was comparable to that in the west. Service productivity hadimproved substantially.
The authors regard the remaining 30 percent gap in productivitybetween east and west as a puzzle, and they postulate several reasonableexplanations. One is that eastern products often sell at a discount. Theauthors wonder why the deficiencies in marketing skills that this suggestshave not been remedied in the eleven years since monetary union.
But should we be surprised at the persistent gap in productivity? Ininternational perspective the remaining TFP gap is modest. For example,Robert Hall and Charles Jones, using 1988 data, estimated that TFP inGermany was 10 percent below U.S. and Canadian levels, 15 percentabove levels in Norway and Denmark, and almost 20 percent above levelsin New Zealand and Japan—all advanced industrial countries.2 Evenwithin Germany, income per capita in Hamburg and Bremen exceeds thenational average by 71 percent and 35 percent, respectively. Income percapita in Connecticut is almost twice that in West Virginia.
In addition, manufacturing makes up a larger share of output in west-ern than in eastern Germany, and TFP growth is probably higher in man-ufacturing than in services. In a neoclassical model, with integrated capitaland labor markets, divergent TFP across sectors is compatible with factorprice equalization but requires a trend increase in the relative prices oflow-productivity products—in other words, terms-of-trade effects. Theauthors’ table 8 presents estimates of such effects, but they appear to be fartoo small to explain the gap.
Agglomeration effects and intangible assets are probably more impor-tant than industry mix effects in explaining the remaining TFP gap. Weknow that firms locate in cities such as San Francisco, New York, andBoston despite their high rents, to take advantage of their specialized busi-ness services and networks. The inferior quality of business services in
78 Brookings Papers on Economic Activity, 2:2001
2. Hall and Jones (1996).
0332-02-Burda 1/3/02 15:30 Page 78
eastern Germany is thus a telltale. And there is little evidence that west-ern firms are moving production to the east to take advantage of lowercosts. The main motive is apparently to sell in eastern markets and, insome instances, to take advantage of large investment subsidies—the Mezzogiorno phenomenon.
A third explanation for the remaining TFP gap is that there is an easterndeficit in intangible assets: brands, organizational or specific human capi-tal, loyal or locked-in customers, intellectual property (including patents),and deep business networks. Eastern Germany’s intangible investmentswere largely wiped out with the fall of communism, because East Ger-many’s industries had catered to Russian and Eastern European clients.The 1991 study by George Akerlof and others found only a single easternGerman firm outside the energy sector that would clearly be profitableafter unification.3 That firm, the State Porcelainworks of Meissen, hadintangible assets accumulated over three centuries. The authors note thateastern German firms are smaller, younger, less established, and more spe-cialized in nontradable goods. And their table 15 reveals a huge firm-sizeeffect on wages, suggesting that small firms, because of their lower pro-ductivity, cannot afford higher wages. Interestingly, the authors note thatone researcher (Joachim Ragnitz) finds that small firm size explains17 percent of the raw productivity gap. This pattern reflects an easternGerman “intangibles” gap.
Why does unemployment remain so stubbornly high? The existence ofchronic, large-scale involuntary unemployment in eastern Germany, inmy view, can have only one interpretation: wages exceed their market-clearing level. Surprisingly, the authors come to this conclusion only reluc-tantly: they say that “despite the difficulty of demonstrating it concretely. . . [they] are inclined to believe that wages have risen too fast.” One rea-son for their reluctance is that they find no “conclusive evidence from rel-ative wages or employment of distortionary effects of wage floors, bethey union wages or welfare benefits.”
The authors note that just before and immediately after unification,unions won huge wage increases, bidding wages well above market-clearing levels. They document, however, that union membership has sincedeclined—from about 51 percent to 33 percent of eastern workers—alongwith membership in employers’ associations. Wage agreements are
Michael C. Burda and Jennifer Hunt 79
3. Akerlof and others (1991).
0332-02-Burda 1/3/02 15:30 Page 79
frequently being struck outside the bargaining framework, and conces-sion bargaining is increasingly common. With the unions’ influence havingwaned, the authors see few barriers now to the attainment of market-clearing wages.
However, unions are not the only reason why wages might be too highto clear the market. Initial conditions—high wages at unification coupledwith the promise of rapid equality with the west—have surely left a markon the labor market. The growing prevalence of concession bargaining inthe east provides evidence that wages are still too high, not that they aremarket clearing. In his interviews at Connecticut firms, Truman Bewleyfound that firms almost never cut wages until they are on the brink of bank-ruptcy.4 The low levels of job changing in eastern Germany are further evi-dence that wages are above market-clearing levels: those lucky enough tohave jobs are reluctant to leave them.
Efficiency wage models offer many reasons why firms might pay wagesin excess of what would clear the market: social custom, ability to pay,fairness considerations, insider-outsider considerations, and the need tomotivate hard work. In our 1990 survey of workers in eastern Germany, forexample, 76 percent considered it unfair for western German firms that setup enterprises in eastern Germany to pay lower wages than in the west,even in the presence of high unemployment.5 On the other hand, they didnot consider it unfair for wages generally to be below the western Ger-man level, and they were willing to take large wage cuts to obtain work.Indeed, the finding by Burda and Hunt of a huge effect of firm size onwages suggests that wage bargains may reflect “ability to pay.” Profitable,modern western German firms are expected to pay western wages, butstruggling eastern German firms can continue to pay the lower wages theyneed to survive.
The authors dismiss the possibility that high unemployment benefitscontribute to unemployment, on the grounds that the unemployment isinvoluntary, not voluntary. However, in richer models of wage determi-nation, such as the Shapiro-Stiglitz worker discipline model, unemploy-ment insurance benefits affect wage bargains and the level of involuntaryunemployment in equilibrium. In the Shapiro-Stiglitz model, firms pay apremium above workers’ reservation wages to create a surplus that moti-
80 Brookings Papers on Economic Activity, 2:2001
4. Bewley (1999).5. Akerlof and others (1991).
0332-02-Burda 1/3/02 15:30 Page 80
vates hard work. If eastern workers can claim high unemployment benefitsrelative to their productivity, this could partly account for high easternwages and involuntary unemployment.
Another reason why the authors believe that market forces are operative inthe eastern labor market is that they find that the return to skill and the degreeof wage inequality in the east have greatly increased. Indeed, they now mir-ror western patterns at the time of unification. Such large increases in inequal-ity should have been expected, however, if only because income equalityhad been such a special priority in the former East Germany. The similarity ofwage patterns between east and west, although an interesting surprise, doesnot necessarily indicate that wage levels are market clearing.
The recognition that wages have exceeded market-clearing levels sincethe outset of the transition produces a different view of the convergenceprocess from that summarized in the authors’ figure 1. In the authors’framework, integration creates the incentive for capital to move east andlabor to move west, with the ultimate scale of eastern economic activityhinging on the speed of adjustment (although a chronic TFP gap is incon-sistent with wage equalization). The authors cite an “increasingly wide-spread opinion that the east has already accumulated an adequate physicalcapital stock and that its problems lie elsewhere.” The paper documentsthat investment in the east has been sufficient to raise the eastern equip-ment capital–output ratio to western levels, so that a shortage of capitaldoes not primarily account for the remaining productivity gap. But a dif-ferent perspective suggests that investment has been inadequate in east-ern Germany.
Eastern Germany needed enough investment to create jobs for its entirework force, not just enough to attain western capital-output ratios in thefew enterprises that were viable. With eastern wages excessive, very fewjobs could profitably be created. It is true that, when western firms wenteast, typically with large capital subsidies, they established operationssuch as automobile assembly plants that were similar in capital intensity totheir western counterparts. But these investments provided only a handfulof jobs. The authors’ table 5 provides additional evidence that investmentwas insufficient in the east. It shows that eastern investment per capita,as opposed to per worker, exceeded the level in the west by only 19 percentwhen housing and infrastructure are included. Equipment investment percapita was actually lower in the east. My conclusion is that high wages dis-couraged and continue to discourage the investment that is needed for job
Michael C. Burda and Jennifer Hunt 81
0332-02-Burda 1/3/02 15:30 Page 81
creation. A telltale sign is that, contrary to the usual factor price equaliza-tion mechanism, labor-intensive businesses in the west are not movingeast. A simple calculation suggests that, with a 20 percent TFP gap and a25 percent wage gap, the marginal rate of return to capital in the east isno higher than in the west. Not surprisingly, a major complaint of easternfirms is that unit labor costs are too high.
Did high eastern wages diminish migration or increase it? The finalquestion that the authors address is whether high eastern wages kept peo-ple in the east. Their conclusion is unambiguous: “labor unions were cor-rect in expecting that high wages would keep people in the east. . . . onbalance, high wages in the east reduced emigration.” This conclusion relieson a set of interesting regressions using data from the German Socio-Economic Panel to examine the determinants of migration among Ger-man regions. The regressions show that young people are sensitive to wagedifferentials and insensitive to (or perversely affected by) source unem-ployment. Older workers, in contrast, respond significantly to sourceunemployment, and a substantial share of migrants are workers who havebeen laid off.
The authors’ disaggregated results are entirely plausible and accordclosely with the survey findings of Akerlof and others concerning migra-tion intentions a decade ago. Eastern Germans appear to have behaved justas they themselves anticipated back then. But I am uncertain that the authors’conclusion—that high wages kept eastern Germans home—automaticallyfollows. For although high wages may have deterred young people fromgoing west, they also caused high unemployment, driving nonstudents tomigrate. The net impact of wages on migration requires an assessment, whichthe paper does not undertake, of which effect was larger. In sum, I think weshould be quite cautious in accepting the conclusion that, for eastern Ger-many as a whole, higher wages meant less rather than more emigration.
In conclusion, the authors have done an outstanding job of asking theright questions about convergence and providing a wealth of data andanalysis on which to base judgments. They conclude on an optimisticnote that convergence may soon resume, encouraged by signs of growingwage flexibility. I remain skeptical. The TFP gap will take a long time toclose. And with wages above the market-clearing level, the return to capi-tal is too low to spur enough investment in eastern Germany to absorbunemployed workers. Young people seem likely to migrate, on net, forthe foreseeable future.
82 Brookings Papers on Economic Activity, 2:2001
0332-02-Burda 1/3/02 15:30 Page 82
General discussion: Much of the discussion centered on the applicabil-ity of Solow growth accounting to the eastern German transition. StevenDurlauf wondered whether the standard tools are appropriate in this case.Observing that the paper’s analysis could have been applied equally wellto differences between upstate and downstate New York, he expressed con-cern over the lack of attention to what might be called post–Iron Curtainexceptionalism. In particular, he questioned the appropriateness of usingthe Solow model for productivity calculations when the economic envi-ronment in eastern Germany appeared to violate at least two of the model’sunderlying assumptions, namely, competitive factor markets and a time-invariant production function augmented by technical progress. Mostresearch, he noted, finds factor markets in eastern Germany to be uncom-petitive, and it is likely that preunification East Germany was far from theefficiency frontier. The sheer magnitude of social and economic reorgani-zation in the decade following unification is itself inconsistent with thenotion of a stationary production function. Hence it is not likely thatgrowth in the first part of the period is well described as movement alonga production function with factor accumulation, shifted by the normal evo-lution of technology. The reorganization of production could be treated asa nonstationarity in the production function’s evolution over the 1990s: theearly convergence could be captured by an outward shift, and the subse-quent slowdown seen as a return to the normal growth process, with dimin-ishing returns from factor accumulation. But conventional growthaccounting would not do a good job of explaining what was going on dur-ing the early transition.
William Nordhaus agreed with the thrust of Durlauf’s remarks. Hementioned four potential problems with using the Solow model in the east-ern German setting. First, the Solow model is basically a representative-firm economy in which changes in output are explained with changes incapital and labor, whereas much of the productivity increase in easternGermany has resulted from a dramatic wringing out of large, inefficientfirms. This phenomenon is quite different from changes in factor quantitiesor the normal process of technological advance. The reduction in averagefirm size in eastern Germany during the transition has been striking. Sec-ond, if there are large differences in measures of output per unit of inputacross sectors of an economy, sectoral shifts can distort estimates of TFPgrowth. In construction, for example, value added per unit of labor is rel-atively high, so that the measured growth path for TFP in eastern Germany
Michael C. Burda and Jennifer Hunt 83
0332-02-Burda 1/3/02 15:30 Page 83
might represent an initial shift toward construction in the beginning ofthe 1990s followed by a movement away as the decade progressed. Third,Nordhaus noted, differences in structures rather than in equipment expen-diture account for most of the investment gap between east and west. Hereasoned that if a substantial portion of the investment in structures in east-ern Germany is public investment, then, because productivity measure-ments on public capital are underestimated, the measurement of TFPgrowth in the east is biased downward. Finally, he argued that the model’sassumption of constant returns to scale is almost surely invalid in the caseof eastern Germany during this period. Joseph Stiglitz pointed out that the-ories of embodied technical change predict that eastern Germany’s highlevels of investment in technology should have increased productivity alot. That this did not occur, Stiglitz noted, should lead one to be skepticalof the Solow methodology in this setting.
Robert Hall found the concerns about the applicability of the Solowmodel overdone. He thought that the alleged nonstationarity of the pro-duction function could easily be accommodated by changes in efficiencyover time, and that estimates of the elasticity of output with respect to fac-tor inputs from observed shares are not significantly in error even if fac-tor markets are not perfectly competitive. Furthermore, he himself hadfound that productivity calculations are quite robust to reasonable varia-tions in the estimated shares. Hence he believed the Solow model pro-vided a useful framework for estimating the rate of TFP growth. He alsothought the framework was useful in explaining the relative productivitiesof eastern and western Germany. He noted, however, that if estimates ofthe factor shares are different in two regions, it is important to use theiraverage. Edmund Phelps was not surprised by the TFP gap between thetwo Germanys toward the end of the period. He suggested that it mightwell represent a steady-state outcome explained by the diffusion of tech-nological innovations. He observed that the TFP gap in Germany wascomparable to that between northern Italy and the Mezzogiorno, and heidentified the relative lack of university-trained managers in the low-TFPregions as a common feature that might explain the similarities in thetwo comparisons.
Edward Glaeser suggested that unobserved differences in human capi-tal might be responsible for the gap in TFP between eastern and westernGermany. The paper controls for these omitted human capital characteris-tics by comparing the wages of eastern Germans in the west with wages
84 Brookings Papers on Economic Activity, 2:2001
0332-02-Burda 1/3/02 15:30 Page 84
earned by comparable western Germans, finding little difference. Glaeserargued, however, that this conclusion might be weakened by the possibleselectivity of the migrants.
Richard Cooper thought there was something to the observations byworkers from eastern Germany who had migrated to western Germany inthe mid-1990s and reported upon their return that “It’s true, they haveshorter workdays there, but they work every hour of them.” The increase inunemployment in the east to very high levels may largely reflect movementfrom leisure on the job to leisure off the job. He went on to questionwhether these high unemployment rates represent involuntary unemploy-ment rather than simply a high reservation wage. Cooper found support forthe hypothesis that much unemployment is voluntary in the high propor-tion of foreign guest workers in the reconstruction of Berlin. He noted that,if his view is correct, lower wages would actually increase rather thandecrease unemployment. Stiglitz acknowledged that employment mighthave been discouraged by a generous welfare system, but he thought thatlow labor productivity was clearly part of the problem, making it difficultfor eastern German firms to pay wages consistent with standards and wageaspirations heavily influenced by conditions in the west.
Stiglitz further observed that unification has minimized many of thepolitical and economic problems that have plagued other transitioneconomies; this makes the eastern German experience particularly infor-mative. He noted three unique and beneficial aspects of eastern Germany’stransition stemming from unification: free trade with the neighboring west,easy adoption of a western legal and institutional structure, and very rapidprivatization because of the immediate presence of western German firms.Yet productivity in the east had still failed to converge with that in the west.
Michael C. Burda and Jennifer Hunt 85
0332-02-Burda 1/3/02 15:30 Page 85
References
Acemoglu, Daron, and Fabrizio Zilibotti. 2001. “Productivity Differences.” Quar-terly Journal of Economics 116(2): 563–606.
Aghion, Philippe, and Olivier Blanchard. 1994. “On the Speed of Transition inCentral Europe.” In NBER Macroeconomics Annual, edited by Stanley Fis-cher and Julio Rotemberg. MIT Press.
Akerlof, George A., and others. 1991. “East Germany in from the Cold: The Eco-nomic Aftermath of Currency Union.” BPEA, 1:1991, 1–87.
Arbeitskreis Volkswirtschaftliche Gesamtrechnungen der Länder. 2001. AktuelleLänderergebnisse 1991 bis 2000. Stuttgart: Statistisches Landesamt Baden-Württemberg.
Aschauer, David. 1989. “Is Public Expenditure Productive?” Journal of Mone-tary Economics 23(2): 177–200.
Barro, Robert J., and Xavier Sala-i-Martin. 1991. “Convergence across Statesand Regions.” BPEA, 1:1991, 107–58.
———. 1992. “Convergence.” Journal of Political Economy 100(2): 223–51.———. 1995. Economic Growth. McGraw-Hill.Bauer, Thomas K. 1995. “The Migration Decision with Uncertain Costs.” Münch-
ener Wirtschaftswissenschaftliche Beiträge 95–25. University of Munich.Beblo, Miriam, Irwin L. Collier, and Thomas Knaus. 2001. “The Unification
Bonus (Malus) in Postwall Eastern Germany.” Discussion Paper 01-29.Mannheim, Germany: Zentrum für Europäische Wirtschaftsforschung.
Bedau, Klaus-Dietrich. 1996. “Löhne und Gehälter in Ost- und Westdeutschland gle-ichen sich an, Lohnstückkosten jedoch nicht.” DIW-Wochenbericht 08-96: 1–4.
Begg, David, and Richard Portes. 2001. “Eastern Germany Since Unification:Wage Subsidies Remain a Better Way.” In Employment Policy in Transition:The Lessons of German Integration for the Labor Market, edited by Regina T.Riphahn, Dennis J. Snower, and Klaus F. Zimmermann. Berlin: Springer-Verlag.
Bellmann, Lutz. 1994. “Plädoyer für Lohnkostensubventionen in den neuen Bun-desländern.” In Arbeitsmarktpolitik nach der Vereinigung, edited by HubertHeinelt, Gerhard Bosch, and Bernd Reissert. Berlin: Edition Sigma.
Bellmann, Lutz, and Martin Brussig. 1998. “Ausmass und Ursachen der Produk-tivitätslücke ostdeutscher Betriebe des Verarbeitenden Gewerbes.” Mitteilungenaus der Arbeitsmarkt- und Berufsforschung 31(4): 648–60.
Bentivogli, Chiara, and Patrizio Pagano. 1999. “Regional Disparities and LabourMobility: The Euro-11 versus the USA.” Labour 13(3): 737–60.
Bewley, Truman F. 1999. Why Wages Don’t Fall during a Recession. Harvard Uni-versity Press.
Blum, Ulrich, and Simone Scharfe. 2001. “Quo Vadis Ostdeutschland: DerAufholprozess aus der Sicht der Entwicklungsökonomik.” In Zehn Jahre
86 Brookings Papers on Economic Activity, 2:2001
0332-02-Burda 1/3/02 15:30 Page 86
deutsche Einheit: Bilanz und Perspektiven, edited by Joachim Ragnitz. Halle,Germany: Institut für Wirtschaftsforschung, Halle.
Bode, Otto F., and Kai Hirschmann. 1992. Qualifizierungsmassnahmen: AktiveWeiterbildung als Alternative zur Transformationsarbeitslösigkeit. Marburg,Germany: Metropolis.
Boeri, Tito. 2000. Structural Change, Welfare Systems and Labour Reallocation:Lessons from the Transition of Formerly Planned Economies. Oxford, England:Oxford University Press.
Burda, Michael C. 1990. “The Consequences of German Economic and Mone-tary Union.” CEPR Discussion Paper 449. London: Centre for Economic Pol-icy Research. (Also published as “Les Conséquences de l’Union Economiqueet Monétaire de l’Allemagne,” Revue de l’OFCE, October 1990, and in A l’Est,En Europe, edited by Jean-Paul Fitoussi, Paris: Fondation Nationale de SciencePolitique.)
———. 1991. “Labor and Product Markets in Czechoslovakia and the Ex-GDR:A Twin Study.” European Economy Special Issue 2: 111–28.
———. 1993. “The Determinants of East-West German Migration: Some FirstResults.” European Economic Review Papers and Proceedings 37(2–3): 452–61.
———. 1995. “Migration and the Option Value of Waiting.” Economic and SocialReview 27(1): 1–19.
———. 2001. “Notes on Regional Integration.” Unpublished paper. Humboldt-Universität zu Berlin.
Burda, Michael C., and Ulrich Busch. Forthcoming. “West-Ost-Transfers imGefolge der deutschen Vereinigung.” Konjunkturpolitik.
Burda, Michael C., and Michael Funke. 1995. “East Germany: Can’t We Be MoreOptimistic?” ifo Studien 41(3): 327–54.
––––––. 2001. “Wages and Structural Adjustment in the New German States.” InEmployment Policy in Transition: The Lessons of German Integration for theLabor Market, edited by Regina T. Riphahn, Dennis J. Snower, and Klaus F.Zimmermann. Berlin: Springer-Verlag.
Burda, Michael C., and Christoph Schmidt. 1997. “Getting behind the East-WestWage Differential: Theory and Evidence.” In Wandeln oder Weichen—Her-ausforderungen der wirtschaftlichen Integration für Deutschland, edited byRüdiger Pohl and Hilmar Schneider. Halle, Germany: Institut für Wirtschafts-forschung, Halle.
Burda, Michael C., and others. 1998. “Semiparametric Analysis of German East-West Migration Intentions: Facts and Theory.” Journal of Applied Economet-rics 13(5): 525–41.
Card, David, Francis Kramarz, and Thomas Lemieux. 1999. “Changes in theStructure of Relative Wages and Employment: A Comparison of the UnitedStates, Canada and France.” Canadian Journal of Economics 32(4): 843–77.
Collier, Irwin L., and Horst Siebert. 1991. “The Economic Integration of Post-WallGermany.” American Economic Review 81(2): 196–201.
Michael C. Burda and Jennifer Hunt 87
0332-02-Burda 1/3/02 15:30 Page 87
Collins, Susan M., and Dani Rodrik. 1991. “Eastern Europe and the Soviet Unionin the World Economy.” Policy Analyses in International Economics 32. Wash-ington: Institute for International Economics.
DeLong, J. Bradford, and Lawrence H. Summers. 1991. “Equipment Investmentand Economic Growth.” Quarterly Journal of Economics 106(2): 445–502.
––––––. 1992. “Equipment Investment and Economic Growth: How Strong Is theNexus?” BPEA, 2:1992, 157–99.
Denison, Edward F. 1967. Why Growth Rates Differ: Postwar Experience in NineWestern Countries. Brookings.
Dietz, Barbara. 1999. “Ethnic German Immigration from Eastern Europe and theFormer Soviet Union to Germany: The Effects of Migrant Networks.” IZA Dis-cussion Paper 68. Bonn: Institute for the Study of Labor (November).
Dornbusch, Rudiger, and Holger Wolf. 1992. “Economic Transition in EasternGermany.” BPEA, 1:1992, 235–61.
Eichengreen, Barry. 1990. “One Money for Europe: Lessons from the U.S. Cur-rency Union.” Economic Policy 10: 117–87.
Eichler, Martin, and Michael Lechner. 1999. “An Evaluation of Public Employ-ment Programmes in the East German State of Sachsen-Anhalt.” IZA Discus-sion Paper 94. Bonn: Institute for the Study of Labor (December).
Franz, Wolfgang, and Viktor Steiner. 2000. “Wages in the East German Transi-tion Process: Facts and Explanations.” German Economic Review 1(3): 241–69.
Funke, Michael, and Jörg Rahn. Forthcoming. “How Efficient Is the GermanEconomy? An Exploration with Micro Data.” Economics of Transition.
Giersch, Herbert, Karl-Heinz Paqué, and Holger Schmieding. 1992. The FadingMiracle: Four Decades of Market Economy in Germany. Cambridge, Eng-land: Cambridge University Press.
Görzig, Bernd, and Gerda Noack. 1999. Vergleichende Branchendaten für das ver-arbeitende Gewerbe in Ost und Westdeutschland: 1991–1998. Berlin:Deutsches Institut für Wirtschaftsforschung.
Grosser, Dieter. 1998. Das Wagnis der Währungs-, Wirtschafts- und Sozialunion:Politische Zwänge im Konflikt mit ökonomischen Regeln. Stuttgart: DeutscheVerlags-Anstalt.
Grundmann, Siegfried. 1998. Bevölkerungsentwicklung in Ostdeutschland:Demographische Strukturen und räumliche Wandlungsprozesse auf dem Gebietder neuen Bundesländer. Opladen, Germany: Leske + Budrich.
Grunert, Ruth. 2000. “Bei Annäherung weiterhin Besonderheiten der Konsum-struktur in Ostdeutschland.” Wirtschaft im Wandel 7: 204–09.
Hall, Robert E., and Charles I. Jones. 1996. “The Productivity of Nations.” Work-ing Paper 5812. Cambridge, Mass.: National Bureau of Economic Research(November).
Heimpold, Gerhard. 2001. “Die Unternehmenslücke zwischen Ost und West-deutschland—ein zentrales Problem der ostdeutschen Wirtschaft.” Wirtschaftim Wandel 9: 199–205.
88 Brookings Papers on Economic Activity, 2:2001
0332-02-Burda 1/3/02 15:30 Page 88
Holst, Elke, Dean R. Lillard, and Thomas A. DiPrete, 2001. “Proceedings of the2000 Fourth International Conference of German Socio-Economic PanelStudy Users (GSOEP 2000). Vierteljahreshefte zur Wirtschaftsforschung70(1): 7–14.
Hughes-Hallet, Andrew, and Yue Ma. 1993. “East Germany, West Germany, andTheir Mezzogiorno Problem: A Parable for European Economic Integration.”Economic Journal 103(417): 416–28.
Hunt, Jennifer. 2000. “Why Do People Still Live in East Germany?” Unpublishedmanuscript. Yale University (October).
———. 2001a. “Post-Unification Wage Growth in East Germany.” Review of Eco-nomics and Statistics 81(1): 190–95.
———. 2001b. “Determinants of Non-employment and Unemployment Durationsin East and West Germany.” Unpublished manuscript. Yale University (March).
———. Forthcoming. “The Transition in East Germany: When Is a Ten PointFall in the Gender Wage Gap Bad News?” Journal of Labor Economics.
Institut der Deutschen Wirtschaft. 2000. Zahlen zur wirtschaftlichen Entwicklungder Bundesrepublik Deutschland. Cologne.
Jerger, Jürgen, Christian Pohnke, and Alexander Spermann. 2001. “Gut betreut inden Arbeitsmarkt? Eine mikroökonometrische Evaluation der MannheimerArbeitsvermittlungsagentur.” IZA Discussion Paper 285. Bonn: Institute for theStudy of Labor (April).
Jorgenson, Dale W., Frank M. Gollop, and Barbara M. Fraumeni. 1987. Produc-tivity and U.S. Economic Growth. Amsterdam: North-Holland.
Katz, Lawrence F. 1998. “Wage Subsidies for the Disadvantaged.” In GeneratingJobs: How to Increase Demand for Less-Skilled Workers, edited by RichardB. Freeman and Peter Gottschalk. New York: Russell Sage Foundation.
Klodt, Henning. 2000. “Industrial Policy and the East German Productivity Puz-zle.” German Economic Review 1(3): 315–33.
Kohaut, Susanne, and Claus Schnabel. 1999. “Tarifbindung im Wandel.” IW-Trends 2/99: 63–80.
Krause, Peter. 1994. “Armut im Wohlstand: Betroffenheit und Folgen.” DiscussionPaper 88. Berlin: Deutsches Institut für Wirtschaftsforschung (February).
Krueger, Alan B., and Jörn-Steffen Pischke. 1995. “A Comparative Analysis ofEast and West German Labor Markets: Before and after Unification.” In Dif-ferences and Changes in Wage Structures, edited by Richard B. Freeman andLawrence F. Katz. University of Chicago Press.
———. 1998. “Observations and Conjectures on the U.S. Employment Miracle.”In Third Public GAAC Symposium: Labor Markets in the USA and Germany,edited by Josef Rembser. Bonn: German-American Academic Council.
Lechner, Michael. 2000. “An Evaluation of Public-Sponsored-Continuous Voca-tional Training Programs in East Germany.” Journal of Human Resources35(2): 347–75.
Michael C. Burda and Jennifer Hunt 89
0332-02-Burda 1/3/02 15:30 Page 89
Ludwig, Udo, and Reiner Stäglin. 1999. “Struktureller Wandel von Produktion,Faktoreinsatz und Nachfrage in Ost- und Westdeutschland in den achtzigerJahren.” In Deutsch-Deutsche Wirtschaft 1945 bis 1990, edited by Lothar Baarand Dietmar Petzina. St. Katharinen: Scripta Mercaturae Verlag.
Lundborg, Per. 1991. “Determinants of Migration in the Nordic Labor Market.”Scandinavian Journal of Economics 93(3): 363–75.
Müller, Albert. 2001. “Verbesserte Produktionsmöglichkeiten bei unverändertenAbsatzproblemen—Die Zeit in Ostdeutschland drängt.” ifo Schnelldienst3/2001. Munich: IFO Institute.
Mundell, Robert A. 1957. “International Trade and Factor Mobility.” AmericanEconomic Review 47(3): 321–35.
Neuberger, Doris. 2000. “Regionalökonomik und Finanzierung: Kleiner und mit-tlerer Unternehmen: Erklärungen für ein Ost-West-Gefälle in Deutschland?”Konjunkturpolitik 46(1–2): 33–61.
Nickel, Hildegard M., Jürgen Kühl, and Sabine Schenk. 1994. Erwerbsarbeit undBeschäftigung im Umbruch. Berlin: Akademie Verlag.
Oaxaca, Ronald L. 1973. “Male-Female Wage Differentials in Urban Labor Mar-kets.” International Economic Review 14(3): 693–709.
Oaxaca, Ronald L., and Michael R. Ransom. 1994. “On Discrimination and theDecomposition of Wage Differentials.” Journal of Econometrics 61(1): 5–21.
O’Connell, Paul G. J. 1997. “Migration under Uncertainty: ‘Try Your Luck’ or‘Wait and See.’ ” Journal of Regional Science 37(2): 331–47.
Pischke, Jörn-Steffen, Matthias Staat, and Stefan Vögele. 1994. “Arbeitslosigkeit,Löhne oder Weiterbildung: Warum pendeln Ostdeutsche in den Westen?” InArbeitsmarktdynamik und Unternehmensentwicklung in Ostdeutschland, editedby Heinz König and Viktor Steiner. Baden-Baden, Germany: Nomos Verlag.
Pissarides, Christopher A., and Jonathan Wadsworth. 1989. “Unemployment andthe Inter-regional Mobility of Labour.” Economic Journal 99(397): 739–55.
Prasad, Eswar. 2000. “The Unbearable Stability of the German Wage Structure:Evidence and Interpretation.” Unpublished manuscript. Washington: Interna-tional Monetary Fund (January).
Ragnitz, Joachim. 1999. “Warum ist die Produktivität ostdeutscher Unternehmenso gering? Erklärungsansätze und Schlussfolgerungen für den Konvergenz-prozess.” Konjunkturpolitik 45(3): 165–87.
———. 2001. “Produktivitätsrückstand der ostdeutschen Wirtschaft: Eine zusam-menfassende Bewertung.” Wirtschaft im Wandel 7–8: 181–89.
Ragnitz, Joachim, Gerhard Müller, and Anita Wölfl. 2001. “Produktivitätsunter-schiede und Konvergenz von Wirtschaftsräumen—Das Beispiel der neuen Län-der.” Report commissioned by the Ministry of Economics and Technology.Halle, Germany: Institut für Wirtschaftsforschung, Halle.
90 Brookings Papers on Economic Activity, 2:2001
0332-02-Burda 1/3/02 15:30 Page 90
Roland, Gérard. 2000. Transition and Economics: Politics, Markets, and Firms.MIT Press.
Scheuer, Markus. 1990. “Ausbildung und Qualifikation der Arbeitskräfte in derDDR.” RWI-Mitteilungen 41(697): 67–79.
Schmidt, Christoph M., and others. 2001. Perspektiven der Arbeitsmarktpolitik:Internationaler Vergleich und Empfehlungen für Deutschland. Berlin: Springer-Verlag.
Schnabel, Claus. 1999. “Tarifpolitik in Ostdeutschland zwischen gesell-schaftlichen Zwängen und ökonomischer Rationalität.” In Die arbeitsmarkt-und beschäftigungspolitische Herausforderung in Ostdeutschland, edited byEberhard Wiedermann and others. Nürnberg, Germany: Institut für Arbeits-markt- und Berufsforschung der Bundesanstalt für Arbeit.
Schwarze, Joachim. 1996. “Beeinflusst das Lohngefälle zwischen Ost- und West-deutschland das Migrationsverhalten der Ostdeutschen? Eine mikro-okonometrische Untersuchung mit Daten des Sozio-ökonomischen Panels1991 bis 1994.” Allgemeines Statistisches Archiv 80: 50–68.
Seidel, Bernhard, and Dieter Vesper. 2000. “Anlagevermögen der ostdeutschenLänder und Gemeinden—noch erheblicher Nachholbedarf.” DIW-Wochen-bericht 24/00: 365–71.
Seitz, Helmut. 1994. “Public Capital and the Demand for Private Inputs.” Jour-nal of Public Economics 54(2): 287–307.
Siebert, Horst. 1992. Das Wagnis der Einheit: Eine Wirtschaftspolitische Therapie.Stuttgart: Deutsche Verlags-Anstalt.
Sinn, Hans-Werner. 1995. “Factor Price Distortions and Public Subsidies in EastGermany.” CEPR Discussion Paper 1155. London: Centre for Economic PolicyResearch (May).
———. 2000. “EU Enlargement, Migration, and Lessons from German Unifica-tion.” German Economic Review 1(3): 299–314.
Sinn, Hans-Werner, and Gerlinde Sinn. 1991. Kaltstart: VolkswirtschaftlicheAspekte der deutschen Vereinigung. Tübingen, Germany: J. C. B. Mohr. (Alsopublished in English as Jumpstart: The Economic Unification of Germany, MITPress, 1992.)
Sjaastad, Larry A. 1962. “The Costs and Returns of Human Migration.” Journal ofPolitical Economy 70(5, part 2): 80–93.
Snower, Dennis. 2001. “Revenue-Sharing Subsidies as Employment Policy:Reducing the Cost of Stimulating East German Employment.” In EmploymentPolicy in Transition: The Lessons of German Integration for the Labor Mar-ket, edited by Regina T. Riphahn, Dennis J. Snower, and Klaus F. Zimmer-mann. New York: Springer-Verlag.
Solow, Robert M. 1957. “Technical Change and the Aggregate Production Func-tion.” Review of Economics and Statistics 39(3): 312–20.
Michael C. Burda and Jennifer Hunt 91
0332-02-Burda 1/3/02 15:30 Page 91
Strauch, Rolf, and Jürgen von Hagen. 2000. “East Germany: Transition with Uni-fication—Experiments and Experiences.” CEPR Discussion Paper 2386. Lon-don: Centre for Economic Policy Research (February).
Turner, Lowell. 1998. Fighting for Partnership: Labor and Politics in Unified Ger-many. Cornell University Press.
Vesper, Dieter. 2001. “Zum Infrastrukturellen Nachholbedarf in Ostdeutschland.”DIW-Wochenbericht 20/01: 293–98.
Weiss, Reinhold. 1991. “Innovations- und Integrationsfaktor beruflicher Bildung:Bildungssituationen und Bildungsaufgaben in den neuen Bundesländern.” InBerichte zur Bildungspolitik 1991/1992. Cologne: Institut der DeutschenWirtschaft.
Wenzel, Siegried. 1992. “Wirtschaftsplanung in der DDR: Struktur-Funktion-Defizite.” Berliner Arbeitshefte und Berichte zur sozialwissenschaftlichenForschung 75. Berlin: Zentralinstitut für sozialwissenschaftliche Forschung,Freie Universität-Berlin (October).
Young, Alwyn. 1992. “A Tale of Two Cities: Factor Accumulation and TechnicalChange in Hong Kong and Singapore.” In NBER Macroeconomics Annual,edited by Olivier Blanchard and Stanley Fischer. MIT Press.