185
FROM STANSBERRY & ASSOCIATES INVESTMENT RESEARCH

FROM STANSBERRY & ASSOCIATES INVESTMENT RESEARCH

Published by Stansberry & Associates Investment Research.
Copyright 2014 Stansberry & Associates Investment Research. All Rights Reserved. Any brokers mentioned herein constitute a partial list of available brokers and is for your information only. S&A does not recommend or endorse any brokers, dealers, or financial advisors.

INTRODUCTION
Dear Stansberry & Associates reader,
In the past several years, an incredible amount of Americans have become interested in trading stocks, commodities, and currencies.
I can’t blame them at all.
Twenty years ago, managing your portfolio was simple: Buy a hand-ful of solid companies or send your cash to a great fund manager like Peter Lynch and watch the money pile up over the years.
After all, the years between 1982 and 1999 were the golden years of stock investing.
But this approach has brought nothing but misery for most investors since 2000. Wall Street has proved yet again it can’t be trusted to do anything except go after as many fees and scams as possible.
It pushed overvalued tech stocks in 2000 (while calling them sh*t in private e-mails). It helped Enron and WorldCom take in billions of investor dollars. It pushed risky mortgage securities in 2006. And when the wall of mortgage debt crashed down in 2008, they got their buddies in Washington, D.C. to bail them out with your money.
Given this behavior, I can’t blame folks for wanting to learn how to trade short-term market movements. Done with a solid risk-manage-ment plan, this approach can safely return at least 20% annually.
That’s why we’ve put together the S&A Trader’s Manual.
Our goal with the S&A Trader’s Manual is to provide our readers with the knowledge and tools to help them become smarter, more successful traders.
Inside these pages, you’ll learn how to profit as stocks fall... how to use charts in order to make the safest profits the right way... how to time any market... the two biggest factors in your trading success... the right way to trade along corporate insiders... and the most im-portant thing ever said about trading.
I guarantee if you take the information in the following pages to

heart, you’ll be a vastly better – and richer – trader. And you’ll never be scammed by Wall Street again.
Regards,
Brian HuntEditor in Chief, Stansberry Research

CONTENTS
KNOWLEDGE BASE: HOW TO THINK ABOUT TRADING
The 10 Best Things Ever Said About Trading
The Seven Real Secrets of the World’s Best Investors
This Little-Known Secret Virtually Guarantees You’ll Make Money in the Market
The Magic Words Every Investor/Trader Says Over and Over, All the Time
The Four Dirtiest Words in Trading
The Only Reliable Cycle in the Market
TRADER’S TOOL BOX: SYSTEMS AND STRATEGIES THAT MAKE MILLIONS
Common Sense Guide to Technical Analysis
The Trader’s Best Friend
Don’t Lose Money: The Most Important Law of Lasting Wealth
A Short Guide to Using Stop Losses
The Right Time to Change a Stop Loss
The Art of the Short Sale
The S&A Guide to Options Trading
The Easiest Way to Make Money in a Risky Stock Market
How to Safely Double and Triple the Returns in Your Retire-ment Account
Top Insider Buying Strategies
This Is One of the Best Insider Buying Indicators in the World
1
2
23
41
47
53
55
58
59
84
87
90
92
94
109
119
126
149
151

An Incredibly Powerful Trading Tool You’ve Never Heard Of
Advanced Chart-Reading Course
Time the Market... Any Market
APPENDIX A
Five Books That Can Make You a Millionaire Trader
APPENDIX B
How to Buy Securities and Set Up Your Options Account
153
156
167
169
170
174
175

Knowledge Base: How to Think About Trading
2
S&A Trader’s Manual
Table of Contents
THE 10 BEST THINGS EVER SAID ABOUT TRADINGAND HOW TO USE THEM TO ENSURE
YOUR FINANCIAL FREEDOM
By Brian HuntEditor in Chief, Stansberry Research
Spend much time studying the art of trading, and you’re bound to come across hundreds of quotes about making money in stocks and commodities.
In mid-2009, I took on the challenge to boil down the thousands of pages I’ve read on trading... the hundreds of hours spent talking about it... and the experiences I’ve had since I started trading at 18.
At the risk of being struck down by the trading gods, I think I did a good job of boiling down a century of trading wisdom by selecting just 10 quotes... and supporting each one with a short essay that explains its meaning.
I believe that if you read and internalize each of these 10 quotes, you’ll always win in the stock, bond, and commodity markets.
Good trading,
Brian
Of all the brilliant things Jim Rogers has ever said, I believe this one is head-and-shoulders above the rest.
Rogers is one of the most successful money managers in history. He made so much money investing and trading during the 1970s, he left the conventional side of work to travel and run his own mon-
1. “I just wait until there is money lying in the corner, and all I have to do is go over there and pick it up. I do nothing in
the meantime.” – Jim Rogers

3
KNOWLEDDGE BASE
Table of Contents
ey. You can read more about him in the greatest trading book ever, Market Wizards.
In that short quote above, Rogers nails one of the most important factors to trading and investment success: Don’t spend your time and energy chasing mediocre trades and investment opportunities. Only move when the odds are overwhelmingly in your favor.
If you follow his lead, you’ll probably end up a very successful trad-er. If you don’t, you’ll contribute to the bank accounts of those who do follow his lead.
You see, the average market participant always feels like he has to be “doing something.” He chases all kinds of ideas... takes lots of “fliers”... acts on all kinds of magazine articles, CNBC shows, and hot tips from buddies. He’s always on his phone or computer check-ing quotes. He usually has a bunch of stocks in his portfolio that are down big... but are sure to “come back.”
Not Jim Rogers.
In all his books, interviews, and articles, Rogers makes it clear he spends long stretches of time without having significant money at work in the market. He waits for extraordinary opportunities, where the odds are so far in his favor, the position is like picking up free money. When he doesn’t see any sure things, he simply sits in cash and does nothing.
Now, don’t get me wrong. There are few 100% can’t-lose trades and investments in this world. I’m not encouraging you to find trades that carry no risk of loss. I’m encouraging you to find trades where the odds are heavily stacked in your favor.
Find “extreme” opportunities... where the sentiment toward an asset is shifted to one side... where the valuation is ridiculously expensive or ridiculously cheap... and where the market is moving in the right direction and confirming your thesis. These are the opportunities where you can risk $1 and make $5 or $10.
Only then should you commit a large chunk of capital to an idea.
If you’re not seeing any extremes, it’s best to fight the natural

4
S&A Trader’s Manual
Table of Contents
urge to stay busy and make “this might-could-kinda-work” trades. These trades will just distract you, cause stress, and run up your commission bill.
Most older, rich investors and traders will tell you they made most of their money on five or 10 positions they had tremendous convic-tion in... where it felt like they were simply picking up free money. They’ll tell you the other positions weren’t worth the time it took to put them on.
This is not to say there aren’t a lot of great traders out there who make quick, frequent trades. But folks who can do that are few and far between. Most regular traders don’t have the time or the temper-ament for it.
So be lazy in the market. Don’t worry about sitting on a big pile of cash, waiting for low-risk, high-reward trades. It’s the idea behind “free money” trading. It’s the thinking that built and maintained Jim Rogers’ wealth.
It can do the same for you.
I know... this quote sounds bizarre. But hear me out: It contains an incredible seed of trading knowledge.
Hamilton was one of the first editors of the Wall Street Journal... He was one of the country’s most respected market analysts 80 years ago. And the legendary market advisor Richard Russell still recom-mends reading Hamilton’s book The Stock Market Barometer, once a year.
So what does Hamilton mean by “right too soon”?
Well, many traders and investors have a strong “hero streak” in
2. “Wall Street’s graveyards are filled with men who were right
too soon.” – William Hamilton

5
KNOWLEDDGE BASE
Table of Contents
them. They have a lot of confidence in their ability to value assets and gauge investor sentiment. They love to “see what others don’t,” step into a runaway market, and bet on prices moving the other way.
It’s an exciting way to trade. It’s like being the only guy standing on the beach while a hurricane approaches. Problem is, the hurricane will usually blow you into the next state.
That hurricane hit a lot of traders in late 1999... Tech stocks had ab-solutely soared for five years, many companies were trading for 100 or 200 times earnings, and sentiment was overwhelmingly shifted to one side. It was an extreme situation – the kind you should always be hunting for.
Any experienced trader was looking to bet the other way. But any trader who actually made the bet was “right too soon.” Take a look...
Even though the Nasdaq was overvalued at the time... even though the rally was long in the tooth... it was a bad move to short with the Nasdaq at 3,500 (circled in red). It was too early. The crazed public drove the index 30% higher over the coming months.
Now, have a look at the blue circle. What’s so special about this area? This was the point at which the market started moving in the “direction of sanity.” This was the point the bubble popped. This

6
S&A Trader’s Manual
Table of Contents
was the market getting started in the direction the bears believed it would. Traders call this “price confirmation.”
Smart traders always wait for a bit of “price confirmation” before they back a trading thesis with big money.
They know the market can run far away from rational fundamental values. They know how easy it is to be “right too soon.” So they wait for the price to move in their direction for five or 10 trading ses-sions... or they wait for the price to break through a moving average.
The point is, they let the market exhaust itself before they step in. So it’s as easy as pushing over an exhausted runner (on the bear side)... or climbing aboard a gently moving freight train (on the bull side).
Wall Street’s graveyards are filled with guys who got killed because they tried to step in front of runaway markets. So keep Hamilton’s words in mind anytime you’re considering being a “hero.” Find mar-ket extremes... then wait to be right.
Jesse Livermore was one of the most respected traders of the 1920s. He built one of America’s largest fortunes at the time with his skills in the stock and commodity markets. The classic book Remi-niscences of a Stock Operator contains his story.
“Sitting tight” was Livermore’s term for not selling when he was up 20%... 50%... or 100% on a position. Sitting tight is the art of not taking quick profits.
You see, most traders and investors get tempted to sell their winners after they see a modest profit... like, say, 33%. They get fidgety. They tell themselves that, “You can’t go broke taking a profit.” They always feel like they should be doing something, so they take action and jump out of the winning trade.
3. “It never was my thinking that made big money for me. It
was always my sitting. Got that? My sitting tight!” – Jesse Livermore

7
KNOWLEDDGE BASE
Table of Contents
This strategy will kill your long-term trading performance.
For instance... I have a friend who bought shares of Brazilian oil company Petrobras in 2003 for around $5 per share. He doubled his money in just over a year... and then sold. Nothing negative hap-pened with the position – he just got fidgety and figured a double was good enough.
It’s a shame my friend didn’t “sit tight,” because Petrobras eventually climbed to $70 per share. He missed the chance to make 14 times his money instead of one times his money. He missed the chance to ride a huge, multi-year trend in oil stocks to its fullest extent.
That’s it. When you are right on a trade – whether it’s tech stocks, biotech stocks, oil, or gold – ride it for all it’s worth. Don’t cut your profits short. Don’t sell until you see a legitimate reason for con-cern... like a decline of more than 15%... or an asset’s refusal to rise on bullish news. One of the best ways to get rich in the stock market is to get in early on a big trend and ride it for years... You can’t ride a trend if you don’t sit tight.
And although we’re concerned with trading here, it’s worth pointing out a key fact about the world’s greatest investor, Warren Buffett... Buffett’s partner, Charlie Munger, claims Buffett’s edge over other investors is that he “sits on his ass and reads a lot.” Buffett spends most of his time sitting. And don’t forget Jim Rogers’ “I just wait until there is money lying in the corner” philosophy.
You see, you can go broke taking profits... if you allow losers to pile up and if you cut profits short. Learning how to sit tight will make sure you let winners pile up instead.
Congratulations.
You found an asset that was extremely cheap... extremely hated...
4. “Never confuse brains with a bull market.”
– Humphrey Neill

8
S&A Trader’s Manual
Table of Contents
and just starting an uptrend.
You took an intelligent position size that limited risk.
You did a great job of sitting tight... of being patient and letting the bull market fully express itself.
You are up 500%. Now... for God’s sake... Don’t confuse brains with a bull market.
This classic quote is attributed to Humphrey Neill. Neill was a stock market expert who literally wrote the book on contrarian investment thinking. It’s called The Art of Contrary Thinking. Neill’s advice will save you a ton of money as a trader.
You see, the natural human tendency after hitting it big in the market is to “puff up” a bit... to brag to friends and family about how you “nailed it.”
Maybe you did some great analysis on the oil market and rode a big move for hundreds of thousands of dollars. Or maybe you found a promising microcap company that turned into a 1,000% winner.
The natural human tendency after doing something great is hubris. And in the stock market, hubris is more dangerous than igno-rance.
In 1999, I thought of myself as a great stock trader. I was 22 years old... and I was sitting on huge gains in tech stocks like JDS Uni-phase, Ariba, and Microsoft. I would buy ‘em, and they’d go up hundreds of percent. I made more money trading stocks that year than I did from my job.
I figured I would be retired and living on a private island by my late 20s. That’s how good I was!
Now mind you, this was during the greatest tech stock bull market in history. The benchmark Nasdaq stock index gained 86% that year. I wasn’t some incredible trader. I simply happened to be buying while the market was soaring. I had confused brains with a bull market.
You can guess what happened next. When the market collapsed, so

9
KNOWLEDDGE BASE
Table of Contents
did my huge tech stock bets. I didn’t use stop losses. I didn’t prac-tice smart position sizing. I lost everything I had gained and then some.
It was expensive market tuition... but it taught me a tremendously valuable lesson.
Rich traders reach a happy medium between confidence and overconfidence. The right balance means having conviction in your beliefs and the courage to act on them... but always treating the market as a dangerous place that can bankrupt you if you don’t use intelligent positions sizes and stop losses.
The wrong balance is being overconfident, taking a huge leveraged position, and refusing to say “uncle” if the market doesn’t move in your direction.
If you’ve made a bundle on a big market move, go ahead and cele-brate a little. Brag to your buddies. Go on a nice vacation.
But take Humphrey Neill’s advice... Remember the lesson of the Inter-net bubble. Don’t believe that just because you were right before, you don’t have to limit risk. Confusing brains with a bull market will result in bankruptcy.
This quote is the financial equivalent of nuclear energy: a source of tremendous power that can be used to drive progress... or to cause complete destruction.
It’s so dangerous, I debated not including this piece.
You see, this idea is one of the keys to making a fortune in the stock market... the idea of being a “pig.”
Stanley Druckenmiller is one of the most successful money man-
5. “When you have tremendous conviction on a trade, you have to go for the jugular. It takes courage to be a pig.”
– Stanley Druckenmiller

10
S&A Trader’s Manual
Table of Contents
agers of all time. He earned an estimated $150 million in 2008. He learned much of what he knows from legendary speculator George Soros. That’s where he learned to be a pig.
There’s an old Wall Street adage that says, “Bears make money, bulls make money, but pigs get slaughtered.” The idea is that you can make money when stocks go down (the bear side) or when they go up (the bull side)... but anyone who behaves like a pig – who gets too greedy – is destined to lose.
Soros and Druckenmiller don’t agree with this line of thinking. They know that to make tremendous returns, you have to back your best ideas with large positions. You have to get greedy when you find an amazing risk-reward situation. Hitting a big trade with a tiny position size just doesn’t generate big returns. You have to be a pig.
But here’s where this idea gets dangerous...
The No. 1 cause of catastrophic losses – the kind of financial blow that will bankrupt someone – is losing a big percentage of a big position.
So why would I encourage you to learn about this weapon of mass financial destruction?
Because used correctly, a large position size in a great idea can make you rich. Because being a pig can make your year, doubling or tripling your account. It can be the difference between making $20,000 or $200,000 on a big trend, like the monster 500% move many gold stocks enjoyed from 2003 to 2008.
Normally, a trader should avoid putting more than 5% of his money into one idea. If you use a stop loss of 20% on a 5% position, you will only lose 1% of your total portfolio if you are wrong.
But occasionally, when trade is close to “slam dunk” territory – when the reward-to-risk ratio is 6, 8, or 10 to 1 – a large position size of 10% or 20% of your portfolio allows you to make huge gains. The way to build superior long-term returns is through your “home run” trades... which must be backed by real money... not a 3% position.
Someone who isn’t comfortable taking losses and minding their sell

11
KNOWLEDDGE BASE
Table of Contents
discipline should never take large positions sizes. If you can’t cut losers short, you’re playing Russian roulette when you take big posi-tions. It’s only a matter of time before you’re toast. And if you’re not good at recognizing great high-reward/low-risk trades, then please keep your position sizes small.
Only after years of successful trading and mastering stop losses should you even consider a position size greater than 5%.
But if you have extensive experience under your belt, you need to brush off the old Wall Street wisdom and pay attention to filthy rich traders like George Soros and Stanley Druckenmiller. You must make big money on your best high-reward/low-risk trades. You must be a pig.
At some point in his career, every trader will confront the ghost of John Maynard Keynes. The decision he makes then will either ruin him or save him a fortune.
John Maynard Keynes was the most influential economist of the 20th century. His ideas shaped the way the Western world ran its finances after World War II. Keynes was also a brilliant speculator who pulled millions of dollars out of the market.
While I believe some of Keynes’ economic ideas were batty (a sub-ject for another time), his quote above is one of the most important things ever said about trading.
It’s how Keynes’ ghost will forever live in the minds of traders.
You see, Keynes brilliantly cautions traders against shorting a stock or a market that “shouldn’t” be rising... and cautions against buying a stock or a market that “shouldn’t” be falling.
Great traders are always on the lookout for extremes: extremes in
6. “The market can stay irrational longer than you can
stay solvent.” – John Maynard Keynes

12
S&A Trader’s Manual
Table of Contents
sentiment, extremes in valuation, and extremes in momentum. It’s by finding extremes and then betting against the crowd that you set yourself up for big gains in a short time.
But watch out for the problem Keynes warns about: The crowd often gets irrational and stays that way for a long time.
For example, a lot of money managers believed the enormous rise in oil prices starting in early 2007 was an irrational move. When crude oil had risen from $50 to $90 a barrel in early 2008, they knew speculators with lots of borrowed money were behind the move. And they knew oil was selling for at least 50% more than its re-al-world value. So they bet on falling prices.
When oil climbed to $100 a barrel, these money managers knew it was even more irrationally overvalued. Same with $115... and $125... and $135... and you get the idea.
Any trader who stubbornly held on to his short position because he just knew $90 was an “irrational” price suffered the longest summer of his life. He watched that irrational price tick higher and higher like Chinese water torture... and his losses were huge.
Any trader who was short at $90 and hung on was carried out a bro-ken man... He forgot the market can stay irrational longer than any one single person can heavily bet against it and stay solvent.
The market is full of stories like this... Think of the traders who went bankrupt shorting super expensive Nasdaq stocks in 1999... or the famous blow-up of Long Term Capital Management in 1998. Both groups took big positions against markets they felt were behaving irrationally... but those markets just kept on behaving irrationally for a long time.
A corollary to Keynes’ quote is the Jim Rogers line, “Markets often rise higher than you think is possible, and fall deeper than we can imagine.”
You can put the warning from Keynes and Rogers to real-world use by always minding your stop losses. Go ahead and take a contrari-an position at the extremes. But always have an “uncle” point to limit

13
KNOWLEDDGE BASE
Table of Contents
losses in case the crowd keeps pushing prices in a crazy direction.
It’s tough to watch a stock you know inside and out move in a direc-tion that isn’t rooted in reality. But remember... if a stock can trade for an irrational 50 times earnings, it can trade for an irrational 75 times earnings... or 100 times earnings... or as we saw in the Nas-daq bubble days, 200 times earnings.
It’s tough to say uncle on a trade you know has terrific potential. But when you start thinking, “This is an irrational move... I’ll just keep betting against it,” remember Keynes and Rogers. Know that mar-kets can go farther in either direction than you can imagine... and they can keep going longer than you can stay solvent.
Imagine someone rounded up the greatest golfers of all time, sat them down, and asked them how to become a great golfer.
Now imagine that all of them – Arnold Palmer, Ben Hogan, Jack Nicklaus, Tiger Woods, and so on – recommended using the same technique to achieve incredible success. Maybe they tell you to keep your head down or to keep your arm straight. If you wanted to become a great golfer, you’d probably make this technique your main focus.
This sort of thing has been done in the business of trading. You’ll find it in the greatest trading book of all time, Market Wizards. This book is a series of interviews with some of the richest, most suc-cessful traders to ever live. It’s also a series of stories about one trading technique, which Ed Seykota captured in the quote above.
The technique is cutting your losses. Of selling a position if it’s not moving in your favor. It’s the key to turning your trading into a
7. “The elements of good trading are: (1) cutting losses, (2) cutting losses, and (3) cutting losses. If you follow
these three rules, you may have a chance.” – Ed Seykota

14
S&A Trader’s Manual
Table of Contents
lifetime builder of wealth.
Seykota is a legendary “trend following” trader who made himself and his clients millions and millions of dollars. His quote is a lot like the real estate cliché, “location, location, location.” The idea of cut-ting losses is so much more important than everything else, it needs to be repeated three times.
Other legendary traders say the same thing... William O’Neil, the great stock trader and founder of the newspaper Investor’s Busi-ness Daily puts it like this: “Letting losses run is the most serious mistake made by most investors.” The great short-term trader Marty Schwartz puts it like this: “Learn to take losses. The most important thing in making money is not letting your losses get out of hand.”
Now... it’s easy to read all of this great “cut your losers short and let your winners ride” stuff. It’s easy to repeat it to yourself while you’re driving or lying in bed. But for many traders, the execution of this idea is difficult. Many traders just can’t say, “Well, I’m wrong on this one... Time to admit it, protect my capital, and move on.”
If you’re one of these traders, here’s a technique that could mean a lifetime of profitable trading...
Let’s say you’re trading a $50,000 account and having trouble cut-ting losses. When you look at your account statement at the end of the year, you see a series of large losses overwhelming your small winners.
Take a small portion of your total account – maybe $3,000 or $5,000 – and start trading a volatile sector of the market. Small-cap Chinese stocks, biotech stocks, or mining stocks work beautifully here.
Instead of placing your normal-sized position in these stocks, place just $300 or $500 into each trade. Use a stop loss of 10% or 25% on each trade. Make a lot of trades with this small “training account.” When one of these trades goes against you, cut your loss and move on. You’ll lose maybe $50 or $125 per trade.
Make as many of these micro trades as it takes in order to turn loss-cutting into an automatic reaction... just like throwing your arms

15
KNOWLEDDGE BASE
Table of Contents
out for balance when you slip on ice.
Practice loss cutting just like you would practice the piano and you’ll get great at it. You’ll know what the Market Wizards know... and you’ll start acting like them. Wealth will follow.
Back in his day, Nathan Rothschild was like Warren Buffett and Alan Greenspan rolled into one.
Nathan was one of the founding members of the greatest banking dynasty in history. He and his family bankrolled wars, giant gold purchases, governments, and anything else that could pay them interest. Even kings couldn’t match Nathan’s power and influence. He’s considered the man who financed Napoleon’s final defeat at Waterloo in 1815.
Today, many estimate the Rothschild fortune totals billions or even trillions of dollars. (The family has always managed their accounts the right way: so nobody knows how large they are.)
Despite the enormous wealth he accumulated, Nathan is best known by the classic contrarian investment quote above, which is No. 8 in our series of all-time great trading quotes.
“Blood in the streets” has become a cliché, but for good reason: To make extraordinary gains, you must buy an asset near the point of maximum pessimism.
In Nathan’s day, in 19th century Europe, folks had plenty of chances to buy when blood literally soaked city streets and battlefields. The developing nations fought hideous wars at least once a generation. In today’s age of relative peace, however, it’s tougher to follow Na-than’s lead.
8. “Buy when there is blood in the streets.”
– Nathan Rothschild

16
S&A Trader’s Manual
Table of Contents
I can’t tell you to hop on a plane and scout rental properties or stock investments in a war zone. So here’s the main thing to take away from “blood in the streets”... Great investors and traders are like birddogs for news of disaster and despondency. They don’t wince at headlines like “Gambling industry bankrupt,” or “Indian stock market crashes for seventh day in a row.” They get excited.
They know desperate situations create incredible values and incred-ible extremes in sentiment. They are always on the hunt for places where “things can’t get any worse”... When things “can’t get any worse,” they can only get better.
It’s only when things can’t get any worse that you can buy world-class businesses for just four or five times annual profits... or safe bonds yielding 18%... or trophy properties for 80% below their highs. And despite what your emotions tell you, dark and gloomy situations have a way of working themselves out.
Note that in March 2009, most folks believed the Great Depression II was in the cards. There was plenty of blood on the balance sheets of bankrupt businesses and homeowners. The average stock climbed 60% in six months after the pessimism blew over. Many stocks climbed 200% and 300%.
So turn your completely normal, knee-jerk reaction to good news on its head. Don’t rush out to buy a stock, a piece of land, or a com-modity based on some bullish headline like “Analysts all agree... crude oil is going higher.” Instead, hunt for headlines like, “Uranium prices sink to historic low... industry desperate for money,” or “Argen-tina suffers currency crisis.” Both of these headlines preceded huge gains in the past decade.
Like many great trading ideas, Nathan’s quote has been “repeated” by other skilled investors: Warren Buffett tells us, “Be greedy when others are fearful and fearful when others are greedy.” Steve Sjugger-ud says, “You make triple-digit gains not when things go from bad to good, but when things go from bad to less bad.” Peter Steidlmayer reminded us that these trades can be hard to make because of fear... but, “The hard trade is the right trade.”
However it’s phrased, the idea behind “blood in the streets” is the

17
KNOWLEDDGE BASE
Table of Contents
9. “The most important rule of trading is to play great
defense, not great offense. Every day I assume every position I have is wrong.”
– Paul Tudor Jones
same: Be on the lookout for desperate, blown-out sectors, com-modities, and countries. This is where you’ll find extraordinary deals. It’s been the surest way to triple-digit profits for hundreds of years.
It will be the surest way for hundreds more.
Tucked near the middle of the greatest book on trading ever pro-duced are 23 pages of pure paranoia.
These 23 pages center on a guy who sees trouble around every corner... a guy obsessed with risk... a guy probably worth over $3 billion... a guy who correctly called the 1987 stock market crash, made over $80 million in the process, and will go down as one of the greatest trading minds of all time.
Pages 117 through 139 of Market Wizards contain an interview with legendary trader Paul Tudor Jones.
For many years, Jones was the picture of the Wall Street big shot. He owned an enormous Chesapeake Bay mansion. He took skiing trips to Switzerland. He married a fashion model. To this day, Jones controls one of the largest hedge funds in the world.
He became so successful because of the idea behind the quote above – the idea that playing great defense is the key to succeeding in the markets. He became so successful by focusing on not losing money... His billions came as a result.
Reading Jones’ interview will take you less than 10 minutes... and it might be the greatest “time put in versus value received” proposition an investor or trader will ever get. You’ll find that for a guy associ-ated with “winning” so much money, Jones constantly talks about losing... he constantly talks about playing great defense.

18
S&A Trader’s Manual
Table of Contents
There’s a comment on defense on nearly every page. In addition to his quote above, he says:
• Don’t focus on making money. Focus on protecting what you have. • I know that to be successful [in trading], I have to be frightened. • I am always thinking about losing money as opposed to making money. • Risk control is the most important thing in trading. • Never play macho man with the market.
Like all great traders, Jones sees his No. 1 job as cutting risk to the bone. You can cut your own risk by always using protective stop losses and intelligent position sizing.
Bottom line: Keep your losses small and your winners large. And never put more than 1% or 2% of your account at risk on a given trade. An amateur trader will often risk 5% to 10% of his account on a trade, which eventually leads to disaster.
Most people lose in the stock market. It’s an incredibly hostile place, where you’re going toe-to-toe with the world’s smartest people.
So I encourage you to buy Market Wizards and read Jones’ interview many times. Repeating his “defense” lines over and over is about the best “daily affirmation” a trader or investor will find.
Playing great defense. Winning by not losing. It’s the system Paul Tudor Jones used to become a billionaire... and it’s the second most important factor in your trading success.
I saved this quote for the final essay in our series of all-time great trading quotes.
10. “The realization that you are responsible for your re-
sults is the key to successful investing. Winners know they are responsible for their results; losers think they
are not.” – Dr. Van K. Tharp

19
KNOWLEDDGE BASE
Table of Contents
It’s the “broccoli” of trading. It’s the one few people want to read.
And that’s a shame, because the idea contained in this quote is far and away the No. 1 factor in your success as a trader or investor.
Most folks who make it through the next 400 words will decide this essay simply doesn’t apply to them. Those people will always lose in the market. They will always lose in life.
And worst of all, they’ll believe those losses are not their fault.
Dr. Van K. Tharp is an investor, trader, and famed trading psycholo-gist. For decades, Tharp has worked with traders to develop winning trading systems and mindsets. His work landed him in the trading classic, Market Wizards. Of all the fancy trading systems and stock strategies Tharp could present as the “Holy Grail” for traders, this is what he chose.
Personal responsibility is the Holy Grail.
For most people, the natural tendency is to find someone – any-one – to blame for their failures. It’s too painful for most people to just come out and admit they screwed up. Since money is such an emotionally charged topic, the “blame game” is especially common in trading.
Folks blame their broker for bad advice. They blame an advisory writer for a stock tip that doesn’t pan out. They blame Wall Street for its rigged game. They blame the government, Jim Cramer, God, conspiracy theories, and anything else you can think of.
They point their finger at everyone except the person in the mirror.
The “finger pointing” mindset is the loser’s mindset, whether you’re talking about sports, work, relationships, or trading. Unfortunately, most people have it. Most people simply will not accept full respon-sibility for their actions... and it suffocates their progress.
When you always accept responsibility for your actions, you set yourself up for a lifetime of progress and betterment. When you acknowledge your errors and discover why you made them, you can take steps to correct them. Blaming someone else for your trading

20
S&A Trader’s Manual
Table of Contents
failures is like ignoring an awful sound from your car’s engine. If you ignore the sound, you’ll eventually find yourself in the middle of nowhere with a car that won’t move.
How does this apply to trading? Let’s say you’ve been taking big losses on your stocks. When you accept that you should have mind-ed your stop losses – but didn’t – then you can make it a point to fix the problem. Or let’s say the stock-picking method you’re using isn’t working. When you accept that it’s your responsibility to decide what’s best for your money – and not the responsibility of a guy on television or a stock broker – you can start looking around for a method that works.
You – and you alone – are responsible for the gains and losses in your trading account. You must take all of the wisdom and strategies accumulated by legends like Paul Tudor Jones and Stanley Druck-enmiller and put them to use.
Van Tharp has spent most of his adult life – decades – working with winning traders and losing traders. This is what he found separates the two. Many of life’s dilemmas are not “black or white” choices. Many of them are different shades of grey. This one is not. You either accept responsibility for your results and learn how to win... or you do not accept responsibility for your results and always lose.
If you’re looking for the Holy Grail of trading, it’s not in a book, stock picking system, Fibonacci series, or a currency advisor. It’s embed-ded in Tharp’s quote. It looks you in the eye every time you look at a mirror.
Trade accordingly.
P.S. I consider Van’s book Trade Your Way to Financial Freedom the second-best book on trading ever written (second to the trading Bi-ble Market Wizards). You can buy it used on Amazon for about $20. Used properly, the return on investment will be in the thousands and millions of percent.

21
KNOWLEDDGE BASE
Table of Contents
Postscript... “Number 11”
While putting this collection together, one incredible quote kept turn-ing up over and over.
I kept meaning to write up a commentary on the quote, only to realize that if I did, it would make the rest of my list a little redundant. It also has so much meaning packed into it, that it would take 20 pages of analysis to do it justice.
If you took all of the previous quotes and threw them into a stew, this is what the lot would taste like.
The quote is from a man most traders consider to be the greatest speculator in history. Here it is:
“It’s not whether you’re right or wrong that’s important, but how much money you make when you’re right and how much you lose when you’re wrong.” – George Soros
George Soros is the man who famously made $1 billion on a single trade by betting against the British Pound in 1992. He took on one of the most powerful governments in the world as the Bank of England fought to support the value of its currency. They say you should nev-er bet against the government. Well, George did, and he won.
And while many folks dislike George’s brand of politics (viewed as anti-American), there’s no disputing the man is likely the greatest trader to have ever lived. Together with Market Wizard Jim Rogers, Soros founded the Quantum Fund in 1970. They managed the Quantum Fund to a 3,365% return over the next 11 years.
Think about Soros’ quote for a moment...
Let’s take in a few pieces:
“how much money you make when you’re right”
This is the idea behind “being a pig” and committing a good deal of money to your best ideas (No. 7)... the ideas you should only move on when it’s close to “picking money up in the corner” (No. 1)... ideas that are revealed in periods of extreme sentiment and “blood

22
S&A Trader’s Manual
Table of Contents
in the streets” (No. 2). And you can only make big money when you “sit tight” and take advantage of big trends (No. 6) and being hum-ble enough to take your gains by not “confusing brains with a bull market” (No. 4)
Now... let’s go to:
“how much you lose when you’re wrong”
This is the idea behind playing great defense (No. 3) by “cutting loses, cutting loses, cutting loses.” (No. 8)... and not taking losses by fighting an irrational market (No. 9)... and the idea of not trying to be “right too soon,” (No. 5).
George’s quote doesn’t capture No. 10, which is taking personal responsibility for your results. That has more to do with you as a person than trading tactics.
But if you’re looking for that one magic quote to tape near your com-puter, take the advice from the guy many consider to be “the king,” George Soros:
Make a lot of money when you’re right, and lose a little money when you’re wrong.
This is the only way to be a winner in the market.

23
KNOWLEDDGE BASE
Table of Contents
THE SEVEN REAL SECRETS OFTHE WORLD’S BEST INVESTORS
By Porter Stansberryfounder, Stansberry & Associates
My friend Steve Sjuggerud and I were sitting in the main boardroom at the New York Stock Exchange. We’d been invited there by Eduar-do Elsztain, a wildly successful Argentine investor, to ring the open-ing bell of the exchange.
For those of you who don’t know his reputation, Elsztain got his start making a pile of money for George Soros in Argentine stocks in the early 1990s. Then, he began compounding his wealth by buying up distressed real estate in Argentina, becoming the country’s largest landowner.
We were in New York to celebrate his first U.S. real estate deal, a deal that netted the Elsztain group of investors 20% of one of the country’s largest hotel groups for roughly $0.10 on the dollar.
While Elsztain is focused on doing real estate deals, he is still an ac-tive investor in gold and stocks, too. And he has been a subscriber to our letters for many years...
When Elsztain first read Steve Sjuggerud’s True Wealth, he honestly thought someone was leaking his private memos to Sjuggerud.
“Steve, your ideas... your thinking... When I first saw your letter, I honestly thought I had written it myself. I couldn’t believe some-one else was having all of my same thoughts.” When he read True Wealth, he recognized immediately that we shared the same strate-gies and core ideas about investing.
Keep in mind, when I started working with Steve Sjuggerud as a financial analyst in 1996, I hardly knew the difference between a stock and a bond. But after a few years of working 14-hour days, six days a week... and after reading hundreds of books about finance and financial history... I still knew almost nothing. Just enough to be dangerous, really.

24
S&A Trader’s Manual
Table of Contents
I kept at it, though. And through the terrible emerging-market col-lapse of 1998-99 and the tech bear of 2001-02, I finally began to acquire the knowledge and the confidence in my own thinking I needed to make the kind of investment calls I’ve made since then... like buying right at the bottom in October 2002... like calling the top in February 2007... like predicting GM’s bankruptcy... and urging my subscribers to buy stocks in November 2008.
So... how did our thinking and Elsztain’s end up so closely aligned?
Successful investing involves only a few real secrets. Almost all of the world’s best investors use the same basic principles. Nobody teaches these principles. But everyone who stays in the markets long enough and succeeds eventually discovers them on their own.
Our meeting with Elsztain was a vivid reminder of this fact. It’s something I’d taken for granted over the years because I’d seen it so many times. You can put a group of the best investors together anywhere in the world, and nine times out of 10 they will be able to finish each other’s sentences. They’re all looking at the same things. They are all waiting on the same things. And they all see the same opportunities.
Unless I’d lived through dozens of experiences like this, I wouldn’t have believed it. But I know from firsthand experience that it is abso-lutely true: All of the world’s best investors use the same handful of techniques and strategies. And as a result, they frequently end up in the same positions.
In this essay, I’m going to do something I’ve never seen done be-fore. I’m going to teach you these core strategies. The real secrets. And I’m going to show you how to use them – just like I do with my own money.
While this information probably won’t make you a great investor overnight, it will surely improve your results dramatically over time. And if you practice the execution of these strategies, I promise you can make a living as an investor – easily.
All you really need to know is right here.

25
KNOWLEDDGE BASE
Table of Contents
Secret No. 1: You Can Time the Market... You Must Time the Market
Please take a moment to look carefully at this chart.
These are the daily closing prices of the Templeton Russian & East Europe mutual fund (TRF) over a 15-year period. This is one of the oldest and most established emerging-market mutual funds. This is the kind of fund people invest in heavily through 401(k) allocations. It is a closed-end fund. It trades like a corporation – like a regular, publicly listed stock. Sometimes it trades at a premium to its net assets and sometimes at a discount. That attracts traders and spec-ulators.
In this one investment vehicle, we have both sides of the invest-ment world. Typical individual investors (lemmings, if you will) are dripping capital into this fund, month after month, regardless of the premium or discount and oblivious of critical factors in the market-place. Meanwhile, the world’s best investors follow this fund close-ly... waiting. They are like sharks. They know this is one of the most reliably volatile funds in the world... and one of the easiest to trade successfully.
So in this one fund you have a good litmus test to compare the two major philosophies of investing. Should you buy and hold? Should you pour capital into your 401(k) blindly each month? Or should you

26
S&A Trader’s Manual
Table of Contents
time the markets? Should you know the factors that lead funds like TRF to soar to absurd levels and then crash?
Looking at this chart, you easily can see the fund peaked twice in 2006 – once in the spring and again at the end of 2006/beginning of 2007. Both of these times, TRF was trading at such an extremely high premium that we noticed it immediately.
Here’s exactly what we said at the time:
The Templeton Russia Fund (TRF) is about to get crushed again. Stuffed with Russian oil and bank stocks, this ETF is one of the few direct Russia plays in the market... This spring, the premium on TRF hit a whopping 35%. You had to pay $1.35 for every $1 of real value. This huge overvaluation was corrected when emerging mar-kets got obliterated in May. The Russia Fund fared the worst, falling 47% from its peak.
With emerging market speculation heating up again, TRF is trading for a 24% premium right now. If that premium climbs any higher, we predict another obliteration. – Brian Hunt, DailyWealth, December 21, 2006
When we published that note in December 2006, the Templeton Russia & East Europe Fund traded just shy of $95 per share. After falling in nearly a straight line for two years, it was trading for less than $7 per share in March 2009. That’s a decline of more than 90%.
Perhaps more importantly to any long-term, buy-and-hold investor, the decline we foresaw in the fund would have wiped out more than 100% of the accumulated capital gains, assuming you invested as long as 15 years earlier.
Now... I’d like you to look at the chart one more time. Look at what happened to the fund in the first half of 2009. It went nearly straight up.
On April 17, 2009, we told subscribers to buy Russian stocks. In-stead of using TRF, Steve Sjuggerud recommended a nearly identi-cal Scudder Fund, the Central Europe and Russia Fund (CEE). Both went up 150% from their March lows.

27
KNOWLEDDGE BASE
Table of Contents
So if you followed the buy-and-hold strategy in Russian stocks over the last 15 years, you would have made a very small amount of money – or lost money, depending on when you sold your shares. On the other hand, if you applied a few of our secrets, you could have easily traded this fund for more than 100% gains in only a few weeks. And if you watch this fund, you’ll be able to make trades like this three or four times each decade. If you watch other similar funds, you’ll be able to make trades like this once or twice a year.
All you’re looking for are extremes in the premium or the discount to net asset value in closed-end country funds. Barron’s publishes a complete list of these premiums/discounts in every issue.
And let me tell you one more thing about this situation. In January 2007, when TRF was widely overvalued and when most individu-al investors were clamoring to buy shares – despite the premium valuation – we checked to see if we could sell the fund short. We knew it was going to collapse and wanted to profit directly as it fell. But we couldn’t. Why not? Because other professionals had already borrowed all of the available shares to short.
In other words, while 401(k) investors were buying and holding a time bomb, Wall Street’s pros were lined up, waiting to take their money.
That’s why we call “buy and hold” “buy and fold.” That’s what hap-pens. People think they’re investors when they buy. But sooner or later, the pain gets so bad and the loss is so big they panic and sell. Wall Street wins.
Why does anyone believe “buy and hold” works?
The mutual-fund industry, which has boomed since the 1980s, used a bunch of faulty academic research to “prove” you couldn’t time the markets. According to these folks, we shouldn’t have been able to do the kind of trading we did with the Templeton Russia & East Europe Fund. They would tell you we didn’t have any real edge against the other investors in the fund. They would tell you we just got “lucky” – despite the fact that we do these kinds of trades year after year.

28
S&A Trader’s Manual
Table of Contents
Why would they promote the idea that you can’t time the markets? Because they get paid based on assets under management. They need you to leave your money with them, good times or bad. No matter what, a mutual-fund manager isn’t going to return your mon-ey and tell you, “Sorry, it’s just not a good time to buy stocks... “So they have to invent a world where it is always a good time to buy stocks.
You undoubtedly know their mantra: buy and hold. But it’s all a lie. It doesn’t work. And even if it did work, few people would be able to apply the strategy because most individual investors do not have the risk tolerance required to actually buy and hold.
Would you have been able to continue buying the Templeton Russia Fund through the collapse of 2008? Not many people could. In-stead, they chase hot sectors and investment fads and buy in at the worst possible time. Then after prices collapse, sooner or later, the pain and fear become unbearable, and they liquidate their invest-ments – usually at the exact bottom.
Believe me, the pros know that’s what individual investors are going to do. That’s how they make their living.
Meanwhile, the big mutual-fund companies spend millions on “buy and hold” advertising each year. They give more millions to academ-ic researchers – all of whom “prove” you can’t time the market. It’s a big lie.
When researchers study actual mutual-fund returns, the results are nothing like the averages you find in the prospectus. The truth is, most people who invest in mutual funds never make more than 5% a year on average because they buy the wrong funds at the wrong times and sell at exactly the wrong times. And anyone who was buying stock mutual funds over the last 15 years most likely lost money overall.
Buy and hold doesn’t work for two reasons: It ignores valuation and sentiment (I’ll explain these two factors next), and it ignores human nature. (Even if buy and hold did work, it would be a less-than-op-timal strategy because, as should be readily apparent to everyone who watches the stock market, the market isn’t as “efficient” as so many academics claim.)

29
KNOWLEDDGE BASE
Table of Contents
The intellectual rationale for buy and hold is the idea that securities prices instantly reflect all the information available. You can’t get an advantage on the market. The best investors can hope to do, there-fore, is to get the market’s average return. And the only sure way to do this is to buy an index fund, year after year, and hold it forever.
This idea – that information is reflected accurately and instantly in the market – is preposterous. In the first place, lots of people trad-ing stocks don’t know what they’re doing. They can’t accurately handicap stock prices because they don’t know the first thing about valuation.
But even more than this, most of what’s important to stock pric-es is unknowable. Nobody knows what the future holds for things like interest rates and economic growth. People’s emotions about these unknowable variables – what we call “sentiment” – make a far bigger impact on stock prices than the latest earnings report. And people’s emotions are anything but rational or efficient.
You can dramatically increase your returns in common stocks if you’re simply more disciplined about when you make major invest-ments. You only want to commit a substantial amount of capital when both valuation and sentiment are in extremely bullish ranges. In short, you want to buy when stocks are cheap and most people are afraid to buy them. Unfortunately, these opportunities don’t arise often in U.S. blue-chip stocks. But you can almost always find these conditions somewhere or in some part of the U.S. market.
Now... let me show you how the pros evaluate valuation and sentiment.
Secrets Nos. 2 and 3: The Investor’s ToolkitValuation Ratios and Sentiment Indicators
The world’s best investors don’t see the market the way you do.
And I mean that literally... They look at the market through different lenses.
Most investors know how to value equities using various valuation ratios – like the price-to-earnings ratio, the price-to-book ratio, or

30
S&A Trader’s Manual
Table of Contents
dividend yields. These valuation studies are important when you’re buying individual stocks. And they can give you some idea of wheth-er or not the market as a whole is attractive. But... there are much better ways to see valuation in the markets.
For example, here’s a 30-year chart of the S&P 500. This is the way you probably look at the market. And when you look at the market this way, it looks pretty expensive. Stocks have been mostly going up for a long time. The big selloffs in the past decade didn’t bring the S&P 500 index back down all that much... or so it seems when you look at a plain chart.
But there’s a much better and more accurate way to view the markets.
The next chart is the S&P 500 again, from the same time period. As you can see, this chart looks nothing like the first one. In this chart you can see the huge mania of the 1990s – where the chart goes nearly straight up. And you can plainly see the big top formed in stocks in the early 2000s. But in this chart, the second top in stocks we saw in 2007 doesn’t exist. It’s like the bull market of 2002-07 never happened.
This chart is the S&P 500, but measured in gold, rather than U.S. dollars. What this chart shows is the value of stocks as compared to gold. Gold is a much better standard of value than the U.S. dollar

31
KNOWLEDDGE BASE
Table of Contents
because it can’t be printed or manipulated as easily as the U.S. dollar.
What this second chart shows is how cheap stocks have really become – something you can’t see on the regular S&P 500 chart because of the effects of inflation.
At the bottom of stock prices in the late 1970s, just one ounce of gold (then at $800) would have bought an entire unit of the Dow Jones Industrial Average. Stocks and gold were trading on a one-to-one basis, based on this measure. At the peak of stock prices in 2000, a unit of the Dow was worth $14,000. And an ounce of gold was only worth $260. To buy the Dow would have cost more than 50 ounces of gold. Obviously, stocks were extremely expensive – 50 times more expensive than they were at the bottom in 1980.
In January 2011, gold was trading around $1,700 an ounce. And the Dow was near 12,000. It took roughly seven ounces of gold to buy the Dow.
Looking at stocks through the lens of gold gives you a much better idea of where we are in terms of sentiment and valuation. Using this gold ratio will help you make much better asset allocation decisions. You want to buy stocks when the ratio of the Dow to the price of gold is low – less than 10. And you want to buy gold when the ratio is high.
32
S&A Trader’s Manual
Table of Contents
Using a chart just like this, my partner Bill Bonner began to tell peo-ple to buy gold and sell stocks in 2000. Using the same chart, I told Doug Casey’s Gold Summit audience in March 2009 to buy stocks instead of gold.
There are lots of different ways to use ratios to get a better sense of what market prices really mean. We use gold as a factor in many of our ratio studies, but it isn’t the only choice. Gold has traditionally been used as the world’s reserve currency, so it works as a good al-ternative currency for valuation metrics. But ratios can also be used to study assets that are intrinsically linked.
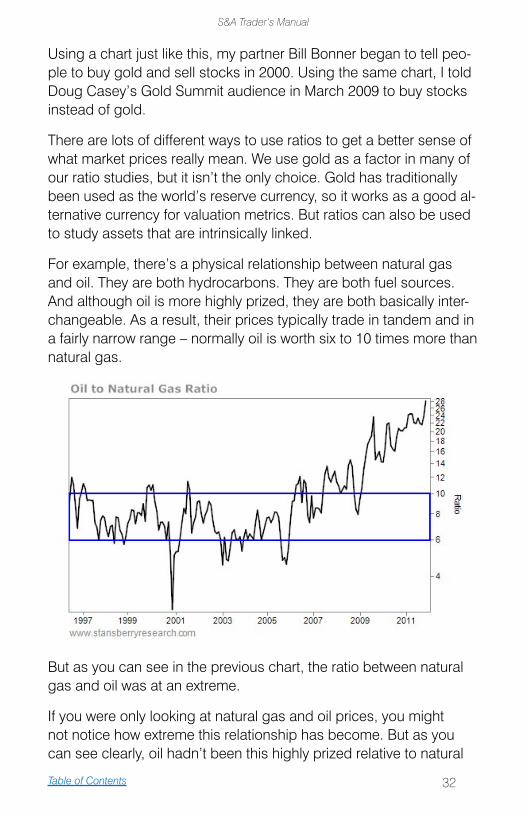
For example, there’s a physical relationship between natural gas and oil. They are both hydrocarbons. They are both fuel sources. And although oil is more highly prized, they are both basically inter-changeable. As a result, their prices typically trade in tandem and in a fairly narrow range – normally oil is worth six to 10 times more than natural gas.
But as you can see in the previous chart, the ratio between natural gas and oil was at an extreme.
If you were only looking at natural gas and oil prices, you might not notice how extreme this relationship has become. But as you can see clearly, oil hadn’t been this highly prized relative to natural

33
KNOWLEDDGE BASE
Table of Contents
gas since before 1996. That’s because natural gas production has soared thanks to major new shale discoveries, causing inventories to swell to record levels.
At the time, nobody wanted natural gas. The record-low valuation of natural gas as compared to oil showed that market participants had come to believe natural gas will never be valued at par with oil again. That’s impossible, of course, because as the price of a com-modity falls – especially one as useful as natural gas – consumption rises. Sooner or later, scarcity returns and the price will go back up. But the point is, you want to buy commodities (or other markets) when the valuation ratios tell you people have totally lost faith that prices will ever return to normal.
Look at the chart again. Back in 2001, the price of oil relative to natural gas neared an all-time low. Oil was trading for only about two times more than natural gas. That’s because Enron had rigged the domestic market for natural gas and the global recession had knocked down oil prices.
Nobody knew Enron was rigging the market. But you didn’t need to know: All you had to know was that the relationship between the two fuels was bound to correct back into the six-to-10 range, and the most likely way for that to happen was for the price of oil to go up. This was a great buy indicator for oil. And as you know, oil prices went nearly straight up from 2001 until the summer of 2008.
Now, this chart is telling us the ratio between natural gas and oil was completely out of whack again in 2011. And using a gold ratio chart, we can also see natural gas was about as cheap as it’s been in 15 years.
[Chart on following page]
Natural gas is worth watching closely. And I know every great inves-tor in the world is doing the same thing. I know because I’ve spoken to a handful of them about natural gas. I know because legendary investors have been buying lots of natural gas-related stocks. Final-ly, I’ve been in the markets long enough to know, when you see an anomaly like this, it’s going to attract a lot of capital... At some point, lots of people are going to make a killing in natural gas.

34
S&A Trader’s Manual
Table of Contents
Valuation studies, like the ratios I’ve shown you, can tell you a lot about when prices are attractive. Sentiment tells you when we’re at the bottom of prices. Sentiment, however, covers a wide range of factors. There’s no single best way to judge sentiment; it requires experience... and intuition.
I’ve learned to wait on a lot of factors. My favorite is magazine covers. When you see a market that’s gotten out of whack, like natural gas, you want to see the mainstream press report the false conclusion. I’ll never forget The Economist cover from November of 1998 when oil traded for $7 per barrel. Just two or three years before “Peak Oil” would become the intellectual fad, The Economist asked on its cover if we were “drowning in oil.”
Another great sentiment indicator is suicides. In December 2008, I recommended GDX, a fund of gold stocks. I did so because several of the best-known gold-stock speculators had blown their accounts up spectacularly in the horrible gold bear market of 2008 and then blown their heads off in late October – which, of course, marked the exact bottom of the market for gold-mining stocks. When you hear about speculators committing suicide, you want to be a buyer.
Finally, I recommend you check out www.sentimentrader.com. It is the best sentiment research out there, and the website is run by a friend of ours, Jason Goepfert.

35
KNOWLEDDGE BASE
Table of Contents
There are very few firm rules about using sentiment. Like I told you, it’s mostly a matter of judgment and experience. You have to learn how a market feels when it’s near a bottom or a top. But I know two things for sure about sentiment...
First, you never, ever put on a big trade if the crowd is already in the position. You can’t hope to succeed as an investor if you’re chasing the market. So if the position you want to take is popular or crowd-ed, wait for a better idea to come along.
And second, you can ignore sentiment as an indicator 90% of the time. It’s only really important at the extremes. When markets be-come intensely loved or intensely hated, that’s the time to pay atten-tion to sentiment and trade opposite the crowd.
Secrets Nos. 4 and 5:Trailing Stops and Position Sizing
We have two kinds of customers at my firm, Stansberry & Associ-ates Investment Research: folks who will cut their losses and folks who will not.
And unfortunately, the “will not cut losses” customer is the most common.
Here’s what happens. The prospective subscriber sees one of our advertisements, which are designed to catch your eye with whatever stock or sector we think is going to be hot. This stock or sector is, unfortunately, usually too popular by this point to be a great invest-ment. We’re typically trying to grab the tail end of a trend – which can be very lucrative. But the key to these kinds of trades is one of the few, real secrets to investing: trailing stop losses.
Our new client, however, grew up on a steady diet of “buy and hold.” He believes staying with a stock is a matter of pride and masculinity. He is no quitter. So when we stop out of the story that he originally subscribed to learn about, he doesn’t sell. In fact, he starts writing us e-mails every third day asking why we’re no longer covering his baby. And of course, he buys and buys and buys all the way down.

36
S&A Trader’s Manual
Table of Contents
Now it’s six months later. We’ve been out of the stock – with a decent profit – for so long we’ve forgotten why we liked it in the first place. We’re walking through the exhibits at a conference when Mr. Buy and Hold stops us and demands to know why we’ve cost him $50,000 with our terrible recommendation.
“Do you mean the stock we sold months ago?” we ask.
“Yes, that’s the one... and don’t give me any excuses about stop-ping out. Everyone knows you have to buy and hold if you want to make money in stocks,” the former client says.
For the next several years, we’ll see this poor fellow every now and then. He’ll swear to everyone he meets it is Porter Stansberry’s fault he lost a bundle on that stock, which has now tumbled more than 90%. But the man will say, “I’m still buying because I know it’s coming back.”
The second kind of customer is the one we prefer. He actually takes our advice, which is to determine ahead of time the price you’ll sell any given stock. Some stocks demand more leeway. Some situ-ations require a lot less. But the point is, you don’t let the market convince you to stay with any given investment. The market can be irrational for a lot longer than you can be solvent.
If you are a good investor, you already know: Losses are part of the game. If the losses are small, they don’t matter. If you’re not a good investor, you see every loss as a failure. But small losses aren’t fail-ures. They are victories – victories against big losses. And big loss-es have to be avoided, at all costs. Nobody can survive a big loss.
If I could teach every investor only one secret it would be to cut your losses and let your winners run. If you refuse to do these two things, you will never be successful as an investor. Remember: It is difficult to get everything right in any given trade – valuation, sentiment, timing, position size... When you’ve made a mistake, admit it quickly and move on. When you get everything right, treasure it. Hold on as long as possible.
When we hire new analysts at Stansberry & Associates, the smart-est guys have the hardest time buying into these ideas. Smart guys think they’re smarter than the market. And usually they are. The

37
KNOWLEDDGE BASE
Table of Contents
problem is, you only have to be wrong once to suffer a catastrophic loss. And everyone – and I mean everyone – is wrong at least once every few years. So you have to completely rule out the possibility by being a disciplined investor and cutting your losses. There is no other way.
There’s one more thing you have to know about cutting your losses and that’s Secret No. 5 – position sizing. The secret is simple: You adjust your position size based on the maximum risk you’re taking. You should never put more than 3% of your portfolio at risk and, ideally, you should never lose more than 1% of your portfolio on any trade. So if you’re going to put 5% of your portfolio into a risky stock, you should use a 20% stop loss. If you’re wrong, no problem – you’ve only risked 1% of your portfolio.
If you want to hold a position longer and expect a lot of volatility, you should simply use a smaller position size – all the way down to a 1% position size for stocks that are basically lottery tickets. On the other hand, from time to time, I recommend position sizes up to 25% of your portfolio.
Every few years, an exceptional opportunity will appear in very low-risk stocks. Never put on a trade of this size unless you are certain the position is incredibly safe. If you’re not an expert at evaluating a company’s balance sheet and its earnings prospects, you shouldn’t put on positions of this size – ever. Also, when you put on a jumbo position, you must use a trailing stop loss, which moves your stop point higher as the stock goes up.
Every successful investor uses some combination of stop losses or position-size limits. And yet most individual investors know nothing about these key strategies.
Secret No. 6: Positive Carry
Most individual investors use margin the wrong way – or not at all.
The most common way individual investors use margin is through buying put or call options. They want a big leveraged position, and

38
S&A Trader’s Manual
Table of Contents
they buy their leverage in the options market. They would get better odds in Vegas. Buying leverage in the options market is extremely expensive and unlikely to lead to success over the long term. Most of the great investors I know never buy options. They only sell them.
Why? Positive carry.
“Carry” refers to the cost of borrowing money. When interest rates are low, most institutional traders can get margin loans for between 3% and 4% annually. So to make money with this margin, they don’t have to earn very much. Using conservative strategies – like selling puts on stocks they want to buy anyway, they can easily earn 15%-30% per year.
These kinds of highly leveraged positions (you only have to put up 20% to sell a put) involve some risk. But if you’re good at it, you can make incredible profits. You’re borrowing money at 4% and earning 20% with it. This is “positive carry.”
There are lots of ways to earn positive carry. You can sell option premiums. You can invest in higher-yielding debt obligations, like junk bonds. You can lend money to payday loan venders... The point is most of the great investors I know are always involved in carry trades of some kind. They keep 25%-50% of their capital tied up in these kinds of trades, which will earn them around 20% a year. They only take their money out of these kinds of trades when there’s a really unique and profitable opportunity.
The best way for individual investors to mimic these kinds of carry trades is to use margin accounts to buy high-yield bonds. Even if you’re paying 6% a year for your margin, you should often be able to produce a 10% positive carry.
Don’t use margin to buy speculative positions. Don’t use margin because you’re not disciplined enough to keep a cash reserve. Only use margin when you can calculate that it will enable you to pro-duce a substantial amount of positive carry.
Finally... even if you decide not to engage in carry trades, you should at least pretend that your default cash setting will net you 10% per year. And yes, it’s possible to make 10% a year in liquid positions.

39
KNOWLEDDGE BASE
Table of Contents
I want you to pretend your default setting earns 10% a year because when your downside is positive 10% a year, you be-come far more skeptical about new ideas. And that’s the key. You only want to take on new positions you think are safe, when the valuation and the sentiment is in your favor, and when the upside is so significant it’s worth risking the 10% a year you would make otherwise.
Secret No. 7: Compound Interest
Richard Russell is the dean of the financial newsletter industry. He has been writing Dow Theory Letters since the 1950s. If you’ve never read his famous essay “Rich Man, Poor Man” before, stop right now, go to his website (ww2.dowtheoryletters.com), and click on the link to it. It’s right there on the front page of his web-site.
To explain the power of compound interest, Russell notes that if a 19-year-old put $2,000 each year into his IRA for seven years in a row and then never contributed another penny to his retirement, he’d have $1 million by the age of 65, assuming he earned 10% a year on his account on average. If another investor started saving for retirement at 26 – the same age the first investor stopped con-tributing – and he put $2,000 into his IRA every single year until he was 65, he still wouldn’t catch up to the first guy.
Now lots of folks who see this information think, “Oh, it’s too late for me. I don’t have enough time to compound my wealth.” No, that’s not true. What this presentation really means is that you have to start now. You have to learn to be a saver. You have to make sure your money is earning interest all the time. Most of all, you must realize if you’re borrowing money (without a positive carry), you will never, ever be rich.
Says Russell:
And because the little guy is trying to force the market to do some-thing for him, he’s a guaranteed loser. The little guy doesn’t under-stand values so he constantly overpays. He doesn’t comprehend

40
S&A Trader’s Manual
Table of Contents
the power of compounding, and he doesn’t understand money. He’s never heard the adage, ‘He who understands interest – earns it. He who doesn’t understand interest – pays it.’ The little guy is the typical American, and he’s deeply in debt.
The little guy is in hock up to his ears. As a result, he’s always sweating – sweating to make payments on his house, his refrigera-tor, his car, or his lawn mower. He’s impatient, and he feels perpet-ually put upon. He tells himself that he has to make money – fast. And he dreams of those ‘big, juicy mega-bucks.’ In the end, the little guy wastes his money in the market, or he loses his money gambling, or he dribbles it away on senseless schemes. In short, this ‘money-nerd’ spends his life dashing up the financial down-es-calator.
But here’s the ironic part of it. If, from the beginning, the little guy had adopted a strict policy of never spending more than he made, if he had taken his extra savings and compounded it in intelligent, income-producing securities, then in due time he’d have money coming in daily, weekly, monthly, just like the rich man. The little guy would have become a financial winner, instead of a pathetic loser.

41
KNOWLEDDGE BASE
Table of Contents
THE CRUX INTERVIEW
THIS LITTLE-KNOWN SECRET VIRTUALLY GUARANTEES YOU’LL MAKE
MONEY IN THE MARKET
You can file this interview under “trading ideas you’ve never heard of.”
The trading idea you’ll read about below is something that could immediately turn a struggling trader into a highly profitable one.
This idea has nothing to do with a specific stock or commodity trad-ing system. Instead, it’s a rarely used trading exercise you can use to ensure you’re always making money in the market.
Sharing this secret is Brian Hunt, Editor in Chief of Stansberry & Asso-ciates Investment Research. Brian is a successful private trader, and oversees one of the world’s largest independent financial research firms. He also writes the “Market Notes” column in DailyWealth, one of the most popular daily investment advisories in the world.
Read on for how to perform this valuable trading exercise...
The Crux: Brian... you’re a believer in a rarely used trading strategy that can drastically improve a trader’s performance. Something you call a “position audit.”
Can you talk about this idea, and how our readers can start using this to make more money?
Brian Hunt: Sure... A position audit is something everyone with money in the market should do at least once a year. And if you’re a trader who typically holds positions from two months to two years, you should do this exercise every month.
The exercise is taking a hard look at every position you have – long or short – and asking yourself, “If I wasn’t in this position already, would I take it now?”
If the answer is “no” on any position, sell it immediately.

42
S&A Trader’s Manual
Table of Contents
Crux: So the trader forces himself to be objective with his holdings on a regular basis.
Hunt: Exactly.
You see, lots of investors and traders struggle with admitting mis-takes and taking losses early. Rather than cut losing positions early, they tend to hold onto them and say something like, “it will come back.”
Or just as bad, they ignore the loser. They’ll ignore a loser that is down 20% or 30% until it grows into a giant 60% or 80% loser. And of course, it’s the giant losers that ruin your year... or your trading career.
It’s simple human nature to try to forget your mistakes. Life is easier that way. And in many cases, forgetting painful memories and mis-takes is a good thing.
For example, if an NFL quarterback has a horrible Sunday and throws five interceptions, he’d better get over it quickly... because he’ll need his self-confidence to be effective in the next game.
But with trading, ignoring a mistake is like ignoring cancer. If you catch it early, it’s not going to destroy you. But if you ignore it for months or years, it’s going to be fatal.
Your goal with regular position audits is to force yourself to confront your mistakes... and root them out of your portfolio before they be-come big ones.
Crux: Do you recommend this for trades based on fundamentals or based on technical analysis?
Hunt: Both.
Let’s say you buy company ABC because you think it’s going to come out with a new tech gadget that will sell millions of units. If that gadget comes out, and isn’t a hit – let’s say it only sells 20,000 units – the rea-son for owning that stock doesn’t exist anymore. It’s time to sell.
Or, let’s say you buy a big dominant company, like phone-maker

43
KNOWLEDDGE BASE
Table of Contents
Nokia used to be.
You think to yourself that it’s going to be a good long-term holding. But, if Apple comes along with a game changing product like the iPhone that starts eating into Nokia’s market share, the reason you bought that stock no longer exists. It’s time to sell.
Those are two fundamental examples. Of course, a company has lots of moving parts you have to analyze. I made those examples very simple... but you get the idea.
Crux: Okay, how about a technical example?
Hunt: Let’s say you short a company or a commodity because you think it has reached a top. Maybe it has bumped against a particular price level and cannot break through it... it suffers high-volume sell-offs. It cannot rally on great news. Those are technical reasons that cause some people to go short.
But let’s say that after a few months the trader goes short, the stock manages to break through to a new high on strong trading volume.
Your whole case for going short months ago is no longer valid. It’s staring you right in the face. But most traders just won’t admit it.
They won’t confront the mistake and cover the position. Inertia and denial take over at this point... and you’re now holding onto a posi-tion simply because you took it a few months ago, which is a terrible reason to be in a position.
If the reason you took the position in the first place isn’t there, or has drastically changed, while you are doing your audit, get rid of the thing.
Crux: I have a feeling we’d have record-breaking trading volume next week if every investor or trader decided to sell old losing stocks they’ve been ignoring for a long time.
Hunt: Oh, wow... Yes, you’d see an unbelievable dumping of stocks.
I’ve talked with folks at investment conferences who tell me they own over 100 different stocks. That’s crazy. There’s no way one indi-vidual can keep track of that many companies and do a good job of

44
S&A Trader’s Manual
Table of Contents
it. Those kinds of portfolios probably have 80 or 90 stocks where the original reasons for buying the shares are no longer there. They’re simply being ignored.
Most people would rather ignore the mistakes than take steps to confront problems and become winners. But that’s between them and their therapists.
The successful trader has to constantly confront – and admit – his mistakes. He has to be an objective reviewer of his ideas.
Crux: There’s an extra problem with holding onto losers that is worth mentioning... It ties up money that could be deployed into new, better ideas.
Hunt: Absolutely.
For example, take someone who bought a bundle of tech stocks back in 1999 or 2000. By 2003, after years of a bear market, the trader or investor who didn’t cut his losses has what’s left of his money tied up in some garbage “dot com” companies.
That’s money that can’t be deployed in an emerging bull market like commodities were back then. It’s a double whammy. That trader is holding crap and missing out on a promising trend. It’s the com-plete opposite of the golden rule of trading, which is “cut your losers short and let your winners ride.”
Crux: Okay... so how can a trader perform this kind of audit without dumping his winners as well? Wouldn’t you cut your winners short in a lot of situations?
Hunt: That’s a great question. One has to be careful here. It’s key to ask yourself what your original reason was for entering the position, and what your goal with the position is.
For example, let’s say you’re a trader who bought Intel months ago because it was super cheap at, say, eight times cash flow, and you expected the stock to pop because you thought the market would soon be willing to pay 12 times cash flow for the stock. This is a shorter-term idea for you.

45
KNOWLEDDGE BASE
Table of Contents
Now, let’s say you were right... let’s say Intel has popped higher and is trading for 10 times cash flow, now. While performing your audit, you’d note that your original bullish argument is still intact. You wouldn’t buy more of this position, but you wouldn’t sell it. You’d hold it, and look to take profits once it hit your objective... the 12 times cash flow objective.
But let’s say someone else bought Intel at the same time with a long-term holding goal of at least five years. That person would sim-ply periodically check out Intel’s position in the market, and make sure the fundamental case is still solid. If it is, you’d hold the stock, and look to compound for a long time.
For traders, it really does come down to holding winners when your plan is working out. Not necessarily buying more, but holding it be-cause the trade is working out according to your plan.
The key here is placing most of your audit’s focus on the losers. Those are the potential cancers in your account.
They need to be placed in an interrogation room and given the third degree. Is the fundamental story here still in place? If it’s a stock that you’re long of, is it still a great value? Has management done any-thing stupid that is wrecking the company? Is the company’s new gadget selling well? Is the technical picture still the same?
If the fundamental picture or technical picture has changed on one of your losers, chances are very good you’ll be better off dumping it and moving that capital into cash, or another promising idea.
Crux: So how often do you conduct an audit?
Hunt: I do one at the end of each month. I typically trade with an intermediate time frame... like one to six months, so a monthly audit works for me. I usually hold 4-6 positions at any one time, and I’m very quick to cut losers. Oftentimes, the losers aren’t around at the end of the month.
Crux: Sounds great. Thanks for talking with us, Brian.
Hunt: You’re welcome.

46
S&A Trader’s Manual
Table of Contents
Editor’s note: One neat little tool we’ve found to be a great help to our readers is something called “TradeStops.”
TradeStops is a simple, easy-to-use piece of software that alerts investors and traders when one of their positions hits a protective stop loss point. It was developed several years ago by a PhD math genius reader of our publisher, Stansberry Research.
If you’re an investor or trader who stays busy with your job and your family, TradeStops is a great tool that will help you manage your positions and their stop losses. It’s cheap, easy to use, and can save you a fortune. You can learn more about our corporate affiliate TradeStops at www.tradestops.com.

47
KNOWLEDDGE BASE
Table of Contents
THE CRUX INTERVIEW
THE MAGIC WORDS EVERY INVESTOR/TRADER SAYS OVER AND OVER, ALL THE TIME
Now more than ever, investors are looking for ways to make consis-tent profits without taking crazy risks or turning their money over to a Wall Street broker.
So it’s no surprise that our interview with Brian Hunt, Editor in Chief of Stansberry & Associates Investment Research (the Crux’s publisher), was popular with readers.
In the interview, Brian discussed the concept of a “position audit,” something most investors have never heard of, but professionals rely on to boost profits and minimize losses.
Below, Brian discusses another fantastic strategy to improve your success in the markets.
Read on to learn how five simple words could revolutionize the way you approach investing.
Good investing,
Justin BrillManaging Editor, The Cruxwww.thecrux.com
The Crux: Brian, we had a good amount of reader feedback that appreciated your “position audit” recommendation for investors and traders.
You also have something you call the “five magic words” that every rich investor or trader says over and over. You claim it’s the secret to getting rich in the markets and through investments. Can you share those magic words?
Brian Hunt: Sure... The five magic words – and this works with real estate investing, small business investing, blue-chip stock investing,

48
S&A Trader’s Manual
Table of Contents
or even short-term trading – are: “How much can I lose?”
The rich, successful investor is always focused on how he can lose money on a deal, a stock, or an option position. He is always focused on risk. Once he has the risk taken care of, he can move on to the fun stuff... making money.
Almost everyone who is new to the markets or new to making invest-ments is 100% about making money... the upside. They’re always thinking about the big gains they’ll make in the next big tech stock or currency trade, or their uncle’s new restaurant business.
They don’t give a thought to how much they can lose if things don’t work out as planned... if the best-case scenario doesn’t play out. And the best-case scenario usually doesn’t play out. And since the novice investor never plans for this situation, he gets killed.
I’ve found, through years of investing and trading my own money, and through years of hanging out with very successful businesspeo-ple and great investors, that when presented with an idea, the great investor or trader reflexively asks early in the discussion, “How much can I lose?”
Like I say, this can be a real estate deal, a small business investment, a quick trade, a stock position, or a commodity investment. The con-cern is always, “How much can I lose? What happens if the best case scenario doesn’t pan out?”
Crux: It’s along the lines of Warren Buffett’s famous rules of success-ful investment. Rule one: Never lose money. Rule two: Never forget rule number one.
Hunt: Right. Buffett is probably the greatest business analyst to ever live... the greatest capital allocator to ever live. He’s worth over $40 billion because of his ability to analyze investments.
When they ask the old man his secret, he doesn’t talk about the intricacies of balance sheets or cash flow analysis. The first thing he recommends to folks who want to make money in the market is to not lose money in the market. He’s obsessed with finding out how much he could potentially lose on a stake. Once he’s satisfied with that, he

49
KNOWLEDDGE BASE
Table of Contents
looks at what the upside is.
So Buffett is your great investor. Now take Paul Tudor Jones, an incredible trader with a net worth in the billions. His interview in the trading bible Market Wizards is the most important thing any new trader can read. His interview is filled with how he’s obsessed with not losing money... with playing defense.
Tudor’s famous quote is the trader’s version of Buffett’s investment quote. Tudor says the most important rule of trading is playing great defense, not offense.
If a new investor or trader taped Buffett’s quote in a place he’d see it every day... and if he read Tudor Jones’ interview once per month... and if he reflexively asks himself, “How much can I lose?” before in-vesting a penny in anything, he’d be worlds ahead of most people out there. He’d set himself up for a lifetime of wealth.
Crux: Okay, that covers the theory. How can we put “How much can I lose” into everyday practice?
Hunt: Well, if you’re putting money into a start-up business, a specu-lative stock, an option position, or anything else that is on the riskier end of the spectrum, the answer to “How much can I lose?” is usually, “Every last dollar.”
While speculative situations can be tremendous wealth generators, they’re best played with small amounts of your overall portfolio. Or if you’re a conservative investor, not played at all. Let’s say you’re buy-ing a speculative gold mining stock or a speculative tech company with just one potential “big hit” product.
With speculative positions, there is always the possibility that your money could evaporate. This is where the concept of position sizing comes into play. In a speculative situation, you’re going to want to put just 0.5% or just 1% of your overall portfolio into that idea. That way, if the situation works out badly, you only lose a little bit of money. You certainly don’t want to put 5% or 10% of your portfolio into a specula-tive position. That’s way too big.
Crux: How about advice for conservative investors?

50
S&A Trader’s Manual
Table of Contents
Hunt: I think conservative investors should stick to Warren Buf-fett-type investments... owning incredible companies with great brand names like Johnson & Johnson or Coca-Cola. These are the safest, most stable companies in the world.
When you buy companies like this at cheap prices, when they are out of favor for some reason, it’s very hard to lose money on them. They are such incredible profit generators that their share prices eventually rise and rise.
My friend and colleague Dan Ferris, who writes our Extreme Value advisory, provides advice on how and when to buy these dominant companies better than anyone in the business. He knows exactly what they are worth... and he watches them like a hawk to find the right buy-points for his readers.
If a conservative investor can buy a super world-dominating company like Johnson & Johnson or Coca-Cola or Intel for less than eight or 10 times its annual cash flow, it’s very hard to lose money in them. Eight to 10 times cash flow is often a hard floor for share prices of elite busi-nesses. They don’t go down past that.
Crux: How about the concept of “replacement cost”? Do you think that’s important in the quest to not lose money?
Hunt: Funny you mention that. I had lunch with a successful profes-sional real estate investor who raved about some of the values he found on the east coast of Florida.
The market was wrecked there. There are a lot of sellers who needed to dump right then and ask questions later... So he’s found tons of properties that are selling for less than the cost it would take to build the structures if they weren’t there in the first place. He’s bought prop-erties for less than that rock bottom value... for less than replacement cost.
Since he is focusing on not losing money... and buying below replace-ment cost... it’s going to be easy for him to make money on his prop-erties. Mind you, he’s not raving about price appreciation potential. His eyes lit up because his downside was so well-protected.

51
KNOWLEDDGE BASE
Table of Contents
That’s the mindset the new investor needs to cultivate. He needs to realize the time to start raving is when he’s found a situation where it’s going to be difficult for him to lose a lot of money. The upside will take care of itself.
Crux: How about commodities? I know you like to trade commodity stocks.
Hunt: Oh I love to trade commodity-related stocks... copper produc-ers, oil service companies, uranium, gold, silver, agriculture. They boom and bust like crazy. And you can make money both ways. I like to say they are “well behaved.”
The key to not losing money, which leads to making terrific money, in commodity stocks, is to focus your buying interest in commodities that have been blown out... that are down 60% or 80% from their high. Find commodities that have suffered brutal bear markets. The longer the bear market, the better. This is the time that the risk has been wrung out of them.
Every commodity has what’s called a “production cost.” This is how much it costs to produce a given unit of that commodity. It’s similar to the concept of “replacement cost.”
After a big bear market in a commodity, you’ll often find it trading for below its replacement cost. Sentiment toward the asset will be so bad that nobody wants it. So producers get out of the business... and de-mand for that commodity increases because it is so cheap. This sows the seeds of a big bull market.
But to get back to covering your downside in commodities, focus on markets that have suffered a terrible selloff, or bear market. In these situations, the answer to “How much can I lose?” is often, “Not much... It’s already selling at rock bottom levels.”
You can certainly make money in commodities that have been trend-ing higher for a long time, but the sure way to not lose money is to focus on the commodities that have absolutely been blown out.
Gold and gold stocks were a classic case of this in 2001. Gold and gold stocks were such bad investments for so long that everyone who

52
S&A Trader’s Manual
Table of Contents
bought in the 1980s or 90s had sold their holdings in disgust. They finally got so cheap and hated that they couldn’t go any lower any-more. Then they skyrocketed.
Crux: Good advice... Any parting shots?
Hunt: When you start out in this game, you’re as bad as you’re going to get. So take supertrader Bruce Kovner’s advice and “undertrade.”
Make really small bets to get the hang of things... to get the hang of handling your emotions. If you have $10,000 to get started, set aside $7,000 and trade with $3,000 for the first six or 12 months.
But even after going through a training period like this, it’s tough to learn not to lose money unless you actually feel the pain of losing a lot of money. It took me touching several very hot stoves and suffering several big losses early on in my career before I learned this.
If I am a skilled trader and investor nowadays, it is only because I have made every boneheaded mistake you can think of and learned not to repeat it. I’ve learned that you can make great money in the market simply by not making stupid mistakes... by playing great defense.
Crux: Winning by not losing. It works for Buffett and Paul Tudor Jones... So it’s probably worth focusing on. Thanks for your time.
Hunt: My pleasure.

53
KNOWLEDDGE BASE
Table of Contents
THE FOUR DIRTIEST WORDS IN TRADING
By Brian HuntEditor in Chief, Stansberry & Associates
I heard the four dirtiest words in trading recently...
My friend had recently purchased stock in a small oil company for around $20 per share. Things weren’t going well for the company, so its share value was down to $8 – a 60% loss for my friend.
Here’s what he said: “It will come back.”
I shuddered at his analysis of the situation. I shuddered at those four dirty words.
This is the mantra of stock market losers. If you catch yourself making this statement, immediately sell all your stocks and stick the cash in the bank.
You’ll be much better off financially if you do. You’ll also have a lot less stress in your life.
“It will come back” is a common reaction investors and traders have after seeing a stock fall 30%... 50%... or 70%. Most folks just can’t stand to admit they’re wrong. Saying “it will come back” allows them to convince themselves they aren’t wrong... just “early.”
It allows them to keep hope alive... and to ignore the elephant in the room: They need an absolutely huge, highly improbable gain just to break even.
Consider this: If you buy a stock at $20 and it sinks to $8, you need a 150% gain just to get back to breakeven. We all know how rare a 150% move is. Saying “it will come back” ignores the overwhelming probability that you are sitting on a loser that will keep losing.
But most folks don’t consider the odds when it comes to putting their hard-earned money in the stock market. That’s why the majority of folks lose. That’s why Wall Street firms have such beautiful, expensive buildings with lavish furnishings.
Many folks have 10 or 20 worthless losers in their accounts that they

54
S&A Trader’s Manual
Table of Contents
have moved to the back of their minds... 10 or 20 losers they still believe will “come back.”
As I said, the solution for these folks is to sell everything and stick the cash in the bank. If you’re one of them, do some housecleaning. If you have a group of stocks that will “come back,” face reality and throw them out like yesterday’s newspaper. This will clear out your mind and your account.
Getting rid of losers is the cure for the disease. But a better solution is not to contract it in the first place. Use stop losses – the predeter-mined points at which you will sell positions if they move against you.
Sure, it’s a little uncomfortable to face your losers and admit you were wrong. But it’s the only sure way to make money in stocks: Use stop losses... realize it’s highly unlikely big losers will ever get back to breakeven... and always avoid the four dirty words of trading.

55
KNOWLEDDGE BASE
Table of Contents
THE ONLY RELIABLE “CYCLE” IN THE MARKET
By Brian HuntEditor in Chief, Stansberry & Associates
Many years ago, I came across a stock market phenomenon that looked like the “Holy Grail” of trading.
I came across the Elliot Wave Principle. And at some point in your trading career, you will too.
The basic idea behind the Elliot Wave Principle (EWP) is the mar-ket moves in cycles. An accountant named Ralph Nelson Elliot de-veloped it back in the 1930s. According to Elliot’s theory, upward market moves occur in a series of five small stairstep-like “waves” inside a larger cycle. Down moves occur in three small waves.
Traders swing between greed (buying) and fear (selling) like a pen-dulum, creating these cycles. And as theory goes, you can spot them and use them to time market moves for big money.
Elliot is long gone these days. But an analyst named Robert Prech-ter keeps the EWP torch burning. That’s where most hear about these cycles. And when you read the marketing material from folks selling EWP information, it sounds like they’ve unlocked the mys-teries of the stock, bond, and commodity markets.
Should you go after this “Holy Grail” of trading?
Well, Robert Prechter is an excellent analyst. He’s written some of the most insightful stuff on crowd behavior I’ve ever read. And he’s used EWP to make some great financial predictions, like the 1987 market crash and 2008’s crash. The billionaire supertrader Paul Tudor Jones is also known for using EWP to time trades. The “principle” has produced some major wins.
But years ago, I spent time studying this wave theory. I read the books. I read the newsletters. Most importantly, I asked a lot of smart, wealthy investors their opinion. I came to the same conclu-sion most of them did: Trying to pick out “waves” in a price chart – and trade on them – is too subjective to be of great use to most

56
S&A Trader’s Manual
Table of Contents
traders. Here’s why...
It’s just too easy for the average trader to fool himself when trying to pinpoint cycles in a chart. It’s like checking the mirror a week after starting a diet. Your mind is going to play tricks on you. One day you see a wave, one day you don’t.
So despite Prechter and Jones’ success, my advice to the part-time trader is this: Don’t spend much time studying predictive theories - like Elliot waves or lunar cycles. Some huge crazy event comes along and makes hash out of all predictive models. Life is just too random for them to work.
Sure, some market “predictor” will grab headlines for calling a few moves correctly. But his track record will probably reveal his accu-racy is the same as a coin flip.
What you should do is spend a lot of time learning how to be a connoisseur of extremes. Learn that the only reliable “cycles” in the markets are periods of extreme pessimism toward an asset (when that asset gets dirt cheap)... and periods of extreme opti-mism (when the asset gets outrageously expensive).
This is the only kind of cycle that regularly occurs in the market over years and years. This is the only kind of cycle that investment greats like Warren Buffett and Richard Russell will tell you to rely on. These extremes regularly happen... and they’re easier for most folks to spot, prepare for, and trade on than a series of waves on a chart.
Take money manager John Paulson’s “Trade of the Century.” Paul-son made himself and his clients around $15 billion by spotting extreme optimism and overvaluation in the real estate market back in 2006. Or take Rick Rule, who made himself and his clients in-credible returns by spotting excessive pessimism and huge value in the mining sector in 2001. And John Templeton made millions of dollars betting against Nasdaq tech stocks in 2000 by spotting extreme optimism and overvaluation there.
Unfortunately, while these sentiment “cycles” regularly occur in the market, they do not occur in an orderly, predictable fashion. You

57
KNOWLEDDGE BASE
Table of Contents
simply have to watch the market all the time and hunt for them. You have to be a “connoisseur of extremes.”
That’s the market’s only reliable magic key.

Trader’s Tool Box: Systems and Strategies that Make Millions

TRADER’S TOOL BOX
59Table of Contents
THE COMMON SENSE GUIDETO TECHNICAL ANALYSIS
Of all the ways to analyze the stock market, none generates more confusion and criticism than the practice of “technical analysis.”
Technical analysis is often called “chart reading.” It’s the study of past market prices and trading volume in order to get an edge in the market.
Some folks swear technical analysis is the “Holy Grail” that leads to stock-market profits. They’ll tell you they’ve found chart patterns that regularly predict huge market moves.
Some folks swear technical analysis is no different than using tea leaves and tarot cards to dictate investment decisions. There’s an old joke passed around this camp of market players:
Question: “What’s the best way to profit from technical analysis?”
Answer: “To sell books to those who don’t know any better.”
There’s a lot of truth to this joke. Millions of books on technical analysis and millions of dollars of technical analysis advisories have been sold over the years… all marketed on the claim that certain gurus can predict the next big move in stocks or commodities. Just send ‘em a check for $99 and you’ll learn the secret.
Many of these “secret formulas” are no better than flipping a coin to determine your trading direction. The only technical analysts that make money from them are the ones selling the secret. The buyers walk away more confused than ever.
The goal of this report is to cut through the “secret formula” BS and provide you with a common-sense foundation of technical analysis. Included in this report are several simple concepts you can use to make millions of dollars in the stock and commodity markets. It all begins with…

S&A Trader’s Manual
60Table of Contents
The Most Important Concept inAll of Technical Analysis
I’m going to start this section with a bold statement…
If you learn how to identify trends – and when they are changing – you’ll set yourself up for a successful trading career. If you don’t learn how – you’ll finance the lifestyles of those who do.
It’s that simple, and that powerful.
Now that we know trends are the keys to trading success, let’s de-fine a trend:
A trend is a series of price movements in one general direction.
That’s it. That’s all a trend is.
Since pictures speak louder than words, let’s take a look at a trend where prices go higher… also called an uptrend. It’s the trend in gold prices from 2001 through 2009:
Let’s also be sure of what a trend of lower prices, called a down-trend, looks like. Below is the downtrend in the share price of news-paper giant Gannett (publisher of USA Today) from 2005 through 2008:
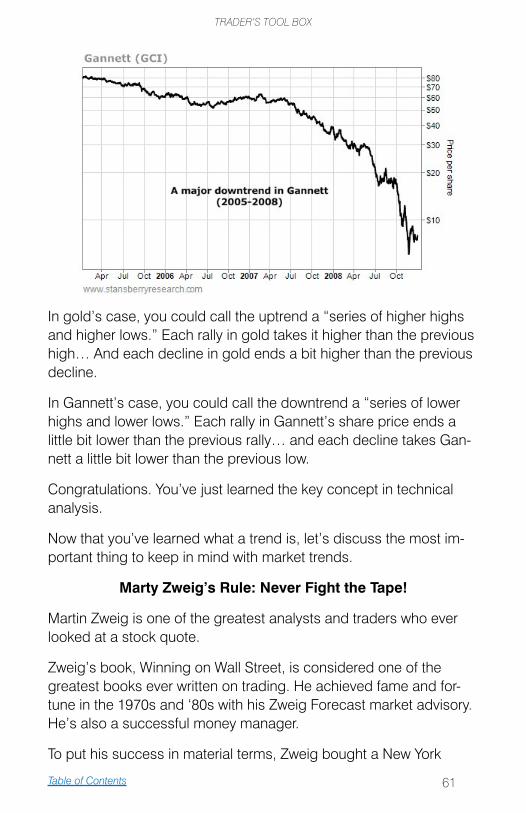
TRADER’S TOOL BOX
61Table of Contents
In gold’s case, you could call the uptrend a “series of higher highs and higher lows.” Each rally in gold takes it higher than the previous high… And each decline in gold ends a bit higher than the previous decline.
In Gannett’s case, you could call the downtrend a “series of lower highs and lower lows.” Each rally in Gannett’s share price ends a little bit lower than the previous rally… and each decline takes Gan-nett a little bit lower than the previous low.
Congratulations. You’ve just learned the key concept in technical analysis.
Now that you’ve learned what a trend is, let’s discuss the most im-portant thing to keep in mind with market trends.
Marty Zweig’s Rule: Never Fight the Tape!
Martin Zweig is one of the greatest analysts and traders who ever looked at a stock quote.
Zweig’s book, Winning on Wall Street, is considered one of the greatest books ever written on trading. He achieved fame and for-tune in the 1970s and ‘80s with his Zweig Forecast market advisory. He’s also a successful money manager.
To put his success in material terms, Zweig bought a New York

S&A Trader’s Manual
62Table of Contents
penthouse apartment in 1999 for $21.5 million. This guy knows how to move money from the market’s account to his.
Located in the middle of Zweig’s Winning on Wall Street is this time-less quote:
“I can’t emphasize enough the importance of staying with the trend in the market, being in gear with the tape, and not fighting the major movements. Fighting the tape is an invitation to disaster.”
(In the early days of Wall Street, traders received updates by a ma-chine that printed out prices on a roll of ticker tape. Even today, with the ticker tape machines long gone, traders still call market action “the tape.”)
What is Martin getting at?
Hundreds of thousands of traders have blown up their trading accounts by trading AGAINST uptrends and by trading AGAINST downtrends.
Most of these traders were sure they knew something the market didn’t… Maybe an uptrend was due to end in a big crash… Or a downtrend was due to end in a big rally. So, they bet on them ending.
This is called “fighting the tape.” And as Martin notes, it’s an invi-tation for disaster… for the simple reason that trends tend to last longer than anyone expects them to. Or as legendary investor Jim Rogers reminds us:
“Markets often rise higher than you think is possible, and fall lower than you can possibly imagine.”
This is why you never want to bet against a major uptrend or a major downtrend.
Trends can last a long time… and you must either trade with the trend, or step aside. But never stubbornly trade against it.
At Stansberry & Associates, we rarely recommend making trades based on an asset’s chart alone. We recommend you know how cheap or expensive an asset is… and we recommend knowing if

TRADER’S TOOL BOX
63Table of Contents
investor sentiment toward that asset is skewed towards pessimism or optimism.
But from a general standpoint, you want to be long uptrends, and short downtrends.
And unless you are trading for lightning-fast moves of just a few days, never short a major uptrend, and never buy a major down-trend. Or in Martin Zweig’s words, “Never fight the tape.”
How to Safely Trade Trend Changes
Okay… we’ve learned “don’t fight the tape.”
But what if you find an asset that is a terrific value and has a great bullish long-term argument for buying it, but is still locked in a down-trend? You want to buy, but you don’t want to “fight the tape.”
In this section, you’ll learn how to safely take advantage of just such a situation. You’ll learn to look for tops and bottoms.
We’ll start our lesson with a dangerous chart. This chart displays a type of price move that has bankrupted hundreds of thousands of people. So please pay careful attention to it…
This is a chart of crude oil from early 2007 through late 2008. See

S&A Trader’s Manual
64Table of Contents
that huge, sharp decline on the right-hand side? That’s a mar-ket in crash mode. Some traders call this kind of move a “falling knife” or a “falling safe.”
A market in such a sharp decline is nearly impossible to trade successfully. But that doesn’t stop all kinds of people from trying to do so. Many people see this kind of fall and think, “It’s getting cheap. It’s due for a big rebound… and I’m buying.”
Many traders get a thrill from trying to pick the exact bottom or top of a runaway market. They say things like that sentence above. They perform the necessary fundamental analysis to re-alize a market is cheap after a big fall… or expensive after a big rise. Armed with this valuation knowledge, they head out to the “front lines” and go for glory.
They usually get riddled with bullets.
If you never buy assets in freefall and never sell short assets in rocket flight – if you never fight the tape – your trading account will thank you.
Here’s why: A huge move like the 2008 oil crash generates a lot of emotion in the marketplace. It catches most people off-guard. It causes big swings in their account values… both up and down.
All that emotion produces a market that’s about as rational as a 16-year-old in love. Whether an asset is overvalued or underval-ued simply doesn’t matter during these moves. So saying things like, “This stock is just so cheap” is only going to get you and your money in trouble. It’s going to get you into risky trades.
Instead of letting that sort of thing run through your head, remem-ber that quote from Jim Rogers:
“Markets often rise higher than you think is possible, and fall lower than you can possibly imagine.”
Markets are just big groups of people. People are irrational… even more so when their money is on the line and account values are jumping around like crazy. This makes trading against run-away trends – fighting the tape – a high-risk activity…

TRADER’S TOOL BOX
65Table of Contents
There’s a much lower-risk way to trade these moves. It’s a lot easier on your blood pressure… and more profitable. Let’s again consider advice from Marty Zweig.
Zweig says trying to buy an asset in freefall is like trying to catch a falling safe. You’ll always get squashed. His alternative is amaz-ingly simple and profitable:
Don’t try to catch a falling safe. Wait for it to hit the ground… Then, just walk over and pick up the money.
Let’s look at crude oil again. Instead of trying to catch the fall-ing safe by going long crude oil in October 2008 when the chart looked like this…
… the smart speculator waits for the safe to hit the ground. He waits for the chart to look like this…
[Chart on following page]
See that price action in late 2008? Traders who bought oil at $70 in October got a 50% “discount” from July’s high of $140. They also lost half their money as the safe kept falling and falling. It eventually hit the ground at $35 in December.
Few market players imagined this stupendous decline could hap-pen to crude oil. But remember Jim Rogers:

S&A Trader’s Manual
66Table of Contents
“Markets often rise higher than you think is possible, and fall lower than you can possibly imagine.”
The SAFE time to go long crude oil and oil stocks came in Febru-ary 2009.
After hitting a low of $35 a barrel in December, oil rebounded into the upper $40 range. The oil bears countered this rally and tried to drive prices back down to the low. Each time, oil refused to go back to its December low. As traders would say, oil “tested” its bottom.
At this point, it’s much safer to buy oil than it was in October 2008. Anyone who went long back then was buying into a sharp decline. Traders who waited on a bottoming out process – and waited for the safe to hit the ground – made a bundle as oil went onto rally into the $70s and $80s in 2009. They waited for the trend to get exhausted… for all that emotion to get wrung out of the market.
This “wringing out” process takes time… And it produces a “round bottom” like you see here:
[Chart on following page]
This strategy of avoiding sharp declines while trading round bottoms works for all stocks and commodities. It allows us to

TRADER’S TOOL BOX
67Table of Contents
stand safely aside as the safe hits the ground and spills out its contents.
Now, let’s look at the opposite of a bottom… Let’s see how find-ing a top can make you money by betting on the short side…
Have a look at this chart. It’s one of the great moves of the 2003-2007 stock rally:
This chart shows the gigantic move Potash Corp. enjoyed from 2006-2008.

S&A Trader’s Manual
68Table of Contents
Potash is the world’s largest fertilizer company. In 2006, grain and farm prices went through the roof… So fertilizer producers went through the roof as well. Potash shares increased 800% in less than two years.
After fertilizer shares ran up hundreds of percent, the investment public caught on. The news was everywhere: Fertilizer prices are skyrocketing!
Wall Street and Main Street went wild. People were so bullish on fertilizer shares, they were willing to pay between 40 and 60 times earnings for these stocks. That’s a crazy price to pay for any company… let alone for one that produces boring crop fertilizer. We even told readers of our DailyWealth e-letter in April 2008 that the bull market in fertilizer stocks had “entered stupid mode.”
So… you had two big “red flags” here. You had 1) A wildly over-priced stock, and 2) Rampant bullishness from the investing public surrounding shares.
Time to go short?
No way. Look how sharp that rise is again. Sure, Potash Corp. is super-expensive and it “should” suffer a big correction soon… but remember Jim Rogers:
“Markets often rise higher than you think is possible, and fall lower than you can possibly imagine.”
Potash shares were still rising. The stock was a rocket ship with plenty of momentum. It was too risky to trade.
At that point, the right thing to do was place the stock on your watch list and wait for the flame at the bottom of the rocket ship to sputter out and turn cold. Here is what that “flameout” looked like:
[Chart on following page]
As you can see, Potash peaked around $77 in June 2008. It entered a perfectly natural correction at the end of the month… Then the bulls tried to push it skyward again. That rally couldn’t push it above $74. It failed the “test.” The flame was sputtering.

TRADER’S TOOL BOX
69Table of Contents
Potash’s chart had changed from a sharp uptrend to a round top. It was time to bet on the short side and let gravity do the rest. Here’s what happened over the next four months:
Gravity really worked Potash over. The stock fell 75% from its high. Short sellers made a fortune.
To sum things up:
If you never buy assets in freefall and never sell short assets in rock-

S&A Trader’s Manual
70Table of Contents
et flight – if you never fight the tape – your trading account will thank you. Instead, look for round tops and bottoms.
Breakouts
In addition to knowing how to identify a trend, it is crucial that the beginning trader learns how to identify a breakout.
A breakout occurs when the price of an asset reaches either a new high point or a new low point for a given time period.
An “upside breakout” is when the asset hits a new high.
A “downside breakout” is when an asset hits a new low.
Breakouts can be either short-term (five or 10 days), intermedi-ate-term (30+ days), or long-term in nature (200 or 300 days).
Breakouts serve as a starter’s pistol to signal the beginning of a trend. No uptrend can start without an upside breakout…. And no downtrend can start without a downside breakout. Let’s look at a few examples…
After suffering the big decline of the late-2008 credit crisis, crude oil traded sideways for months before staging an upside breakout around $48 per barrel in mid-March (A). It then proceeded to drift sideways in the high $40s before staging another upside breakout around $55 per barrel in early May (B).

TRADER’S TOOL BOX
71Table of Contents
As you can see, the concept of an “upside breakout” is simple. It’s when the price of an asset moves into a new area of higher prices.
In oil’s case, that move in early March took crude to its highest closing price of the past 60 days. Traders call that a “60-day upside breakout.”
Now let’s look at a downside breakout.
The chart below displays the downside breakout in shares of Potash during the summer of 2008:
After peaking at $77 in mid-June (A), Potash drifted lower into the $70-per-share range. It then staged a downside breakout in August (B)… taking shares down below $54.
This was the lowest closing price in 90 days for Potash… So you can understand why we call this a “90-day breakout.” (It’s also a 60-day breakout, because if shares are hitting their lowest point in 90 days, they are also at a 60-day low… as well as a 30-day low and a three-day low.)
Breakouts are important because they signal possible trend chang-es. If you are looking to trade an asset in one direction, it helps to wait on a breakout before making your move… It helps to wait for the market to “confirm” your belief.

S&A Trader’s Manual
72Table of Contents
Waiting for a bit of price confirmation ensures you are not fighting the tape… or placing your money into assets that are drifting side-ways for long periods of time.
For instance, let’s say you turned bullish on crude oil in February 2009.
Waiting on that upside breakout in March ensures the market is moving in your direction. It ensures you are trading with the trend… no matter how short- or long-term your horizon.
The same goes for a trader looking to bet against Potash…
Let’s say you wanted to short Potash in June. You’d want to wait for a breakdown to signal a trend change before making your trade. You’d want to see some share price weakness to confirm your thesis.
Even if it’s just a bit of share price weakness, say in the form of a short-term five-day downside breakout, that’s considered waiting for market confirmation.
Following breakouts is no Holy Grail of trading. Breakouts can be re-versed in a hurry. When an asset stages a breakout in one direction, then turns right around and heads in the opposite direction soon after, it is called a whipsaw. Whipsaws are just a fact of trading life. Below is an example of a whipsaw…

TRADER’S TOOL BOX
73Table of Contents
The chart above displays the share price action of oil company Sun-cor from mid-2008 to mid-2009.
A trader bullish on Suncor might have bought shares when the stock staged a 60-day upside breakout near $22 in late December (A). That trader would have had to endure a sharp whipsaw down to $17.50 per share in the following weeks (B). Depending on where a trader has his stop loss, this whipsaw could kick him out of the trade.
Below is the same chart of Suncor, with a few more months’ worth of time shown. You’ll note that Suncor eventually broke out of that $22 area and ran into the mid $30s (C)… but there were a few months of sideways “whipsaw action” that a trader had to deal with.
This is simply how the market works… you must deal with these situations by sticking to your protective stop loss orders… and knowing from time to time you’ll have to deal with whipsaws that nearly trigger your stop losses, kick you out of trades, or produce a few months of frustration.
Remember… breakouts can work across all timeframes. For ex-ample, below is a chart of copper miner Freeport-McMoRan from March 2010 to May 2010.
Let’s say in early April 2010 your research told you copper prices were headed lower, which would damage shares of Freeport-McMo-

S&A Trader’s Manual
74Table of Contents
Ran. In this situation, you could wait until mid-April’s 10-day down-side breakout (A) before placing your trade. Still a breakout… just a short-term breakout.
To sum things up, waiting on price breakouts – either short-term or long-term – before trading increases your odds of success because you are getting in line with the market. You are going with the tape, rather than against it. That’s all you really need to know about this critical (and simple) technical concept.
Acting Well vs. Acting Poorly
Let’s go back to our Potash example from mid-2008.
Remember… back then, Potash was in the middle of a huge bull market. Shares were up 800% in the past two years. Tons of CNBC guests talked about how bullish they were on fertilizer stocks. You’d hear stuff like “Things couldn’t be better for the industry.”
Retail investors across the country started hearing about high crop prices and rising fertilizer shares on the nightly news… And they started reading about them in the local paper. Food riots broke out in Mexico and Indonesia. Fertilizer companies were reporting incred-ible increases in revenue and profits. The Market Vectors fund family even launched a new agribusiness ETF to capitalize on investor interest towards the sector.

TRADER’S TOOL BOX
75Table of Contents
Then… on July 24, 2008, Potash came out with a stunning earnings report.
Earnings came in at $905.1 million… a 220% increase from the year before, and the highest total in company history. “This quarter established a new standard of performance for our company,” CEO Bill Doyle said.
Shares fell 3.3% on massive trading volume as a result.
You read that correctly. Potash reported the greatest quarter in compa-ny history… a “new standard” in profitability… and was clobbered for it.
This horrible performance in the face of great news is what happens when a trend is changing. It is called “acting poorly”… and it’s an-other vital technical concept to know.
As you can imagine, when an asset cannot rally in the face of wonderful news, it’s a huge bearish sign for that market. It’s a sign that all the great news and all the great fundamentals going for the market have been “priced in” to that market. It’s a sign there aren’t enough buyers in the market to help drive prices higher. They’ve been exhausted.
We’ll take another look at Potash shares during and after this time just for a reminder of what can happen when a bull market cannot climb higher on terrific news:

S&A Trader’s Manual
76Table of Contents
Just as it’s bearish for a bull market to fall on great news, it’s bullish for a bear market to rally on horrible news. Consider the case of Intel…
In April 2009, things were horrible for Intel. This was around the time of the 2008-2009 credit crisis. Many folks were worried the “The Great Depression Part II” was around the corner. Intel shares fell more than 50% in four months.
Intel is the world’s largest maker of semiconductors… the tiny “engines” that power the world’s computers. If another Great De-pression was in the cards, people wouldn’t be buying many com-puters… and Intel’s business would suffer.
In mid-April, Intel reported a huge quarterly sales decline of 26% from the previous year’s quarter. Profits fell 55%. Intel also offered a “blurry” outlook for the rest of the year. Wall Street hates “blurry.” So what happened to Intel shares after this news? They held like a rock!
When a bear market has a bullish reaction to horrible news, that market (or stock) is said to be “acting well.” It’s a sign the sellers of that asset are exhausted and out of ammo. It’s a sign the downtrend is likely finished.
In Intel’s case, the downtrend was finished. The stock rallied 50% over the next 12 months and was one of the top performing stocks of the year. This rally was kicked off when Intel started “acting well.”

TRADER’S TOOL BOX
77Table of Contents
To sum things up, when a bull market sells off in the face of great news, it’s a bearish sign.
When a bear market rallies in the face of horrible news, it’s a bullish sign.
Volume Analysis
One more time, we’re going to look at the enormous 2008 drop in shares of Potash.
This situation can teach us another powerful technical concept…
The concept of trading volume.
Each day, the exchanges track the amount of trading volume in each stock index and each single security. This volume measures the amount of buying and selling activity present during the day… The higher the volume, the greater the amount of buying and selling activity.
Volume can serve as a useful tool because it allows you to track “elephants.”
The stock market is dominated by large money managers… folks who run pension funds, insurance funds, mutual funds, and hedge funds.
Many of these managers control billions of dollars in client assets… And when they decide to enter or exit a position, they can’t do it over just a few days. They have to spread their buying over months. They even have to hire people whose main job is to determine the best way to plow big money into individual stocks.
These big money managers are the elephants in the stock market. They create the huge moves that become market trends. Remem-ber, their portfolios can run well into the billions of dollars… So even a rich individual with a $5 million trading account is a mouse com-pared to these elephants.
You can track elephant behavior with trading volume.
Now… we’re not going to tell you trading volume is the magic key to stock market profits. We will tell you there are two tried and true guidelines for using trading volume to increase your profitability.

S&A Trader’s Manual
78Table of Contents
Guideline No. 1:
A stock experiencing heavy trading volume on down days and light trading volume on up days is being sold by the big money.
The elephant tracks are pointing in the direction of lower prices.
The phenomenon of “lots of trading volume on down days, not much trading volume on up days” is sometimes called “distribu-tion,” and it’s especially useful when trying to determine the end of an uptrend. Let’s take a look at Potash again. We’re sticking with the same time period of mid-2008… when the big uptrend ended, and eventually turned into a big downtrend.
You’ll see some green and red bars at the bottom of this chart. These bars represent Potash’s trading volume. Green bars repre-sent days the stock advanced in price. Red bars represent days the stock declined in price. The taller the bar, the greater the volume.
Note that in June and July, the red bars (days Potash declined) started to get just a bit bigger than the green bars (days Potash ad-vanced) (A). This is an early sign that sellers have more power and

TRADER’S TOOL BOX
79Table of Contents
more conviction than buyers.
Now note the tall “skyscraper” red bars in late July and early August (B). This is major selling pressure. Even worse, this selling pressure came on the great earnings report we mentioned in the “acting well” section. Several elephants were fleeing Potash shares. And as you’ll recall, Potash shares lost over 66% of their value soon after.
When you see a stock or stock index that was up big over the past few years start to exhibit this sort of “heavy down volume, light up volume” pattern of trading, it’s a major warning sign the trend may be ending. A healthy uptrend enjoys big trading volume on buying days, not big trading volume on down days.
For our next guideline, we just flip things around…
Guideline No. 2:
A stock experiencing heavy trading volume on up days and light trading volume on down days is being purchased by the big money.
The elephant tracks are pointing in the direction of higher prices.
The phenomenon of “lots of volume on up days, not much volume on down days” is sometimes called “accumulation,” and it’s es-pecially useful when trying to determine the end of a downtrend. Perhaps the stock has fallen so much it has become an irresistible value… Or maybe the tough industry conditions hurting the busi-ness are over and large investors are taking notice.
For example, let’s look at shares of Silver Wheaton from mid-2008 to early 2009.
Silver Wheaton is a company that finances early-stage mining projects. It receives a slice of a project’s revenue if it turns out to be a successful silver mine. Thus, the company tends to move up and down with the price of silver.
In late 2008, the price of silver crashed in response to the big 2008 credit crisis. The metal fell from $19 per ounce to $9 per ounce in less than five months. Silver Wheaton fared even worse… falling

S&A Trader’s Manual
80Table of Contents
from $14 per share all the way down to $2.56. That’s when the ele-phants started picking up shares…
Below is a chart of Silver Wheaton from mid-2008 to early 2009. Note the surge of buying volume in December, as represented by the series of tall green bars (A). These are elephant tracks, and they signaled the end of Silver Wheaton’s downtrend. The stock went on to gain more than 400% over the next 15 months.
Entire books have been written about volume analysis, and many traders use sophisticated formulas to track volume trends. But for the great majority of traders, the two guidelines we just covered are all you need to know about trading volume. You need to know that it often signals the end of big trends… it signals market extremes. Most of the time, this volume analysis isn’t going to tell you much.
Here are the guidelines one more time:
Guideline No. 1: When an uptrend enters a period of huge selling volume, it is a sign that trend is near an end… a sign the big money is cashing in and bailing out.

TRADER’S TOOL BOX
81Table of Contents
Guideline No. 2: When a downtrend enters a period of huge buying volume, it is a sign that trend is near an end… a sign the big money is seeing value and buying up shares.
Moving Averages – Guideposts onthe Way to Trend Profits
Before most folks even learn the difference between a stock and a bond, they hear about “bull” and “bear” markets.
A bull market is a period of rising prices. A bear market is a period of falling prices.
But how can we make a claim that an asset is in a bull market… a bear market… or somewhere in between?
This is where the concept of the moving average is useful.
A moving average is a technical indicator that works by collecting a bundle of an asset’s closing prices from, say, the past 200 days, then taking the average of those prices.
This produces a chart line that “smoothes” out market volatility so we can gauge the general trend. When a market is trading above its moving average, it’s considered to be in a bull trend. When a market is trading below its moving average, it’s considered to be in a bear trend.
Although you can use a variety of time parameters, the most widely used moving average time parameter on Wall Street is the 200-day moving average. There’s nothing magical about the 200-day moving average. It’s simply popular because it’s popular. It’s a good, middle-of the-road indicator that averages the prices from about 10 months of trading. It gauges the general long-term trend of a given market.
For example, below is a five-year chart of the price of crude oil from mid-2005 to mid-2010.
In early 2007, the price of crude oil moved out of a sideways trading pattern and above its 200-day moving average (A). It soon contin-ued this price strength and climbed towards $145 per barrel.

S&A Trader’s Manual
82Table of Contents
Then, in mid-2008, it moved below its 200-day moving average (B) on the way to $35 per barrel. Months later, oil bottomed and moved higher yet again, crossing its 200-day moving average in early 2009 (C). The entire time, the 200-day moving average served as a sort of “guidepost” for gauging the general trend.
Traders have used moving averages for years to develop trad-ing strategies. For example, if prices move above a moving average, they’ll buy an asset on the hopes it will keep moving higher. On the same idea, they’ll sell short an asset if the price moves below a moving average on the hopes it will keep mov-ing lower.
For the majority of traders, however, moving averages should simply serve as guideposts. No firm buy or sell decisions need to be made solely off them. But no discussion about technical analysis basics would be complete without mentioning them.
Common Sense Conclusions
Once again… technical analysis is no magic bullet. It’s simply a way to help time your trades to ensure the biggest profits.
This report is not an attempt to provide you with a comprehen-sive guide to technical analysis. Huge textbooks have been written on the subject. Our goal is to provide you with an under-

TRADER’S TOOL BOX
83Table of Contents
standing of the most important basic concepts. We encourage you to “marry” these concepts with fundamental measures of value. The two schools of thought can produce incredible in-vestment results.
S&A Trader’s Manual
84Table of Contents
THE TRADER’S BEST FRIEND
By Brian HuntEditor in Chief, Stansberry & Associates
Of all the friends in the world a speculator can have, one of the most valuable is the concept of position sizing.
This is the part of a strategy that tells you how much to place into a given trade.
Most great traders will tell you to never risk more than 2% of your trad-ing capital on any one position. One percent, which is much lower risk per trade, is better for most folks. A half a percent is also good.
What follows is a brief discussion of how the math works when deter-mining position size...the story of Joe and his “R.”
Joe is a trader with a $50,000 grubstake. His first trade is to buy Intel at $20 per share.
But how many shares should he buy? Buy too much and he could suf-fer catastrophic account damage if an accounting scandal strikes Intel. Buy too little and he’s not capitalizing on his great idea.
Here’s where intelligent position sizing comes into play. Here’s where we turn to the concept of “R.”
“R” is the number you’re willing to risk on any one speculative position. You calculate R from two other numbers: 1) Total account size, and 2) The percent of your account you’ll risk on any given position.
Let’s say Joe wants to go “in the middle of the road” with his risk toler-ance. He’s going to risk 1% of his $50,000 account on each idea. His R is $500. (If he wanted to dial up his risk to 2% of his entire account, his R would be $1,000.)
Back to Intel...
Joe is going to place a 25% protective stop loss on his Intel position. Now, he can work backward and determine how many shares he’ll buy.
Again, Joe’s R is $500. His stop loss is 25%.

TRADER’S TOOL BOX
85Table of Contents
To calculate how large the position will be, his first step is always to divide 100 by his stop loss. Always 100.
In Joe’s case, the result of this calculation is 4 (100 / 25 = 4). Now, he performs the next step in figuring his position size. He takes that num-ber (4) and he multiplies it by R ($500).
Four times $500 is $2,000... which means Joe can buy $2,000 worth of Intel... or 100 shares at $20 per share.
If Intel declines 25%, he’ll lose $500 and exit the position.
That’s it. That’s all it takes to practice intelligent position sizing.
Here’s the calculation again:
100 / stop loss = A.A times R = Position size.Position size / share price = number of shares to buy.
Now... what if Joe wants to use a tighter stop loss, say 10%, on his Intel position? Let’s do the math...
100 / 10 = 10. 10 x $500 = $5,000.$5,000 / $20 share price = 250 shares.
Tighter stop loss, same amount of risk... same R of $500.
Let’s say Joe wants to use a super tight stop loss of just 5% on his Intel position. If Intel declines 5% to $19 per share, he’s out of the trade. This tighter stop loss means he can buy more shares. Let’s do the math again...
100 / 5 = 20.20 x $500 = $10,000.$10,000 / $20 share price = 500 shares.
Again, tighter stop loss, same amount of risk... same R of $500.
Let’s say Joe is trading Intel options. He’s bullish, so he’s going to buy Intel call options. The options he wants to buy are $2 per contract (op-tion pricing lists the price per share, and contracts are for 100 shares...

S&A Trader’s Manual
86Table of Contents
so one of Joe’s option contracts will cost $200).
A straight call option position is much more volatile than a straight stock position. Joe is going to set a wide stop loss of 50% on his call position. Wider stop, smaller position size.
Here’s the math:
100 / 50 = 2.2 x $500 = $1,000.$1,000 / $200 per option contract = 5 option contracts.
Different stop loss, different position size, different kind of asset, same R of $500.
As you can see, you can use the concept of R to “normalize” risk for any kind of position... from crude oil futures to currencies to microcaps to Microsoft. If you’re trading a riskier, more volatile asset, the stop-loss percentage should increase and the position size should decrease.
A good middle of the road that will work for most anyone is 1% of your total trading account. Folks new to the trading game would be smart to start with half a percent of their account. This way, you can be wrong 10 times in a row and lose just 5% of your account.
To have the importance of intelligent position sizing drilled into your head over and over again by the best traders ever, see our five book recommendations in Appendix A. We recommend all of those books, but for position sizing, we particularly recom-mend you read Market Wizards by Jack Schwager. For a fuller explanation of R and intelligent position sizing, read Trade Your Way to Financial Freedom by Van K. Tharp. Both are incredibly important books for speculators.

TRADER’S TOOL BOX
87Table of Contents
DON’T LOSE MONEY: THE MOST IMPORTANTLAW OF LASTING WEALTH
By Dr. Steve Sjuggerud, Ph.D.editor, True Wealth
Let’s face it – most people don’t know when to sell a falling stock. So they’re frozen into inactivity, saying, “Should I just keep holding and hoping, or should I cut my losses now?” This state of indecision is usually permanent, and often continues until you hear this: “Well, it’s too late to sell now.”
One of my good friends lost it all following the “it’s too late to sell now” principle. He bought a ton of shares of a cable stock based on his friend’s recommendation. The shares soon tumbled in half, and his friend, who knows about the cable business, told him to buy more, so he did. The shares tumbled in half again, and he bought even more.
He finally stopped buying when the shares hit a dollar a share. Now they trade for pennies – he would have to pay more in commissions than those shares are worth. He was uncertain about everything, and pretty soon it was all over.
After you’ve read this report – if you follow the advice here – your constant state of indecision will be gone. You’ll never lose another night’s sleep worrying about which way your investments will go tomorrow. Unlike most investors, you’ll have a plan – knowing when to get out and when to stay in for the biggest possible profits.
Buying stocks is easy. There are thousands of theories out there on why and when to buy. But buying is only the first half of the equation when it comes to making money.
Nobody ever talks about the hard part – knowing when to sell.
We’ve all made expensive mistakes – either missing the full upside by selling too soon or taking a huge loss by holding a falling stock too long. But it’s time to make big losses a thing of the past.
In order to invest successfully, you need to put as much thought into

S&A Trader’s Manual
88Table of Contents
planning your exit strategy as you put into the research that moti-vates you to buy the investment in the first place. So please read closely here, and think about each point...
The Trailing Stop Strategy
In stocks (and in business, I believe), you must have and use an exit strategy – one that makes you methodically cut your losses and let your winners ride. If you follow this rule, you have the best chance of outperforming the markets. If you don’t, your retirement is in trouble.
The exit strategy I advocate is simple. I ride my stocks as high as I can, but if they head for a crash, I have my exit strategy in place to protect me from damage. Though I have many levels of defense and many reasons I could sell a stock, if my reasons don’t appear before the crash, the Trailing Stop Strategy is my last ditch measure to save my hard-earned dollars. And it works.
The main element to the Trailing Stop Strategy is a 25% rule. I will sell any and all positions at 25% off their highs. For example, if I buy a stock at $50, and it rises to $100, when do I sell it? If it closes below $75 – no matter what.
Don’t Let Your Losers Become Big Losers
What’s so magical about the 25% number? Nothing in particular – it’s the discipline that matters. Many professional traders actually use much tighter stops – the Investor’s Business Daily newspaper, for example, recommends an 8% stop.
You’ll Never Recover
Percent fall in share price
Percent gain required to get you back to even
10% 11%
20% 25%
25% 33%
50% 100%
75% 300%
90% 900%

TRADER’S TOOL BOX
89Table of Contents
Ultimately, the point is, you never want to be in the position where a stock has fallen by 50% or more. This means that stock has to rise by 100% or more just to get you back to where it was when you bought it.
By using this Trailing Stop Strategy, chances are you’ll never be in this position again.
I use end-of-day prices for all my calculations, not intraday prices. You should too. This makes things easier. If a stock has gone to $100, put at least a mental stop at $75. If, subsequently, the stock closes at or below that $75 level, sell your shares the next day.
We do this because we think that PLACING ACTUAL STOP ORDERS IS A BAD IDEA. We do not recommend placing stop orders at all. The dirty NYSE traders will pile up all the stop orders, and then execute them all at a horrible price. Interestingly, stocks often close higher the very same day, after the NYSE traders make a mint executing stop orders. DON’T put a stop order in the market.
Simply sell the day after you hit your stop.
I have to admit, it took me three years to truly follow my own advice on this one. I would always come up with some excuse for why I should keep holding some dud stocks. Nearly every time with those losers, if I’d practiced what I preached, I’d have been better off.
Now I always cut my losses. And once you get into the habit and com-mit to doing it, it is not hard.
One thing in life is certain: The future is uncertain. Nobody – not even the most astute analyst or investment advisor – can know enough about a particular company, industry, or the nuances of the market, to anticipate future prices with 100% certainty.
But common sense dictates two fundamentals: 1) taking small losses is much better than taking big losses and 2) letting your profits run is much better than cutting them off prematurely.
By following this simple plan accordingly, I strongly believe your invest-ment results will start to improve immediately and dramatically.
S&A Trader’s Manual
90Table of Contents
A SHORT GUIDE TO USING STOP LOSSES
By Brian HuntEditor in Chief, Stansberry & Associates
What’s so great about a 25% stop loss?
As the publisher of trading and investment advice to thousands of people, this is one of the most frequently asked questions Stansber-ry Research receives each year.
You see, starting around 1996, our own Dr. Steve Sjuggerud began performing a great service to the readers of financial advisories. He started urging investors to use a pre-determined point at which they would sell a position if it didn’t work out in their favor... rather than exiting positions by “feel.” These points are called stop losses.
Steve chose to promote the stop-loss percentage of 25%. It’s a round number that protects investment capital – while still giving positions some “wiggle room” to ride out natural market fluctuations.
But let’s lay a common misconception to rest right now: There’s nothing magical at all about using a 25% stop loss. It’s simply a good “middle-of-the-road” stop loss. If you buy a stock at $10 per share, your stop loss is 25% less than that, or $7.50. If that stock climbs to $20 per share, you “trail” your stop loss behind it and move it to $15 per share.
The real “magic” in Steve’s philosophy is the act of enforcing disci-pline on himself and his readers. The magic is forming a plan before you make the investment or trade... so you’re not trying to decide what to do when you see awful headlines... listening to panicky co-workers... or seeing hard dollar losses on your computer screen.
You simply note your exit strategy and carry out the plan. It’s like driving with a map rather than randomly taking turns and hoping you get to where you need to go.
So... if 25% isn’t magic, can you use 10% stop losses? Or 21.7% stop losses? Or 30% stop losses?
Absolutely.

TRADER’S TOOL BOX
91Table of Contents
William O’Neil – a master stock trader interviewed in Market Wizards – encourages readers of his newspaper Investor’s Business Daily to use an 8% stop loss. This will result in more frequent losses than most people are used to, but it definitely keeps folks away from catastrophic losses.
Or take mining stock traders. These stocks are among the world’s most volatile assets. A wide, 50% stop loss works well with these. Option traders often use big stop losses, since options can be so volatile.
No matter what percentage you decide to go with, make sure to remember that position sizing works hand in glove with stop losses. You’ll want to place less money in trades that feature wide stop loss-es (like 25%-50%)... and you can place more money in trades that feature tighter stop losses (like 8%-25%).
It’s the discipline involved that is “so great” about 25% stop losses... not any exact number. Having a stop loss will keep you from saying a classic loser’s mantra, “I just never know when to sell.”
Master this aspect of your strategy, and you’ll always keep losses small, you’ll always know when to sell, and you’ll always be a profit-able trader.

S&A Trader’s Manual
92Table of Contents
THE RIGHT TIME TO CHANGE A STOP LOSS
By Brian HuntEditor in Chief, Stansberry & Associates
Why did you change your stop loss?
As a financial publisher, I’ve heard this question over 100 times.
You see, many of our readers understand the importance of stop losses – predetermined points at which you sell a stock to protect capital or lock in profits.
Stansberry Research often recommends a 25% “trailing stop loss,” which is a stop loss that moves higher and higher in lockstep with a rising stock. Say you bought a stock at $10 and rode it to $40. Your trailing stop here would kick you out of the position at $30 (25% of $40 = $10, $40 – $10 = $30).
But sometimes, we throw a wrinkle in our advice. Several times in the past, we’ve recommended folks “tighten” their trailing stops on big winners to 15%. Naturally, when we depart from our most com-mon strategy, folks want to know why. Here it is...
Tightening the stops on your big, winning trades allows you to keep more of the gains. This is often the case when you buy an asset cheap, make a great return on it for a year or two, and then watch it get expensive as folks pile into your idea.
If you’re nervous about holding that expensive asset, consider tight-ening your original 25% stop loss to 15%, or even 10%. Here’s an example of how this can benefit you...
Let’s say you bought a gold stock at $2 per share. You bought 5,000 shares for a $10,000 outlay. You placed a 25% trailing stop loss on the position to protect yourself. This stop loss is wide enough to keep you in the stock in case it declines a bit before going higher.
The months go by... and congratulations! Your $2 stock jumps to $10. Your stake is worth $50,000 now.
Let’s also say you’re getting nervous about the expensive valuation

TRADER’S TOOL BOX
93Table of Contents
of the company... or you’re nervous gold stocks have become too popular with the investment crowd. You want to ride your winner as far as you can, but you also want to be sitting close to the exit when the movie ends.
If you stick with your current stop loss of 25%, you’ll sell your stock if shares close below $7.50. In this situation, you’d sell and walk away with a stake worth $37,500 ($7.50 times 5,000) and a profit of $27,500 ($37,500 minus your $10,000 outlay).
If you tighten your stop loss to 15%, you’ll sell your shares if the stock closes below $8.50. In this situation, you’d sell and walk away with a stake worth $42,500... and a profit of $32,500. That tighter stop loss means $5,000 in extra profits. An even tighter stop loss of 10% would mean total profit of $35,000.
Again, tightening a stop loss can be a great idea on your big win-ners. It’s a good way to get your seat closer to the exit if your asset grows expensive and popular... but keep you in the trend if the gains continue.
And as you can see, it can make a difference of thousands of dollars.
P.S. As I mentioned in this essay, there’s nothing magical about pick-ing 25% as a stop loss point. It’s simply a good middle-of-the-road stop loss point. Some traders use 8%... 15%... or 33% stop losses.

S&A Trader’s Manual
94Table of Contents
THE ART OF THE SHORT SALE
By Jeff Clarkeditor, S&A Short Report
If you look at the stock market from a historical perspective, you’ll notice that, generally speaking, stocks spend about two-thirds of the time moving higher and one-third of the time moving lower.
So if you’re only buying stocks, then you’re only seeing about two-thirds of the opportunities available. That’s like watching only the first six innings of a baseball game, or turning the television off midway through the third quarter of the Super Bowl.
Think about what you’re missing.
What I happen to find most interesting is that when stocks are mov-ing, they tend to move lower at a much faster pace. Think about it. I mean, you rarely hear of a “buying panic.” Consequently, profits on short sales tend to come much faster than on purchases. In fact, my average holding period on short sales is less than three months.
How Bad Ideas CreateGreat Profit Opportunities
Before we get to my basic strategy for successful short selling, let’s deal with a few of the misconceptions surrounding this form of investment...
The most common misconception is that short selling is a compli-cated strategy.
It’s not.
We’re all familiar with the old Wall Street adage “Buy low/Sell high,” in which we look to buy stocks when they’re cheap and unloved, and then sell them when they’re expensive and the darlings of the investment community. Simple, right?
Well, short selling is the exact same thing... only in reverse order.
Just as we look for ridiculously cheap valuations and an air of pes-simism surrounding a stock in order to consider it for purchase, we
TRADER’S TOOL BOX
95Table of Contents
look for ridiculously expensive valuations and extreme popularity in order to consider a stock a viable short sale candidate.
It really is as simple as that. Not complicated at all.
Another common misconception is that short selling is risky be-cause it exposes the investor to unlimited potential losses. This concept is just silly.
Honestly, I have been short selling stocks for years and not once, ever, have I lost an unlimited amount of money. Yes, I’ve taken my share of losses on the short side of the market, but I’ve lost money buying stocks, too. Short selling involves no more risk than buying stocks. And just as you can mitigate the risks of buying stocks, you can also reduce risk in short selling.
The secret to making money in stocks, whether buying or selling, centers around two factors...
1. The entry price of the trade, and
2. The timing of the trade.
Let me explain...
When buying stocks, if you pay too high a price or get the timing wrong, you’re likely to lose money. The same is true in short selling. If you short a stock at too cheap a price or get the timing wrong, you’re likely to lose money. Same thing.
The strategy we use for short selling is designed to make sure that we only short sell stocks that are trading at absurd valuations and we get the timing right.
A final misconception is that, somehow, rooting for stocks to de-cline in price is unpatriotic.
Since when is capitalism unpatriotic? I’d argue the commitment of fraud – to the extent that was performed at Enron, WorldCom, and a whole host of dot-com companies – was far more unpatriotic than the exercise of short selling.
Those scandals cost investors billions of dollars. That money is

S&A Trader’s Manual
96Table of Contents
gone... disappeared... evaporated into thin air. If you’re smart enough to recognize the fraud, and to capitalize on it, some of that money, rather than completely vanishing, will find its way into your brokerage account.
You may then use that money to spend lavishly on improving your lifestyle or to make additional investments for your future. I’d say that’s extremely patriotic.
As for the contention that it is somehow un-American to root for stock prices to decline... give me a break. We are all guilty of rooting for stocks to fall at some point.
Think about it. How many times have you waited, hoped, even prayed for a pullback in the market or in the price of a particular stock in order to give you a better opportunity to jump in?
Now let’s look at our strategy...
Strategy for Successful Short Selling
When I first started trading stocks, I did so almost exclusively from the long side. Through a series of trials and errors, I developed a three-pronged approach for what constituted a good stock to buy...
1. Ridiculously cheap valuation.
2. High degree of pessimism or even hatred surrounding the shares.
3. Price action that had just turned up following a long period of steady decline.
As simple as this buying strategy might seem, it has produced su-perior returns.
Logically, then, it makes sense to use a similar three-pronged ap-proach to shorting stocks...
1. Ridiculously high valuation
2. High degree of optimism surrounding the shares
TRADER’S TOOL BOX
97Table of Contents
3. Price action that has just turned down following a period of steady incline or parabolic rise
Let’s look at each element individually...
Ridiculously High Valuation
We all understand that, ultimately, earnings drive stock prices. Consequently, the price-to-earnings ratio (P/E) is the best gauge for measuring the ridiculousness of a stock’s valuation. But at what level does a P/E ratio signal that a stock may be overvalued? I have three general conditions...
1. The P/E ratio is more than twice that of the company’s earnings growth rate
2. The P/E ratio is 50% higher than the industry average, or more than 50% higher than the company’s historic P/E ratio
3. The P/E ratio is higher than my life expectancy
The first condition makes perfect sense. A company with a high earnings growth rate can sustain a high P/E ratio. But the valuation can reach a point where it is unsustainable and does not properly discount the potential for the earnings growth to slow. In my experi-ence, the P/E ratio hits that point when it is more than two times the growth rate.
EBay provided us with an excellent example of this condition. For years, eBay traded at a valuation that put its price-to-earnings ratio above 100. Bulls correctly argued that eBay’s high growth rate justified a high P/E multiple. However, at its high point in Decem-ber 2005, eBay was trading at a whopping 170 times earnings. Its earnings growth rate of 75% justified a high P/E ratio, but 170 was just ridiculous.
EBay disclosed that its growth rate was slowing, the stock was nearly cut in half.
The second condition is typical of a stock that has gotten ahead of itself or of its industry, regardless of the absolute level of the P/E ratio.

S&A Trader’s Manual
98Table of Contents
Consider the example of Toll Brothers (NYSE: TOL) one of the premiere home-building stocks. TOL crossed the tape at just over $90 per share in February 2005. At that price, TOL was trading at 16 times trailing earnings.
Granted, 16 times earnings in a market where the S&P 500 is trading at 21 times earnings certainly doesn’t seem expensive. However, TOL historically trades at just eight times trailing earnings. Therefore, at $90 per share, TOL was trading at twice its historic valuation.
Finally, condition No. 3 requires the most explanation...
Simply stated, the P/E ratio tells an investor how many years it will take for the company to pay back his original investment at the current level of earnings. For example, it would take 10 years for an investor to recover his original investment in a stock with a P/E of 10. A stock with a P/E of 100 requires the investor to wait 100 years.
Before I put a nickel into any investment opportunity, I want to make sure I stand a reasonable chance of seeing my money again. Seems like a reasonable goal, doesn’t it?
I’m over 40 years old, and the actuarial tables say I’ll be around for another 40 years or so. Consequently, you’d have to make a pretty compelling argument to get me interested in investing in a stock with a P/E ratio of more than 40. And if it’s too expensive for me to buy, it might qualify as a potential short sale candidate.
High Degree of Optimism Surrounding the Shares
If every analyst on Wall Street loves the stock...
If the anchors on CNBC seem to be mentioning the stock every hour...
If all your friends are talking about the fortunes to be made by owning the stock...
Then it’s probably on my list of short-sale candidates.
This concept is really quite easy to understand. If the whole world is in love with a stock and everyone who wants to own the stock already does, then who is left to buy the stock and push the price

TRADER’S TOOL BOX
99Table of Contents
higher? And if no one is left to buy and to push the stock higher, then it only takes one seller to shift the momentum in the other direction.
Witness the shares of Overstock.com (Nasdaq: OSTK) in December 2005. As shares of OSTK crossed over $70 per share, seven of the eight analysts following the company rated it a “buy” or a “strong buy.” The remaining analyst called it a “hold.” No one recommend-ed selling the shares.
Furthermore, CNBC featured an interview with OSTK’s CEO at least half a dozen times. It also seemed nearly every story covering the holiday shopping season mentioned Overstock.com.
Add to that my experience of being cornered at a friend’s holiday party by an otherwise cordial gentleman who lectured me for a full 30 minutes on how OSTK would “kick the tar” out of Amazon.com.
This gentleman was entirely correct. When the holiday shopping numbers were released, OSTK did in fact kick the tar out of Amazon. But shares of OSTK went on to fall.
You see, the price of the stock already reflected all the Wall Street hype, all the CNBC promotion, all the persuasive opinions of friends at cocktail parties. Simply put, everyone was already in. So when the time came to get out, the exit doors were quite crowded.
It’s All Meaningless Until theThird Condition Is Met
A high valuation, in and of itself, is not a reason to short a stock. Stocks can stay ridiculously overvalued for long periods of time. And few things in life are more uncomfortable than being on the wrong side of a stock as it goes from ridiculously overvalued to absolutely, moronically, absurdly overvalued.
Short selling stocks that are insanely hyped and when it is evident that the average public investor (a.k.a. “the dumb money”) is in-volved can also be a profitable endeavor. However, even the dumb money can win out once in a while.
So while there are plenty of companies whose shares fit into these first two categories, it is not until the third category is satisfied that I

S&A Trader’s Manual
100Table of Contents
feel confident in recommending shares to be sold short.
Once the price action turns negative on one of these ridiculously overvalued, overhyped stocks, it’s time to initiate a short position.
Price Action that Has Just Turned Down Followinga Period of Steady Incline or Parabolic Rise
Just as it doesn’t make a whole lot of sense to jump in front of a moving train, it also doesn’t make a whole lot of sense to try to short a stock as it’s moving higher. Yes, there is a certain thrill to shorting a stock at its absolute peak, just as there is a certain adrenaline rush to jumping over the railroad tracks right in front of a speeding train. But if you’re not successful, the results can be disastrous.
Rather than trying to pick a top in a stock, it makes far more sense to wait until the price action has turned lower and is in the early stages of confirming that the momentum has shifted from bullish to bearish. For me, that confirmation occurs when the stock trades below its 50-day moving average.
Stocks in which the upside momentum is strong will hold above their 50-day moving average lines. Failing to hold above that line is an excellent early indication that the momentum is shifting to the bearish camp. Most of my short sale recommendations fall into this category, as was the case with my January 2005 recommendation to sell short XM Satellite Radio.
Alternatively, if a stock has been moving nearly straight up (parabol-ic), its 50-day moving average line will be too far below the current stock price to justify waiting until a violation of the line to go short. Since parabolic rises typically occur during a time of intense hype, then we’ll look to short a stock when we sense that the hype has peaked.
A perfect example of this was our March 2005 recommendation to short shares of Martha Stewart Omnimedia (NYSE: MSO). Shares of MSO had been moving virtually straight up for five months, and we knew the hype surrounding Ms. Stewart’s release from prison would be enormous.

TRADER’S TOOL BOX
101Table of Contents
Consequently, we felt the hype would peak on the day of her re-lease, and that led us to recommend that investors sell short MSO on that day. We made this recommendation a full two weeks before Ms. Stewart was released on March 4.
Sure enough, shares of MSO gapped higher that morning and just missed making a new all-time high. Shares quickly reversed and closed down sharply on the day.
Coincidentally, by the end of the day, MSO shares were also trading below their 50-day moving average, thereby indicating further down-side in the weeks to come.
Waiting for this negative price action to appear before shorting a stock is critically important, as often times, the final “blowoff top” phase of a stock price advance is the result of something commonly referred to as a “short squeeze.”
Please Don’t Squeeze the Shares
If you’ve ever said to yourself, “Man, that stock just keeps going up and up!” then the odds are high that you’ve witnessed a short squeeze.
Stocks that are ridiculously overpriced and overhyped will often have a very large short interest. Essentially, this means that many investors have recognized that there may be an opportunity to profit on the decline of these overpriced, overhyped shares and have sold the stock short.
The term “short interest” defines how many shares of the stock have been sold short. This number, by itself, really doesn’t mean any-thing. What is important, however, is the relationship between the total short interest and the total average daily volume for the stock.
By dividing the short interest by the total average daily volume we can determine how many days it would take for all the short sellers to completely buy back, or cover, their short sales. This “days to cover” figure is useful in gauging how susceptible a stock may be to a short squeeze, or short covering rally.

S&A Trader’s Manual
102Table of Contents
A short squeeze is a rally in a stock that is caused by short sell-ers rushing in to buy back shares. It typically occurs when a stock makes a new 52-week high and short sellers throw in the towel. The additional buying pressure caused by short sellers covering their shares often produces a violent upside move and significant pain to those investors remaining short.
It is commonly thought that stocks where the short interest exceeds two days to cover are susceptible to a potential short squeeze. It has been my experience, however, that the really strong squeezes occur in stocks with at least six days to cover.
Understand, though, that stocks that have a very high short interest ultimately do eventually decline significantly in price. The problem exists in the short term, where undercapitalized investors are either unable or unwilling to hold a short position through the inevitable short squeezes.
Having been on the wrong side of more than a few short squeezes during my career, I’m certainly not anxious to experience that pain again. Consequently, I much prefer to wait until the price action of a stock has turned negative, thereby diminishing the possibility of a short squeeze.
Of course, that means that we’ll never sell short a stock at the abso-lute high price, but it also means we won’t suffer from ulcers caused by being too early on a short sale.
The Bottom Line
We have three specific criteria that must be met before we’ll recom-mend a short sale transaction. Adherence to these requirements ensures that we’ll get the price and the timing right. On the rare occasion that we’ll make an exception to one of these requirements, we’ll fully explain the exception and detail why we believe it makes sense to be a bit flexible.
A clear example of this was our March 17, 2005 recommendation to buy puts on Carnival Cruise Lines. CCL shares were not experienc-ing the type of hype that we typically look for in our recommenda-tions. However, the company was scheduled to announce earnings

TRADER’S TOOL BOX
103Table of Contents
on March 22, 2005, and we felt that announcement could pressure the shares.
Since the valuation and the price action were consistent with what I look for in short sale candidates, and the impending earnings announcement could provide the catalyst for a lower stock price, we surmised that I could be a bit flexible with the “hype” requirement.
The Mechanics of Short Selling
Since short selling involves selling stocks that you don’t currently own, it is necessary to borrow the shares from your broker. To do this, you’ll need to open a margin account and deposit 50% of the value of the shares you’re borrowing. Once your broker approves your request to borrow the shares, then you may go ahead and sell the shares short.
The entire sales proceeds are credited to your account, and you will be obligated at some point in the future to buy the shares back to replace those that you originally borrowed. If you are able to buy the shares back at a lower price, then you keep the difference.
On the other hand, if you have to pay more for the shares than you originally received, then the loss is deducted from the funds you originally deposited in the account.
Since the shares are termed “borrowed,” then any dividends or stock splits paid by the company are the obligation of the short sell-er. In other words, if a stock you’ve sold short pays a $0.75 dividend, then that amount is deducted from your brokerage account.
Similarly, if a stock you’ve sold short declares a two-for-one stock split, then you’ll be liable to return twice as many shares to your lending broker. Keep in mind, none of this actually affects you financially, because both the dividends paid and the stock splits are reflected in an automatically lowered price per share. Nonetheless, short sellers need to be aware of these obligations.
Let’s revisit the previously addressed misconception that short sell-ing may subject the investor to unlimited losses.

S&A Trader’s Manual
104Table of Contents
When short selling, an investor loses money as the stock moves higher. Since, in theory, there is no limit as to how high a stock can climb... then, in theory, there is no limit as to how much a short seller can lose. Of course, theories are one thing and practical reality is quite another.
The truth is that as a short sale moves against the investor (the stock climbs higher), the brokerage firm will eventually require the investor to either deposit additional funds to secure the position or to buy the shares back and close the position completely.
This is known as a “margin call,” and generally occurs on short sales with a move of just 20% in the wrong direction. In this manner, a margin call serves as an almost automatic stop-loss on ill-con-ceived short sales. Granted, a loss of 20% on a position is no walk in the park, but it is infinitely more acceptable than an unlimited loss.
If it’s up to me, though, I’ll choose to keep my losses as small as possible. Consequently, in the S&A Short Report, we employ three specific trading strategies designed to limit our losses and maximize our profit potential...
1. Buy put options in lieu of shorting the stock.
2. ALWAYS sell at least half our put options at a double.
3. Stop ourselves out of any trade where the stock rallies more than 3% above its 50-day moving average line.
Let’s look at each of these strategies individually.
Buy Put Options in Lieu of Shorting the Stock
Truthfully, because of the availability of put options, you really have no reason to actually go through the process required to short a stock. Just buy put options instead.
Of course, like most things in life, there is a smart way to do this and a not-so-smart way to do this. Most people, unfortunately, exercise the “not so smart” way of buying put options, which means that most people lose money in their option trades.

TRADER’S TOOL BOX
105Table of Contents
We’re not most people.
The common mistake option buyers make is that they overleverage. In other words, they buy far too many options than their account size justifies.
Let’s say, for example, you liked our April 22, 2005, recommendation to sell short shares of PF Chang’s Bistro (Nasdaq: PFCB). Instead of shorting the stock, we specifically recommended the PFCB May 60 put options, which were trading for $2.30.
If you normally trade in 1,000 share increments, then you could have sold short 1,000 shares of PFCB and deposited the required 50% deposit (roughly $30,000) with your broker. Or you could have purchased 10 of the PFCB May 60 put options for $2,300 (each put option controls 100 shares of stock, so 10 put options is equivalent to shorting 1,000 shares).
If you chose to short the actual shares, then your maximum poten-tial loss would be, in theory, unlimited, and in practice about $6,000 (20% of your $30,000 deposit).
By purchasing the put options your maximum potential loss is re-duced to $2,300.
Of course, most people don’t think that way. Most people think, “I can deposit $30,000 and sell short 1,000 shares of PFCB, or I can purchase $30,000 worth of put options.” This type of thinking is foolish, because rather than using put options to reduce risk, we’ve actually increased our potential maximum loss.
Instead of substituting 10 puts for our normal trade of 1,000 shares, we’ve overleveraged and bought 130 puts, which covers 13,000 shares.
One of the annoying characteristics of options is that they have this nasty habit of expiring worthless. Consequently, you have to be willing to accept the potential loss of 100% of the capital you put at risk in options. So you should never, Never, NEVER buy more put options than necessary to control the number of shares you normally trade.
In other words, if you typically trade 1,000 shares, then buy 10 puts.
S&A Trader’s Manual
106Table of Contents
If you normally trade 500 shares, then buy five puts, etc.
Another benefit to using put options as an alternative to selling shares short is that, on occasion, it may not be possible to borrow the actual shares from your broker. Every once in a while, your bro-ker will decline your request to borrow shares. This will most likely be because the brokerage firm does not have any shares to lend.
Often, this condition exists in stocks with a very high short interest. As a result, your only possibility to profit on the decline of the com-pany’s shares is to buy put options on the stock.
ALWAYS Sell at Least Half of YourPut Options at a Double
There are very few things more depressing than watching a winning position become a loser.
Consequently, I’ve made it a habit to sell at least half of each option position at a double. This insures that no matter what happens with the trade in the future, I’ve taken my original investment off the table and I’m now playing with the “house’s” money. In fact, I personally prefer to sell 60%-70% of each option position at a double, thereby guaranteeing a profit on the trade.
Many of the trades we’ve recommended in the S&A Short Report have yielded profits almost immediately. This immediate move in our direction tends to increase the confidence level of investors who’ve taken our advice and often leads to a desire to stay with the trade no matter what. This is dangerous thinking.
When buying stocks, time is on the side of the investor. If a company misses its earnings number, launches a failed product, is the subject of an SEC investigation, or missteps in any number of ways, long-term oriented shareholders can stick around. And, given enough time, the company can right itself and investors can eventually turn a profit.
The same cannot be said of short sellers. Short sellers attempt to capitalize on the short-term distress of a company, or on the short-term conditions that create an overly optimistic share price. When

TRADER’S TOOL BOX
107Table of Contents
the market recognizes these conditions, a stock will often fall precip-itously and short sellers can reap huge gains in a very short period of time.
Short sellers would do well, however, to recognize that these condi-tions are often just temporary, and that the capital gains that have come so quickly could evaporate over time. It is important, there-fore, to be relentless about taking profits on short positions and to ALWAYS sell at least half of our put options at a double.
Stop Ourselves Out of Any Trade Whenthe Stock Rallies More Than 3% Above Its
50-Day Moving Average Line
Many of the recommendations you’ll read about in the S&A Short Report will be on stocks where the price action has broken down by falling below the 50-day moving average line. As I mentioned previ-ously, this is often a signal that a stock has lost momentum and is now shifting from a bullish pattern to a bearish pattern.
Clearly, if the stock can then regain momentum by rallying above its 50-day moving average line, then we need to accept the possibility that we’re wrong on the trade and we’ll need to exit the position.
Always Use Limit Orders When Selling Stocks Short
While the exchanges are experimenting with the idea of eliminating the “short sale plus-tick rule,” this rule still applies to the trading of most issues. The rule was initiated originally in 1934 as a method of preventing manipulation of share prices by unscrupulous short sellers.
Essentially, this rule prevents short sellers from “piling on” by requir-ing short sales to be executed only on plus-ticks or zero plus-ticks. A plus-tick occurs when a stock trades at a price higher than its im-mediately preceding trade. For example, if a stock trades at $17.00 and then ticks up to $17.01, then a short sale can be executed on that trade of $17.01.
Furthermore, if the stock then trades again at $17.01, that is called a “zero plus-tick” (meaning that it ticked higher and then stayed

S&A Trader’s Manual
108Table of Contents
there), and a short sale can be executed here as well.
Stocks that are declining rapidly may go several minutes and lose several points without ever having a plus-tick. Consequently, orders to sell short “at the market” risk being executed at a price signifi-cantly lower than when the order was originally entered.
Therefore, in order to prevent the possibility of getting a bad fill on our short sales, we recommend using limit orders (specifying the price at which you are willing to sell the stock) exclusively.
Conclusion
The one goal of the S&A Short Report is to introduce you to ideas that will allow you to profit as securities decline in price.
We look to recommend short selling stocks that exhibit the following three characteristics:
1. Ridiculously high valuation.
2. High degree of optimism surrounding the shares.
3. Price action that has just turned down following a period of steady incline or parabolic rise.
Furthermore, we utilize the following risk reduction strategies:
1. Buy put options in lieu of shorting stocks.
2. ALWAYS sell at least half of our put options at a double.
3. Stop ourselves out of any trade where the stock rallies more than 3% above its 50-day moving average.
4. Always use limit orders when selling stock short.
By adhering to these principles, we expect to offer recommendations that exhibit above-average profit potential and below-average risk.

TRADER’S TOOL BOX
109Table of Contents
THE S&A GUIDE TO OPTIONS TRADING
By Stansberry & Associates Investment Research
This special report is all you need to know about options, and noth-ing you don’t. It is short, but it is complete. How can it be short and complete? We’ll explain inside. But first... here are a few things you must keep in mind:
Truth No. 1: Buying and selling options is about the riskiest and potentially most rewarding game on Wall Street.
Options master Victor Sperandeo racked up a nominal rate of return of 70.7% without a losing year between 1978 and 1989. With his astounding track record, we’d be foolish not to pay attention to what he has to say:
“Options are, many say, the riskiest game in town. Certainly they are by far the most challenging, flexible, and potentially profitable fi-nancial instruments available. But if you trade them prudently, if you apply sound principles of money management, trade only when the risk/reward ratio is highly in your favor, and execute your trades with diligence and patience, then in all likelihood you will be profitable over the long term. I can say, conservatively, that at least 40 percent of all the returns I’ve made in my life have been with options.”
Truth No. 2: Want to be a winner? Watch your losers!
To succeed in trading options, you really need to limit your trading to opportunities that have at least a 3-to-1 payout. A 5-to-1 reward-to-risk ratio, of course, is better. But at minimum, you want to have the potential to pocket $3 in return for every dollar you risk.
You accomplish many things by forcing a minimum 3-to-1 discipline on yourself. For one, it forces you to think in terms of reward and risk, which is extremely important. Most failed options traders, even ones that may have had good trading systems, fail because they didn’t pay enough attention to risk. If you’re willing to lose 50% on a position, you’d better be expecting a gain of 150% or more – at minimum. That’s a tall order.

S&A Trader’s Manual
110Table of Contents
If you’re willing to lose it all (meaning have the potential for a negative 100% return on a position), then you’d better be expecting a 300% to 500% or more gain in that position.
When you see it in those terms, and you realize that 500% win-ners don’t come along every day, you can see “risking it all” is a bad bet, in terms of risk versus reward.
Options are a lot like poker. Your hand is only a small por-tion of the battle. Betting ap-propriately for the entire game is really what’s important, which leads us to...
Truth No. 3: Big winners make small bets
You’ve got to know when to hold ‘em and know when to fold ‘em. But you’d sure hate to fold ‘em and take a total loss with a big bet on the table... So don’t ever put yourself in that boat. Limit the size of your positions. You should only have 2%-3% of the money you’ve set aside for trading at risk on any one trade. We really can’t imagine any combination of circumstances where you should consider putting more than 10% of your trading mon-ey on one play. Don’t do it!
How to Calculate Riskand Reward
By Jeff Clark
In every option trade I make, I establish a target price for the stock. Most of the time, I base this on technical analysis. For example, in March 2008, shares of OmniVision (Nasdaq: OVTI) presented a compelling op-portunity. Fears of a business slowdown had beaten down the stock. But where most investors saw problems, we saw a good trade.
The OmniVision June 12.50 calls were trading for just $1.10. And based on the chart pattern, I set a minimum target price for the stock at $15.
When I made the trade, I knew if the stock made it to $16 before option expiration in June, then the minimum the OVTI June 12.50 calls would trade for was $3.50. So if I paid $1.10 for the calls, then I would risk $1.10 to make $ 2.40 – a little better than a 2-to-1 risk/reward ratio.
If I set a stop on the option at a 50% loss, then I was really risking just $0.55 (50% of $1.10) to make $2.40 – a 4:1 reward/risk ratio and a good trade.

TRADER’S TOOL BOX
111Table of Contents
To end up like Vic Sperandeo over the long run, you’ve got to stick to the program. Limit the size of your positions. And limit your down-side by never allowing a small loss to turn into a big loss. Traders who follow this have a chance of being winners in options over the long run. Those who don’t do this will be quickly drummed out of the club, taken for every penny.
An Easy Way to Understand Calls and PutsBuying Calls Is a Walk on the Beach
By Dr. Steve Sjuggerud
There’s a piece of land on the beach that I have my eye on. Empty lots on the water are hard to come by around here – they rarely go on the market. And when they do, they’re snapped up pretty fast.
I drive by it around dusk one day on my way to a dinner party and see an old man on the property. I get out of my car and strike up a conversation, looking over the water. It turns out he’s the owner. I ask him if he’d ever consider selling the property. “Sure,” he says. “A million firm.”
Right on the spot, I try to work a deal. I think a million is actually a good price for oceanfront around here, but I don’t want to tell him that. And I need a little time to do my homework and get my financ-es together.
Here’s the deal I offer: “I’ll give you $10,000 right now – that you can keep – if you can give me a piece of paper giving me the right to buy this property for $1 million any time in the next 30 days. If I decide not to buy it, you keep the money.”
“You’ve got yourself a deal right there,” he says, happy to pocket the no-risk $10,000.
I head out to the dinner party. At the party, I meet some folks who’ve been looking to buy on the ocean for months, but nothing has come on the market. They mention that they’ll snap up the first thing avail-able, even over $1 million.

S&A Trader’s Manual
112Table of Contents
Long story short, I sell them the old man’s oceanfront lot for $1,050,000.I made a 400% profit in a few hours, by selling an asset that I controlled, but didn’t own.
I could have completed the transaction two ways:
1. I could have exercised my right to buy the land, and gone through all the paperwork hassles and documents, taxes, and fees, only to turn around and go through all that again with the sale.
2. I could have simply sold my “right to buy” piece of paper to the couple for $50,000.
For $10,000, I had the “option” to buy this land over the next 30 days. I could either buy the land or sell my right to buy. That’s exact-ly what an option is...
OK, I confess, this isn’t a true story. But it is a perfect example of buying a call option.
A call option is the right (but not the obligation) to buy something at a particular price. That’s pretty much it. I paid $10,000 to the old man for the option to buy his property. I paid $10,000 for a call option.
A call option has an expiration date. In this case, in 30 days, my call option would have expired – worthless. Options are worthless after their expiration date. You’d better either exercise the option by buying the property or sell the option to somebody else before it expires.
With stock options, you have the same choices as I did. You can ei-ther exercise the right to buy the stock at a certain price (like the $1 million figure), which is called the strike price. Or you can sell the option to somebody else through the options market, basically just like the New York Stock Exchange. Only it’s the options exchange. And it’s in Chicago.
The reality is, nobody goes through the hassle of exercising their right to buy, just like I didn’t when it came to the land. I didn’t want the land transferred to me before I sold it to the couple. And the same is true for stock options. Because there is an options ex-change, people are trading these options all the time.

TRADER’S TOOL BOX
113Table of Contents
Those are the basics of a call option. Now let me cover the basics of a put option...
Using Your Homeowner’s Policy to Understand Puts
Every time you buy an insurance policy, you are essentially buying a put option.
Take your homeowner’s policy as an example. When you sign on the dotted line and write your check, you are essentially buying the right to sell your house back to the insurance company for a certain val-ue, under certain conditions, for a limited period of time. By accept-ing your money, the insurance company has taken on an obligation to buy your house back from you under the same terms. The longer your policy has to run, the more the insurance company will charge you. A six-month policy costs less than a 12-month policy. It works exactly the same way with put options. The longer it’s good for, the more it costs.
As put-option buyers, we have two big advantages over insur-ance-policy holders. First of all, most options are not subject to the terms and conditions of many insurance policies. A disaster is not necessary for them to “pay up.” In the case of put options, the stock has to go down. That’s it.
Secondly, unlike the insurance-policy holder, buyers and sellers of options are free to change their minds about a position for any reason. You can always exit or add to your position by simply buying more or selling it in the market.
For the most part, options are as easy to buy and sell as stocks. This makes them an ideal investment for those who wish to take ad-vantage of big moves, because it can be done without the expense and risk of buying or selling huge chunks of stock.
In short:
• Buyers of call options want the stock to go up. They only make money if the stock goes up.
• Buyers of put options want the stock to go down. They only make money if the stock falls.

S&A Trader’s Manual
114Table of Contents
A Brief Options Glossary
Underlying Instrument: The stock, stock index, or any other finan-cial instrument that you have the right to buy and sell.
Premium: The price of the option.
Expiration Date: Options expire on the third Friday of the month. You must sell on or before the expiration date.
Exercise: You can either sell your option, or exercise your right to buy (in the case of a call) or sell (in the case of a put) the underlying instrument at the strike price. Readers of the S&A Short Report will never have to worry about exercising an option – we recommend selling them on the options exchange.
Strike Price: The price at which you can “exercise” your option. This price is based on the underlying instrument. Call-option buyers have the right to buy the underlying instrument at the strike price. Put-option buyers have the right to sell at the strike price.
In the Money: Calls are “in the money” if the price of the underlying instrument is HIGHER than the strike price. Puts are “in the money” if the price of the underlying instrument is LOWER than the strike price. (A put with a $20 strike price is “in the money” with the stock at $19.)
At the Money: When the price of the underlying instrument is identi-cal to the strike price. Same for both puts and calls.
Out of the Money: Calls are “out of the money” if the price of the underlying instrument is LOWER than the strike price. Puts are “out of the money” if the price of the underlying instrument is HIGHER than the strike price. (A crude-oil call with a strike price of $25 is “out of the money” if crude is at $20.)
Symbol: The basic parts of an option symbol are: Stock Symbol + Expiration Year + Expiration Month + Expiration Day + Call/Put Indicator + Strike price. You can see how this works in the earlier example.

TRADER’S TOOL BOX
115Table of Contents
Three Major Factors that Determine the Price of Options
1. Distance of the Strike Price from the Market Price: For out-of-the-money options, the closer the market is to the option’s strike price (the closer the option is to being “in the money”), the more expensive the option will be.
2. Time Until Expiration: The longer an option has to work, the more expensive it will be. Extra time simply gives the stock more time to make the move. An option is known as a “wasting asset.” It loses value with the passage of time.
3. Volatility: The more volatile the stock, the more expensive the option will be. Because volatile stocks have greater potential for large price moves, there’s a higher probability that an out of the money option will at some point be in the money.
Figuring Profit Potential
Profit potential for both buying and selling options is typically figured at expiration. At expiration, hard-to-figure pricing variables, such as time and volatility, drop from the equation, making profit calculations much easier.
However, that doesn’t mean that you need to hold an option until expiration, and you do not need to exercise your option in order to profit from a position. To take a profit on a put or call, simply sell it. You can also cut losses in losing positions by doing the same thing.
The vast majority of options are not carried through until expiration at all. Rather, they are sold on the options-exchange market.

S&A Trader’s Manual
116Table of Contents
Below, there are some simple formulas for figuring risk and profit potential, based on the market price of the underlying instrument at expiration.
Buying a Call:
Let’s say you think Company X, now at $29.50, has a rosy future. You expect the stock to hit $35 in the next six months, so you buy the Company X April 30 calls at $1.20. Here’s how to figure what you would need to break even and what your profit would be on expiration day if Company X moved in the right direction...
Strike Price $ 30.00
+ Amount Paid for Option + $ 1.20
Breakeven price $ 31.20
The market price of the stock needs to be above the breakeven price at expiration for a call to be profitable.
Market Price of the Stock $ 33.86 (Company X’s price at exp.)
- Strike Price - $ 30.00
- Amount Paid for Option - $ 1.20
Your Net Profit $ 2.66 (222% profit)
Buying a put:
Let’s say, conversely, you think Company X is going downhill. You expect the stock to sink to $25 in the next six months, so you buy the Company X April 30 puts at $1.50. Here’s how to figure what you would need to break even and what your profit would be on expira-tion day if the stock took a turn for the worse:
Strike Price $ 30.00
- Amount Paid for Option - $ 1.50
Breakeven price $ 28.50
The market price of the stock needs to be below the breakeven price at expiration for a put to be profitable.

TRADER’S TOOL BOX
117Table of Contents
Strike Price $ 30.00
- Market Price of the Stock - $ 26.20 (Company X’s price at exp.)
- Amount Paid for Option - $ 1.50
Your Net Profit $ 2.30 (153% profit)
Nuts and Bolts: Some Final Questions
Can I buy options through my regular broker?
Once you complete an extra “options agreement,” most brokers will allow you to buy calls and puts and to sell covered calls (sell calls on stocks that you own) without any problem.
More complicated trades, like spreading options or selling naked options require additional paperwork. Usually, investors have to have at least two years of options-trading experience and at least $25,000 in an account. These requirements vary by broker.
Where can I find quotes?
You can get option quotes on Yahoo Finance... First, look up the stock of the options you’re trading. Then click on “option” on the left side of the page. To search directly for the option, plug the option ticker into the search box.
Option prices on Yahoo Finance are 15 minutes delayed, so they’re basically worthless for trading purposes. Most online brokerage firms give you a certain number of free real-time quotes, and you can pay for more real-time access.
Another choice is to buy simple market-data services such as My-Track (www.mytrack.com).
How many options should I buy?
The common mistake option buyers make is that they overleverage. In other words, they buy far more options than their account size justifies.
Options are purchased in blocks of 100. So if the Microsoft April 30 calls are priced at $2.30, you’ll pay $230 for one contract, a call option on 100 shares of Microsoft.

S&A Trader’s Manual
118Table of Contents
Traders should use options as a substitute for the underlying shares. In other words, if you typically buy 1,000 shares, then you should buy 10 contracts. If you trade in lots of 500 shares, then you should buy just five contracts.
Of course, most people don’t think that way. Most people think, “I can deposit $10,000 and sell short 1,000 shares of Company X at $10 a share, or I can purchase $10,000 worth of put options.” This type of thinking is foolish. Foolish because, rather than using op-tions to reduce risk, they’ve actually increased their potential max-imum loss. Instead of substituting 10 puts for their normal trade of 1,000 shares, they’ve overleveraged and bought 100 puts, which cover 10,000 shares.
One of the annoying characteristics of options is that they have this nasty habit of expiring worthless. Consequently, you have to be will-ing to accept the potential loss of 100% of the capital you put at risk in options. So you should never, never, NEVER buy more put options than that which is necessary to control the number of shares you normally trade.
*******
There you have it... everything you need to make money in options with the S&A Short Report. And remember: Big winners make small bets.

TRADER’S TOOL BOX
119Table of Contents
THE 100% SECRET - THE EASIEST WAY TO MAKE MONEY IN A RISKY STOCK MARKET
By Porter Stansberry
Think back to October 2008...
Stocks had just suffered a historic fall. On October 10, the Dow Jones Industrial Average closed one of its worst weekly losses of all time – 15.1%.
Panic tore through investors... The Chicago Board Options Exchange Volatility Index – a measure of fear in the market – reached unprece-dented highs.
Of course, wise investors... those who understand how to value securities... knew they’d simply never see a better time to bloat their portfolios with cheap stocks. Investors ready with cash could load up on the safe, industrial stalwarts that comprise the Dow... GE, Johnson & Johnson, DuPont, IBM, American Express...
And the market rewarded their fearlessness with negative balances.
In the nearly six months following the panicked fall of 2008, the Dow headed straight down, bottoming in mid-March (at around 6,440) before ebbing upward. Stock investments made during that stretch might one day pan out for investors with the patience to wait for the market to recognize their wisdom. But it’s impossible to know when that will happen. And few investors have the bull-headed certainty in their decisions to hold out forever. Most will lose faith and cash out at a loss.
Meanwhile, one group of investors actually saw its capital grow during this period when all others were losing theirs... During the same six months when the market fell 16.5%, investors following this strategy – folks I’m calling “stock quitters” – watched their positions grow an average 44% every 90 days – an annualized rate of more than 178%.
These investors weren’t lucky gamblers, the kind who kick over that one-in-a-million penny stock just before its shares explode. These stock quitters were following a sound strategy that used rampant fear in the marketplace to generate cash upfront for their investments.

S&A Trader’s Manual
120Table of Contents
I’ve written this report to show you exactly how these investors gener-ated such remarkable profits during a historic market slump... More important, when the looming currency crisis reaches full bloom, fear will rip through the stock market once again. You can use this strategy to make safe double- and triple-digit gains without owning stocks.
Let me show you how it’s done...
The Safest Income You’ll Ever Make
The stock quitter’s strategy is more commonly called selling short-term put options – or “naked” put selling...
Many people think of naked put selling as wildly risky... almost dis-reputable. Nothing could be farther from the truth. The fact is most people misunderstand and misuse the strategy. Done right, it’s the safest, most profitable income-generating strategy around. You can easily return more than 50% in a year, while putting little capital at risk – and never owning shares of stock.
Selling puts is a strategy in which you basically get paid for agreeing to buy a stock at a specified price at some point in the future. It’s like you’re insuring shares held by someone else... A panicky investor wants to know he can sell his shares at a set price no matter how low they fall on the stock market. You’re selling him that insurance...
It’s a lot like buying and selling homeowners insurance... When you buy homeowners insurance, you essentially buy the right to sell your house back to the insurance company for an agreed on value un-der specific conditions (e.g. after catastrophic damage) for a limited period of time. By accepting your money, the insurance company has taken on an obligation to buy your house back under the same terms. The longer your policy has to run, the more the insurance company will charge you. A six-month policy costs less than a 12-month policy. It works exactly the same way with put options. The longer it’s good for, the more it costs.
When you sell puts, you’re acting like the insurance company... If the stock declines (the house burns down), you’ll buy it at the bar-gain-basement price. If the stock doesn’t decline to the agreed-upon price, then you keep the option premium as a profit (unlike the com-pany that insures your home, we’ll get all of our premium upfront).

TRADER’S TOOL BOX
121Table of Contents
The key to selling puts safely and profitably is knowing exactly the real risks in owning a company’s shares. Just like the insurance company needs to know the details of your home (square footage, upgrades or renovations, what you paid for it, any valuables you keep there, etc.), we need to assure ourselves the companies we sell puts on are fundamentally sound.
We won’t insure just any stock. We’re going to identify stocks we like and would want to own. Then, we’ll insure them at a price they are un-likely to fall below. No matter what happens, we win. If the stock falls, we buy a stock we wanted to own at a great price. If the stock doesn’t fall into our laps, we keep the insurance premium free and clear.
Here’s how it works...
An Outrageous Deal – 72% in 12 Weeks
During October 2008, some Stansberry & Associates subscribers did very well selling puts on the world’s leading ratings agency, Moody’s (NYSE: MCO)...
At the time, all the major ratings agencies were under intense scru-tiny for their role in the mortgage/credit collapse that devastated the economy...
You see, during the mortgage bubble, firms like Moody’s and Stan-dard & Poor’s had rated mortgage securities as “triple A” – which should never default – even though they contained subprime mort-gages. In retrospect, this was irresponsible, even stupid. But at the time, using the best computer models available, Moody’s and other ratings agencies believed the default rates in these securities would be below the amount of capital set aside to protect the triple-A por-tions of these bundled securities.
All the attention and criticism – including predictable demagoguery from Congress – was crushing Moody’s stock price. The shares, which had traded for more than $73 in early 2007, were by October 2008 floundering around $20 – a 72% drubbing.
While the criticism of Moody’s may have been warranted, the draconi-an selloff was not.

S&A Trader’s Manual
122Table of Contents
Moody’s is a 107-year-old company that provides ratings on fixed-in-come securities, debt instruments, and corporations. It covers 12,000 corporate issuers of debt and about 96,000 structured financial obli-gations, including things like mortgage-backed securities. It has offic-es in 22 countries and employs more than 3,000 people worldwide.
There are two keys to understanding this business. First, it’s essen-tially impossible to issue debt without a rating from Moody’s, and the issuer must pay for the rating. As a result, Moody’s makes money both by selling information to subscribers and by selling ratings to debt issuers. Second, Moody’s has a wide economic moat because of its sterling reputation and because the government regulates these firms. To issue a debt security, you have to receive at least one rat-ing (and typically two) from one of the nationally recognized ratings firms. Moody’s and Standard & Poor’s are widely considered the two leading firms.
We knew at the time October’s storm would pass without hurting Moody’s or the long-term quality of its brand. Businesses and govern-ments would continue selling bonds, no matter how bad the economy got. And they’d need Moody’s to rate those bonds. Moody’s would not be replaced by some new government agency. So we could be confident Moody’s was in no danger of going out of business. (No-tably, rating a bond implies no guarantees or fiduciary obligations. People who lost money on mortgage bonds cannot sue Moody’s.)
And we knew this... In the preceding quarter – during the worst under-writing period in memory – Moody’s still made more than $60 million in cash. It remained an incredibly profitable business (profit margins above 20%) that required almost no capital investment to grow. And Warren Buffett owned nearly 20% of the stock.
Frankly, regardless of the credit mess, we knew Moody’s remained one of the top 20 businesses in the world – the kind of stock you hold forever.
If you’d bought MCO shares on the day I wrote about it (October 22, 2008), you would have made about 7% over the next 12 weeks as the shares traded essentially sideways (assuming you didn’t get scared out of the position when it cratered around $15.56 in late November).
TRADER’S TOOL BOX
123Table of Contents
That performance isn’t terrible, given everything else that was going on in the market.
But subscribers who followed my recommendation earned nearly 72% on their capital at risk over the same period...
You see, in addition to beating down the share price of Moody’s, the negative publicity drove up the premium investors could receive by selling the company’s puts. Specifically, in mid-October, the Moody’s January 2009 puts with a strike price of $15 traded for about $2.15.
Selling that put would have given you $2.15 per option and obligated you to purchase MCO shares for $15 each if the stock traded that low by January 16, 2009 (the day the options expired).
On October 22, I advised readers to take that deal. Specifically, I told them to:
Sell the MCO January 2009 $15 put (MCOMC.X) for no less than $2. (In fact, most readers received closer to $2.15 per option).
At that point, the trade could have worked out in one of three ways:
If MCO traded for more than $15 on January 16, 2009, the options would expired worthless. We would have kept the $2.15 premium and had no more obligation to the stock – a total win on our investment, without ever owning the stock.
If the stock traded between $13.01 and $15, we’d have had to buy the stock at $15 a share. But since we would have still keep the $2.15, we would be up on the position and holding a Tiffany stock at Zales prices.
If the stock traded for $13 or less, we’d have had to buy the shares at $15, and we’d have been down on the position. This seemed high-ly unlikely since $13 represented a 36% discount from the stock’s already oversold price...
And even if the trade broke that way, we’d have been holding a world-class stock for 74% less than my estimate of the company’s intrinsic value (which I calculate based on 20 times my estimate of the compa-ny’s annual free cash flow).

S&A Trader’s Manual
124Table of Contents
This was an outrageous deal for us.
And it turned out as well as we could have hoped...
On January 16, 2009, Moody’s closed at $21.30 – well above our strike price. We kept the $2.15 premium we received 12 weeks earlier, booking a 71.7% return on our $3 margin.
Two Key Points About Puts
Before you start selling puts, you need to understand two critical points about how they are traded...
First, one option contract is good for 100 shares. Let’s say you sell a put for $2 that has a strike price of $15. You’ll get $200 upfront ($2 x 100 shares). You’ll also be obligated to buy $1,500 worth of stock if the option is exercised. Two contracts would generate $400 and obligate you to buy $3,000 worth of stock.
This is important to remember. Don’t sell puts on more shares than you’re willing to buy. If you’re comfortable owning 100 shares, sell one contract. If you’re comfortable owning 500 shares, sell five contracts.
Second, your broker will want to make sure you’re good for the stock purchase in case the shares are “put” to you. So he’s going to require you keep a percentage of the potential obligation in an account with him. That percentage is called a “margin requirement,” and it usually equals about 20% (though it can vary among brokerages).
If you’re going to sell one put with a $15 strike price ($15 x 100 shares = $1,500 obligation), your broker will ask you put up about $300 ($3 per put) in margin. Of course, if the puts expire worthless, you’ll keep your margin... and the premium.
That margin represents your capital at risk, and it’s how we calculate gains. So if you received $2 in premium upfront and put down $3 in margin, you’ll record a 67% gain if the options expire worthless.money” if the stock is at $25.)

TRADER’S TOOL BOX
125Table of Contents
Almost No Way to Lose Money
The Moody’s example also underscores the real beauty of selling puts... We don’t have to be exactly right about how or when a stock will rebound... Many factors work in our favor, so even if the shares stagnate, we’ll still profit.
We don’t have to be right about the stock price rising – we’ve sold out-of-the-money options, so we’re safe as long as the stock doesn’t completely tank. And we don’t have to be right forever – just for two or three months (our obligation to buy expires with the option).
Selling puts gives us huge odds in our favor. It’s, of course, possible to lose money on the deal. Every investment carries risk, and no one can predict the future. But selling puts generates income and, at the same time, hedges our investments by getting us much lower entry prices on any stocks we end up buying.
Selling insurance and collecting premiums is a much safer and higher-percentage speculation than simply buying stocks outright. In fact, if I do my job perfectly as an analyst, we shouldn’t actually buy any stocks – we’ll simply collect premiums and earn about 50% on the capital we’re holding. All we have to do is be prepared to buy if the time comes...
And if we do end up converting one or two stocks, that’s fine, too. Our entry prices will be so low we won’t have much risk at all.
Call Your Broker
If you’ve never bought or sold puts before, ask your broker for help setting up any trades we make.
And before trying to put on any trades, you’ll need to authorize your brokerage account for trading options. This is an easy process. Your broker can provide you a standardized options agreement. Simply sign the form, and your account should be approved immediately.

S&A Trader’s Manual
126Table of Contents
HOW TO SAFELY DOUBLE AND TRIPLE THE RETURNS IN YOUR RETIREMENT ACCOUNT
In mid-2010, I asked Dr. David Eifrig to compile a list of the best trading strategies in the world.
Dr. Eifrig is one of the best traders I’ve ever met. He spent over 10 years working for the world’s elite investment banks like Goldman Sachs… where his job was to use the derivatives markets (things like options and futures) to help his clients and the firm navigate through every business climate you can think of.
“Doc,” as we call him around the office, eventually retired from Wall Street, then went to medical school and studied to become a board certified eye surgeon. We managed to “coax” him back into the financial world however, and share his tips on wealth and health to our readers.
It’s been an incredible success so far. As of late 2011, Dr. Eifrig has gone 41 for 41 in his Retirement Trader advisory. In the following pages, adapted from his “Black Book of Retirement Trading Se-crets,” Dr. Eifrig shares his insights on the market… and the strat-egies you can use to start safely doubling or tripling the returns in your retirement account.
Brian HuntEditor in Chief, Stansberry & Associates
(Adapted from the “Black Book of Retirement Trading Secrets”)
I could tell you I manage my money the way professional Wall Street traders do... or tell you that you’ll be hearing about complicated hedge-fund strategies. But I believe it’s more useful to describe intelligent trading in terms of the anaconda.
Anacondas are the largest snakes in the world. They are also one of the world’s most efficient hunters. But anacondas don’t zip around and get into long battles with their prey.
They sit around in rivers for long periods of time, waiting for the easi-

TRADER’S TOOL BOX
127Table of Contents
est prey possible. Only when they get easy, slam-dunk opportunities – like when an unsuspecting animal stops for a sip of water – do they strike. Then, they slowly wrap themselves around their prey and squeeze it to death.
Said another way, anacondas are nature’s “cheap-shot” artists. They aren’t interested in fair fights. They only participate if the odds are overwhelmingly stacked on their side. Anacondas grow to enor-mous sizes because they don’t spend much time or energy chasing everything that comes along. They are the natural world’s “no risk” operators.
That’s how I’d like you to think about trading stocks, bonds, and commodities – like an anaconda might. I want you to act only when the odds are heavily stacked in your favor. I want you to avoid the loser’s mentality I described above. Avoid worry, wasted time, and impatience. I want you to be a rich skeptic who racks up extraordi-nary returns by avoiding risk.
Avoiding risks and becoming a rich skeptic has nothing to do with sticking to bank deposits and Treasury bonds paying 2% a year. It has everything to do with what I call the “Black Book of Retirement Trading Secrets.”
The Black Book is a collection of six trading tools I assembled over decades of trading, going to the best business schools, and work-ing with the “sharks” at Goldman Sachs. (In case you’re wondering, yes, the company does some shady things... but it is also the very best in the world at advanced trading techniques.)
Don’t worry about that word “advanced,” though. Each technique I’m going to show you is simple to learn and use. Each is focused on “high upside, with low downside” opportunities that retirees and people saving for retirement should always focus on. Put them all together, and you’re going to have a safe trading system that rivals that of any highly paid hedge-fund manager.
I have no doubt that used properly – and paired with an “anacon-da’s view” of trading – these strategies will allow you to SAFELY double or even triple the gains you are used to making in the stock, bond, and commodity markets.

S&A Trader’s Manual
128Table of Contents
Here they are...
Retirement Trader Tool No. 1:Free “Play Money” Stock Options
Most people know stock options are a great way to get rich in America...
Take Stephen Hemsley, CEO of the big insurance firm United Health Group. His 2009 salary came in at around $9 million. But a de-cade earlier, he received stock options as part of his compensation package. In 2009, he exercised 4.9 million of them for a total gain of $98.6 million.
These huge option payoffs are just business as usual on Wall Street... and most of the time, there’s nothing wrong with them. Sev-eral of my good friends will never have to work again because they exercised options on thousands of shares of company stock. These options allow people to buy a company’s shares for a small amount of money, then eventually sell the shares for much higher prices. They can bring in hundreds of thousands of dollars of extra income for folks.
Most people have to work for years to receive stock options from their employer – or use risky trading strategies to acquire in-the-money options (“in the money” means the option’s strike price is below the price of the underlying stock). They have no idea there’s a way to receive free stock options any time you want them.
In fact, acquiring free stock options is one of the easiest, safest ways to invest in the stock market. It’s a strategy I learned more than 20 years ago while trading derivatives on Wall Street.
I guarantee 99 out of 100 investors have never heard of it before.
Let me give you an example of what I mean... In April 2010, I recom-mended one of the best “free stock options” trades I’ve ever seen...
I follow the medical and biotech stock sector closely. Several of the most profitable trades and investments of my life have come from this sector... and I’ve traded it from just about every angle possible: from private biotech investments... to owning shares of health care powerhouse Johnson & Johnson... to complicated option “insur-

TRADER’S TOOL BOX
129Table of Contents
ance” strategies.
One of my favorite companies in this space is $100 billion British drug giant GlaxoSmithKline (NYSE: GSK).
GSK is an innovative Big Pharma company with an exceptional re-search & development process. It constantly increases shareholder equity... and has a culture of treating investors well in the form of big dividend payments. In April 2010, GSK was yielding around 6%... or around $2.30 per share, per year. GSK was also undervalued relative to its annual earnings, so I expected shares to appreciate in value.
This $2.30 annual dividend payment is important... it’s the key to our “free stock option.”
You see, I love to own safe stocks that pay big dividends like GSK. But I also like the tremendous leveraging power that stock options provide. That’s why I often buy these sorts of stocks... then take the money I receive in dividends and buy call options with them. I fund the speculative portion of my position with the company’s dividend.
That’s why I consider these sorts of trades to be getting “free stock options.”
To give you a better idea of exactly how these kinds of trades can work out, let me show you how the math looks for the GSK trade I just talked about.
In the original trade, I recommended folks buy GSK and buy one call option for every 100 shares of stock they purchased. Remember... when you trade options, one contract represents the right to buy and trade 100 shares of stock.
At the time, GSK was selling for around $39.50 per share. I recom-mend buying the January 2012 $45 call options for $2.30 or less... about the amount of the annual dividend. (The calls were actually trading for $2 per contract at the time.)
These January 2012 $45 calls would only become profitable if GSK shares climbed to more than $45 per share by January 2012. If GSK climbed to say, $80 per share, that option, which was trading for around $2 per contract at the time, would be worth $35 per con-

S&A Trader’s Manual
130Table of Contents
tract... a more than 17-fold gain.
For every 100 shares traded on GSK, the math worked out as follows (not factoring in commissions, as everyone’s fees are different):
Buy 100 shares of GSK at $39.50 for $3,950.Buy one GSK January 2012 $45 call option for $200.Total outlay: $4,150.
This trade could work out in a variety of ways. Here’s how...
Scenario No. 1:
If GSK trades for $85 per share by January 2012, we can buy shares at the strike price and immediately sell them for a profit. The profit per share is the difference between the price GSK is trading at in 2012 and the strike price of $45.
If GSK is trading for $85 by January 2012, you’ll make $38 per call option ($85 minus the $45 strike price less the $2 cost of the op-tion). You’ll also make $45.50 in capital gains on the stock itself. That would be a combined gain of $83.50 (on a $39.50 investment) for every hundred shares... more than 200%.
Here’s the math for a 100-share position:
Initial outlay of $4,150.
Option contract is now worth $4,000 ($85 current price minus the $45 strike price).
Stock is now worth $8,500.
Initial outlay of $4,150 is now worth $12,500. A terrific 201% gain in less than two years on a safe, dividend paying stock.
Scenario No. 2:
Let’s say GSK shares don’t rise to $85 per share by January 2012. Let’s say they rise to just $65 per share. Here’s how the math works out in this scenario:
Initial outlay of $4,150.

TRADER’S TOOL BOX
131Table of Contents
Option contract is now worth $2,000 ($65 current price minus the $45 strike price). Stock is now worth $6,500.
Initial outlay of $4,150 is now worth $8,500... a 105% gain on a safe, dividend paying stock.
Scenario No. 3:
Let’s say GSK shares rise only slightly to $50 per share by January 2012. Here’s how the math works out:
Initial outlay of $4,150.Option contract is now worth $500 ($50 minus $45). Stock is now worth $5,000.
Initial outlay of $4,150 is now worth $5,500... a 33% gain in just over 18 months. Not a huge gain, but still a great safe profit.
Please note... this is not a “covered call” trade where you buy a chunk of stock and SELL call options against your shares, pocket-ing a premium in the process. There’s a time and place for covered calls... but in situations where you can buy a cheap call option that is paid for by the company’s rich dividend, you want to BUY the calls... and get a lot more “juice” on conservative trades like GSK.
This is especially important when you have a stock you expect to substantially appreciate in value. You want plenty of exposure to that upside... which is what a call PURCHASE provides
How to Protect Your Capital from Losses
In every trading situation, we have to form a plan in case we are wrong. Most advisories never tell you how to form a plan in case a trade doesn’t work out as expected. But in my opinion, that’s a huge mistake. Forming a plan for all kinds of situations is vital.
Statistics show even the best traders are right on only 55%-60% of their trades. The key to making plenty of money with these odds is to set yourself up for big profits (like in scenario No. 1 and No. 2) while ALWAYS limiting your downside with protective stops and intelligent bet sizes.

S&A Trader’s Manual
132Table of Contents
In the case of this trade, I initially placed a 25% “protective stop loss” on the total position ($4,150). This means that if the combined value of our shares and options falls to less than $3,113, we’d sell the position to protect the bulk of our capital.
Here’s how the math works out should the broad stock market enter a period of extreme weakness and drag GSK down with it...
A market decline could send GSK shares to less than $35. In this sit-uation, our call option would drastically decline in value... probably from $2 per contract to just $0.10 or $0.20 per contract.
Let’s be conservative and not assign any value to them in this situation. If GSK shares sink to less than $31.13 by January 2012, it would trigger the 25% stop loss. Our options would retain some small amount of value. But for simplicity’s sake, I’m assigning zero value to them... and stating that our stop loss would be triggered by a decline to $31.13 per share. This would be a loss of $1,038.
As you can see by the various potential scenarios, we are risking $1,038 to make $5,500... $8,500... or even $12,500 on a big, safe stock. This “low-downside/huge-upside” situation is only possible by the addition of an option contract paid for by the company’s divi-dend. A dividend that allows us to accumulate “free stock options.”
Why Bother with the Stock?
Experienced option traders might wonder, “If shares have the potential to rise all the way to $85, why not just outright buy the options for $2 and watch them go to $40? Why bother with buying the actual shares?”
After all, making $40 on $2 is a 1,900% return on your investment.
You could do that trade... and you might make a bundle doing it. Buying JUST a call option – and no actual stock – limits your downside to just the premium you pay.
But those options won’t be “free.” You have to spend your own cash for the options. There’s also a higher risk of the trade not working out.

TRADER’S TOOL BOX
133Table of Contents
Retirement Trader Tool No. 2:Timeless Options – Stock Options that Never Expire
One of the greatest moments of my financial career was made pos-sible by “stock options that never expire.”
Let me take you back to the 1980s...
John – as I’ll call him – was a hulking man – six-foot-four and at least 250 pounds. He was so big that when you shook his hand, you prayed he didn’t squeeze. John was a big-shot client at Goldman Sachs, and I met him in my Wall Street days when one of the firm’s partners introduced us on the trading floor.
Somehow, we got on the subject of health. He told me he was on dialysis. His kidneys and blood cells weren’t working right. Then, he added with a big grin that a new drug had changed his life. (I was years away from med school then and didn’t know a kidney from a gallbladder).
If the stock moves up to just $45 in one year, your options will on be worth about what you paid for them today – $2. And though you’ve lost nothing with just buying calls, my first strategy of owning the stock and using the dividends to pay for the options has made us 19% during the year ($45 plus the value of the options at $2 each, less the $39.50 we paid for the stock – for a gain of $7.50 on $39.50 invested). Plus, we’re still holding the free options that haven’t cost us a dime.
Similarly, if the stock stayed at $39.50 for the year, we would make a little money on the original strategy because the options would still be worth about $0.65. The calls-only buyer would have lost 70% of his money ($2 to $0.65). And he’d likely have stopped out of the position, assuming he used a reasonable stop loss of 25% to 50%.
I like to aim for surer, safer gains. While there might be a rare occasion I’ll recommend a straight call option purchase, it’s unlikely. Ninety-nine percent of the time, it’s more risk than I’m willing to take on.

S&A Trader’s Manual
134Table of Contents
John explained how his blood had returned to health and he had rediscovered the energy he lost years ago. It was like a second chance at life: He was walking with his wife and “regularly doing things” they did when they were 30 years younger.
His story was so powerful and his passion so strong that I asked him the name of the drug. He said “E-P-O.” The tiny company that made it was called “Amgen.” Then, he turned to me and said: “Son, I know when things work and when they don’t. And this stuff works. In fact, I’ve bought several thousands of shares, and you’d be wise to do the same.”
Back at my desk, I reviewed what I could find about this unknown Amgen and put around $12,000 into the stock.
Many of you will recognize Amgen as the preeminent biotech com-pany in the world today... a $60 billion behemoth that pioneered the use of bioengineering in the development of drugs. But back in 1987, its success was anything but assured.
Amgen was merely one of at least 20 other equally promising bio-tech startups.
It was a risky play. But everything I learned about it looked great: The science made sense... and I figured any drug that could save or alter a life like it had the John’s was probably a good bet.
I made nearly 21 times my money over the next three years... a little more than $250,000.
I never saw John again. I never had the chance to thank him for helping me make so much money. But the experience taught me one of the greatest investment lessons of my life:
When you find a risky opportunity that has the possibility of making you a lot of money, take it... but “take” it small. Throw a little bit of cash that way. Don’t throw in the rent money, but if you can afford it, toss in a little play money.
My investment in Amgen represented a small (1% or 2%) portion of my portfolio. At any one time, I had three or four speculations like that going. And I don’t say this to brag, but the simple fact was, it

TRADER’S TOOL BOX
135Table of Contents
was money I could lose and not worry about coming up with my next rent check.
These sorts of opportunities frequently arise in the form of tiny start-up companies working on one or two big ideas. They come in the form of “stock options that never expire.”
Why do I call shares of tiny companies “stock options that never expire?”
Many people see stock options as a way to buy, for just a few hundred dollars, the chance to make a huge amount of money on a trading or investment idea. They know the chances of the bet work-ing out are not as high as the chances of making money on a stable blue-chip company like Johnson & Johnson or Coca-Cola. This is why a smart stock-option position is just a tiny portion of an overall portfolio... perhaps just half of 1%.
Also... many tiny companies focus on just one or two big products, technologies, or in the case of resource companies, just one piece of prospective exploration property. They give you enormous upside exposure to one particular idea. Tiny companies don’t have the broad diversification that Johnson & Johnson does.
J&J sells all kinds of things like Band-Aids, mouthwash, cough syrup, and cholesterol drugs. The drawback with companies this diversified is you’re not getting the hundreds of percent upside a tiny company focused on one idea can offer... like Amgen was offering in the late 1980s.
Look, here’s where stock in these tiny companies and ex-change-traded stock options differ: Stock options have a prede-termined shelf life. They expire in a few months or, at best, a year. Most expire worthless.
Thus, making money on an outright stock-option purchase requires you to be right both on the business... and on the TIMING. Your trading thesis has to be proven right before the options expire in a matter of months. This is difficult for most investors and traders.
On the other hand, tiny stocks don’t expire. You can hold a specu-

S&A Trader’s Manual
136Table of Contents
lative position for as long as you want, provided the company isn’t spiraling into bankruptcy. And since the timing doesn’t matter... you wait for spectacular payoffs, just like the anaconda.
For example, consider stun-gun maker Taser International.
Back in 2003, Taser International was just the sort of one-trick pony that could produce huge capital gains. At the time, Taser was the name in stun guns. Police departments were buying stun guns like crazy back then. The guns offered a nonlethal alternative to shooting criminals with lead bullets.
In early 2003, shares of this super-small company were trading for $4.20. When investors got wind of Taser’s sales and potential growth, they bid shares to more than $110 per share in a little more than one year... a gain of 2,500%.
This sort of gain turned a modest $2,000 investment into more than $52,000… and it illustrates how placing a small amount of money into a tiny stock with big potential can result in a huge payoff. All with little risk to your overall wealth.
This “timeless option” strategy provides you with a lot of leverage to one single idea... just the sort of leverage conventional stock options offer... but without an expiration date.
Retirement Trader Tool No. 3:Cash at Closing
Getting “cash at closing” is perhaps my favorite way to make nearly risk-free profits in the stock market.
And while I encourage everyone I know to use small position sizes (0.5%-2% of an overall portfolio), for the vast majority of their trades, “cash at closing” deals are usually so safe... so profitable... and have such high probability... I often recommend committing a major chunk of your investment capital to them.
These deals are rare, but they must be seized with a signifi-cant amount of money.
Two incredible “cash at closing” opportunities turned up in late 2008.

TRADER’S TOOL BOX
137Table of Contents
I alerted readers of my monthly newsletter, Retirement Millionaire, to them. Anyone who took my advice made nearly risk-free profits of 17%-18% in a matter of months. These are truly “safe options.”
“Cash at closing” opportunities arise when one company tries to buy another. I’ll discuss how they work as I walk you through one of our past trades...
In July 2008, Swiss drugmaker Roche Pharmaceuticals agreed to buy, in an all-cash deal, the U.S. based biotech company Genen-tech.
Remember my Amgen story from Tool No. 2? Well, back in 2008, two companies reigned as the undisputed champions of the bio-technology sector: Amgen and Genentech.
Roche, a huge drug seller that needed to grow its drug portfolio, was buying smaller companies left and right for several years. It recently paid $125 million in cash to buy a private gene-therapy company, Mirus, that I held shares in since its founding in 1997.
Roche owned a majority of Genentech (54%) in 2008 and simply wanted the entire company for itself. It had a boatload of cash and was willing to pay up for an elite biotechnology company. It offered $89 per share.
Genentech’s board deemed the bid too low. Company shares were trading in the $90s at the time. Many thought Genentech owners should only agree to sell if the price was around $100-$105 per share.
While Genentech owners and managers were trying to figure out what to do, the Wall Street credit crisis struck. Like just about every asset in 2008, Genentech shares declined. Shares sunk into the low $70s in just months... over 18% less than the all-cash offer. This was an absurd discount to an ALL-CASH offer that was on the table from a super-strong buyer. There was no way the Genetech board would walk from an all-cash deal that paid a premium to market cap. And the financing was rock-solid; Roche was offering all cash.
So in October, I urged readers to buy Genentech. I was sure the deal would go through (more on this in a minute). Shares were trad-

S&A Trader’s Manual
138Table of Contents
ing for around $81.50.
My readers made a safe 17% profit in around five months as the deal closed for $95 in March 2009. It was the stock market equiv-alent of buying a car for $8,150, knowing a guy across the street with a suitcase full of cash would pay $9,535 for that same car.
The Wall Street term for “cash at closing” trades is “merger arbi-trage.” Companies try to buy each other all the time. When Com-pany A tries to buy Company B for, say, $50, the price of B almost immediately rises up to around $50. Sometimes it even goes to more than that.
How close it gets to $50 depends on many things, including:
*** Is the government going to scrutinize the deal? If you’ve ever acquired a driver’s license or waited on a building permit, you know this process can be like waiting for Godot.
*** Are there any national security issues? The government won’t allow certain U.S companies with valuable technology (espe-cially defense technology) or vital infrastructure assets to be ac-quired by a foreign company.
*** Is the financing secured? Roche was able to pay all cash for Genentech, but often times, a company must borrow money to buy another company. This can create problems, especially when credit is tight.
*** Are the shareholders on both sides likely to approve the deal? Different shareholders have different perceptions of value and different goals. If you’ve ever tried to get more than five people to agree on where to eat for lunch, you know this sort of thing takes time. This is largely the realm of huge institutional investors, pen-sion, insurance, mutual, and hedge fund managers.
All of these factors come together to create enough uncertainty that when one company puts an offer on the table to buy another com-pany, the market refuses to “price in” the completion of the deal.
Often, the market is willing to pay 5%-10% less than the buyout offer

TRADER’S TOOL BOX
139Table of Contents
a company has received. The amount mostly depends on the fac-tors outlined above. The deference in the buyout offer price and the current market price for a stock is called the “spread.” In the case of our Genentech trade, the spread was 17%.
Cash at closing deals take advantage of the uncertainty surrounding the merger going through. If you do the proper homework and take only the best opportunities, you can buy shares in the company being acquired below the offered price, hang on through the merger, and turn a quick profit. The risk, of course, is the deal could fall apart.
If the company being acquired enjoys a big price rise after the potential deal is announced, it can just as easily suffer a big fall if the deal falls through.
In my years of trading merger arbitrage, I’ve developed two secrets that will ensure we only go for the best opportunities, like the Genen-tech trade:
Secret No. 1: Learn to love all-cash deals. They are simple.
If the deal is announced as an all-cash deal, the financing is pretty secure. Sometimes the company already has the cash in its pocket. That makes the deal even sweeter. If a big company has $10 billion in cash, and needs just $5 billion to complete the deal, it’s a good situation. In these cases, we’ll consider taking a large position, up to 5% of a portfolio.
Secret No. 2: You only want to trade in securities that you would buy even if the deal fails. Remember: As great as the deal looks... as easy as the numbers work out... as accommodating as a govern-ment can be... crazy things like hurricanes, earthquakes, wars, and credit crunches happen.
To account for this risk and ensure maximum safely, you should only get involved in cash at closing deals if you’d be happy to own shares of the company under buyout consideration. To put this idea in real estate terms, only invest in a rental property you’d be happy to live in.
With the Genentech example, in the unlikely scenario that the deal

S&A Trader’s Manual
140Table of Contents
fell through, we would have owned one of the world’s best biotech companies at a reasonable price. I believe biotechnology is a great investment opportunity over the next three to five years. Since Ge-nentech is a leader, it was a win-win deal.
Retirement Trader Tool No. 4:Safe Money Options: How to make
a safe 50% in four months
That tool is selling put options. Before we talk about selling puts, let’s clarify terms quickly.
Buying a put option is a contract that gives you the right but not the obligation to SELL a block of stock at a predetermined price, at a predetermined point in the future.
Imagine the other side of this trade... The seller of a put option has the obligation to BUY a block of stock at a predetermined price, at a predetermined point in the future. In exchange for taking on that risk, the seller of the put gets paid a premium.
In the “advanced” cash at closing trade, we find a stock we’re willing to own and ask for a little money “up front” in exchange for being prepared to purchase the stock if the owner of the put decides to exercise the option.
For instance, let’s say you think stock ABC is worth $22 per share. The business is making plenty of money, has a lot of valuable as-sets, and zero debt. Let’s also say the current market price is $20. You’d be happy to buy ABC at that level.
But what if you could buy it for $18 per share... a 10% discount to the current market price and an 18% discount to what you think shares are actually worth?
I’d jump at the chance.
This is exactly the opportunity selling puts gives you... the chance to buy a stock you already want to own at a 10%-20% discount to current prices. Best of all, you get paid to enter into these contracts.
The market is a big place... with millions of traders and investors

TRADER’S TOOL BOX
141Table of Contents
with different opinions, needs, and goals. This is why the options market exists.
Many of these investors and traders need to spend a little bit of money to “insure” their portfolios by BUYING put options... just like you’d spend money to insure a car or a house. These contracts give the buyer of the put option contract the right to sell his stock to the seller of the put option contract.
In our example, ABC stock is trading for $20 per share. An owner of ABC might BUY a put option that gives him the right to sell his shares for $18 in six months. Even if ABC fell down to $5 per share, owning that put option contract allows the ABC owner to sell his shares for $18.
Now, here’s where profitable put SELLING comes in...
Again, we’d love to buy ABC at $18 per share. The market price is $20. We think it’s actually worth $22.
We could enter the market and sell a put contract that leaves us on the hook to buy ABC shares for $18 in six months. We receive $1 per share for agreeing to the obligation. Since one option contract controls 100 shares of stock, we receive $100 for every contract we sell. This amount of money that we collect for selling the option is called the “premium.”
By selling the contract to buy ABC, we collect $1 per share... and agree to buy 100 shares of ABC in six months for $18 per share. Should ABC trade down to $18 or less, we’d be obligated to buy $1,800 worth of stock. But remember, we received $100 ($1 per each of the 100 shares in one option) for entering into this contract... so our actual cost for the position is really $1,700. Since we think ABC is worth $22 per share, this is a great discount.
But what if the market catches on to our thesis that ABC is worth $22 during the life of the option contract we sold... and sends ABC to $22 per share?
The same thing that happens when your house doesn’t catch fire... the same thing that happens when you don’t get into a car accident.

S&A Trader’s Manual
142Table of Contents
The insurance company keeps the money. In option trading, the seller of the put option simply pockets the premium and starts looking for the next opportunity. End of story.
Now that we have an understanding of how put options work, let’s go back to our advanced cash at closing opportunities...
Around the same time I was urging Retirement Millionaire readers to make a safe 17% on the Genentech deal, an old colleague of mine, Dr. George Huang was urging people to sell put options on Genen-tech. It was one of the greatest trades I’ve ever seen.
George is a medical and biotech stock expert. He’s also a brilliant options trader. In his biotech stock and option trading advisory, the S&A FDA Report (no longer published), George told his readers to sell puts on Genentech that would obligate them to buy shares for $80. The contracts were selling for around $8 per share. Each one sold sent $800 straight into the pocket of traders.
Remember, there was an offer for the company at $89 per share that was very likely to go through. George’s readers were agreeing to buy Genentech shares for just $80... and receiving $8 per share for entering the contract. This put their actual cost basis at $72 per share if they had to buy the stock... which they were happy to do in case the deal did not go through.
As you already know, the deal went through... each contract sold for $800 was pure profit for George’s readers. (I loved the trade at the time, but we don’t deal with selling put options in my monthly Retire-ment Millionaire newsletter.)
By the way, when you sell a put option, most brokerages require a deposit – called a “margin requirement” – equal to about 20% of the purchase obligation. In other words, one contract will put you on the hook for 100 shares of Genentech at $80... for a total obligation of $8,000. George’s readers had to front about $1,600 (20% of $8,000). So... this $800 of profit was earned off a capital base of $1,600... a 50% return in under five months!
As you can see, learning this unique option tool is a fantastic way to juice returns on a conservative position. You’re agreeing for a nice

TRADER’S TOOL BOX
143Table of Contents
premium (often $300 to $800 per contract) to buy a stock you want to buy for less than what it’s worth. It’s “heads I win, tails I win more.” The critical thing to remember here is to cut risk to the bone by only entering into put contracts on stocks we know are under-valued and that we want to own in the first place.
This “put selling” strategy is something longtime Stansberry & Asso-ciates Research subscribers may recognize. It was also the corner-stone for my publisher’s Put Strategy Report, which was published from October 2008 to June 2010.
During the 2008 Wall Street crisis, Porter Stansberry and I spent hours analyzing numerous stock ideas for use in his then-new advisory. Due to the market’s incredible volatility, option premiums skyrocketed... and selling those premiums was a terrific opportunity.
In the initial months, I was the option guru he turned to for ideas on which strikes and expiration months to use in his portfolio picks. We worked diligently to use puts as a way to purchase cheap stocks even cheaper.
For example, in October 2008, we started discussing businesses that traded below book value. One interesting company to pop up during our screening was the company Annaly Capital Management (NLY). It uniquely held liquid assets 100%-backed by the U.S. gov-ernment. As a so-called “virtual back,” the company could sell all its assets and pay off its debt and have money left over to pay share-holders over and above the value of the stock.
In Annaly’s case, we had a stock worth $13. With volatility high – and premiums fat and rich – we decided to sell puts at a strike price of $10 for $1.50. This meant our cost in the stock would be $8.50 if we were in fact “put the stock” (when the owner of the put forces us to abide by our obligation to buy the stock at $10).
This was an obvious deal... to buy an asset for $8.50 at a 35% dis-count from its liquid book value of $13. Porter wrote back then: “As far as I can tell, this trade carries literally no risk at all.”
In this case we put up $2 (The 20% margin required on the NLY ex-ercise price of $10) to earn $1.50. When the options expired worth-

S&A Trader’s Manual
144Table of Contents
less in January, we had locked in a 75% return on a trade we held for just three months. It was a safe low-risk trade but with super-high returns. In Put Strategy Report, we did many more trades with that same risk-to-reward profile.
Market conditions always change, but the principles we used in 2009 remain the same: Hunt down valuable companies trading below what we think they’re worth... then apply option strategies to increase our gains, while reducing our risks.
Retirement Trader Tool No. 5:The Theta Windows
With Tool No. 5, we’re sticking with the strategy of selling safe op-tions (Tool No. 4).
Only with this tool, we’re adding a little-known secret in the options world… something I’ve nicknamed “The Theta Windows.”
Option traders use all kinds of Greek letters to label different as-pects of options trading. In any given conversation between option traders, you’re likely to hear words like “Beta” and “Delta.”
But don’t worry… I’m not going to ask you to memorize any of that stuff. I just need you to know the closer an option gets to its expiration date, the faster the “time value” of that option erodes.
Think of it this way – selling an option today obliges you to act at some point in the future. Between today and that future date, lots of “stuff” could happen to hurt the value of the stock you’re going to trade.
The price you receive for selling the option needs to compensate you for taking that risk. And the longer the time between today and when you might have to buy, the more “stuff” could happen. So the longer you hold the option, the more you should be paid. The closer the stock is the expiration, the less you get paid.
That’s time value. And the closer an option gets to its expiration date, the faster the time value of an option “decays.”

TRADER’S TOOL BOX
145Table of Contents
In options-speak, this time decay is called “theta.” And when an op-tion has less than 10 trading days of life left, the time value decays at a rapid pace… much faster than the rate at which it will decline if it has two months left of life. We’ve nicknamed this 10-day window the “Theta Window.”
I’ll use an example with put options to show you how it works…
Let’s say that with just one week to go before option expiration (op-tions expire on the third Friday of every month), Starbucks (SBUX) shares are trading for $26. Let’s also say the Starbucks 25 put is selling for $0.20.
Remember when you sell a put, you accept the obligation to buy the underlying security (SBUX) at a specific price by a specific time. In this example, selling the Starbucks 25 put gives us $20 in premium up front (recall each option contract controls 100 shares). Our only obligation is to buy the stock for $25 by the end of the week if the stock sinks that low.
In this example, we figure $26 represents a good value on Star-bucks. That makes buying shares at $25 (3.8% lower) a great opportunity. Remember… the odds are slim that Starbucks will drop a full $1. If it doesn’t, we’ll keep the $20 free and clear.
If you assume we had to pony up $500 in margin requirement (like we explained in Tool No. 4), we turned a quick 4% profit in just five days (the $20 on the $500). This speedy return is because we’re sell-ing puts with just a week or two of lifespan… we’re selling puts as the “theta” window rapidly closes.
Now the beauty of it is this… you could do this trade once a month, risking the same $500 in margin requirement each time. After 12 months, you’ve banked $240 in option premiums – 48% on your margin requirement (This “$500 trade” is just for an example… I recommend using larger position sizes so commissions don’t each up so much of the profit).
Alternately, if Starbucks shares slump $1 over those five days, we would have to buy 100 shares for a total outlay of $2,480 ($25 a share times 100 shares, minus the $20 premium). This is just fine

S&A Trader’s Manual
146Table of Contents
with us, too. After all, if Starbucks is a good buy to us at $26, buying it at $24.80 is even better. By selling a put with a strike price less than the current share price (a so-called out-of-the-money put), we got a 5% discount on a stock we wanted anyway.
Either way, it’s a win-win deal. We’re either pocketing free money or picking up good value stock at a better price.
Retirement Trader Tool No. 6: Long-term Leverage
You hear it all the time... folks getting into real estate deals because real estate offers so much “leverage”... Or marketers pitching cur-rency-trading services that will make you fabulously wealthy be-cause of the “leverage.”
Leverage works both ways. That same friend who was getting rich in real estate because of the leverage is now broke because of the leverage. That same currency trader who was making a killing in Swiss francs and Australian dollars blew his account up because of leverage.
Most people don’t know how to take on safe leverage.
One of the secrets of using stock option leverage is to combine it with value investing.
This is where long-term stock options come into play. These are known as Long-term Equity AnticiPation Securities (LEAPS). Sounds complicated, but LEAPS are simply stock option contracts that expire in one to three years. They have a much longer shelf life than typical stock options that are traded in one to six month timeframes.
Let’s say you’re bullish on Bank of America (BAC)... Here’s a hypo-thetical LEAPS trade on the stock would work out (using May 2010 prices). In May 2010, Bank of America (BAC) LEAPS with a $7.50 strike price traded for $9.60. The LEAPS are essentially long-dated call options that expire in January 2012.
If we felt the bank and the business was undervalued but we were unsure about the recession, legal issues of lawsuits from govern-ment, etc... we could buy the LEAP and hold it for nearly two years

TRADER’S TOOL BOX
147Table of Contents
with much less risk. This gave us the right, but not the obligation, to buy the stock at $7.50 before January 2012.
With the stock paying only a tiny dividend, we gave up little by holding the option instead. Add our strike ($7.50) and the premium ($9.60), and we paid $17.10 – only about 70¢ more than the stock traded for ($16.40).
Thus, we’ve cut our risk of owning the stock outright by 41%. The maximum we could lose was our premium of $9.60 versus the $16.40 we’d pay to own the stock. However we keep almost 100% of the upside potential (less the 70¢ we pay for two years of time).
If the stock goes to $30 by 2012 (BAC trading in the $50s just three years 2007) we would make $22.50 ($30 minus $7.50) off our $9.60 LEAP investment. This is 134% return versus the 83% on owning the stock outright. This is a 51% greater absolute return with a 41% reduction in absolute risk.
By the way, we could have cut our costs by selling a call option for about $0.80 stuck at $30 to further lower our costs, although it only slightly increases our payoff.
Using long-term leverage is actually one of the secrets of Warren Buffett – arguably the greatest investor to ever live. The Warren Buffett most people hear about is a just a folksy good ole boy who drinks Cherry coke and buys stock in basic businesses that gener-ate lots of cash. But the truth is, he’s the ultimate anaconda. He sits patiently, waiting for only the most obvious opportunities to strike.
Amid the 2008 Wall Street crisis, Buffett paid money to Goldman Sachs and General Electric in exchange for a package of securities. Among them were millions of long-dated options that give him the right to buy more shares within five years. These options are called warrants and are worth billions. Warrants are like LEAPS except they expire even further out in time... sometimes five or even seven years out.
Companies issue warrants to entice investors to buy their shares. I think of them as the frosting on the cake. But due to the impatience of many investors, the warrants are often sold long before they ex-pire. In many cases, few buyers are willing to hold the securities four

S&A Trader’s Manual
148Table of Contents
to five years... so they become extraordinarily cheap.
However, by looking at the value of the option in the warrant relative to the stock’s value, we occasionally uncover great value opportu-nities. Using models of price and probabilities, these securities can sometimes be purchased for half the risk of the stock, but with all the upside of the company’s future business value.

TRADER’S TOOL BOX
149Table of Contents
TOP INSIDER BUYING STRATEGIES
By Stansberry & Associates Investment Research
Corporate insiders know information the public doesn’t. They’re the members of a company’s executive management team, directors, and holders of more than 5% of a company’s stock. And because they’re at the center of the action, when they buy or sell, they have just three days to notify the Securities and Exchange Commission (the “SEC”). Then it becomes public information.
Not all of the signals matter, though. And there are so many filings – so many signals – it’s difficult to identify the ones that do. Yet, when you’re looking to buy a stock, the insiders can help lead to fantastic investments. So when it comes to looking at insider transactions, here’s what you need to know...
Almost always, you may disregard insider selling by individuals. Selling is only really significant when a group of insiders is selling. There are exceptions, of course, but the reality is insiders sell for a lot of reasons, most of them personal: the CEO wants a new yacht, a board member is planning for taxes, a 5% owner needs to raise cash for a divorce... the list goes on. With insider selling, it’s almost impossible to know. When one person is selling, it doesn’t matter. However, if you see group selling, and you’re looking for shares to buy, take it as a signal to move on.
With insider buying, on the other hand, it pays to take notice. If you do and you answer the following four key questions, you’ll have a good idea what the buying means. You’ll know if you have found a really strong stock. (The information needed to answer all of these ques-tions can be found on Yahoo Finance under the “Insider” section.)
The first key question is, “How was the purchase made?” What you want to see is an “Open Market Purchase.” This means the insider bought the shares on a regular stock exchange with his own money just like us. Otherwise, the purchase involved a private transaction, options, restricted stock compensation or some other means. The price paid doesn’t have the same significance as that paid in the market.

S&A Trader’s Manual
150Table of Contents
The second key question is, “How much did the insider spend?” The more money spent, the more compelling the buy, of course. How-ever, keep in mind the market cap of the company where the insider is buying. A $500,000 buy at a company with a market cap of $500 million is much more significant than a $500,000 buy at a company with a $5 billion market cap.
The third key question is, “Who did the buying?” Chief Financial Officer and Chief Operating Officer buys carry a lot of weight. These guys know the finances and operations of businesses the best and, if they are buying, it’s a good sign the future is promising. Chief Executive Officer buys are also important. It’s just useful to keep in mind these guys are typically the highest paid on the executive team and responsible for promoting the business. So for CEOs, buying $10,000 or so worth of stock can be all in a day’s work.
For directors and 5% holders, the significance of the buy varies. Some are important. When any director buys $500,000 worth of stock, it’s worth researching. Some are irrelevant. For example, some companies require directors to purchase stock with a portion of their director’s compensation. In this case, the insider is not really choosing to buy shares with their own money. Getting to the bottom of director and 5% holder buys requires a little extra digging.
The fourth key question is, “When did the insider buy?” The answer to this question can be the most telling... Take the example at the beginning. In that case, if the announcement was going to be bad news, why would the insider buy? He wouldn’t. He’d buy afterwards, when the stock is likely trading at a lower price. And if he buys a lot of stock afterwards? That would be a strong positive signal. The insider’s buy says the market probably took the bad news too hard.
“How, how much, who, and when?” When it comes to insider buy-ing, these are the four simple, key questions to ask to find that one sensational signal that could make you a fortune.

TRADER’S TOOL BOX
151Table of Contents
THIS IS ONE OF THE BEST INSIDERBUYING INDICATORS IN THE WORLD
By Stansberry & Associates Investment Research
When I sift through insider buying information, there’s one type that really grabs my attention...
It’s when the chief financial officer (CFO) of a company is a large and regular buyer of his company’s stock.
Why is this sort of buying so significant? It’s simple. The CFO lives, eats, and breathes his company’s finances. He knows the strength of his company’s balance sheet. He knows how healthy his company’s cash flow is. He knows what his company’s future projections are.
Making sure the company has the money it needs to execute its business plan is his responsibility. It’s the CFO’s job to look at the numbers every day and understand exactly what’s happening.
That’s why few insiders at a public company understand its stock price better than the CFO. He, more than anyone else, can always tell if shares are cheap... if they are a screaming buy.
Of course, the CFO isn’t always able to buy when shares are cheap.
For one thing, a company typically pays the CFO barely 60% of what it pays the CEO. In 2008, the average CEO pay was $346,000... The average CFO pay was $214,000. For the CFO, investing a chunk of his personal money in the company’s stock can be a stretch. At the right time, he just might not have it.
And a CFO isn’t usually the type to put all of his eggs in one bas-ket. He’s often the conservative accountant type. He’s not going to concentrate his risk. Investment diversification is almost part of his genetic code.
Usually, only a very special situation will convince a CFO to invest his savings in the same company he’s already investing most of his life. And that special situation is when shares are cheap and carry little risk.

S&A Trader’s Manual
152Table of Contents
Ask yourself: Would the CFO – the guy who knows more about his company’s finances than anyone else – buy his company’s stock if he thought (1) he was overpaying, (2) he might lose his money, or most of all, (3) he wouldn’t get a fantastic return on his investment? It’s highly unlikely.
So when the CFO buys, it pays to take notice. And when a CFO buys regularly, I really stop and investigate.
There’s a lot of “secrets” marketed in the financial advisory busi-ness. Many of them aren’t secrets at all. Many of them won’t help you get an edge in the market.
But watching for big CFO buys is one of the great strategies I’ve found in my career. They don’t come around often. But when they do, it’s a sign you have a low-risk, high-reward trade on your hands.

TRADER’S TOOL BOX
153Table of Contents
AN INCREDIBLY POWERFUL TRADING TOOLYOU’VE NEVER HEARD OF
By Stansberry & Associates Investment Research
After you read this, you’ll never look at “support” levels quite the same way again.
Stock market technicians – guys who trade on the action of stock prices alone – talk about price support levels all of the time. It’s a simple concept, really... “Support” is the price at which a lot of peo-ple are willing to buy something.
If you’ve ever watched an auction, you’ve seen the best example of price support...
Imagine an auctioneer is selling a used Mercedes. He starts bidding at $40,000. No takers... $30,000? No takers... $20,000? Still no tak-ers. Finally, he gets to $10,000... The bidders shout and raise their numbers. He takes the first he sees and starts raising the price from there...
That $10,000, that’s the support. It’s the price where buyers are will-ing to buy... If a second, identical Mercedes were to come down the line, buyers would show up at $10,000 on that one, too.
Stock market technicians see it work the same way with stocks... Once a price falls to a certain level, buyers start to raise their hands. That means the next time it falls to that level, buyers will again raise their hands and buy.
If the buyers keep buying, the price moves back higher. Knowing this is how it often works, technicians like to buy at support. Once you know what to look for, you can see why they talk about it so much...
Take a look at this chart of this three-month snapshot of VeriFone.

S&A Trader’s Manual
154Table of Contents
See what happens when the price approaches $13.30? Every time the price hits $13.30, back up it goes.
In this case, $13.30 is to VeriFone shares what $10,000 is to our used Mercedes. At $13.30, buyers start raising their hands.
However, every now and then, a support level breaks and the tech-nical trader gets hammered... Look at what happened to the guys trading Citigroup support levels at the beginning of December.

TRADER’S TOOL BOX
155Table of Contents
They had it handed to them. The $4.05 level worked for a while – long enough to suck them in – and then... WHAM! Where’s support now? It’s anyone’s guess...
Insider support signals work so well because they’re a combination of a technical signal with a fundamental one.
The technical signal comes from seeing where the market is buying for a price it has in the past. The fundamental signal comes from seeing the price is also one where insiders have bought in the past – almost surely because they saw the stock as fundamentally cheap for that price.
Most traders are familiar with the idea of support. But as I showed you, that can hammer you without warning. It doesn’t happen all the time, but waiting for insiders to jump in at support will give you a signal worth the wait.

S&A Trader’s Manual
156Table of Contents
ADVANCED CHART-READING COURSE
By Jeff Clarkeditor, Advanced Income
There’s no such thing as a foolproof trading system.
Of course, we’ve all seen the advertisements for stock-trading soft-ware that promises to help you “trade like the pros.” We’ve all been tempted by the seminar salesmen who promise to teach you the single best method for picking stocks. And we’ve all been seduced by the day-trading experts who claim their method is the true road to riches.
None of that stuff works.
Intuitively, we know that. But we so want to believe that there is a Holy Grail for stock trading that we’re willing to try just about any-thing to find it.
The fact is that markets are dynamic. Markets change.
Strategies and analysis that work one day fail the next. Programs that performed flawlessly for months turn cold overnight. That is the nature of markets.
And that is why technical analysis is more of an art than a science.
If technical analysis was a science, then it would indeed be possible to create a computer program to trade stocks based on chart pat-terns. Just tell the computer to look for certain chart patterns, buy or sell the stocks that fall into those patterns, and let the money roll in.
If it were possible to create such a trading program, I have no doubt that all of the money and brain power in Silicon Valley would have found a way to do so.
But no such program exists, so I have to fall back on my “technical analysis is an art” theory.
And just as with many other art forms, such as music, painting, or sculpture, the actual piece of art is subject to many interpretations. Indeed, where some analysts may see a bullish chart pattern, others read it as bearish.

TRADER’S TOOL BOX
157Table of Contents
It All Depends on How You Draw the Lines
I once showed the following chart to the folks participating in a trading seminar...
I suggested that this was a bearish pattern and that BHI was likely to break to the downside.
After the seminar, one of the participants approached me with a reasonable question.
“What if I draw the lines like this?” he asked and showed me this chart...

S&A Trader’s Manual
158Table of Contents
“Doesn’t that make it look bullish?”
I agreed, and I told him that is what creates differences of opinion among technical analysts. It all depends on where you draw the lines.
His next question was obvious: “How do you know where to draw the lines?”
I was stumped. I really didn’t know how to respond except to say that it was kind of like defining art. I can’t tell you exactly what makes good art, but I know what I like. Similarly, I can’t explain why I draw the lines the way I do, but I know how they’re supposed to look.
Here’s what eventually happened to BHI...
I’ve been looking at charts for more than 20 years. In fact, every Sat-urday morning I go through the exact same routine... Get up insane-ly early. Prepare an insanely large pot of coffee. Review an insane number of stock charts. Take note of the charts that look similar and watch how those stocks perform over the following week. Repeat.
It’s a laborious process. But it’s the best way I know to generate successful trading ideas. When multiple stock patterns unfold in a similar manner, then the odds are quite good that future stocks that exhibit the same pattern will unfold in the same manner.

TRADER’S TOOL BOX
159Table of Contents
The trick of it is that the patterns that work today didn’t work last month. And the patterns that will work next month aren’t the same as what works today.
Like I said before – markets are dynamic. To trade successfully, you need to be able to roll with what’s working now and then drop it the instant it stops working.
The Bullish Falling Wedge
This is an absolutely horrendous looking chart...
Nobody in his right mind wants to own a stock while it’s in this trad-ing pattern. Most people probably view this chart as bearish.
But it’s not. In fact, it is terrifically bullish.
When a stock breaks out of a “bullish falling-wedge” pattern it often results in extremely large percentage gains in a very short time period.
Look at what happened to Ford (NYSE: F)...

S&A Trader’s Manual
160Table of Contents
Here’s another example...
The Bearish Rising Wedge
The “bearish rising-wedge” pattern is the exact opposite of the bullish falling wedge. It looks like a bullish pattern, but it really is potentially very, very bearish. For example, take a look at this chart of Merrill Lynch (NYSE: MER) from 2006...

TRADER’S TOOL BOX
161Table of Contents
And you can see what happened once MER broke the wedge to the downside...
Another good example of this pattern is the following chart of oil which led to another S&A Short Report recommendation to sell short shares of U.S. Oil Fund (AMEX: USO).

S&A Trader’s Manual
162Table of Contents
The Horizontal Triangle
The horizontal triangle is neither bullish nor bearish until the stock finally breaks, one way or another, out of the triangle. Once it breaks, the move can be spectacular.
Look at what happened to Abbott Laboratories (NYSE: ABT)...
We were fortunate enough to buy ABT call options just before it broke the horizontal triangle to the upside.

TRADER’S TOOL BOX
163Table of Contents
Here’s a look at what happens when the triangle breaks to the downside...
These are just a few examples of the technical patterns that are working right now. Many of the trades I recommend fall into these patterns.
This isn’t a foolproof trading system. And it’s not the Holy Grail of trading.
It’s an art.
The Chart Pattern I Trust Above All Others
There are dozens, perhaps even hundreds, of technical chart pat-terns. Most of them don’t make much sense.
The majority are nothing more than subjective lines drawn on a chart. Their track record at forecasting future price movements is no better than flipping a coin.
There is, however, one chart pattern I place a great deal of faith in. It’s a terrific signal for when a trend is about to come to an end and reverse. The pattern is called a “wedge,” and it is my favorite technical formation.

S&A Trader’s Manual
164Table of Contents
A wedge forms when a stock makes an extended move higher or lower, and when the distance between the highs and lows gets compressed. Whenever a stock or an index breaks out of these patterns, the ensuing move is often quick and large.
The psychology driving the wedge has something to do with the anxiety created as a trend gets extended. Folks who were early to catch the trend are nervously trying to protect profits. Latecom-ers – who need to jump on board or risk being left out of all the cocktail-party conversations – are worried about being the “greater fool.” So when the wedge breaks, and it looks like the trend has shifted, everyone rushes to get out. Action in the dollar in 2009 is a perfect example...
This is an example of a falling-wedge pattern. The chart is in an extended decline. And you can see how the distance between the high and low points since May has continued to narrow. The wedge eventually comes to a point, and the chart has to break out of the pattern one way or another.

TRADER’S TOOL BOX
165Table of Contents
The best indicator to use to determine the direction of the break is the moving average convergence-divergence (MACD) indicator – which is displayed on the bottom chart.
The MACD helps determine the strength of a trend. If a stock is falling and the MACD is falling as well, the downtrend is strong and likely to continue. In the above dollar index chart, however, the MACD is actually moving higher while the dollar is falling. This “pos-itive divergence” suggests the momentum behind the downtrend is weakening and the chart is likely to break out to the upside.
And that is exactly what happened...
Now let’s take a look at a 2009 chart of the S&P 500...
[Chart on following page]

S&A Trader’s Manual
166Table of Contents
This is an example of a rising-wedge pattern, where the chart is in an extended uptrend. Notice how the index is moving up while the MACD is declining. This “negative divergence” is a warning sign the momentum behind the trend is weakening and traders should be on the lookout for a reversal.
There is still some room inside the wedge pattern for the S&P to continue higher. But the chart is nearing an apex. And if the neg-ative divergence continues, the next big move will likely be to the downside.

TRADER’S TOOL BOX
167Table of Contents
TIME THE MARKET... ANY MARKET
By Jeff Clarkeditor, Advanced Income
In this essay, I’ll show you an indicator you can use to play one of the biggest developments in the financial markets: the explosion in the number of exchange-traded funds (ETFs).
Traders can now gain full exposure to any sector by purchasing (or short selling) just one ETF. There are bullish ETFs, which appreciate as stocks in the sector move higher. There are bearish ETFs, which rally when the sector falls. There are even double- and triple-leveraged ETFs, which are two and three times more volatile than the sector itself.
You can use these ETFs to make profitable trades every few weeks, as long as you can accurately peg the right time to buy and sell.
Bullish percent indexes (BPIs) can help you do this.
A BPI charts the percentage of stocks in a sector trading in bullish formations. It ranges from zero to 100. Typically, anything more than 80 is overbought and anything less than 30 is oversold.
So you can use a BPI to find extreme optimism or pessimism in stocks and anticipate a possible reversal.
For example, here’s the BPI for the energy sector (BPENER) from 2009...

S&A Trader’s Manual
168Table of Contents
Buy signals occur when the BPENER reaches oversold levels (below 30) and then turns up. Sell signals happen when the BPENER rises above 80 and then turns lower. The green circles on the chart show the buy signals. The red circles are the sell signals.
Here’s how the signals line up with the ProShares Ultra Oil & Gas ex-change traded fund (DIG)...
As you can see, the buy signals all preceded immediate moves higher. The sell signals were followed by quick declines.
BPI signals typically last anywhere from a few weeks to a few months. So you’ll have several trading opportunities over the course of a year. And with so many sector ETFs to choose from, you could be making new trades almost every week.
I check my favorite BPIs at www.StockCharts.com, which covers about 21 sectors. (Just search for “bullish percent index” in the symbol box.)

Appendix A

S&A Trader’s Manual
170Table of Contents
APPENDIX A – THE FIVE BOOKS THAT CAN MAKE YOU A MILLIONAIRE TRADER
By Brian HuntEditor in Chief, Stansberry & Associates
If you’re serious about making stock speculation a profitable and enriching area of your life, we suggest frequently reading the five books listed below.
You can chuck all other trading books in the garbage and simply read these books over and over. Take a highlighter and mark the passages that mean the most to you.
There’s no reason why you can’t become a millionaire trader if you have the lessons in these books down pat.
Market Wizards
This is the Tiger Woods of trading books. It’s entertaining, inspiring, and so full of timeless trading advice that it’s on its own level.
In the late 1980s, trader and author Jack Schwager interviewed 16 of the world’s best stock, options, and futures traders. Market Wizards offers the best insights and comments those interviews produced.
The key things to take away from the book:
• “Playing defense” by using intelligent position sizing and cutting losses is the single most important factor in your trading success.
• It really is possible to master the markets and use them to enrich yourself financially and emotionally.
Trade Your Way to Financial Freedom
If Market Wizards gives you driving lessons, the road map, and the desire for a fantastic journey, Van Tharp’s Trade Your Way to Finan-cial Freedom gives you the blueprint for building cars.
Trade Your Way is the most comprehensive “how to” book for cre-ating intelligent strategies for trading the market. Van Tharp is a psychologist and trader who has devoted his career to working with

APPENDIX A
171Table of Contents
successful traders, modeling them, and helping others succeed. This book is packed with valuable information on entry plans, exit plans, position-sizing plans, and trading psychology.
The key things to take away from the book:
• Determining how and when to exit a position is FAR more im-portant to your trading strategy than determining how and when to enter a position.
• Specific plans and details that will help you form a trading strate-gy. Again, Market Wizards is the inspiration and the old-school knowledge, Trade Your Way gives you a basket of nuts and bolts to start building.
Reminiscences of a Stock Operator
And if Market Wizards is the Tiger Woods of trading books, Edwin Lefèvre’s Reminiscences of a Stock Operator is the Jack Nicklaus... the “old school” champion.
Reminiscences is a fictionalized version of legendary speculator Jesse Livermore’s early trading years at the start of the 20th centu-ry. Beginning from scratch, Livermore traded his way to one of the world’s largest fortunes. This book is chock full of his stories and trading wisdom that will be relevant a thousand years from now. (Not mentioned in the book is how hard trading can be on the psyche. Livermore blew his brains out in 1940 after a trading blowup.)
The key things to take away from the book:
• The big money is made by staying in the big trends.
• Always cut your losers and ride your winners.
Trader Vic: Methods of a Wall Street Master
Vic Sperandeo is one of the few traders who deserve the “legend” label.
He’s a walking encyclopedia of market information and history. He uses his extensive knowledge of history, psychology, and market patterns to string together a phenomenal 10-year stretch of annual-

S&A Trader’s Manual
172Table of Contents
ized 70% gains that started in the late ‘70s. Methods of a Wall Street Master is Vic’s knowledge condensed into less than 300 pages.
The key things to take away from the book:
• Vic’s deep understanding of trends... and his simple system to determine when trend changes are about to occur.
• Vic’s 19 rules of trading (in chapter 12) are worth 100 times the price of the book.
Winning on Wall Street
Marty Zweig is one of the greatest analysts and traders who ever looked at a stock quote. To put his success in material terms, Zweig bought a New York penthouse apartment in 1999 for $21.5 million. The place cost an astounding $40,000 a month in maintenance fees. This guy knows how to move money from the market’s ac-count to his.
Winning on Wall Street details Zweig’s approach to market value, trends, and how to play the government’s policies for maximum gains.
The key things to take away from the book:
• Don’t fight the tape. Don’t fight market trends.
• Don’t fight the Fed. If the government is pursuing tight credit, high interest-rate policies, trade accordingly. If the government is pursing easy credit, low interest-rate policies, trade accordingly.
Editor’s notes:
• You can buy all of these books in used condition for less than $50 on Amazon. It’s the best deal we’ve ever seen in trading education.
• The New Market Wizards is the sequel to Market Wizards. It’s a classic as well.
• If you’ve got these five books down pat and you’re starving for more, here are five additional trading classics:

APPENDIX A
173Table of Contents
The Complete TurtleTrader by Michael Covel
Investment Biker by Jim Rogers
Pit Bull by Marty Schwartz
How to Make Money in Stocks by Bill O’Neil
Fooled by Randomness by Nassim Taleb

Appendix B

APPENDIX B
175Table of Contents
APPENDIX B – HOW TO BUY SECURITIES ANDSET UP YOUR OPTION ACCOUNT
By Dr. David Eifrig Jr., MD, MBAeditor, Retirement Millionaire
When it comes to buying securities, you essentially have two ways to do it. You can use either a full-service broker or a discount broker.
A full-service broker is one who interacts with you, mostly over the phone, and gives buy and sell recommendations for your portfolio. Often, the recommendations come from a centralized “strategist” or weekly investment meeting. Examples include Merrill Lynch, Wells Fargo, and Edward Jones.
Decades ago, almost every broker was full-service, and costs were enormous to buy and sell securities. Today, they are still relatively expensive – commissions on 100 shares can run $25-$35.
Full-service brokers can be useful if you need a lot of handholding. The problem is brokers who take care of everything for you also charge fees and commissions that add up to as much as 1%-2% of your assets every year.
That’s why I generally do not recommend (nor do I use) full-service brokers. On top of the costs, many brokers lack critical experience trading securities.
I prefer to use discount brokers. These brokers normally don’t talk with you on the phone unless absolutely necessary (and then they charge more). In fact, you interact mainly with their websites. In ex-change for less human contact and no idea-generation, they lower your transaction costs considerably.
Most of them offer access to a vast array of markets and securities worldwide. Their services are reasonably easy to use, including ed-ucation and research materials. Moreover, the fees and charges are small, which means more money for you.
Below we’ve listed seven online discount brokers that we’ve ordered from left to right using information from Barron’s (my favorite weekly

S&A Trader’s Manual
176Table of Contents
business newspaper). Every year, Barron’s ranks the top online bro-kers, but not all of the firms are suitable for our recommendations. So I’ve created my own rankings to help you find an appropriate broker.
When you look at the tables below, you’ll see several rows broken out with categories I use to evaluate the brokerages. You’ll need to decide which of these factors is more important to you. But the good news is that all seven of these brokers do the job just fine. They all execute well, offer good prices, and provide reasonable amounts of research.
When you signed up for our service, I agreed to do the hard home-work and research for you so that you didn’t need to spend too much time researching investment ideas. If I can generate good ideas for you, then the key is to get good execution and inexpensive charges for those transactions... and that’s what all seven of these discount brokers can do.
Before we go through the listing, let me explain the categories I used to evaluate them:
Minimum Annual Income: Only Interactive Brokers and TradeKing require a minimum income. However, they make case-by-case exceptions based on your experience and the assets you’ll deposit with them. The other brokers don’t require any income level to get started.
Minimum Account Equity: This is how much money you need to put up against your positions. The firms want to be sure that you can afford the risk you’re taking. Again, two brokers stick out. Fidelity and TradeKing require $20,000 and $25,000, respectively. The others require much smaller amounts, usually a percentage of the capital at risk. For example, if you wanted to sell a naked put with a $30 strike price, TD Ameritrade or Interactive Brokers require you put up at least 20% of the $3,000 ($30 strike times 100 shares) at risk – $600.
Option Level: This is related to your experience, the varying degree of risk carried by different options trades, and the firm’s desire to limit people from losing everything in riskier trades. Imag-ine a novice trader selling the total value of all his assets using (or

APPENDIX B
177Table of Contents
misusing) sophisticated option strategy that wipes him out in a few hours. It’s bad for business, so brokerages create levels as a way of controlling the process.
By limiting the access to advanced trading strategies, the bro-kerages better maintain their risk to losses as well. Once you show your ability to handle certain trades and transactions, the brokerage raises your level. In the chart, I’ve listed that firm’s level required for doing naked puts. At a minimum, you’ll need to get approval level to do covered call options – in most firms that’s Level 2 or 3.
You should know that we don’t have any financial relationship with any of these brokers. Although I like TD and Fidelity, I’ve heard won-derful things about IB and TradeKing. We’ve included the websites and phone numbers for you to get started with any of them.
The charts below are listed according to my rankings in order of left (No. 1) to right (No. 7). You can use this chart as a basis for find-ing the broker that’s right for you. You may not meet the minimum annual income for a specific broker, or you may want a broker that’s more willing to walk you through trades. But use this list as your starting point.
TD Ameritrade Interactive Brokers
OptionsXpress Fidelity Investments
S&A Research Ranking #1 #2 Tied #3 Tied #3
Minimum Annual Income None $100,000 None None
MinimumAccount Equity
20% of underlying stock
20% of underlying stock $2,000 $20,000
Option Experience None needed 2 years None needed None needed
Option Level 3 5 4 4
Fees
Internet trades - $9.99 + $0.75
per contract Options assign-ments - $19.99
commission
$1.00 minimum per contract
35+ Trades/Quarter -
$12.95 for one contract 0-34 Trades/Quar-
ter - $14.95 for one contract
$7.95 + $0.75 per contract
Phone 800-454-9272 877-442-2757 888-280-8020 800-343-3548

S&A Trader’s Manual
178Table of Contents
TradeKing E*TRADESecurities
Charles Schwab
S&A Research Ranking #5 #6 #7
Minimum Annual Income $50,000 None None
MinimumAccount Equity $25,000 $2,000
100% of cost of trade or minimum
$5,000
Option Experience 2 Years None needed None needed
Option Level 4 3 3
Fees $4.95 per trade + $0.65 per contract
$9.99 + $0.75 per contract Options Exercise - $19.99
Internet trades - $8.95 + $0.75 per contract Options
assignments - $8.95 commission
Phone 877-495-5464 800-387-2331 866-232-9890
Personally, I’ve used Fidelity, TD Ameritrade, and Schwab. Plus I’ve seen Interactive Brokers in action, and it’s easily the least expensive broker from a transaction and cost point of view.
In 2009, TD Ameritrade acquired a company called thinkorswim. Barron’s rated thinkorswim the No. 1 broker for the past several years. That acquisition and the ease of using its website makes TD Ameritrade my favorite online broker.
Again, do not consider anything in this note a recommendation for any one firm. This is simply a list of brokerages that receive excellent ratings for customer service... plus a few I have personally used and had good experiences with. You’ll have to choose a brokerage that suits your needs.
Disclaimer: This document was originally produced in Spring 2011. It has been updated, however, prices and conditions may or may not have changed. We encourage you to do your own due diligence before placing money with a broker.

APPENDIX B
179Table of Contents
© 2014 Stansberry & Associates. All rights reserved. Any reproduction, copying, or
redistribution, in whole or in part, is prohibited without written permission from Stans-
berry & Associates, 1217 Saint Paul Street, Baltimore, MD 21202 or www.stansber-
ryresearch.com.
We welcome comments or suggestions at [email protected]. This
address is for feedback only, and you will not receive a reply. To speak with customer
service, e-mail [email protected] or call 888-261-2693 (U.S.)
or 443-353-4359 (international) Monday-Friday, 9 a.m. - 8 p.m. Eastern time. Please
note: The law prohibits us from giving personalized financial advice.
Stansberry & Associates forbids its writers from having a financial interest in any
security they recommend. All employees of Stansberry & Associates (and affiliated
companies) must wait 24 hours after a recommendation is published online or 72
hours after a direct mail publication is sent before acting on that recommendation.
Stansberry & Associates doesn’t recommend or endorse any brokers, dealers, or
advisors. Any brokers mentioned constitute a partial list of available brokers and is for
your information only.
This work is based on SEC filings, current events, interviews, corporate press releas-
es, and what we’ve learned as financial journalists. It may contain errors, and you
shouldn’t make any financial decision based solely on what you read here. It’s your
money and your responsibility.


