1 “Places with tradi- tional land use regulations—mostly in the Northeast and Midwest—have lower densities and fewer housing opportunities for lower income resi- dents than those that have embraced a new paradigm for regulating growth and development.” Metropolitan Policy Program The Brookings Institution I. Introduction A key component of the struggle for prosperity in American metropolitan areas is devel- opment patterns, which define everything from density to the socioeconomic make up of residents. Development patterns are partly a consequence of decisions by local gov- ernments—often with very little coordination, oversight, or even guidance from state or regional entities—about the physical character of new growth. Among the most important of these decisions is how to regulate land; a prerogative that local governments guard jealously. Land use regulations contribute to many metropolitan problems. Economists attribute high housing costs in part to regulations that restrict supply and increase the quality of housing and neighborhoods, especially on the nation’s coasts. Advocates for low-income families blame cer- tain types of zoning for the lack of housing opportunities in suburban areas. Environmental advocates contend that low density zoning exacerbates urban sprawl and thereby aggravates habitat loss and the degradation of air and water quality. And planners have found that some land use regulations displace development, leading to excessive land consumption and increased driving times. Yet land use regulations related to housing also hold out the promise of benefits. Indeed, Local land use regulations help define the character of cities, towns, counties, and entire regions. Zoning, comprehensive plans, infrastructure control, urban containment, build- ing moratoriums, and permit caps can drive development outward, promote density, or something in between. They can also directly affect the composition of inhabitants by facilitating rental properties and low-income residents, especially when these regulations are coupled with programs to promote housing affordability. This comprehensive survey of local land use regulations finds a wide variety of regulatory regimes, classifying them in four broad typologies, across the nation’s 50 largest metropolitan areas. They range from exclusionary and restrictive to innovative and accommodating. These produce a variety of effects on metropolitan growth and density, and on the opportunities afforded to the resi- dents that live there. From Traditional to Reformed: A Review of the Land Use Regulations in the Nation’s 50 largest Metropolitan Areas Rolf Pendall, Robert Puentes, and Jonathan Martin 1 AUGUST 2006 • THE BROOKINGS I NSTITUTION • RESEARCH BRIEF
Transcript
1
“Places with tradi-
tional land use
regulations—mostly
in the Northeast and
Midwest—have
lower densities and
fewer housing
opportunities for
lower income resi-
dents than those
that have embraced
a new paradigm for
regulating growth
and development.”
M e t r o p o l i t a n P o l i c y P r o g r a m
The Brookings Institution
I. Introduction
Akey component of the struggle for prosperity in American metropolitan areas is devel-opment patterns, which define everything from density to the socioeconomic make upof residents. Development patterns are partly a consequence of decisions by local gov-ernments—often with very little coordination, oversight, or even guidance from state
or regional entities—about the physical character of new growth. Among the most important ofthese decisions is how to regulate land; a prerogative that local governments guard jealously.
Land use regulations contribute to many metropolitan problems. Economists attribute highhousing costs in part to regulations that restrict supply and increase the quality of housing andneighborhoods, especially on the nation’s coasts. Advocates for low-income families blame cer-tain types of zoning for the lack of housing opportunities in suburban areas. Environmentaladvocates contend that low density zoning exacerbates urban sprawl and thereby aggravateshabitat loss and the degradation of air and water quality. And planners have found that someland use regulations displace development, leading to excessive land consumption andincreased driving times.
Yet land use regulations related to housing also hold out the promise of benefits. Indeed,
Local land use regulations help define the character of cities, towns, counties, and entireregions. Zoning, comprehensive plans, infrastructure control, urban containment, build-ing moratoriums, and permit caps can drive development outward, promote density, orsomething in between. They can also directly affect the composition of inhabitants byfacilitating rental properties and low-income residents, especially when these regulationsare coupled with programs to promote housing affordability. This comprehensive surveyof local land use regulations finds a wide variety of regulatory regimes, classifying them infour broad typologies, across the nation’s 50 largest metropolitan areas. They range fromexclusionary and restrictive to innovative and accommodating. These produce a variety ofeffects on metropolitan growth and density, and on the opportunities afforded to the resi-dents that live there.
From Traditional toReformed: A Review of the Land Use Regulations in the Nation’s 50 largest Metropolitan AreasRolf Pendall, Robert Puentes, and Jonathan Martin1
AUGUST 2006 • THE BROOKINGS INSTITUTION • RESEARCH BRIEF
their origin is rooted in that very promise. In theory, they can offer an efficient mechanism bothto limit exposure to “externalities,” that is, negative effects of development on neighboring prop-erties, and to reduce those externalities in the first place. To the jurisdictions that use them, ofcourse, regulations allow residents to reduce competition for public services, balance thebudget, and protect valued open space, thereby raising property values and wealth for propertyowners. Land use regulations can also promote beneficial development patterns that would notappear in their absence, shaping land markets to encourage high densities, mixed uses, andtransit oriented developments that the market currently fails to provide in sufficient quantities.
However, despite their fundamental importance, too little is known about the current land-scape of housing regulation in the United States.
The absence of a detailed national database on land use regulations has made it difficult tobegin a comprehensive look at their costs and benefits. The headlines and popular attentiontend to concentrate on non-regulatory programs—bond issues and land trusts—to secure openspace. Academic inquiry is focused on a few tools, such as urban containment, impact fees, andbuilding permit caps. Research in general has been hindered by a lack of systematic data thatpermit a comprehensive assessment of regulation on the ground.
For a more comprehensive view of the conditions under which most housing is now built inthe United States, we surveyed local governments in the 50 largest metropolitan areas to learnhow they regulate land use and promote housing affordability. Over 160 million residents—57percent of the population in the United States—live in these 50 metropolitan areas, and theyaccount for about 300,000 square miles of land.
This study reports on the results of the survey (conducted in 2003) in which over 1,800cities, townships, and counties responded to questions about land use regulations that affecthousing. Their responses allow us to reach conclusions about the nature of land use regulationat the metropolitan level, where local land use regulations combine to produce sometimes unex-pected regional results.
In short, this research finds that basic land use regulations like zoning and comprehensiveplanning continue to be employed in metropolitan jurisdictions all across the nation. Othertools associated with land use reforms——such as growth management and infrastructure regu-lation——are still uncommon. However, this picture varies considerably throughout the nation.Metropolitan areas in the Northeast and Midwest tend to use regulations to exclude most typesof growth, while those in the West employ regulations that accommodate and manage growth.Possibly as a result, places with traditional land use regulations have lower densities and fewerhousing opportunities for low income and minority residents than those that have embraced anew paradigm for regulating growth and development.
II. Background
Aside from the broad Constitutional parameters of the Takings Clause, land use regu-lation in the United States is a decidedly local affair. Because the U.S. Constitutionsays little about land use—or local governments, for that matter—the issue remainsin the hands of state constitutions, legislatures, and courts. State governments, in
turn, have historically delegated decisions about land use to local governments—cities, villages,townships, counties—and have only recently and incompletely begun to embrace the coordina-tion of local plans with one another and with state or regional goals. And even though there is asurprisingly standard template for suburban land use planning, very surely there are multiplelocal approaches.
This section discusses the evolution of land use regulation in the U.S. and briefly summarizesthe research on the impacts of these regulations.
A. Basic government regulation: Zoning and planningThe most common form of local land use regulation in this nation is zoning. Simply put, zoningentails separating the land in a particular area into sections, or zones, with different rules gov-
2 AUGUST 2006 • THE BROOKINGS INSTITUTION • RESEARCH BRIEF
erning the activities on that land. American voters, land developers, and Realtors have long sup-ported zoning for its ability to stabilize property values and protect single-family homes. Butwhile there is a perception that these regulations maximize home values, they can also impose arange of social costs such as exclusion of low- and moderate-income residents, traffic conges-tion, and metropolitan decentralization. These costs are often not recognized.2
The earliest use of zoning-like controls responded to concerns over public health. Land userestrictions had been practiced as early as the late 1800s as a means of confining “nuisance”uses to certain areas of a city. But very early on, zoning also emerged as a mechanism to sepa-rate people by race. And although the U.S. Supreme Court ruled racial zoning unconstitutionalin 1917, municipalities continued to adopt and enforce racial zoning ordinances for years after-ward.3 Zoning has been much more durable as a tool to separate people by class, especially bycontrolling the location of multi-family housing.4
Since 1926 the Court has consistently upheld zoning and other land use controls not only fortheir ability to prevent nuisances but also because they are rationally related to public health,safety and welfare.5 Zoning has been Americans’ favored land use control ever since. In somecases, zoning has evolved away from its early 20th century roots as a rigid system that separatesuses and focuses on single lots, toward a more flexible system allowing discretion, mixing ofuses, and a focus on larger land areas.
Comprehensive planning, on the other hand, has historically received much less enthusiasticsupport than zoning. A comprehensive plan is largely a policy statement of the future land useand development goals of a particular jurisdiction. Also known as a master plan or general landuse plan, it serves primarily to mitigate conflicts between different land uses. But it also func-tions to coordinate such related issues as transportation, economic development, housing,parks, and recreation.
Local governments began to adopt comprehensive plans at a rapid rate after Congress passedthe Housing Act of 1954. That law required local governments to adopt a long range generalplan before they could qualify for urban renewal, housing, and other grants. In fact, many com-munities adopted their first comprehensive plan as a result of the Housing Act.6 In many states,planning requirements differ little from those in effect when the 1956 law passed; as a conse-quence, many local plans still in use today look a lot like those first plans.
Starting in the late 1960s, however, some state governments began requiring local govern-ments to plan. California required local governments to adopt general plans starting in 1971,and soon thereafter required them to bring their zoning ordinances into conformity with theirplans. In 1973, Oregon adopted state-wide growth management legislation requiring local governments to adopt comprehensive plans that were consistent with a series of state goals.Florida adopted a comprehensive program of “critical area” protection review, also requiringlocal governments to plan for the first time.
In the mid- to late 1980s, another wave of states—Washington, New Jersey, Vermont, RhodeIsland, Georgia, and Maine—passed legislation requiring or giving stronger incentives for localplanning to better manage growth, consistent with state goals. Florida made further changes toits planning system, intensifying state review of local plans. Tennessee and Delaware also addedgrowth management features to their planning legislation in the 1990s in response to pressurescreated by rapid suburban development.
The best known recent example of legislation embracing these principles is Maryland’s plan-ning reform of the mid-1990s. Its key provision for land use planning and regulation (almost allof which is carried out at the county level) provides that local governments will designate “prior-ity funding areas” in which new growth is slated to occur and that the state will invest in majorinfrastructure only in those areas.7
These efforts are referred to broadly as “growth management,” a term used to describe thedeliberate and integrated use of the planning, regulatory, and fiscal authority of state and localgovernments to influence the pattern of growth and development in order to meet projectedneeds. This definition includes such tools as comprehensive planning and zoning, but alsodevelopment fees, infrastructure investments, and other policy instruments like containmentthat significantly influence the development of land and the construction of housing. Growth
3AUGUST 2006 • THE BROOKINGS INSTITUTION • RESEARCH BRIEF
management is often distinguished from “growth control.” Where growth management accom-modates projected development in a manner that achieves broad public goals, growth controlslimit or ration development. Typical growth control tools are moratoria, permitting caps, devel-opment quotas, and the like, as discussed below.8 This distinction is an important considerationin our analysis.
B. Regulating the pace, location, and extent of developmentIn some states the regulatory toolbox now goes far beyond zoning to a family of tools intendedto influence the pace, location, and ultimate extent of development.9 One of the most signifi-cant local land use innovations in the last 30 years has been in the anticipation andincorporation of the impacts of growth on local infrastructure and environmental systems, atthe scale of both individual developments (subdivisions and site plans) and larger areas (neigh-borhood plans and comprehensive plans). Local governments now use a variety ofsupplementary tools for these purposes. They impose impact fees on building permits as pro-rata shares of capital costs for a variety of infrastructure systems; and state laws have evolved toregulate the scope and permissibility of fees. The principle of “concurrency,” often adoptedthrough adequate public facilities ordinances, requires local governments to monitor the impactof development as it occurs. If a development proposal threatens to increase volumes served bycertain infrastructure in such a way that it would threaten locally acceptable levels of service,then the applicant may be denied permission to build.10
As an alternative (and sometimes a supplement) to measures that match infrastructure togrowth, there are tools that control or stop growth altogether. This is done sometimes so newdevelopment does not exceed infrastructure capacity, and sometimes simply so that growth doesnot seem “too fast.” Systems rationing annual building permit issuance debuted in the early1970s in Petaluma, CA and Boca Raton, FL. Both of these places had been swept by waves ofgrowth emanating from the centers of their metropolitan areas.11 In early years, these controlswere adopted exclusively to limit new residential construction. But more recently, several juris-dictions (including San Francisco and Seattle) have also placed annual caps on officeconstruction.
Various studies suggest that as local governments have invented new growth control instru-ments, they have also modified their use of older standard tools in attempts to influencedevelopment outcomes. Local governments can reduce permitted density and height (“down-zone”) or designate less land than the market would demand for residential development, and they can “gold plate” subdivision requirements and so reduce their attractiveness for low-cost housing. They can also increase the amount of time required to process developmentapplications.
Growth controls have become more common in some states partly because of their access tosuch direct democracy measures as the referendum. In California, citizens’ access to the ballotinitiative has heightened public awareness of the possibility of controlling growth. Althoughonly about 15 percent of the California growth measures in effect in 1988 were adopted byvoter initiative, the availability of the initiative and the example the successful initiatives setmay well have influenced city council members’ land use decisions. Colorado residents alsohave access to the ballot for growth measures.12
A final trend in local planning and regulation, urban containment, responds to concernsabout both open space and infrastructure capacity.13 Oregon, Washington, and Tennessee allhave state growth management programs that require various forms of urban containment.Containment can take a “loose” form, carried out through phasing systems that manage thespread of development without imposing an outer boundary; it can also be a result of perma-nent greenbelts or semi-permanent urban limit lines. To carry out these policies that shape theurban edge, local governments establish regulations to limit the extension of infrastructure;purchase or rezone land beyond the proposed edge of development; and create incentives usingregulations and public investment to spur development in designated areas.
4 AUGUST 2006 • THE BROOKINGS INSTITUTION • RESEARCH BRIEF
C. Local housing programs: Counterpoint to growth managementUntil about 1970, affordable housing had been primarily a responsibility of either the federalgovernment (through the construction of public housing) or a matter for resolution by the pri-vate sector (through the “filtering” of old housing units to lower-income households). But in the1970s, affordability problems began to spike faster than either filtering or federal programs—even new programs like federally subsidized but privately built housing—could address them.Moreover, the urban uprisings of the 1960s convinced policymakers, planners, and judges thatregions could not thrive if they relied on their older central cities to accommodate most of theirlow-income residents.
On both coasts, new local housing measures arose in the 1970s in response to both state andfederal mandates and innovation by local officials and residents who wanted their communitiesto have a balanced supply of housing. After 1980, when the federal government effectively with-drew from funding new public housing, local governments increasingly supported bothregulatory programs and spending for affordable housing.
A first key policy innovation involves the use of local land use regulations to induce orrequire the production of affordable housing units. Such strategies are most common in stateswhose legislatures or courts have imposed it or made it available to builders as a remedy to localexclusionary practices—most notably Massachusetts, Connecticut, and New Jersey. In thesestates, builders who want to provide affordable housing can ask higher authorities to overriderestrictive zoning provisions in jurisdictions that have done too little to accommodate a share ofaffordable housing in the past. Local governments offer a wide array of regulatory incentives inexchange for commitments to affordability, the most common of which are density bonuses,reduced impact fees, expedited permitting, and flexible development and subdivision stan-dards.14
A second innovation, again often sparked at least as much by state requirements and induce-ments as by local initiative, has been increased local spending on affordable housing. Localgovernments have greatly expanded their capacity to subsidize affordable housing constructionpartly because of the creation of federal programs including 1974’s Community DevelopmentBlock Grant and 1990’s HOME Investment Partnerships Program. In the last 25 years, NewYork City has spent billions of its own general revenue funds to support affordable housing.Other jurisdictions have tapped special sources of revenue for housing. California, for example,requires local government redevelopment agencies to set aside 20 percent of the increased taxincrement generated by the development in their project areas for affordable housing.15
In addition, local regulatory programs generate affordable housing fees; some localities allowdevelopers to meet inclusionary requirements by paying an “in-lieu” fee, and others haveadopted linkage fees that require developers of commercial and office space to contribute fundsto offset the need for associated affordable housing. When local governments collect such fees,they often use them to capitalize dedicated housing trust funds (HTFs), which can also draw ona wide range of taxes, charges, fees, donations, and allocation of federal block grant funds.
D. Impacts of Land use RegulationsResearch into the impacts of land use regulations can be separated into two main areas. First,do they achieve their stated purposes: Do zoning ordinances make a difference in the pattern ofland uses? Do growth controls slow growth? Do urban growth boundaries affect the expansionof urban areas? Second, do land use regulations have other “downstream” effects—whetherintentional or unintentional—on such outcomes as housing affordability, environmental quality,infrastructure capacity, and segregation by race and income?16
Most of the purported benefits and costs of land use regulation begin from the assumptionthat regulation and planning will produce a different direct outcome in land development pat-terns than an unregulated land market. Hence the first question about land use regulation mustalways be: Does it have any impact at all? This question has been pursued in research concern-ing, for example, whether zoning “follows the market” and by studies of whether growthcontrols “work.” Whether the research compares jurisdictions within the same metropolitanarea or compares metropolitan areas with one another the answer tends to be: it depends.
5AUGUST 2006 • THE BROOKINGS INSTITUTION • RESEARCH BRIEF
If, as is often the case, local politics is dominated by development and real estate interests,then political bodies often adopt land use regulations that support or endorse market trendsrather than affect land markets. Studies have shown that in some jurisdictions regulations havehad little visible influence on the location and amount of development or on the price of land.17
Other studies have identified places and regions where regulations have had substantialdirect effects on development patterns and land prices. Most consistently, building permit capsand extensive low density zoning appear to associate with slower growth, less housing provision,and, at the regional level, lower density land use patterns than would occur in their absence.18
Strong regional urban containment and growth boundaries appear to have reduced sprawl inOregon but local, or isolated, boundaries may not have that effect more generally.19 At the largerlevel some research shows that states with growth management do not differ significantly fromnon-growth management states.20 In short, implementation matters with all these regulations,and results vary dramatically depending on both the initial design of the regulation and its exe-cution.
The weight of the evidence suggests that places with stricter land use regulations differ sys-tematically from those where they are less strict. The evidence is clearest (because it has beensought most zealously) about housing prices, which are higher in strictly regulated places. Butregulations do not just restrict supply; they also raise the quality of housing, neighborhoods,and jurisdictions.21
However, even if regulations only raise amenity levels without restricting supply they can alsoplay a role in the fragmentation of space according to income and race. Research on regulationshows that strictly regulated jurisdictions and places are more likely to be occupied by whitenon-Hispanic and upper-income people and households, just as—and at least partly because—such places also have higher housing prices.22
Only recently have studies on regulations and racial or income segregation followed the leadof housing price research to ask whether regulated metropolitan areas are internally more inte-grated or segregated than less regulated metropolitan areas. Evidence suggests thatmetropolitan areas with urban containment programs experienced more rapid declines in black-white segregation than those without containment, though exactly why containment associateswith declining segregation is still unclear. To the extent that containment raises densities it mayalso associate indirectly with elevated segregation by income, because high-density metro areashave been found to have more income segregation.23
The pathway from regulation to exclusion by income or race is complex. Total low densityzoning, in particular, tends to exlude black and Hispanic residents from the jurisdictions thatuse it by reducing the supply of the types of housing that tend to be available for rent.24 Thisunderscores the point that policy reform requires more precise specification of just which regu-lations associate with income and race-based segregation. It is also necessary to learn moreabout how different combinations of regulations at subregional and metropolitan levels mightproduce different results for regions.
In sum, local regulations shape the built form and character of cities, towns, counties, andentire regions. Zoning, comprehensive plans, infrastructure finance, urban containment, build-ing moratoriums, and permit caps can foster low density development and metropolitandecentralization or promote a more compact development pattern. They can also directly affectthe socioeconomic composition of the local populace by opening or closing doors for rentersand low-income people. Together, local land use regulations and housing programs can produceregional equity or inequity, safeguard or undermine environmental quality and public health,and create a more efficient or inefficient pattern of public services.
6 AUGUST 2006 • THE BROOKINGS INSTITUTION • RESEARCH BRIEF
III. The Survey of Local Land Use Regulations
The survey that provides the basis for this analysis was sent by mail to every local gov-ernment—incorporated municipalities, townships, or counties—in the 50 largest U.S.metropolitan areas (according to 1999 metropolitan definitions and 2000 Censusresults, based on CMSAs and MSAs) with both a 2000 population over 10,000 resi-
dents and regulatory authority on the broad array of issues covered in our survey.25 Theeight-page survey was sent to the planning director of each jurisdiction where one existed. Injurisdictions without planning directors, we addressed the survey to either another staff mem-ber (e.g., city manager, city engineer, zoning enforcement officer) or a public official (e.g.,mayor, planning board chair, city clerk).26
Our census of jurisdictions over 10,000 residents included 2,365 jurisdictions, 62 percent ofwhich responded. In 17 metropolitan areas, this census captured either fewer than 50 percentof residents or less than 50 percent of metropolitan land area. For 15 of these metropolitanareas, we drew a random sample of up to 50 jurisdictions under 10,000 residents. (In Buffaloand Hartford, we surveyed all jurisdictions because each had fewer than 50 jurisdictions under10,000 residents.) Among these 812 small jurisdictions, 47 percent responded. In total, 1,844of the 3,177 jurisdictions—over 58 percent—responded.
The survey covers six discrete, but related areas of land use regulation: 1) zoning, 2) compre-hensive planning, 3) containment, 4) infrastructure regulation, 5) growth control, and 6)affordable housing programs and funding. This report is structured around those six areas.
Following are the principal questions for each area of land use regulation:1) Zoning. First, the survey investigated whether the jurisdiction has zoning at all. If so, the
survey determined the maximum permitted residential density in the zoning ordinance indwellings per acre. Five density ranges corresponding to particular housing types were provided:Fewer than four dwellings per acre (mainly low to moderate density single family housing), fourto seven per acre (high density single family housing and duplexes), seven to 14 (small multi-family structures), 15 to 30 (garden apartments), and over 30 (larger apartment buildings).
The survey asked whether the maximum permitted density had increased since 1994 by morethan 10 percent, remained the same, or decreased more than 10 percent. It also asked whethermobile home placement would be allowed by the zoning ordinance, either “single wide” or“double wide” units.
Finally, to learn more about the impact of zoning on multi-family development, the surveyinvestigated whether the ordinance had a zoning category that would allow construction either“by right” or by special permit of a prototype apartment development with 40 units of two storyapartments on a five acre lot. The purpose was to investigate the extent to which zoningexcludes certain development types and, by extension, the households that would hypotheticallyoccupy them.
2) Comprehensive planning. The survey asked whether the jurisdiction had a comprehen-sive plan and when its land use element was last updated.
3) Containment. The local governments surveyed were asked to report on whether they usedany of a series of growth containment measures such as service areas or service boundaries,growth areas or growth boundaries, and/or greenbelts. They were also asked what year they hadadopted these measures.
4) Infrastructure regulation. The inquiries about impact fees and adequate public facilitiesordinances included questions about whether the municipalities had either of these tools.Regarding impact fees, the survey asked whether the fees were calculated case by case or at a flatrate; what the flat fee was, if any; and which infrastructure systems were subject to impact fees.It also asked which infrastructure systems were subject to adequate public facilities ordinances.27
5) Growth control. The survey asked whether the jurisdiction had a building permit cap, howmany units were allowed to be built each year, and how long the cap had been in place. It askedwhether there was a current moratorium on issuance of building permits, how long it had beenin place, and whether it covered only some or all of the jurisdiction. The distinction betweeninnovative and restrictive growth control measures is among the most complex in our analysis.
7AUGUST 2006 • THE BROOKINGS INSTITUTION • RESEARCH BRIEF
6) Affordable housing. Finally, the survey asked a battery of questions about local affordablehousing programs. The first concerned regulatory approaches, such as inclusionary zoning, den-sity bonuses, linkage fees, fast-track permitting processes, and fee waivers. Second, it askedlocal governments if they directly work to create affordable housing, for example, by spendingtheir own funds or working with nonprofits and public housing authorities, or by setting up adedicated funding source (such as a trust fund) for affordable housing. Finally, it asked them toestimate the number of assisted housing units in their jurisdictions.
Response rates varied directly with jurisdiction size; among the 259 largest jurisdictions (over100,000 residents), 77 percent responded. Only about half (51 percent) of the 1,721 jurisdic-tions under 20,000 residents responded, and around 65 percent of the 1,168 jurisdictionsbetween 20,000 and 100,000 residents responded. To enhance response rates, we followed upwith a second survey form three weeks after the first mail-out; key jurisdictions such as largecities and counties were also contacted again by e-mail, fax, and phone to boost response rates.
Response rates varied slightly by region with the highest rates received from the West (69percent) and the South (68 percent); slightly lower response rates were received from the Mid-west (57 percent) and Northeast (51 percent). Response rates varied more by metropolitanarea: 100 percent of the jurisdictions in Las Vegas responded to the survey, compared with only38 percent of surveyed jurisdictions in the New York metro area. Other high-response metroareas include Oklahoma City and Austin (88 percent) and Denver (86 percent). Other low-response metro areas include Louisville (43 percent), Raleigh-Durham (47 percent), andKansas City (48 percent).
The majority of respondents were planning staff members—65 percent. Thirty-eight percentof all respondents hold the title of either director of planning or director of community develop-ment. The remaining respondents included building/zoning staff (14.5 percent); engineeringstaff (1.7 percent); city administrators (5.2 percent); municipal clerks/secretaries (4.3 percent);elected officials (3.9 percent); administrative assistants (2.5 percent); and planning board chair-persons (2.5 percent).
Once the surveys were complete and coded, estimates were constructed of the incidence of16 key land use regulations and housing programs at the metropolitan level and stratified bythree and sometimes four dimensions. The proportion of local governments that had the regula-tion in question was determined by jurisdictional type (incorporated, township, county), in thesame state, within the same population range (up to five population categories). Larger statesand those with significant intra-state variation (e.g., Texas, California) were also stratifiedaccording to metropolitan areas or groups of metropolitan areas. The result was a table of pro-portions (probabilities) that were then applied to non-respondents and non-surveyedmunicipalities. For instance, if 10 of 40 small municipalities that responded to our survey inone state had a building-permit cap, it was presumed that 25 percent of all municipalities inthat population range in that state had a cap.
This process allowed the estimation of how many and what share of jurisdictions had a par-ticular regulation. But two other aspects of regulation also were important as indicators ofregulatory intensity in a region: the share of the 2000 population living in jurisdictions with theregulation, and the share of the 2000 land area located in these jurisdictions. Each of thesewere estimated by multiplying each jurisdiction’s probability of having a regulation by its 2000population and land area and then summing to a total regional estimate. This yielded an esti-mated number of people and of square miles in each metropolitan area that were subject toeach regulation, which, added to the “known” results from the survey, allowed estimation of theshare of people and land area in each metropolitan area in jurisdictions with or without each ofthese 16 regulations.
Adding complexity to this process, in several states in the Midwest (Minnesota, Illinois, Wis-consin, and Ohio) counties and townships share sovereignty over at least some land use issuesin areas outside incorporated units. For these metropolitan areas, the estimates of the share ofjurisdictions with each regulation include all the jurisdictions. The estimates of the share ofpopulation and land area are estimated according to whether or not it had either a county-levelversion of a regulation or a township-level version. (These data were collected in follow-up sur-
8 AUGUST 2006 • THE BROOKINGS INSTITUTION • RESEARCH BRIEF
veys and Internet research on county and township regulations.) Adjustments were made toavoid double-counting the population and land area in unincorporated areas.
Since some metropolitan areas cross state lines, and since state law affects local land use reg-ulations, separate sub-metropolitan areas were created for each state into which a metropolitanarea extended. For example, since the St. Louis MSA includes portions of Missouri and Illinois,the region was treated as two cases.28 So while the top 50 metropolitan areas are analyzed here,there are actually 73 geographic units that are considered.
Factor analysis was used to characterize the prevalence in each metropolitan area in each ofthe six areas of land use regulation mentioned above.29 Between one and four survey measureswere used for each of the analyses. For each of the measures, there were three variables: thepercent of jurisdictions covered, the percent of population covered, and the percent of land areacovered. Thus the number of variables ranged between 3 for comprehensive planning and con-tainment and 12 for zoning (Table 1).
Once the factor analysis was complete, hierarchical cluster analysis was used to gain a moreempirically based view of which metropolitan areas most resemble one another in their regula-tory structure based on the land use tools/factors.30 Two metropolitan areas with identical factorscores on all factors would be clustered at an early step of the hierarchical clustering process;with each step in the process, increasingly dissimilar metropolitan areas are placed into thecluster in which they best fit.31 Often, an unusual metropolitan area can remain unmatchedwhile two similar clusters of cases are matched. For this analysis, the cluster analysis resulted in12 clusters—or typologies—that identify similar approaches to residential land use regulation inthe 50 largest metropolitan areas. As mentioned, as some metropolitan areas have sub-regions—parts of a metropolitan area in another state—the regulatory family for 62 total areasis identified.32 These 12 clusters, in turn, can be combined into four major groups based ontheir similarity to one another.
In view of the evolutionary and functional relationships among the clusters and groups, welabel them as orders and families of regulatory approaches; they are somewhere in the middle ofthe taxonomy of regulatory approaches: not as broad as kingdoms, phyla, or classes and moregeneral than only genera and species. We hope that this classification effort will be treated inthe spirit of Stephen Jay Gould’s contention: “Taxonomy … is often undervalued as a glorifiedform of filing—with each species in its prescribed place in an album; but taxonomy is a funda-mental and dynamic science, dedicated to exploring the causes of relationships and similaritiesamong organisms. Classifications are theories about the basis of natural order, not dull cata-logues compiled only to avoid chaos.”33
9AUGUST 2006 • THE BROOKINGS INSTITUTION • RESEARCH BRIEF
Table 1. Measures used in factor analysis
Factor Measure
Zoning 1. Presence of zoning
2. Low density-only zoning
3. Zoning allowed above 30 dwellings per acre
4. Permission for the prototype high density apartment complex
Comprehensive Planning 5. Presence or absence of a comprehensive plan
Containment 6. Presence of a containment device
Infrastructure Regulation 7. Presence of adequate public facilities ordinances
8. Utilization of impact fees
Growth Control 9. Utilization of building moratoria
10. Presence of permit caps
Affordable Housing 11. Presence of a regulatory affordable housing program
12. Existence of a funding source (such as a trust fund)
IV. Findings
This section reports on the results of the analysis derived from the 50 metropolitan areasurvey. (A companion piece has also been developed that provides a detailed examina-tion of the governance framework, growth trends, and regulatory environment in the50 largest metropolitan areas analyzed here.)34
1. Basic land use regulations like zoning and comprehensive planning dominatethe regulatory landscape all across the U.S. while other tools like containment andpermit caps are far less common.More than 91 percent of the jurisdictions in the 50 largest metropolitan areas have zoning ordi-nances of one kind or another in place (Table 2). Only 5 percent of the metropolitan populationlives in jurisdictions without zoning, but as much as 11 percent of the land area is estimated tobe unzoned.
Almost as many jurisdictions—85 percent—have a comprehensive plan. As a result, 84 per-cent of the population and 92 percent of the land area is subject to a plan for how theparticular jurisdiction intends to grow and develop in the future.
As discussed in the earlier section, neither of these tools—zoning or comprehensive plan-ning—is especially innovative. Nor does their presence mean a jurisdiction will accommodategrowth. To the contrary, in nearly a quarter of the local governments the maximum permittedresidential density in the zoning ordinance is less than 4 dwellings per acre, and another 16 per-cent restrict the maximum density to fewer than 8 dwellings per acre. Together these “lowdensity-only” jurisdictions account for 38 percent of the local governments in the 50 largestmetropolitan areas.
Most of the low-density-only jurisdictions—30 percent of the total—would also bar our hypo-thetical apartment development. That is, a multi-family apartment development with 40 unitsof two-story units on a five-acre lot would be illegal in these places. Further, about half the localgovernments have zoning ordinances that prohibit placement of mobile homes.
Not surprisingly, low density-only jurisdictions account for a much smaller share of the met-ropolitan population—about 12 percent—than of jurisdictions with higher densities. But lowdensity-only jurisdictions account for 19 percent of the metropolitan land area, and those thatexclude the hypothetical apartment development make up 16 percent. By contrast, only about12 percent of the jurisdictions have maximum allowable densities of greater than 30 units peracre. Yet 48 percent of the metropolitan population lives in these jurisdictions. (It should benoted that this does not mean that over half of the population lives at such densities—only thatthe jurisdictions in which they live allow such densities somewhere within the municipalboundaries.)
The survey results also suggest that the maximum permitted density has generally remainedthe same over the last ten years. Four-fifths of the jurisdictions were within 10 percent of their1994 density in 2003. Nearly equal shares of jurisdictions have increased maximum permitteddensity (9 percent) and decreased the maximum (10 percent). The jurisdictions that raised theceiling on density account for more residents (10 percent of the total) and land area (7 percentof the total) than those that reduced permitted density (7 percent of the residents, 5 percent ofthe land).
Apart from zoning, impact fees are the most common tool in the U.S. today for residentialland use regulation; they are imposed by 37 percent of jurisdictions containing 56 percent ofthe population and 46 percent of the land area in the top 50 metropolitan areas. Adequate pub-lic facilities ordinances (AFPOs) are less popular but still more common than most otherregulatory tools; about a fifth of jurisdictions, with 28 percent of the residents and 36 percentof the land area, use APFOs.
Other regulatory tools are far less pervasive than zoning and comprehensive planning. Forexample, despite the attention focused on urban containment programs like growth boundariesor control measures like building caps and moratoria, this research finds that they are less com-mon than measures linking development to infrastructure capacity. At the national level, only
10 AUGUST 2006 • THE BROOKINGS INSTITUTION • RESEARCH BRIEF
an estimated 16 percent of jurisdictions have urban containment programs. However, thesejurisdictions do tend to be more populous and expansive than average, with 27 percent of thetotal metropolitan population and 38 percent of the land in these metropolitan areas.
Only about 2 percent of jurisdictions, with 4 percent of the residents and 3 percent of theland area, have permit caps. The most serious moratoria—those that apply to the entire juris-diction and had lasted longer than 2 years by 2003—are only modestly more common, affecting4 percent of the jurisdictions with 6 percent of the population and land area.
Finally, we estimate that about 23 percent of jurisdictions have an incentive-based affordablehousing program of some kind and that 15 percent of jurisdictions have a dedicated source offunds for affordable housing. However, the jurisdictions that support affordable housing withthese programs and funds are the larger cities, boosting the programs’ impact. Those with regu-latory programs account for 57 percent of the population and 30 percent of the land area, andthe ones with dedicated housing funds include 52 percent of the population and 33 percent ofthe land.
1 1AUGUST 2006 • THE BROOKINGS INSTITUTION • RESEARCH BRIEF
Table 2. Local Land Use Tools in the 50 Largest U.S. Metro Areas: Share of jurisdictions, population, and land area to which they apply, 2003
Estimated percent of
Jurisdictions Population Land
Zoning
Ordinance in place..........................................................................91.5 95.3 89.3
2. But the presence of these land use tools varies greatly across the country. North-east and Midwest metropolitan areas use land use regulation to exclude whilethose in the West are more accommodating, with more regulations designed toaffect the pace and shape of development.This analysis makes clear that not all metropolitan areas use the same approach to land use reg-ulation. And there are often wide variations within metropolitan areas when these cross stateboundaries.
However, some clear commonalities can be observed in the four large regions of the country:the Northeast, Midwest, South, and West. The types and sizes of jurisdictions in these regions,their governance structures, the times in which they grew and developed, their current growthrates and pressures and their particular regional preferences and traditions, all affect the landuse tools they employ.
For example, metropolitan areas in the West clearly distinguish themselves from the rest ofthe nation—the Northeast and Midwest particularly. Metropolitan areas in the West lead interms of percent with a comprehensive plan. They have, by far, higher densities than the othermetropolitan areas. They utilize containment, and infrastructure regulations much more fre-quently. And they have many more programs designed to boost the supply of affordable housing.
Breaking this down by the individual land use tools clearly illustrates these differences.Zoning. As figures 1 and 2 reveal, jurisdictions in Northeast and Midwest metropolitan areas
greatly restrict densities while those in the South and West are more much more accommodat-ing. In almost every jurisdiction surveyed in the West, our prototypical apartment complexwould be allowed either by right or by permit.35 Almost half of the jurisdictions in the Northeastwould ban it entirely.
Adding these trends up reveals a broader picture of what it means for a jurisdiction to be“exclusionary”. For the purposes of this survey, an exclusionary jurisdiction is one that main-tains solely low densities (no housing anywhere greater than 8 dwellings per acre) and would
12 AUGUST 2006 • THE BROOKINGS INSTITUTION • RESEARCH BRIEF
Map 1. Dominance of Exclusionary Land Use, by metropolitan area (or portion)
Very lowLowModerateHighVery high
bar our hypothetical apartment building by right or special exception.Map 1 clearly illustrates that when coded by the prevalence of exclusionary land use, metro-
politan areas in the Northeast dominate the landscape. The entire state of New Jersey (which ispart of two metropolitan are as: New York in the north and Philadelphia in the south) is visibleas a place with a very high incidence of exclusionary land use, along with those places in theHartford metropolitan area and the New Hampshire suburbs outside of Boston.
The list of the least exclusionary areas is dominated by Western metropolitan areas like San Diego, Salt Lake City, Seattle, Phoenix, Denver, and San Francisco; as well as several in
13AUGUST 2006 • THE BROOKINGS INSTITUTION • RESEARCH BRIEF
Figure 1. Percent of jurisdictions with zoning ordinances with specified maximum residential density
Northeast Midwest South West USA
No zoning
>30/acre
15–30/acre
8–14/acre
<8 units/acre
100%
75%
50%
25%
0%
Figure 2. Percent of jurisdictions that would allow a two-story, 40 unit apartment building on a five acre lot
Northeast Midwest South West USA
Apartment developmentallowed by permit
Apartment developmentallowed by right
No apartment development allowed
100%
75%
50%
25%
0%
Florida: Miami, Tampa, and Jacksonville. In fact, no Western metropolitan area, or state shareof metropolitan area, ranked in the top three-fourths of all 73 areas considered in this surveyranked by dominance of exclusionary land use. By contrast, no Northeastern metropolitan arearanks in the bottom 60 percent.
Another zoning factor we examined, the absence of zoning, also breaks down sharply byregion with the Midwest leading in terms of the percent of jurisdictions (14) without zoningcodes.36 While almost no jurisdiction surveyed in the West is without zoning (Map 2). TheNortheast (4 percent) and South (7 percent) are also below the national figures.
The low figures for the South may be somewhat surprising given the dominance of Texasmetropolitan areas on the list of individual places that eschew zoning altogether. Houston isfamous for its lack of zoning, but Austin, San Antonio, and Dallas also score very high in thisregard.37 San Diego, the New Hampshire exurbs of Boston, the North Carolina exurbs of Nor-folk, and the District of Columbia rank lowest on the no zoning factor.
Comprehensive Planning. The high percentage of jurisdictions with comprehensive plans inplace is understandable since in many states, comprehensive planning is mandatory. In total, 85percent of jurisdictions have them. (Figure 3 and Map 3). There are 32 areas in which all thejurisdictions had comprehensive plans and another five in which comprehensive plans werealmost ubiquitous. The West leads this group: 99 percent of all jurisdictions have a comprehen-sive plan. The only Western metropolitan area that scored low was Salt Lake City. Planning isalso weak in the Houston, Milwaukee, New Orleans, and Chicago metropolitan areas and inNew York City, which does not have a comprehensive plan.
Containment. The highest-ranking metropolitan areas on the containment factor are thosein which state law requires containment: Portland, Seattle, and Nashville (Figure 4 and Map 4).Denver also ranks very high, thanks in part to the use of greenbelts in Boulder County and to avoluntary regional plan coordinated by the regional council of governments.38 With few excep-tions, the list of metropolitan areas where urban containment policies are common isdominated by the South and the West. The lowest-ranking major metropolitan areas are Hous-
14 AUGUST 2006 • THE BROOKINGS INSTITUTION • RESEARCH BRIEF
Map 2. Absence of Zoning, by metropolitan area (or portion)
Very lowLowModerateHighVery high
ton, Atlanta, Buffalo, and Indianapolis. Although the percent of jurisdictions with containment policies in place in the West (55) is
more than twice as high the figure for the South (23), the percent of land area affected by thecontainment policies is much closer (51 percent in the West, 43 percent in the South). Simi-
15AUGUST 2006 • THE BROOKINGS INSTITUTION • RESEARCH BRIEF
Map 3. Absence of Comprehensive Planning, by metropolitan area (or portion)
Figure 3. Percent of jurisdictions with a comprehensive plan, by region
Northeast Midwest South West USA
100%
75%
50%
25%
0%
Very lowLowModerateHighVery high
larly, while the percent of Midwestern jurisdictions with containment policies (13) is twice thatof those in the Northeast (6), the percent of population covered is slightly higher in the latter(11 vs. 13 percent.)
Infrastructure Regulation. The percent of jurisdictions with control on infrastructure
16 AUGUST 2006 • THE BROOKINGS INSTITUTION • RESEARCH BRIEF
Map 4. Use of urban containment devices, by metropolitan area (or portion)
Figure 4. Percent of jurisdictions with urban containment devices, by metropolitan area (or portion)
Northeast Midwest South West USA
100%
75%
50%
25%
0%
Jurisdictions
Population
Land Area
Very lowLowModerateHighVery high
capacity is highest in the West for both impact fees and adequate public facilities ordinances(APFO) (Figure 5 and Map 5). Nearly 90 percent of Western jurisdictions use impact fees,twice as high as the share of jurisdictions in the South. However, the highest-scoring areas onthe impact fee factor are those in Florida, which mandates concurrency between infrastructure
17AUGUST 2006 • THE BROOKINGS INSTITUTION • RESEARCH BRIEF
Map 5. Use of infrastructure regulations, by metropolitan area (or portion)
Figure 5. Percent of jurisdictions with control on infrastructure capacity
Northeast Midwest South West USA
100%
75%
50%
25%
0%
APFOImpact fees
Very lowLowModerateHighVery high
and development and prescribes the use of impact fees.39 Phoenix and San Diego also scorehigh. The major metropolitan areas that rank lowest include Indianapolis and places in Virginiawhere under current law the use of impact fees is limited to roads in only a few jurisdictions.
Jacksonville, which ranks slightly below the other Florida metropolitan areas on the impact
18 AUGUST 2006 • THE BROOKINGS INSTITUTION • RESEARCH BRIEF
Map 6. Local regulatory programs and funds for affordable housing, by met-ropolitan area (or portion)
Figure 6. Percent of jurisdictions with affordable housing programs
Northeast Midwest South West USA
100%
75%
50%
25%
0%
Incentive-basedaffordablehousing program
Dedicatedhousing funds
Very lowLowModerateHighVery high
fee factor, scores highest on the APFO factor. Other high-scoring metropolitans on the APFOfactor include the southern metropolitan areas of Louisville, New Orleans, and the Marylandportion of Washington. The major metropolitan areas that score lowest on this factor includeSalt Lake City, Austin, San Francisco, and Sacramento.
Growth Control. Few land use tools generate as much interest and controversy as sharpgrowth controls like caps on building permits and growth moratoria. Indeed, in some Westernareas the permit cap is a very common regulation, adopted by an estimated 42 percent of juris-dictions in metropolitan Denver and an estimated 33 percent in metropolitan Las Vegas. Theyare also becoming more common around Boston, with an estimated 20 percent of the jurisdic-tions employing them. Because several very high-cost housing markets have many jurisdictionsthat have experimented with permit caps, this leads many observers to conclude, probably cor-rectly, that they create serious housing shortages. The professional and political backlashagainst them has therefore been intense. But beyond these metropolitan areas, growth caps arequite rare and in fact completely absent from 33 of the 50 metropolitan areas. This combina-tion of intense backlash and scarcity parallels the case of strict rent control; both strict rentcontrol and permit caps at their most extreme provide economists with textbook examples ofoverregulation and its negative effects, but neither regulation is all that common at the nationallevel.
Affordable Housing. Outside of the West, there is only modest local action in developingincentive-based affordable housing programs, and even less in establishing dedicated housingfunds to support affordable housing (Figure 6 and Map 6). In the West, nearly two-thirds of themunicipalities have incentive programs and half have dedicated funds established. No otherregion comes close to these figures. Individually, the highest-ranking area on this factor is theDistrict of Columbia, with the four California metropolitan areas filling out the top ranks. Out-side of Las Vegas, no Western place ranks in the bottom half of metropolitan areas nationally.The Florida metropolitan areas also rank fairly high. The lowest-ranking major areas on this fac-tor include Midwestern places like Kansas City, St. Louis, and Grand Rapids.
3. Several important typologies of places emerge that associate metropolitan areaswith each other based on their combination of land use regulations.Several studies in the past have ranked or rated the degree of land use regulation in metropoli-tan areas.40 Such ratings have been shown to correlate with housing prices; more highlyregulated regions, for a variety of reasons, have higher housing and land prices.
But a simple rating system is not sufficient to identify relationships between regulation andsuch outcomes as land consumption or regional housing opportunity for low-income residents.For example, a simple scan of the results of this survey suggests that although metropolitanBoston, New Jersey, California, and Florida all occupy positions at or near the top of nationalrankings of regulatory restrictiveness, their regulations differ substantially from one another.
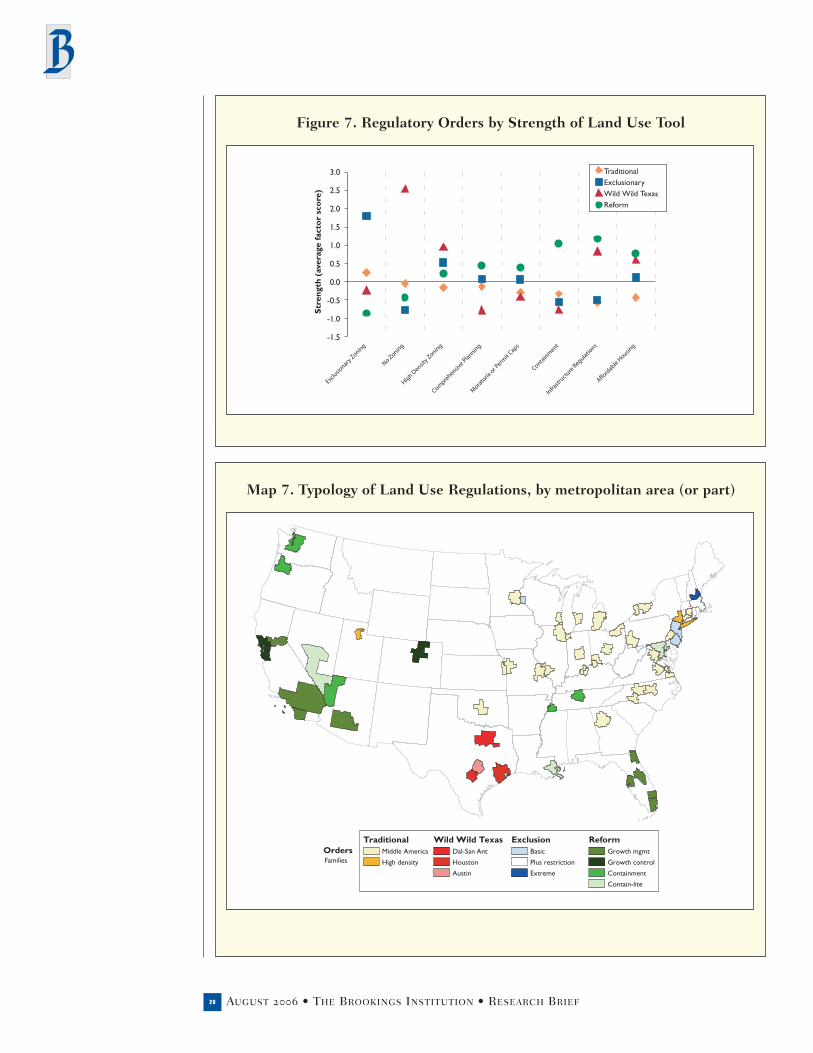
The cluster analysis, which built on the factor analysis, yielded a reasonable 12-cluster solu-tion that serves as the basis for a description of families of land use regulation in the 50 largestmetropolitan areas. These 12 families fall into four orders (see Table 3, Figure 7, and Map 7).
This analysis refers to each of the 12 clusters as a regulatory family. Since the factor analysisincluded data on the share of jurisdictions, population, and land area covered by each regula-tion or policy, a combination of regulations will be most clearly “dominant” when it applies tomany jurisdictions covering a large share of the land area and population of a metropolitanarea. Each of the families, however, resembles at least one other, so that four regulatory ordersalso can be identified at a higher level of generality. (See the companion paper for a moredetailed description of the individual metropolitan areas.)
19AUGUST 2006 • THE BROOKINGS INSTITUTION • RESEARCH BRIEF
20 AUGUST 2006 • THE BROOKINGS INSTITUTION • RESEARCH BRIEF
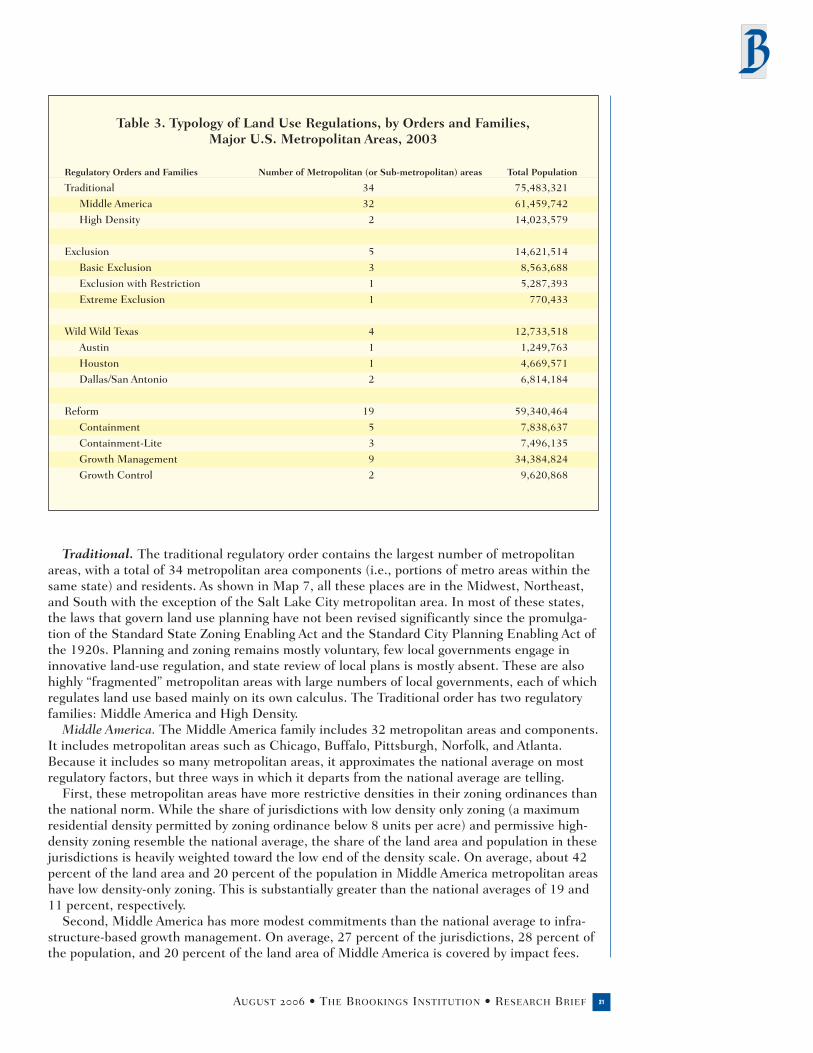
Map 7. Typology of Land Use Regulations, by metropolitan area (or part)
TraditionalMiddle America
High density
Wild Wild TexasDal-San Ant
Houston
Austin
ExclusionBasic
Plus restriction
Extreme
ReformGrowth mgmt
Growth control
Containment
Contain-lite
FamiliesOrders
Figure 7. Regulatory Orders by Strength of Land Use Tool
TraditionalExclusionaryWild Wild TexasReform
3.0
2.5
2.0
1.5
1.0
0.5
0.0
-0.5
-1.0
-1.5
Str
engt
h (a
vera
ge fa
cto
r sc
ore
)
Exclu
sionary
Zoning
No Zoning
High D
ensity Zonin
g
Compre
hensive Plannin
g
Mora
toria
or Perm
it Caps
Contain
ment
Infra
structu
re Regulatio
ns
Afford
able Housin
g
Traditional. The traditional regulatory order contains the largest number of metropolitanareas, with a total of 34 metropolitan area components (i.e., portions of metro areas within thesame state) and residents. As shown in Map 7, all these places are in the Midwest, Northeast,and South with the exception of the Salt Lake City metropolitan area. In most of these states,the laws that govern land use planning have not been revised significantly since the promulga-tion of the Standard State Zoning Enabling Act and the Standard City Planning Enabling Act ofthe 1920s. Planning and zoning remains mostly voluntary, few local governments engage ininnovative land-use regulation, and state review of local plans is mostly absent. These are alsohighly “fragmented” metropolitan areas with large numbers of local governments, each of whichregulates land use based mainly on its own calculus. The Traditional order has two regulatoryfamilies: Middle America and High Density.
Middle America. The Middle America family includes 32 metropolitan areas and components.It includes metropolitan areas such as Chicago, Buffalo, Pittsburgh, Norfolk, and Atlanta.Because it includes so many metropolitan areas, it approximates the national average on mostregulatory factors, but three ways in which it departs from the national average are telling.
First, these metropolitan areas have more restrictive densities in their zoning ordinances thanthe national norm. While the share of jurisdictions with low density only zoning (a maximumresidential density permitted by zoning ordinance below 8 units per acre) and permissive high-density zoning resemble the national average, the share of the land area and population in thesejurisdictions is heavily weighted toward the low end of the density scale. On average, about 42percent of the land area and 20 percent of the population in Middle America metropolitan areashave low density-only zoning. This is substantially greater than the national averages of 19 and11 percent, respectively.
Second, Middle America has more modest commitments than the national average to infra-structure-based growth management. On average, 27 percent of the jurisdictions, 28 percent ofthe population, and 20 percent of the land area of Middle America is covered by impact fees.
21AUGUST 2006 • THE BROOKINGS INSTITUTION • RESEARCH BRIEF
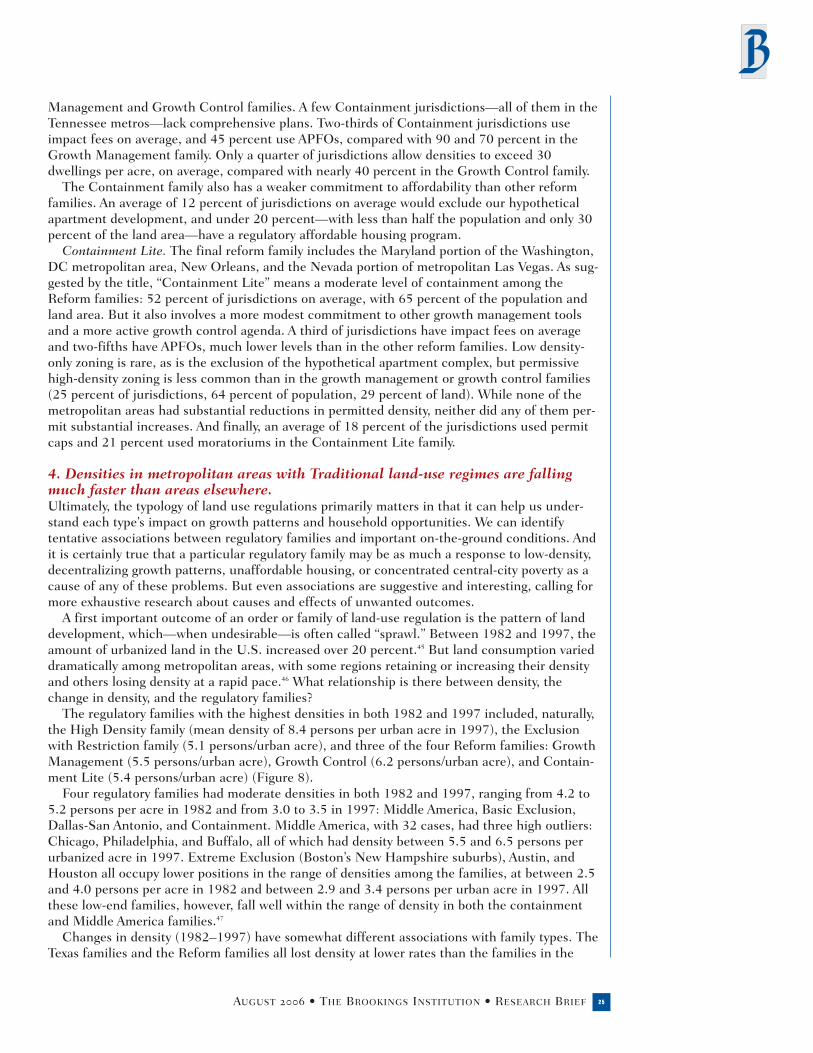
Table 3. Typology of Land Use Regulations, by Orders and Families,Major U.S. Metropolitan Areas, 2003
Regulatory Orders and Families Number of Metropolitan (or Sub-metropolitan) areas Total Population
Traditional 34 75,483,321
Middle America 32 61,459,742
High Density 2 14,023,579
Exclusion 5 14,621,514
Basic Exclusion 3 8,563,688
Exclusion with Restriction 1 5,287,393
Extreme Exclusion 1 770,433
Wild Wild Texas 4 12,733,518
Austin 1 1,249,763
Houston 1 4,669,571
Dallas/San Antonio 2 6,814,184
Reform 19 59,340,464
Containment 5 7,838,637
Containment-Lite 3 7,496,135
Growth Management 9 34,384,824
Growth Control 2 9,620,868
The national average is 37, 57 and 47 percent respectively. The use of APFOs in Middle Amer-ica similarly falls well below national averages.
Third, the Middle America metropolitan areas make very little use of affordable housingmechanisms. Although the share of jurisdictions using incentive programs or housing trustfunds departs little from the national average, the average share of the population and land areain jurisdictions covered by incentive programs and dedicated funding sources in Middle Amer-ica is about half the national average. This is perhaps because the central cities of thesemetropolitan areas tend to have large numbers of low cost rental units and have grown slowlyuntil recently. This makes regulatory approaches to affordability less attractive than the use ofstandard federal subsidies. In short, it appears that the large and medium sized cities as well asthe unincorporated areas of Middle America are less hospitable to both high density and afford-ability than the national average.
High Density. The second family in the Traditional order is distinguished from the MiddleAmerica family mainly by its openness to high density residential development, but it resemblesMiddle America in its moderate adoption of new planning tools. This family includes only twometro areas: the portions of the New York metropolitan area in New York state and the SaltLake City metropolitan area.
In this family, on average, the share of jurisdictions that allow densities above 30 dwellingsper acre is double the national average. The high-density population and land area in these met-ropolitan areas also exceed the national average. Furthermore, an average of one-quarter of thepopulation and 43 percent of the land area are in jurisdictions where maximum permissibledensity increased by over 10 percent since 1994, compared with just 10 and 7 percent for thenational average. The share of jurisdictions and land area in jurisdictions with impact fees alsoexceeds the national average in this regulatory family.
However, the high-density family also differs from the national average in its relatively lowuse of planning tools. As mentioned, New York City itself lacks a comprehensive plan and NewYork state does not require local governments to adopt comprehensive plans. On average 82percent of the jurisdictions in these areas are covered by comprehensive plans, but only half thepopulation and land area is. Urban containment and adequate public facilities ordinances, bothof which perform better in the presence of comprehensive planning, are also comparativelyweak in this family.
Exclusion. We call the second regulatory order “exclusion” for its extensive use of measuresthat restrict apartment construction. They also share a comparatively low use of tools to requirethat development “pay its own way.” Four of the five metropolitan components in this family aresuburban components of major cities (the Wisconsin suburbs on the far eastern fringe of met-ropolitan Minneapolis; the New Jersey suburbs of Philadelphia and New York; and Boston’sNew Hampshire suburbs); the fifth is the Massachusetts component of metropolitan Boston.Together they account for over 14 million residents. This order has three families.
Basic Exclusion. The first exclusionary family includes the entire state of New Jersey and thejurisdictions in the far eastern reaches of the Minneapolis metropolitan area in Wisconsin. Onaverage, about two-thirds of the jurisdictions in these areas have low density-only zoning andwould prohibit our hypothetical apartment development. These low density jurisdictionsaccount for about half the population and three-quarters of the land area. Furthermore, theshare of the population (18 percent) and land area (29 percent) covered by jurisdictions thathave reduced permitted density by over 10 percent in the past 10 years is well above thenational averages (7 and 5 percent, respectively.) An average of only three percent of jurisdic-tions containing 9 percent of the population in 3 percent of the land area would allowdevelopment above 30 dwellings per acre.
This family does have higher than average incidence of incentive-based affordable housingamong its jurisdictions (32 percent) and land area (34 percent) than the national averages (23and 30 percent, respectively). This is a consequence of the landmark Mount Laurel II ruling onhousing affordability and the New Jersey Fair Housing Act, which endorsed the use of inclu-sionary zoning as an affordable housing mechanism.41 Since New Jersey’s inclusionary zoninginstitutions have been developed mainly to address growing areas, however, only 41 percent of
22 AUGUST 2006 • THE BROOKINGS INSTITUTION • RESEARCH BRIEF
the population (on average for the family) is in jurisdictions with incentives, compared with 59percent nationwide.
Although comprehensive planning is generally at least as common as the national average—thanks probably to New Jersey’s planning statute—growth management tools are not widelyused in this family, with low incidence of containment mechanisms and infrastructure meas-ures.
Exclusion with Restriction. The second exclusionary family is the Massachusetts portion ofthe Boston metropolitan area. Nearly half of these jurisdictions, with 28 percent of its residentsand about half its land area, would bar our hypothetical apartment development. This level ofexclusion is not as high as the Basic Exclusion family, but it still much higher than the nationalaverage. Adding to the possibility for exclusion here, however, is the widespread adoption ofbuilding permit caps. An estimated 22 percent of jurisdictions, with 14 percent of the popula-tion and 22 percent of the land area, use permit caps—one of the highest rates of permit capadoption in the nation.
Like New Jersey, Massachusetts has legal institutions that permit the “builder’s remedy” as anoverride of exclusionary zoning. Perhaps as a defense mechanism against builders’ “Chapter40B” appeals, as the builder’s remedy is known, against local denials for permission to buildhigh-density and affordable housing, a large number of towns in the Boston suburbs (as well asBoston itself) have embraced density bonuses and inclusionary zoning.42 Over half the jurisdic-tions, with 60 percent of the population and half the land area, have incentive-based affordablehousing mechanisms of some kind.
Planning and growth management tools are weak in the Exclusion with Restriction family,with very low use of impact fees, APFOs, and containment. Only three-quarters of the jurisdic-tions have comprehensive plans.
Extreme Exclusion. Most exclusionary of all three of these families are the suburbs of Bostonin southern New Hampshire, where 84 percent of jurisdictions (47 percent of population, 81 percent of land area) have low density-only zoning and 79 percent (53 percent of population, 77 percent of land area) would bar our hypothetical apartment development. Moreover, like in Massachusetts, permit caps have caught on in the New Hampshire suburbs. An estimated 14 percent of municipalities use caps, accounting for 22 percent of the population and 16 per-cent of the land area. Permitted density has also fallen in the past 10 years in 19 percent ofjurisdictions with 17 percent of the land area.
Comparatively few local governments, with small shares of population and land area, useeither regulations or funds to support affordable housing. And although comprehensive plan-ning is ubiquitous in the New Hampshire suburbs, among the growth management tools, onlyimpact fees are as common as the national average.
Wild Wild Texas. The Texas metropolitan areas form a regulatory order of their own. Theyhave in common an unparalleled openness to growth and development. It all starts with zoning.Texas counties are not allowed to adopt zoning, nor can they adopt binding comprehensiveplans. Cities are authorized to zone unincorporated land within specified distances of their citylimits (up to five miles for the largest cities), but any land outside that extraterritorial jurisdic-tion is regulated only by minimal subdivision regulation. The variation in the three Texasfamilies is primarily on the degree to which “no zoning” dominates the landscape.43
Houston. The Houston metropolitan area is justifiably renowned for its lack of zoning. About45 percent of its jurisdictions have no zoning, and they include about 90 percent of the landarea and population. But the jurisdictions that do have zoning tend to be small enclaves thatuse zoning to exclude high-density development. Over half of jurisdictions would bar our hypo-thetical apartment development, but they include only 9 percent of the population and 20percent of the land area in the region.
Planning is weak in Houston; only 63 percent of the jurisdictions, with just over a quarter ofthe population, have comprehensive plans. But other growth management tools, especiallythose to manage infrastructure, are common among the larger jurisdictions, with three-quartersof the population living in incorporated jurisdictions with APFOS and 85 percent of the popula-tion with impact fees.
23AUGUST 2006 • THE BROOKINGS INSTITUTION • RESEARCH BRIEF
Dallas and San Antonio. In these two metropolitan areas, unlike Houston, the incorporatedcities tend to have zoning, and because most of the growth has occurred in or near incorporatedlimits, much more development is subject to zoning. Also unlike Houston, very few cities useexclusionary devices or would bar our hypothetical apartment complex. Infrastructure regula-tion is commonplace among the cities, with around three-quarters of the municipalities usingimpact fees, especially the larger ones; about a third use APFOs, but they tend to be smallerjurisdictions. Other growth management tools are less common and permit caps are not used.About a quarter of the cities, with an average of about 75 percent of the municipal population,use affordable housing programs.
Austin. The degree of regulation in Austin is not too dissimilar from the Dallas-San Antonioregulatory family. The main difference is in the use of comprehensive plans. Most of the juris-dictions we surveyed in these three metropolitan areas have a comprehensive plan, includingthe large ones. About 30 percent of the population of the metropolitan area and 46 percent ofthe land area is covered.44
Reform. The final regulatory order includes four very distinct families with a range of metro-politan areas that use tools beyond comprehensive plans, zoning, and subdivision regulation tomanage and control land use. They differ mainly in the extent to which they include localaffordable housing measures, in their emphasis on containment or infrastructure regulation,and in the importance of building-permit caps in the regulatory toolkit.
Growth Management. The Growth Management family includes nine metropolitan areas: fivein Florida, Phoenix, and three in California. It is so called because of the high use of contain-ment policies and infrastructure management as logical counterpoints to zoning ordinancesthat permit comparatively high-density housing development.
This family features universal adoption of comprehensive plans. Also, on average over a quar-ter of the jurisdictions, with 41 percent of the population and 55 percent of the land area, havecontainment mechanisms. An average of 88 percent of the jurisdictions (88 percent of popula-tion, 86 percent of land area) impose impact fees, and 69 percent have APFOs.
A third of the jurisdictions, with an average of 62 percent of the population and 46 percentof the land area, have a residential density zoning category that exceeds 30 dwellings per acre,and an average of 17 percent of jurisdictions have increased their permitted maximum densityby over 10 percent between 1994 and 2003. Only five percent of jurisdictions dropped theirmaximum density by more than 10 percent. And just three percent of the population in theseplaces—containing only one percent of the land area—would bar the multi-family apartmentdevelopment.
Moreover, over half the jurisdictions on average in the growth management family haveaffordable housing programs, with an average of 45 percent using dedicated funds for afford-able housing. These tend to be populous and extensive jurisdictions, so that 75 to 80 percent ofthe population of the average growth-management metropolitan area lives in jurisdictions withactive housing programs.
Growth Control. The second reform family, Growth Control, is made up of just two metropol-itan areas: Denver and San Francisco. This family closely resembles the Growth Managementfamily in the extensiveness of planning, its zoning framework, the importance of impact fees,and its use of affordable housing programs. But unlike Growth Management, the Growth Con-trol family ranks first in the use of permit caps: a quarter of jurisdictions on average use them,accounting for about a fifth of the population and land area. The Growth Control family alsomakes more extensive use of containment (62 percent of jurisdictions, 83 percent of land area)than the Growth Management family. APFOs, by contrast, rank less important on average thanin any of the Reform families; this suggests that APFOs and permit caps may be substitutes forone another.
Containment. This family includes Seattle, Portland, Nashville, Memphis, and the Arizonacomponent of the Las Vegas metropolitan area. As its name indicates, this family depends muchmore than the others on containment mechanisms, averaging 80 percent of jurisdictions (85percent of population, 87 percent of area), largely a consequence of mandates in state growthmanagement laws. Other land use tools are weaker on average in this family than in the Growth
24 AUGUST 2006 • THE BROOKINGS INSTITUTION • RESEARCH BRIEF
Management and Growth Control families. A few Containment jurisdictions—all of them in theTennessee metros—lack comprehensive plans. Two-thirds of Containment jurisdictions useimpact fees on average, and 45 percent use APFOs, compared with 90 and 70 percent in theGrowth Management family. Only a quarter of jurisdictions allow densities to exceed 30dwellings per acre, on average, compared with nearly 40 percent in the Growth Control family.
The Containment family also has a weaker commitment to affordability than other reformfamilies. An average of 12 percent of jurisdictions on average would exclude our hypotheticalapartment development, and under 20 percent—with less than half the population and only 30percent of the land area—have a regulatory affordable housing program.
Containment Lite. The final reform family includes the Maryland portion of the Washington,DC metropolitan area, New Orleans, and the Nevada portion of metropolitan Las Vegas. As sug-gested by the title, “Containment Lite” means a moderate level of containment among theReform families: 52 percent of jurisdictions on average, with 65 percent of the population andland area. But it also involves a more modest commitment to other growth management toolsand a more active growth control agenda. A third of jurisdictions have impact fees on averageand two-fifths have APFOs, much lower levels than in the other reform families. Low density-only zoning is rare, as is the exclusion of the hypothetical apartment complex, but permissivehigh-density zoning is less common than in the growth management or growth control families(25 percent of jurisdictions, 64 percent of population, 29 percent of land). While none of themetropolitan areas had substantial reductions in permitted density, neither did any of them per-mit substantial increases. And finally, an average of 18 percent of the jurisdictions used permitcaps and 21 percent used moratoriums in the Containment Lite family.
4. Densities in metropolitan areas with Traditional land-use regimes are fallingmuch faster than areas elsewhere.Ultimately, the typology of land use regulations primarily matters in that it can help us under-stand each type’s impact on growth patterns and household opportunities. We can identifytentative associations between regulatory families and important on-the-ground conditions. Andit is certainly true that a particular regulatory family may be as much a response to low-density,decentralizing growth patterns, unaffordable housing, or concentrated central-city poverty as acause of any of these problems. But even associations are suggestive and interesting, calling formore exhaustive research about causes and effects of unwanted outcomes.
A first important outcome of an order or family of land-use regulation is the pattern of landdevelopment, which—when undesirable—is often called “sprawl.” Between 1982 and 1997, theamount of urbanized land in the U.S. increased over 20 percent.45 But land consumption varieddramatically among metropolitan areas, with some regions retaining or increasing their densityand others losing density at a rapid pace.46 What relationship is there between density, thechange in density, and the regulatory families?
The regulatory families with the highest densities in both 1982 and 1997 included, naturally,the High Density family (mean density of 8.4 persons per urban acre in 1997), the Exclusionwith Restriction family (5.1 persons/urban acre), and three of the four Reform families: GrowthManagement (5.5 persons/urban acre), Growth Control (6.2 persons/urban acre), and Contain-ment Lite (5.4 persons/urban acre) (Figure 8).
Four regulatory families had moderate densities in both 1982 and 1997, ranging from 4.2 to5.2 persons per acre in 1982 and from 3.0 to 3.5 in 1997: Middle America, Basic Exclusion,Dallas-San Antonio, and Containment. Middle America, with 32 cases, had three high outliers:Chicago, Philadelphia, and Buffalo, all of which had density between 5.5 and 6.5 persons perurbanized acre in 1997. Extreme Exclusion (Boston’s New Hampshire suburbs), Austin, andHouston all occupy lower positions in the range of densities among the families, at between 2.5and 4.0 persons per acre in 1982 and between 2.9 and 3.4 persons per urban acre in 1997. Allthese low-end families, however, fall well within the range of density in both the containmentand Middle America families.47
Changes in density (1982–1997) have somewhat different associations with family types. TheTexas families and the Reform families all lost density at lower rates than the families in the
25AUGUST 2006 • THE BROOKINGS INSTITUTION • RESEARCH BRIEF
Traditional and Exclusionary orders. Considering that the Texas families began with extremelylow density, especially Austin, they had many opportunities for infill and increasing density,especially in the face of rapid growth. Dallas and San Antonio lost about 4 percent and 7 per-cent of their density, respectively; Houston lost 9 percent; and Austin gained 14 percent. Thebig surprise is that the figures for the three densest Reform families (excluding “Containment”),where density was already fairly high in 1982, did not decline much in the 1980s and 1990s.The Growth Management family lost 2 percent on average and the Growth Control family lost6 percent. The Containment Lite family was essentially unchanged.
The Traditional and Exclusionary orders lost substantial density in the 1980s and 1990s.Nowhere was this clearer than in the Exclusionary order, where density declined by averagesbetween 23 and 27 percent. The loss was almost as great in the Middle America family, wherethe average density decline was 19 percent.
The Containment family is the exception to the rule that Reform families tended to lose lessdensity than the Exclusion families. Density dropped an average of 15 percent in the five Con-tainment metro areas. The decline is a consequence of the inclusion in this family of Memphisand Nashville, where density dropped 28 and 35 percent, respectively. Neither of these tworegions would have registered as “Containment” had the survey been taken between 1982 and1997, because Tennessee’s mandate for urban growth boundaries did not become law until2001.48 But even Portland and Seattle, where containment policies have had a longer run, lostmore density than most of the other Reform families did on average.
How do we explain these differences? Traditional zoning continues to dominate the North-east and Midwest, where urbanization has left a legacy of high-density urban cores. With theexception of New York, where redevelopment and immigration have led to new growth in thecentral city, the regions that rely on traditional zoning are losing that historic density at veryrapid rates. The density loss is especially acute in regions where exclusionary land use prevailsand is combined with controls on the issuance of building permits.
26 AUGUST 2006 • THE BROOKINGS INSTITUTION • RESEARCH BRIEF
Figure 8. Density (persons per urban acre), Regulatory Families, 1982 and 1997
10
9
8
7
6
5
4
3
2
1
0
Pers
on
s p
er u
rban
acr
e
Mid
-Am
eric
a
Hig
h D
ensi
ty
Dal
las-
San
An
ton
io
Au
stin
Ho
ust
on
Bas
ic
Plu
s Re
stri
ctio
n
Extr
eme
Gro
wth
Man
agem
ent
Gro
wth
Co
ntr
ol
Co
nta
inm
ent
Co
nta
inm
ent-
Lite
Traditional Wild Wild Texas Exclusion Reform
19821997
The Wild Wild Texas order, where zoning is less powerful than elsewhere but where “pay-as-you-grow” has taken root broadly, tend like the Traditional zoning families to have fairly lowbase density, but they also have not lost as much density as some of the faster-growing metro-politan areas in the Middle America family. For example, Austin’s density shot up by 14 percent,leading it to surpass more exclusionary Atlanta between 1982 and 1997. Houston, the least-zoned region in the U.S., lost less than 10 percent of its density.
Reform families tend to be strongest in higher-density areas, and vice versa. The cause-effectrelationship here is unclear and probably works both ways. A combination of “pay as you grow”regulations on infrastructure, permissive high-density zoning, and urban containment is likelyto increase density over the long run. But high density in the established urban fabric can alsomake urban containment and infrastructure controls politically more expedient and necessarybecause residents in high-density areas would logically press for measures to give them relief.Urban growth boundaries tell urban residents that they can get beyond the endless sea of devel-opment into valued open spaces, and infrastructure controls mitigate the impact of density.
The Containment family stands out as unusual within the Reform order for having lowerdensity and for having lost more density in the 1980s and 1990s. Again, the cause and effectrelationship here is important to consider in future research. Rapid sprawl in Tennessee mayhave played some role in that legislature’s adoption of urban growth boundaries in the early2000s. Similarly, Washington did not adopt its growth management act until 1990, exactly inthe middle of the 1982-1997 period over which land use data are available. Several observers,too, have noted that Portland’s urban growth boundary was defined with substantial room forexpansion in the early 1980s.49 It is possible, then, that containment has not had adequate timeto work. But it should also be recalled that the Containment family is less active at regulatinginfrastructure and less accommodating to high-density zoning than the other reform families.Further investigation should be done to determine whether Containment regions could accom-modate or encourage higher density by pursuing more aggressive increases in permitted density.
5. Central cities are high-value places for residents of the Texas and Reform areasbut frequently contain most of the “neighborhoods of last resort” in Traditional andExclusionary places. To some, the term “central city” conjures up bleak images of abandonment and deterioration.Such images, however, do not apply in all U.S. metropolitan areas. Research shows that as of1990, the majority of 508 central cities were “healthy,” including subsets of “competitive,” “sun-belt,” and “knowledge” central cities.50 Among the “stressed” central cities about 11 percent ofthe total was “stereotypical” distressed central cities and about another third were “manufactur-ing” central cities.
It is likely that regulatory orders and families shape the central cities of metropolitan areas inwhich they’re located.51 To identify the extent to which certain kinds of people or householdsare concentrated in central cities, we computed the poverty rates, percent black, percent His-panic, percent college educated, and home ownership rates separately for central cities andsuburbs of each metro area or component. We then divided the central city percent by the sub-urban percent to yield an index of concentration. For example, if the poverty rate in the centralcities of a metro area was 20 percent while poverty outside the metro area’s central city was 10percent, the central city poverty concentration would be 2.0. If these were reversed, the povertyconcentration would be 0.5.
Our research definitely suggests a relationship between regulatory orders and families, on theone hand, and central city opportunity or distress.52 Central cities in the Traditional and Exclu-sion areas have very high concentrations of low income people and people of color and lowconcentrations of college graduates and homeowners. By contrast, the Wild Wild Texas andReform areas have higher concentrations of college graduates and home owners in their centralcities than in their suburbs. And while black and Hispanic residents as well as people living inpoverty are still concentrated in the central cities of these metropolitan areas, they are muchmore dispersed to suburban jurisdictions than in the other two major orders (Table 4).
27AUGUST 2006 • THE BROOKINGS INSTITUTION • RESEARCH BRIEF
Concentrated Poverty. On average, in both 1990 and 2000, the Traditional and Exclusionaryorders have central city poverty rates three times higher than their suburban poverty rates. Inthe Detroit, Rochester, Buffalo, Minneapolis, Philadelphia, Hartford, and Milwaukee metropol-itan areas —all in the Middle America family—the central city poverty exceeded suburbanpoverty by a factor of at least four.
The Reform order places occupied the other end of the spectrum, with an average povertyconcentration index of just 1.9: still uncomfortably high, but very much lower than in the Tradi-tional and Exclusionary orders. Las Vegas, San Diego, West Palm Beach, and Phoenix all hadpoverty concentration indices below 1.5. In 2000 the only non-Reform family metropolitan areawith poverty concentration below 1.5 was Charlotte. In Texas, the average level of concentratedpoverty was 2.14, substantially lower than in the Exclusionary order but somewhat higher thanin the Reform metropolitan areas.53
Concentrated Black Population. The Middle America metro areas had far and away thehighest concentration of black residents in both 1990 and 2000.54 The average central city con-centration in 2000 was 6.2 times the suburban concentration.55 Moreover, this high average isnot simply an artifact of one or two outliers. Detroit, Indianapolis, Rochester, Buffalo, and Mil-waukee all had central city black concentrations of at least 10.0 (i.e., the percent black in thecentral city was over 10 times that in the suburbs), as did the portion of the Chicago metropoli-tan area in Indiana (i.e., Gary). The Exclusionary metropolitan areas ranked lower than theMiddle America families, with an average value of about 4.2.
Texas had the lowest concentrations of black residents in central cities in 2000, just below2.0, although this does obscure a range among the four metropolitan areas from 1.0 (San Anto-nio) to 2.6 (Dallas). The Reform and High Density orders both averaged around 2.7. Among theReform areas, Portland (6.4), Nashville (4.3), and Jacksonville (4.3) all had concentrationindices above 4.0.
Concentrated Hispanic Population. The Exclusionary metropolitan areas had the highestconcentration of Hispanic population in both 1990 and 2000 with average values exceeding 4.0in both years. This high concentration probably relates to the racial composition of the His-panic population in the Exclusionary metropolitan areas, most of which have Hispanicpopulations with large shares of Afro-Caribbean Latinos (Puerto Rican, Dominican). The high-est-ranking metropolitan area for Hispanic concentration is the portion of the Philadelphiametropolitan area in New Jersey (i.e., Camden). New Haven, Rochester, Hartford, Milwaukee,and Buffalo all had Hispanic concentrations exceeding 5.0 in 2000. The Middle America andHigh Density families had averages of 2.7 and 2.4 in 2000.
The Reform metropolitan areas had very low Hispanic concentrations, 1.26 on average; thosein Texas had somewhat higher concentrations, averaging 1.8. The lowest concentrations were inthe Maryland portion of Washington (0.4), New Orleans (0.6), Atlanta (0.7), Portland (0.8), theIllinois portion of St. Louis (0.9), and San Diego (1.0). The presence of several Middle Americaplaces in the list of lowest Hispanic concentration balanced the high concentration in the Mid-dle America metropolitans in the Northeast, most of which also have heavy representations ofPuerto Rican and Dominican residents among their Hispanic population.56
Homeownership. The ratio between central city and suburban home ownership rates doesnot exceed 1.0 in any of the areas we studied, but it was highest in 2000, on average, in theReform order, averaging about 0.7, a level that varied little among the four families. None of the other families had a ratio exceeding 0.7. The Middle America family followed the Reformfamily, with a ratio of 0.7 in 2000; this was about the level of two of the three Wild Wild Texasfamilies (Dallas-San Antonio and Houston), with Austin lagging the other Texas families in part thanks to the large number of college students in the city of Austin’s rental housing market.The High Density, Basic Exclusion, and Exclusion with Restriction families all had ratiosmatching Austin’s. Among the Exclusionary families, only Extreme Exclusion had a slightlyhigher ratio of 0.7.
College graduates. The Reform families also appear at the top in the ratio between centralcity and suburban percent college graduates in 2000, with an average of 1.1. Only Contain-ment Lite had a ratio below 1.0. In other words, the average central city in these families had
28 AUGUST 2006 • THE BROOKINGS INSTITUTION • RESEARCH BRIEF
a higher share of college graduates than the average suburban area. Wild Wild Texas, espe-cially Austin, followed the Reform families. The High Density family also has a relatively high(1.0) average concentration of college graduates in the central city, a function not of theattractiveness of New York City (where the ratio is 0.8) but that of Salt Lake City (whose ratiois 1.1) to their regions’ college graduates. Exclusionary areas have by far the lowest concentra-tion of college graduates in their central cities, 0.6 on average, a level brought down by the 0.5ratio in the New Jersey’s Basic Exclusion suburbs of Philadelphia and New York.57 But evenBoston’s Exclusion with Restriction ratio is fairly low (0.7) compared with the Reform metro-politan areas.
6. Housing prices are highest in the Growth Control and Exclusionary regions.For at least 20 years, the main metric that has been used to determine the impact—and theacceptability—of land use regulations has been the cost of housing (and usually the sale priceof owner-occupied housing). While this study does not evaluate whether particular regulatoryapproaches cause higher housing costs, it does identify those that associate with systematicallyhigher self-reported housing values and contract rent.58
As reflected in Table 5, by far the highest housing prices in the U.S. are in the Growth Con-trol metropolitan areas, owing mainly to the sky-high prices of the San Francisco metropolitanarea. The average rent there in 2000 (around the peak of the dot-com bubble) was $970, about$75 higher than the average in the Virginia suburbs of Washington, DC (the next highestregion). The average house value in the San Francisco metropolitan area that year was nearly$425,000, a value $130,000 higher than in the next-highest New Haven area. Rents and homeprices in metropolitan Denver, the other Growth Control family, are much lower than in SanFrancisco ($680 average rent, $220,000 average housing value), but the most “growth con-trolled” parts of the Denver metropolitan area (Boulder County) have high prices that arebalanced by lower prices elsewhere in the metropolitan area. Thus it appears inarguable that
29AUGUST 2006 • THE BROOKINGS INSTITUTION • RESEARCH BRIEF
Table 4. Suburban opportunity, major families, 1990 and 2000
Average ratio of central city to suburbs
Regulatory Regulatory % Home
Order Family Poverty % Black % Hispanic Ownership % College
1990 2000 1990 2000 1990 2000 1990 2000 2000
Traditional Middle America 3.08 3.00 8.43 6.25 2.73 2.71 0.70 0.69 0.89
High Density 3.03 2.96 3.44 2.70 2.94 2.38 0.55 0.55 0.97
Total 2.63 2.60 6.02 4.61 2.30 2.30 0.70 0.69 0.94
Sources: 1990 and 2000 U.S. census of Population and Housing, Summary File 3 (Poverty)
and Summary File 1 (Black, Hispanic), extracted from the State of the Cities Data
System, accessed June 2005 at http://socds.huduser.org/index.html
the Growth Control regulatory family, which combines a series of locally imposed and generallyuncoordinated urban growth boundaries with widespread building permit caps, associates withhigh housing prices.
The other Reform families associate much less strongly with high housing prices. Averagerent in the Growth Management family is $640, and average home value is about $185,000.The Containment and Containment Lite families had still lower rents ($554 and $580, respec-tively) and house values (about $170,000 and and $160,000), on average. The High Densityfamily also has very high housing prices because of New York City. Salt Lake City has moremodest, but still higher than national average, housing costs.
The Exclusionary places also tend to have higher prices than the national average. Boston’sExclusion with Restriction leads, with average rent of $677 and housing value of nearly$250,000 in 2000. Basic Exclusion and Extreme Exclusion have somewhat lower average rentsof $598 and $618, respectively, and housing values in the $170,000 to $180,000 range. In Mid-dle America a large share of the rental housing stock is old; new development at the urbanfringe has left large amounts of housing vacant in many central cities. Contract rents in theseregions, consequently, are the lowest of any regulatory family on average ($522).59 Averagehouse values are also very low at around $145,000.
The less regulated environments of Dallas-San Antonio and Houston have the lowest averagehouse values of the metropolitan areas we examined at $115,000 and $125,000, respectively.But their rents, at about $550, are higher than the average contract rent of just $520 amongthe Middle America metropolitan areas. The Austin metropolitan area was much closer to theother two areas in Texas in 1990, but the fast growth of well paid technology employment raisedAustin’s average rent to $663 and its average house value to almost $165,000.
30 AUGUST 2006 • THE BROOKINGS INSTITUTION • RESEARCH BRIEF
Table 5. Housing prices by family, 1990 and 2000
Average Rent Average Value
Regulatory Order Regulatory Family 1990 2000 1990 2000
Traditional Middle America $376 $522 $98,366 $147,768
High Density 423 658 153,239 225,327
Exclusion Basic Exclusion 455 598 135,431 177,241
Exclusion with Restriction 533 677 194,873 249,089
Extreme Exclusion 521 618 154,400 170,855
Wild Wild Texas Dallas-San Antonio 371 550 84,147 117,068
Austin 375 663 91,627 164,223
Houston 365 547 82,977 124,074
Reform Containment 377 554 99,221 168,700
Containment Lite 428 580 114,070 160,105
Growth Control 536 825 194,739 322,102
Growth Management 482 640 139,857 183,885
Total $409 $570 $113,535 $165,747
IV. Pulling it all Together: A Summary of the Impacts of Regulation
Local zoning and comprehensive plans are the default land use regulations in theUnited States. The Middle America and Exclusionary families are still dominated bylocal governments that rely primarily, or even exclusively, on these tools and very littleon growth management measures. Metropolitan areas in these families have a series
of regional problems not associated with most reform families. They are less dense. They haveless opportunity for low income residents and minority households to live in suburbs. They offerless opportunity for people to own homes in central cities, and have central cities that appealless to college graduates. The Exclusionary metropolitan areas also have fairly high housingprices. The end result is that these places fail on multiple indicators. To the extent that theirregulatory environments are in part responsible for those failures, wholesale regulatory reformis probably called for.
Metropolitan areas in the Middle America family suffer from many of the same problems ofsprawl and segregation that the Exclusionary families do. In their favor are lower average hous-ing prices. It is likely, however, that for low income households, blacks, and Hispanics, theselow housing prices buy lower quality living environments and public services. We need to knowmore about the precise dynamic that supports a combination of low housing prices, rapidsprawl, a high concentration of disadvantaged people in central cities, and weak home owner-ship attainment for central city residents compared with their suburban counterparts. To theextent that regulatory reform can reduce the worst of the problems without raising housingcosts to unsustainable levels, such reform is probably called for.
Wild Wild Texas presents the closest thing the United States has to land use deregulation.60
How does this deregulation play out? With the exception of booming high-tech Austin, it haslower home prices than most other Sunbelt areas. Texas’ large metropolitan areas also havelower concentration of poverty and minority residents, and higher home ownership and collegegraduation concentrations in central cities than the exclusionary families. Finally, density didnot drop much in the Texas metropolitan areas in the 1980s and 1990s, and in Austin densityincreased. But Houston, Dallas, Austin, and San Antonio started out as some of the least denselarge metropolitan areas in the United States, and maintaining that level of density shouldhardly be treated as a badge of honor. Continued low density development in Texas, especiallyin fringe and unincorporated areas with little or no regulation to mitigate environmentalimpacts, is bound to produce environmental, economic, and social costs that will mount withthe decades. This is especially true to the extent that rural development occurs in flood andhurricane prone areas. Internalizing some of these costs would undoubtedly mean higher hous-ing prices, a trade-off that the Texas Legislature has been generally slow to accept in the past.
The Reform families offer almost the polar opposite of either the Traditional or the Wild WildTexas regulatory families. Generally, they are denser both as a current picture and over time,and they offer more regional opportunity for low-income residents, blacks, and Hispanics thanthe other families. These good outcomes come at the cost of higher average housing costs. Buthousing costs are much higher when reform turns growth management into growth control,choking off development inside urban growth boundaries as well as beyond them. In the otherReform families, especially Containment and Containment Lite, rents and housing values aresubstantially lower than in the Exclusionary metropolitan areas. To the extent that regulatoryreform should be pursued in the Reform families, it can build upon strong comprehensive plan-ning and permissive zoning to pursue more thorough land supply monitoring and incentives forlocal governments to designate much more land for housing development at medium and highdensities.
31AUGUST 2006 • THE BROOKINGS INSTITUTION • RESEARCH BRIEF
These summary observations must be treated as syntheses of correlations, not as direct state-ments of cause and effect. More research is needed to learn about the mutually supportiverelationships among regulation, housing prices, sprawl, and regional opportunity.
It is clear, however, that state policies set the framework for the regulatory regimes that existon the metropolitan and sub-metropolitan level. The reason the Texas metropolitan areasresemble each other is due, in part, to the unique traditions, history and growth trends in thatstate—but they are also profoundly impacted by the fact that counties are not given independ-ent planning and zoning authority. By the same token, all the Florida metropolitan areas weexamined are in the Growth Management category because Florida is one of a handful of stateswith a strong state program. Municipalities in Virginia, by contrast, complain bitterly about thedearth of state attention to growth issues and the lack of discretionary authority afforded tothem by the state to manage growth beyond traditional mechanisms.
In the end, the important role of the states in setting the regulatory regimes identified herecannot be overemphasized.
V. Conclusion
Driven by concern about sprawl, traffic, open space, infrastructure capacity and costs;state and local governments throughout the U.S. are in the throes of a long termprocess of reform in their land use policies. In none of these states and local gov-ernments is the discussion a choice between regulation and no regulation. Rather,
they are choosing either more or different regulation. As a practical matter, then, the contestable argument that total deregulation will produce
better results across a wide array of indicators is not really worth addressing. The real focus ofany analysis going forward should be the alternatives between better and worse systems of landuse regulation.
32 AUGUST 2006 • THE BROOKINGS INSTITUTION • RESEARCH BRIEF
33AUGUST 2006 • THE BROOKINGS INSTITUTION • RESEARCH BRIEF
App
endi
x. R
esul
ts o
f Fa
ctor
Ana
lysi
s, b
y m
etro
poli
tan
area
(or
par
t) a
nd r
ank.
Met
ropo
lita
n Z
onin
gC
onta
in-
Infr
astr
uctu
reG
row
th C
ontr
olA
ffor
dabl
e
area
or
part
Reg
ion
Fam
ily
Exc
lusi
onN
o Z
onin
gP
lann
ing
men
tIm
pact
Fee
AP
FO
Mor
ator
iaP
erm
it C
apH
ousi
ng
Atl
anta
S
Mid
dle
Am
eric
a0.
35 (
28)
-0.3
5 (4
5)0.
49 (
42)
-0.9
9 (6
5)-0
.75
(52)
-0.1
1 (4
5)0.
29 (
43)
-0.3
9 (5
9)-0
.78
(57)
Aus
tin
SA
usti
n-0
.57(
52)
2.21
(3)
-1.8
2 (7
1)-0
.66
(49)
0.69
(19
)-1
.43
(69)
0.39
(35
)-0
.35
(56)
0.93
(13
)
Bos
ton
(MA
)N
EE
xclu
sion
wit
h R
estr
icti
on1.
19 (
8)-0
.68
(64)
-1.0
8 (6
5)-0
.79
(56)
-1.0
9 (6
8)0.
00 (
39)
-0.7
3 (6
6)3.
17 (
2)0.
74 (
17)
Bos
ton
(NH
) N
EE
xtre
me
Exc
lusi
on2.
12 (
3)-1
.08
(70)
0.67
(1)
-0.4
0 (3
7)-0
.07
(32)
-0.3
7 (5
2)-0
.51
(61)
3.01
(3)
-0.4
8 (4
6)
Buf
falo
N
EM
iddl
e A
mer
ica
0.65
(18
)-0
.51(
53)
-0.3
2 (5
0)-0
.99
(64)
-0.5
3 (4
7)0.
08 (
32)
0.35
(41
)0.
35 (
14)
-0.3
2 (3
8)
Cha
rlot
te (
NC
)S
Mid
dle
Am
eric
a-0
.55
(51)
-0.3
(42
)0.
16 (
44)
-0.2
9 (3
4)-0
.62
(49)
0.76
(11
)0.
07 (
56)
-0.0
2 (2
0)0.
42 (
21)
Cha
rlot
te (
SC
)S
*-0
.41
(41)
0.49
(12
)0.
67 (
1)-1
.05
(66)
0.46
(25
)-2
.67
(72)
0.58
(1)
-0.2
7 (2
9)-1
.25
(69)
Chi
cago
(IL
)M
WM
iddl
e A
mer
ica
0.42
(25
)0.
86 (
9)-1
.26
(66)
-0.6
0 (4
5)0.
05 (
29)
-0.9
7 (6
5)0.
55 (
17)
-0.1
9 (2
4)-0
.47
(44)
Chi
cago
(IN
)M
WM
iddl
e A
mer
ica
0.38
(26
)-0
.34
(44)
0.67
(1)
0.07
(28
)-1
.08
(66)
-0.0
2 (4
0)0.
50 (
21)
-0.0
5 (2
1)-0
.47
(45)
Chi
cago
(W
I)M
WM
iddl
e A
mer
ica
0.38
(27
)-0
.17
(31)
-0.1
8 (4
5)0.
47 (
22)
-0.3
1 (3
8)-1
.36
(68)
0.37
(37
)0.
12 (
18)
-1.0
2 (6
1)
Cin
cinn
ati (
IN)
MW
*0.
55 (
20)
-0.2
4 (3
5)0.
67 (
1)-0
.89
(62)
-1.0
9 (6
7)0.
03 (
38)
0.27
(45
)0.
61 (
11)
-1.1
8 (6
7)
Cin
cinn
ati (
KY)
S
Mid
dle
Am
eric
a-0
.41
(45)
0.27
(17
)0.
67 (
1)0.
69 (
17)
-0.2
9 (3
7)2.
49 (
2)0.
58 (
1)-0
.27
(29)
-0.5
6 (5
1)
Cin
cinn
ati (
OH
) M
WM
iddl
e A
mer
ica
0.87
(12
)0.
70 (
10)
-0.6
4 (5
9)-0
.46
(40)
-1.0
2 (6
0)0.
31 (
22)
0.18
(48
)-0
.44
(61)
-0.6
9 (5
3)
Cle
vela
nd
MW
Mid
dle
Am
eric
a0.
78 (
14)
0.86
(8)
-0.6
0 (5
7)-0
.74
(50)
-0.7
9 (5
5)0.
07 (
33)
0.19
(47
)-0
.29
(43)
-0.4
1 (4
2)
Col
umbu
sM
WM
iddl
e A
mer
ica
0.90
(11
)0.
60 (
11)
-0.9
5 (6
2)-0
.78
(54)
-0.9
8 (5
9)0.
27 (
24)
-0.5
0 (6
0)-0
.72
(69)
-0.3
1 (3
7)
Dal
las
SD
alla
s-S
an A
nton
io-0
.42
(46)
1.57
(6)
0.53
(39
)-0
.62
(46)
1.04
(14
)-0
.49
(55)
0.36
(39
)-0
.37
(58)
-0.1
3 (3
3)
Den
ver
WG
row
th C
ontr
ol-1
.10
(66)
-0.3
7 (4
6)0.
67 (
1)2.
01 (
5)0.
72 (
18)
-0.6
5 (5
7)-1
.33
(68)
3.96
(1)
0.27
(27
)
Det
roit
M
WM
iddl
e A
mer
ica
0.49
(23
)-0
.13
(28)
0.54
(38
)-0
.41
(38)
-1.0
3 (6
1)0.
16 (
30)
0.47
(25
)-0
.31
(47)
-0.7
3 (5
5)
Gra
nd R
apid
sM
WM
iddl
e A
mer
ica
0.76
(15
)-0
.10
(27)
0.49
(41
)-0
.53
(42)
-1.0
5 (6
2)0.
10 (
31)
0.39
(34
)-0
.35
(55)
-1.0
4 (6
2)
Gre
ensb
oro
SM
iddl
e A
mer
ica
-0.4
0 (4
0)-0
.21
(33)
-0.2
3 (4
8)0.
10 (
27)
-0.7
9 (5
4)0.
64 (
13)
0.51
(19
)-0
.24
(26)
0.09
(31
)
Har
tfor
dN
EM
iddl
e A
mer
ica
1.51
(5)
-0.5
8 (5
8)0.
65 (
34)
-0.8
0 (5
8)-1
.07
(65)
0.39
(19
)0.
14 (
49)
-0.4
6 (6
2)-0
.34
(39)
Hou
ston
S
Hou
ston
0.72
(17
)4.
71 (
1)-2
.55
(72)
-1.0
5 (6
6)0.
61 (
21)
0.26
(26
)0.
58 (
1)-0
.27
(29)
0.42
(22
)
Indi
anap
olis
MW
Mid
dle
Am
eric
a-0
.17
(35)
-0.2
7 (3
6)0.
67 (
1)-0
.94
(63)
-1.1
0 (6
9)0.
04 (
36)
0.21
(46
)0.
72 (
10)
-0.6
6 (5
2)
Jack
sonv
ille
SG
row
th M
anag
emen
t-1
.00
(63)
-0.3
0 (3
9)0.
67 (
1)-0
.04
(31)
1.64
(6)
2.75
(1)
-0.1
3 (5
8)-0
.57
(67)
1.56
(6)
Kan
sas
Cit
y (K
S)
MW
Mid
dle
Am
eric
a-0
.50
(49)
-0.6
8 (6
5)0.
67 (
1)-0
.75
(51)
-0.0
3 (3
0)-0
.66
(58)
0.58
(1)
-0.2
7 (2
9)-1
.13
(64)
Kan
sas
Cit
y (M
O)
MW
Mid
dle
Am
eric
a0.
02 (
33)
0.02
(24
)-0
.21
(47)
-0.6
3 (4
7)0.
20 (
27)
0.78
(10
)0.
41 (
31)
-0.0
7 (2
2)-1
.19
(68)
Las
Veg
as (
AZ)
WC
onta
inm
ent
-0.6
9 (5
4)0.
14 (
21)
0.67
(1)
1.29
(9)
0.60
(22
)2.
19 (
3)0.
58 (
1)-0
.27
(29)
-1.2
5 (6
9)
Las
Veg
as (
NV
)W
Con
tain
men
t-L
ite
-0.9
4 (6
1)-0
.18
(32)
0.67
(1)
0.80
(14
)0.
12 (
28)
-0.1
1 (4
4)-0
.54
(62)
1.62
(6)
-0.3
5 (4
0)
Los
Ang
eles
W
Gro
wth
Man
agem
ent
-0.9
3 (6
0)-0
.30
(40)
0.60
(37
)-0
.27
(33)
0.77
(16
)-0
.70
(59)
0.13
(50
)0.
79 (
9)1.
97 (
4)
Lou
isvi
lle (
IN)
MW
Mid
dle
Am
eric
a0.
52 (
22)
-0.2
3 (3
4)0.
67 (
1)-0
.65
(48)
-1.0
6 (6
3)-0
.04
(41)
0.42
(28
)0.
17 (
16)
-1.1
5 (6
6)
Lou
isvi
lle (
KY)
S
Mid
dle
Am
eric
a-0
.29
(38)
-0.1
6 (2
9)0.
67 (
1)0.
21 (
26)
-0.4
9 (4
5)2.
14 (
4)0.
58 (
1)-0
.27
(29)
-0.5
3 (4
8)
Mem
phis
(A
R)
S*
-0.4
1 (4
1)0.
49 (
12)
-5.1
8 (7
3)-1
.05
(66)
-1.3
4 (7
1)0.
45 (
16)
0.58
(1)
-0.2
7 (2
9)-1
.25
(69)
Mem
phis
(M
S)
S*
-0.4
1 (4
1)0.
49 (
12)
0.67
(1)
-1.0
5 (6
6)-1
.34
(71)
0.45
(16
)0.
58 (
1)-0
.27
(29)
0.79
(16
)
Mem
phis
(T
N)
SC
onta
inm
ent
-0.1
7 (3
6)-0
.43
(51)
-0.3
5 (5
1)1.
50 (
7)-0
.27
(36)
0.20
(27
)-0
.30
(59)
-0.6
5 (6
8)-0
.30
(36)
Mia
mi
SG
row
th M
anag
emen
t-1
.17
(69)
-0.7
0 (6
7)0.
67 (
1)0.
50 (
21)
2.21
(2)
1.20
(7)
0.27
(44
)-0
.40
(60)
1.44
(10
)
Milw
auke
e M
WM
iddl
e A
mer
ica
0.74
(16
)-0
.31
(41)
-1.3
9 (6
8)-0
.47
(41)
-0.3
2 (3
9)-0
.59
(56)
-0.6
4 (6
4)1.
16 (
7)-0
.75
(56)
Min
neap
olis
(M
N)
MW
Mid
dle
Am
eric
a0.
47 (
24)
0.10
(22
)-0
.25
(49)
0.51
(20
)0.
52 (
23)
0.48
(15
)-0
.10
(57)
-0.3
4 (5
0)-0
.28
(35)
Min
neap
olis
(W
I)M
WB
asic
Exc
lusi
on2.
29 (
2)-0
.65
(63)
-0.5
7 (5
6)0.
03 (
30)
-0.5
0 (4
6)-0
.78
(63)
0.10
(54
)0.
47 (
12)
-0.9
7 (6
0)
Nas
hvill
e S
Con
tain
men
t0.
17 (
32)
-0.6
1 (6
1)-0
.35
(52)
2.32
(4)
-0.0
4 (3
1)-0
.21
(48)
0.48
(23
)-0
.31
(46)
-0.4
1 (4
1)
34 AUGUST 2006 • THE BROOKINGS INSTITUTION • RESEARCH BRIEF
App
endi
x. R
esul
ts o
f Fa
ctor
Ana
lysi
s, b
y m
etro
poli
tan
area
(or
par
t) a
nd r
ank.
(co
ntin
ued)
Met
ropo
lita
n Z
onin
gC
onta
in-
Infr
astr
uctu
reG
row
th C
ontr
olA
ffor
dabl
e
area
or
part
Reg
ion
Fam
ily
Exc
lusi
onN
o Z
onin
gP
lann
ing
men
tIm
pact
Fee
AP
FO
Mor
ator
iaP
erm
it C
apH
ousi
ng
New
Hav
en
NE
Mid
dle
Am
eric
a0.
53 (
21)
-0.5
7 (5
6)0.
51 (
40)
-0.5
7 (4
4)-1
.07
(64)
0.06
(34
)0.
42 (
29)
-0.3
4 (5
1)0.
26 (
28)
New
Orl
eans
SC
onta
inm
ent-
Lit
e-0
.54
(50)
-0.2
7 (3
7)-1
.38
(67)
1.33
(8)
0.68
(20
)1.
89 (
5)-2
.98
(72)
0.87
(8)
-0.4
2 (4
3)
New
Yor
k (N
J)
NE
Bas
ic E
xclu
sion
1.44
(7)
-0.5
9 (5
9)0.
67 (
1)-0
.84
(59)
-0.4
9 (4
4)-0
.06
(42)
0.43
(27
)-0
.33
(49)
0.86
(15
)
New
Yor
k (N
Y)
NE
Hig
h D
ensi
ty0.
23 (
30)
-0.6
1 (6
0)-1
.40
(69)
-0.7
7 (5
3)-0
.65
(50)
-0.7
1 (6
0)-0
.75
(67)
-0.8
4 (7
0)0.
47 (
20)
New
Yor
k (P
A)
NE
*1.
48 (
6)0.
26 (
18)
-0.2
0 (4
6)-1
.05
(66)
-0.8
8 (5
8)-0
.35
(51)
0.58
(1)
-0.2
7 (2
9)-1
.15
(65)
Nor
folk
(N
C)
S*
3.52
(1)
-1.6
5 (7
3)0.
67 (
1)-1
.05
(66)
1.52
(8)
-0.7
7 (6
2)-5
.45
(73)
-2.9
0 (7
3)-1
.25
(69)
Nor
folk
(VA
)S
Mid
dle
Am
eric
a-0
.87
(58)
-0.1
7 (3
0)0.
67 (
1)1.
25 (
10)
-1.2
3 (7
0)0.
28 (
23)
0.11
(52
)-0
.47
(63)
0.22
(29
)
Okl
ahom
a C
ity
SM
iddl
e A
mer
ica
-0.4
4 (4
8)0.
38 (
16)
-0.3
8 (5
4)-0
.44
(39)
-0.3
9 (4
2)0.
34 (
20)
0.58
(1)
-0.2
7 (2
9)0.
17 (
30)
Orl
ando
S
Gro
wth
Man
agem
ent
-0.7
6 (5
6)-0
.41
(49)
0.67
(1)
0.07
(29
)2.
42 (
1)1.
09 (
8)0.
40 (
33)
-0.3
5 (5
4)0.
87 (
14)
Phi
lade
lphi
a (D
E)
S*
-0.4
3 (4
7)2.
19 (
4)-1
.04
(63)
1.21
(12
)-0
.27
(34)
-1.5
2 (7
0)0.
58 (
1)-0
.27
(29)
1.47
(9)
Phi
lade
lphi
a (M
D)
S*
-0.6
7 (5
3)0.
16 (
20)
0.67
(1)
1.80
(6)
-0.7
5 (5
3)0.
98 (
9)0.
11 (
51)
-0.4
8 (6
4)-0
.55
(50)
Phi
lade
lphi
a (P
A)
NE
Mid
dle
Am
eric
a0.
61 (
19)
-0.1
0 (2
6)-0
.86
(61)
-0.3
2 (3
6)-0
.33
(40)
0.19
(28
)0.
52 (
18)
-0.1
9 (2
3)-0
.54
(49)
Phi
lade
lphi
a (N
J)N
EB
asic
Exc
lusi
on1.
96 (
4)-0
.86
(69)
0.67
(1)
-0.8
4 (6
0)-0
.38
(41)
-0.1
3 (4
7)0.
41 (
30)
-0.3
4 (5
2)0.
41 (
23)
Pho
enix
W
Gro
wth
Man
agem
ent
-1.1
5 (6
7)-0
.56
(55)
0.67
(1)
0.62
(19
)1.
71 (
5)-0
.28
(49)
0.58
(1)
-0.2
7 (2
9)1.
08 (
12)
Pit
tsbu
rgh
NE
Mid
dle
Am
eric
a0.
92 (
10)
0.17
(19
)-0
.64
(58)
-0.7
6 (5
2)-0
.70
(51)
-0.0
7 (4
3)0.
56 (
16)
-0.2
5 (2
8)-0
.89
(59)
Port
land
(O
R)
WC
onta
inm
ent
-0.7
8 (5
7)-0
.70
(66)
0.67
(1)
2.44
(3)
1.46
(10
)0.
05 (
35)
0.30
(42
)0.
39 (
13)
0.32
(24
)
Port
land
(W
A)
W*
-1.3
4 (7
1)-0
.78
(68)
0.67
(1)
2.61
(1)
1.14
(12
)-0
.73
(61)
-2.6
1 (7
1)-1
.63
(72)
-0.2
1 (3
4)
Ral
eigh
S
Mid
dle
Am
eric
a-0
.12
(34)
-0.3
0 (3
8)-0
.40
(55)
0.37
(25
)-0
.27
(35)
0.27
(25
)0.
35 (
40)
-0.2
0 (2
5)0.
30 (
25)
Ric
hmon
dS
Mid
dle
Am
eric
a0.
18 (
31)
-0.0
3 (2
5)0.
67 (
1)-0
.14
(32)
-0.8
4 (5
6)-0
.38
(54)
0.45
(26
)-0
.32
(48)
-0.5
1 (4
7)
Roc
hest
er
NE
Mid
dle
Am
eric
a0.
81 (
13)
-0.4
3 (5
0)-0
.35
(53)
-0.8
0 (5
7)-0
.41
(43)
0.19
(29
)0.
36 (
38)
0.18
(15
)-0
.73
(54)
Sac
ram
ento
WG
row
th M
anag
emen
t-0
.99
(62)
-0.3
8 (4
8)0.
67 (
1)0.
44 (
23)
1.15
(11
)-1
.05
(66)
-0.6
8 (6
5)0.
15 (
17)
1.58
(5)
Sal
t L
ake
Cit
yW
Hig
h D
ensi
ty-1
.28
(70)
-0.6
1 (6
2)-1
.42
(70)
-0.3
1 (3
5)0.
47 (
24)
-2.3
1 (7
1)0.
10 (
55)
-0.4
8 (6
5)0.
27 (
26)
San
Ant
onio
S
Dal
las-
San
Ant
onio
-0.6
9 (5
5)1.
69 (
5)0.
66 (
33)
-0.7
8 (5
5)0.
99 (
15)
-0.9
3 (6
4)0.
38 (
36)
-0.3
6 (5
7)1.
18 (
11)
San
Die
go
WG
row
th M
anag
emen
t-1
.64
(72)
-1.0
9 (7
1)0.
65 (
35)
1.08
(13
)1.
62 (
7)-0
.12
(46)
-2.5
1 (7
0)-1
.00
(71)
2.48
(2)
San
Fra
ncis
co
WG
row
th C
ontr
ol-1
.10
(65)
-0.4
8 (5
2)0.
62 (
36)
0.77
(15
)1.
07 (
13)
-1.1
9 (6
7)-0
.64
(63)
2.86
(4)
2.06
(3)
Sea
ttle
W
Con
tain
men
t-1
.16
(68)
-0.5
4 (5
4)0.
67 (
1)2.
52 (
2)1.
47 (
9)0.
03 (
37)
0.10
(53
)-0
.49
(66)
0.66
(19
)
St.
Lou
is (
IL)
MW
Mid
dle
Am
eric
a1.
13 (
9)1.
50 (
7)-1
.06
(64)
-0.5
5 (4
3)-0
.57
(48)
-0.3
2 (5
0)0.
57 (
15)
-0.2
5 (2
7)-0
.85
(58)
St.
Lou
is (
MO
)M
WM
iddl
e A
mer
ica
0.26
(29
)0.
46 (
15)
-0.7
5 (6
0)-0
.85
(61)
-0.2
5 (3
3)0.
49 (
14)
0.48
(24
)-0
.01
(19)
-1.1
3 (6
3)
Tam
pa
SG
row
th M
anag
emen
t-1
.01
(64)
-0.3
8 (4
7)0.
67 (
1)0.
77 (
16)
1.95
(4)
0.32
(21
)0.
49 (
22)
-0.3
1 (4
5)1.
47 (
8)
Was
hing
ton
(DC
) S
*-2
.01
(73)
-1.5
4 (7
2)0.
67 (
1)-1
.05
(66)
0.46
(25
)-2
.67
(72)
0.58
(1)
-0.2
7 (2
9)3.
00 (
1)
Was
hing
ton
(MD
)S
Con
tain
men
t-L
ite
-0.9
2 (5
9)-0
.57
(57)
0.43
(43
)1.
22 (
11)
0.77
(17
)1.
56 (
6)-2
.16
(69)
1.85
(5)
-0.0
5 (3
2)
Was
hing
ton
(VA
) S
Mid
dle
Am
eric
a-0
.30
(39)
-0.3
4 (4
3)0.
67 (
1)0.
67 (
18)
-0.8
5 (5
7)-0
.38
(53)
0.50
(20
)-0
.30
(44)
0.73
(18
)
Was
hing
ton
(WV
) S
*-0
.19
(37)
3.47
(2)
0.67
(1)
-1.0
5 (6
6)-1
.34
(71)
0.45
(16
)0.
58 (
1)-0
.27
(29)
-1.2
5 (6
9)
Wes
t Pa
lm B
each
S
Gro
wth
Man
agem
ent
-0.4
1 (4
4)0.
06 (
23)
0.67
(1)
0.42
(24
)2.
21 (
3)0.
73 (
12)
0.40
(32
)-0
.34
(53)
1.48
(7)
* N
ote:
the
se s
ub-p
arts
of m
etro
poli
tan
area
s w
ere
not
incl
uded
in t
he c
lust
er a
naly
sis
beca
use
they
con
tain
ed t
oo fe
w lo
cal g
over
nmen
ts, o
r to
o fe
w r
espo
nded
to
our
surv
ey.
The
num
bers
in t
he t
able
are
“fa
ctor
sco
res.
” T
he s
core
s ar
e ba
sed
on s
tand
ard
devi
atio
ns; 9
5 pe
rcen
t of
the
var
iati
on in
the
fact
or s
core
lies
bet
wee
n -2
and
+2,
and
67
perc
ent
betw
een
-1an
d +
1. F
acto
r sc
ores
wit
h va
lues
of l
ess
than
-2
or g
reat
er t
han
2, t
here
fore
, are
ver
y ex
trem
e va
lues
in t
he n
atio
nal c
onte
xt, a
nd t
hose
wit
h ab
solu
te v
alue
s gr
eate
r th
an 1
are
ver
y lo
w o
rve
ry h
igh.
Lab
elin
g of
the
fact
ors
(e.g
., “E
xclu
sion
,” “
No
Zoni
ng,”
Hig
h D
ensi
ty”)
is b
ased
on
the
auth
ors’
appr
aisa
l of w
hich
of t
he b
ackg
roun
d va
riab
les
asso
ciat
e w
ith
high
or
low
val
ues
for
the
fact
or. F
or e
xam
ple,
for
the
“Per
mit
Cap
” fa
ctor
, Den
ver’s
sco
re o
f 3.9
6 is
con
side
red
extr
emel
y hi
gh, S
an D
iego
’s sc
ore
of -
1.00
is v
ery
low
, and
St.
Lou
is’(
MO
) -0
.01
is a
clo
se r
epre
-se
ntat
ion
of t
he n
atio
nal c
onte
xt.
35AUGUST 2006 • THE BROOKINGS INSTITUTION • RESEARCH BRIEF
Endnotes
1. Rolf Pendall is an associate professor in the Department of
City and Regional Planning at Cornell University and a
senior researcher associate at Solimar Research Group.
Robert Puentes is a fellow with the Brookings Institution’s
Metropolitan Policy Program. Jonathan Martin is a
Ph.D. candidate in the Department of City and Regional
Planning at Cornell University.
2. Anthony Downs, New Visions for Metropolitan America
(Brookings Institution Press and Lincoln Institute of
Land Policy, 1994), p. 13–14.
3. Buchanan v. Warley, 245 U.S. 60 (1917) was the U.S.
Supreme Court decision that ruled Kentucky could not
require residential segregation. A racial zoning ordinance in
Birmingham was struck down by federal courts as recently
as 1949. See Monk et al. v. City of Birmingham et. al, 87 F.
Supp. 538 (1949), upheld on appeal in City of Birmingham
et al. v. Monk et al., 185 F.2d 859 (1950). See Christopher
Silver, “The Racial Origins of Zoning: Southern Cities
from 1910–1940,” Planning Perspectives: An International
Journal of History, 6 (1991): 189–205.
4. Rolf Pendall, “Local Land-Use Regulation and the Chain of
Exclusion.” Journal of the American Planning Association
66(2) (2000): 125–142.
5. The landmark case Village of Euclid, Ohio v. Ambler Realty
Co., 272 U.S. 365 (1926) upheld local zoning and gave the
seal of approval to comprehensive zoning.
6. See: Eric Damian Kelly and Barbara Becker, Community
Planning: An Introduction to the Comprehensive Plan
(Washington: Island Press, 2000).
7. For a discussion of Maryland’s program as well as the other
states discussed here, see: John M. DeGrove, Planning
Policy and Politics: Smart Growth and the States
(Cambridge: Lincoln Institute of Land Policy, 2005).
8. Arthur C. Nelson and others, “The Link Between Growth
Management and Housing Affordability: The Academic
Evidence.” (Washington: Brookings, 2002). Available at
http://www.brookings.edu/es/urban/publications/
growthmanagexsum.htm.
9. But note that standard Euclidian zoning also profoundly
impacted the pace, location, and extent of development—
even though it was not expressly intended.
10. S. Mark White and Elisa L. Paster, “Creating Effective
Land Use Regulations through Concurrency.” Natural
Resources Journal 43 (3) (2003): 753–779.
11. Boca Raton, unlike Petaluma, also imposed an ultimate
population cap that was subsequently struck down in
court. See David R. Godschalk, and others, Constitutional
Issues of Growth Management (Washington: Planners Press,
1979).
12. See Madelyn Glickfeld and Ned Levine, “Regional Growth
. . . Local Reaction: The Enactment and Effects of Local
Growth Control Measures in California” (Cambridge:
Lincoln Institute of Land Policy, 1992).
13. Rolf Pendall, William Fulton, and Jonathan Martin,
“Holding the Line: Urban Containment in the United
States (Washington: Brookings, 2002). Available:
http://www.brookings.edu/es/urban/publications/
pendallfultoncontainmentexsum.htm.
14. A more critical observer may argue that these affordability
devices are a thin veneer of inclusion atop a foundation
of exclusion. A device such as density bonus, for example,
is only applicable when density is being restricted in the
first place.
15. In 2002–2003, this amounted to over $1 billion in new
funds, with total fund equity of over $2.2 billion owing to
lags in expenditures. See: California Department of Hous-
ing and Community Development, “Redevelopment
Housing Activities, Fiscal Year 2002–2003” (Sacramento:
2004). Available at http://www.hcd.ca.gov/hpd/rda/
02-03/rdasum02-03.pdf.
16. This section briefly points to some of the key conclusions
of research on the effects of planning and regulation. More
complete recent reviews can be found in: John I. Car-
ruthers, “Evaluating the Effectiveness of Regulatory
Growth Management Programs: An Analytic Framework,”
Journal of Planning Education and Research 21 (4) (2002):
391–405; Keith R. Ihlanfeldt, “Exclusionary Land Use Reg-
ulations Within Suburban Communities: A Review of the
Evidence and Policy Prescriptions,” Urban Studies 41 (2)
(2004): 261–283; Arthur C. Nelson, and others, “Urban
Containment and Residential Segregation: A Preliminary
Fore General Information:Brookings Institution Metropolitan Policy Program
202-797-4139www.brookings.edu/metro
AcknowledgmentsThe authors would like to thank the Department of City and Regional Planning and theCornell Institute for Social and Economic Research at Cornell University for their institu-tional support of this project. We also appreciate the time and effort of the patient staffand elected officials who answered our survey. All errors remain the authors’ responsibility.
The Brookings Institution Metropolitan Policy Program would like to thank the FannieMae Foundation, the George Gund Foundation, the Joyce Foundation, the Ford Founda-tion, the John D. and Catherine T. MacArthur Foundation, and the Charles Stewart MottFoundation for their support of our work on metropolitan trends. We also want to acknowl-edge the assistance of Anthony Downs, Bill Fulton, Jonathan Levine, Amy Liu, StuartMeck, and several other individuals who provided very helpful guidance or detailed andthorough reviews of this paper.