From World Development Indicators The Little Green Data Book Agriculture Forests and biodiversity Energy Emissions and pollution Water and sanitation Environment and health National accounting aggregates Public Disclosure Authorized Public Disclosure Authorized Public Disclosure Authorized Public Disclosure Authorized Public Disclosure Authorized Public Disclosure Authorized Public Disclosure Authorized Public Disclosure Authorized
The Little Green Data Book 2011 is based on World Development Indicators
2011 and its accompanying CD-ROM. Defining, gathering, and disseminating international statistics is a collective effort of many people and organizations. The indicators presented in World Development Indicators are the fruit of decades of work at many levels, from the field workers who administer censuses and household surveys to the committees and working parties of the national and international statistical agencies that develop the nomenclature, classifications, and standards fundamental to the international statistical system. Nongovernmental organizations have also made important contributions. We are indebted to the World Development Indicators partners, as detailed in World Development Indicators 2011.
The Little Green Data Book 2011 is the result of close collaboration between the staff of the Development Data Group of the Development Economics Vice Presidency and the Environment Department of the Sustainable Development Vice Presidency. Mehdi Akhlaghi, Kirk Hamilton, Glenn-Marie Lange, Elisabeth Mealey, Esther Grace Lee, and William Prince contributed to its preparation. Design by Communications Development Incorporated, cover design by Peter Grundy Art & Design and typesetting by Deborah Arroyo. Azita Amjadi, Alison Kwong, and Jomo Tariku coordinated the production of the book. Staff from External Affairs oversaw publication and distribution of the book.
Acknowledgments
vThe Little Green Data Book 2011
ForewordWelcome to The Little Green Data Book 2011. This year’s edition introduces a new green national accounting aggregate, adjusted Net National Income (aNNI), into the set of environment and development indicators. Using the underlying methodology of the Adjusted Net Saving (ANS) measure, which has been published since the first edition in 2000, aNNI provides a broader measure of national income that accounts for the depletion of natural resources.
The standard measure of income in the Un ited Nations System of National Accounts (SNA) is Net National Income (NNI), defined as Gross National Income (GNI) minus depreciation of fixed capital. aNNI starts with NNI, then subtracts a charge for the depletion of energy, mineral and forest resources, reflecting the decline in asset values associated with their extraction and harvest—this is analogous to depreciation of fixed assets.
As this definition indicates, aNNI represents a downward shift in level relative to GNI. This level shift represents a truer measure of a nation’s income because it accounts for the depletion of the nation’s assets. This does not necessarily translate into a difference in growth rates between GNI and aNNI. But we can think of situations, such as during a resource boom, where the growth rates could diverge significantly.
Consider the example of the East Asia and Pacific Region (EAP), focusing on countries rich in both mineral and energy resources. Looking at the figure, we see a smooth and steady upward trend of real GNI from the year 1995, with real ANNI following in parallel. But during the resource boom of the 2000s, both the value and the quantity of resource extraction increased in EAP, resulting in real aNNI diverging from real GNI along a slower and more volatile growth path.
Source: World Development Indicators data files.
0
500
1000
1500
2000
2500
3000
3500
20092007200520032001199919971995
real GNI
real aNNI
Resource Dependent Countries in EAP
real GNI and real aNNI, US$ billions, 1995-2009
vi 2011 The Little Green Data Book
ForewordRegion: Resource Dependent Countries
GNI % Growth (2000-09)
aNNI % Growth (2000-09)
East Asia and Pacific 9.7 9.1
Europe and Central Asia 6.5 8.3
Latin America and Caribbean 3.6 3.7
Middle East and North Africa 3.9 3.6
South Asia 7.5 7.1
Sub-Saharan Africa 4.3 4.0
These divergent growth paths highlight the importance of considering aNNI in addition to traditional development indicators. Especially during a resource boom, countries need a better idea of their true income levels, to restrain their spending and give a firmer guide to policy. Without accounting for natural resource depletion, indicators such as Gross Domestic Product (GDP) and GNI may be misleading, resulting in overconfidence and policy mistakes.
The SNA includes non-produced natural assets (e.g., land, mineral resources and forests) within the asset boundary insofar as they are under the effective control of economic actors. The calculation of aNNI, which accounts for net forest, energy, and mineral depletion, therefore remains within the SNA boundaries. This point is critical, since it allows for comparisons across GDP, GNI, and aNNI. For more information on data and methods, see World Bank (2011).
The Little Green Data Book 2011 is a knowledge resource that aids policy makers in using environmental data more effectively to support priority-setting and improve development outcomes. It is the result of close collaboration between the Development Data Group of the Development Economics Vice Presidency and the Environment Department of the Sustainable Development Vice Presidency of the World Bank. We welcome your suggestions on how to improve future editions and make them even more useful.
Shaida Badiee Mary Barton-Dock
Director Director
Development Data Group Environment Department
viiThe Little Green Data Book 2011
The data in this book are for the most recent year available. Regional aggregates include data for low- and middle-income economies only. Aggregates for regions and income groups are shown only if data are available for 66 percent of the economies in that group.
Symbols used:
0 or 0.0 indicates zero or small enough that the number rounds to zero
at the displayed number of decimal places.
.. indicates that data are not available.
$ indicates current U.S. dollars.
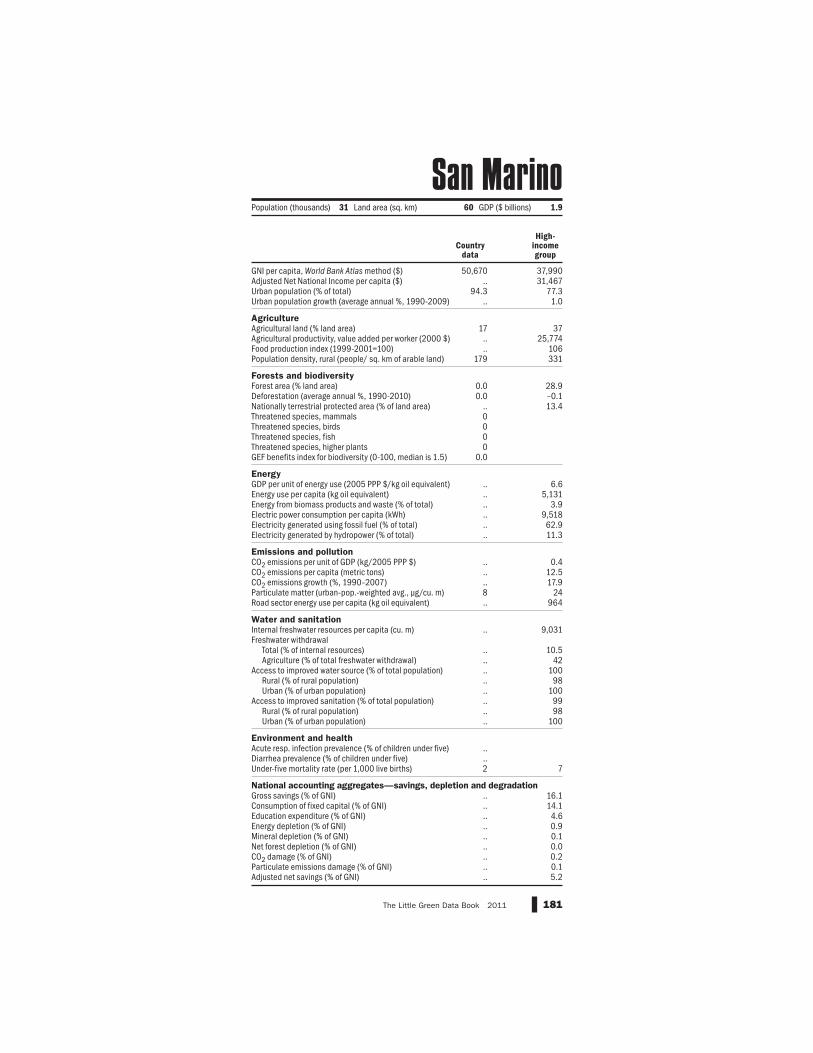
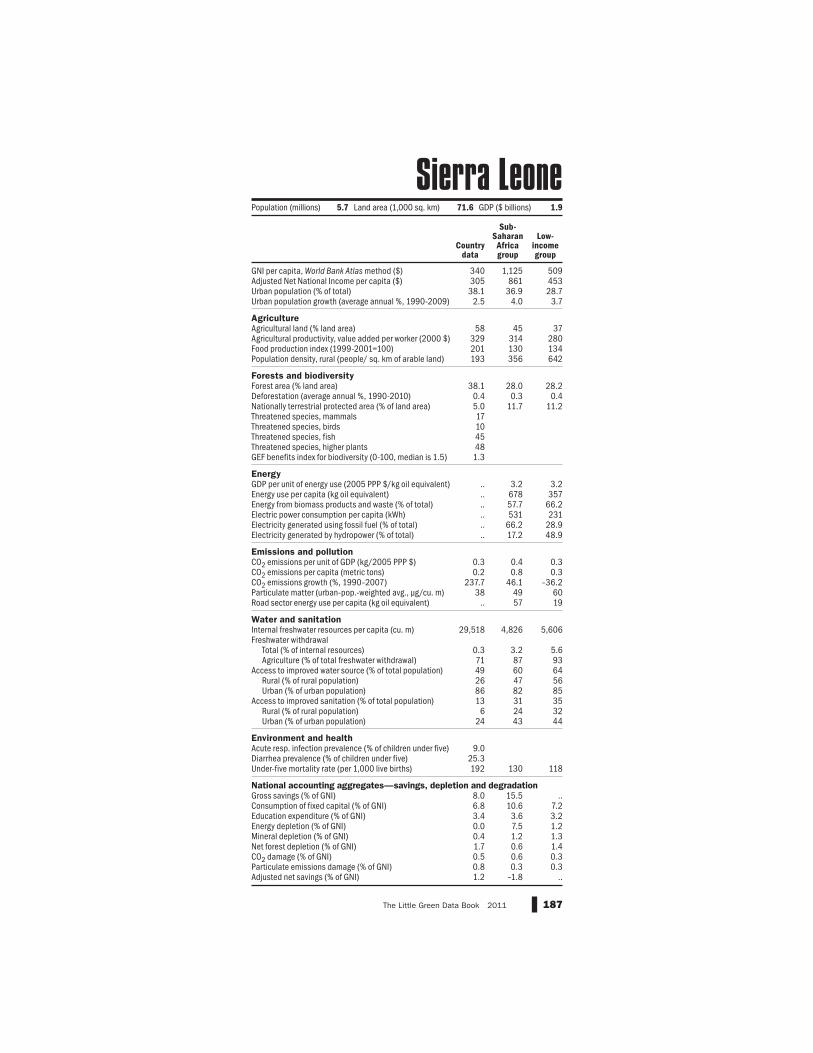
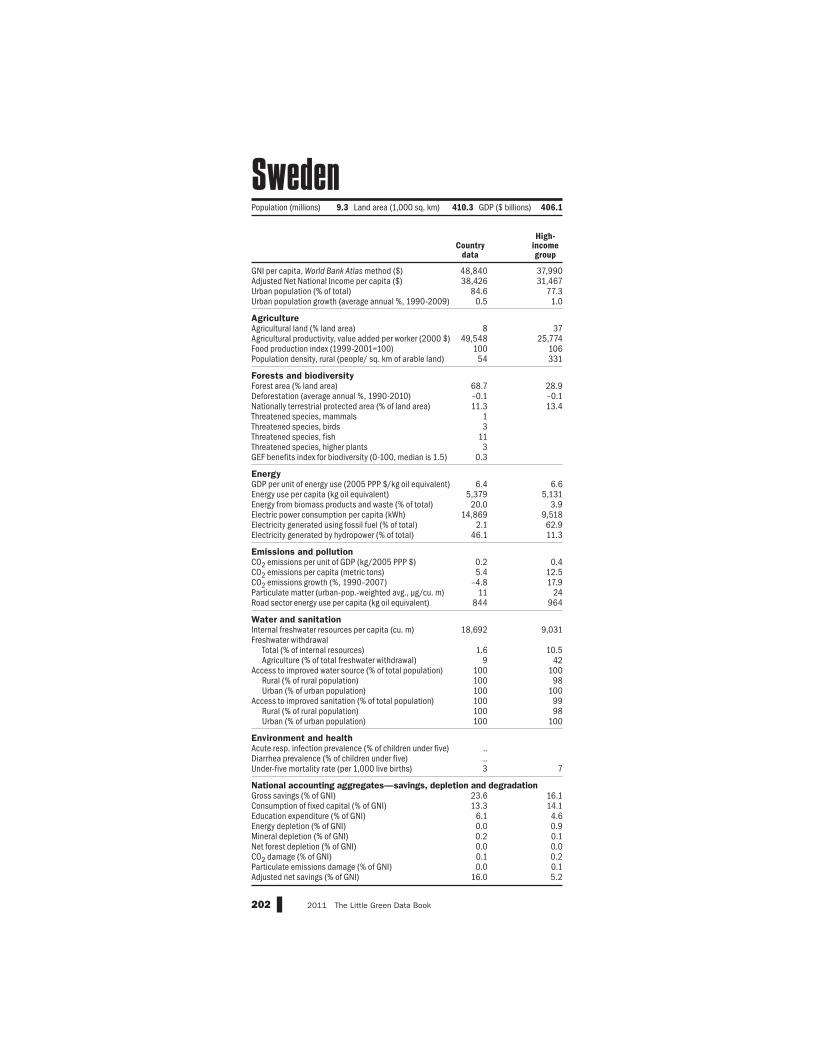
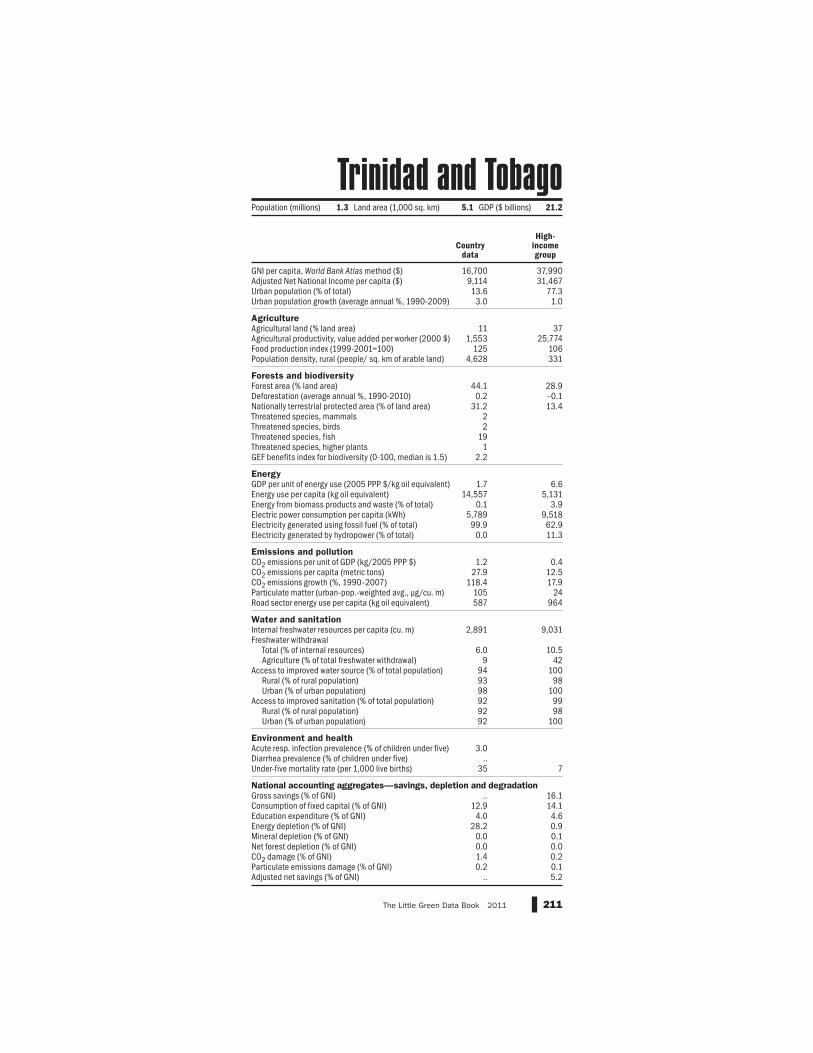
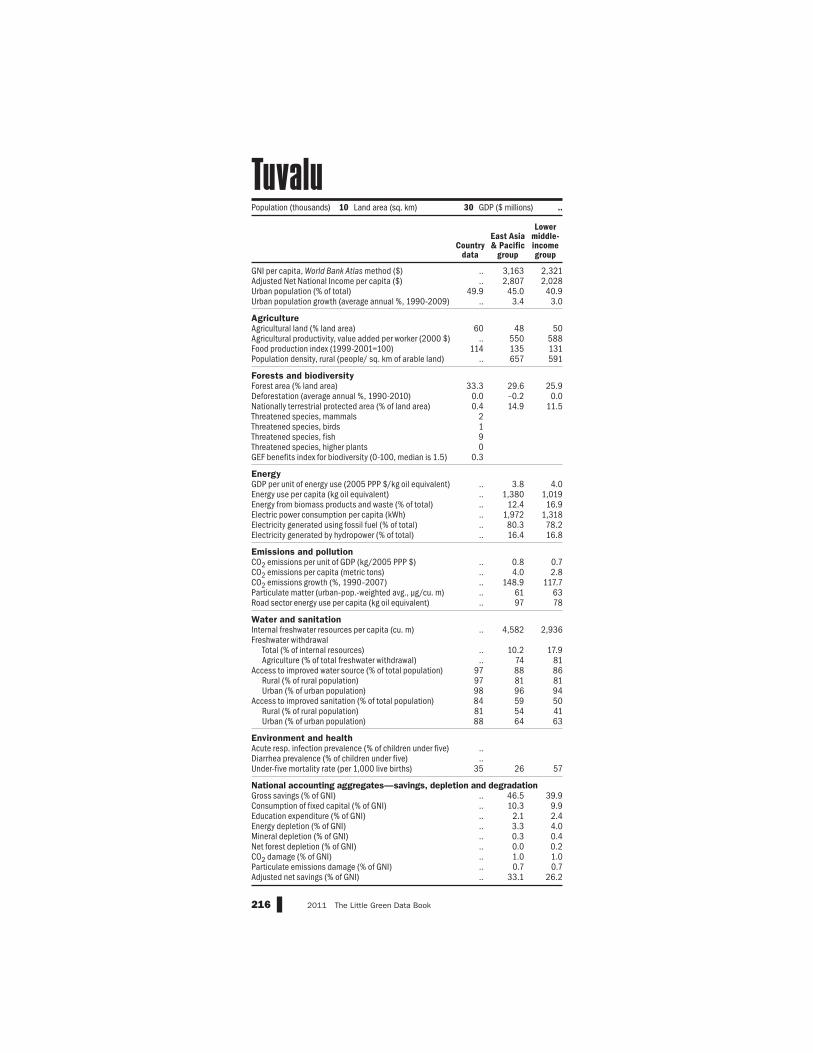
Data are shown for economies with populations greater than 30,000 or for smaller economies if they are members of the World Bank. The word country (used interchangeably with economy) does not imply political independence or official recognition by the World Bank but refers to any economy for which the authorities report separate social or economic statistics.
The selection of indicators in these pages includes some that are being used to monitor progress toward the Millennium Development Goals. For more information about the eight goals—halving poverty and increasing well-being by 2015—please see the other books in the World Development
Indicators 2011 family of products.
Data notes
1The Little Green Data Book 2011
The country composition of regions is based on the World Bank’s analytical
regions and may differ from common geographic usage.
East Asia and Pacific
American Samoa, Cambodia, China, Fiji, Indonesia, Kiribati, Democratic
Republic of Korea, Lao People’s Democratic Republic, Malaysia, Marshall
Islands, Federated States of Micronesia, Mongolia, Myanmar, Palau,
Papua New Guinea, Philippines, Samoa, Solomon Islands, Thailand,
Timor-Leste, Tonga, Tuvalu, Vanuatu, Vietnam.
Europe and Central Asia
Albania, Armenia, Azerbaijan, Belarus, Bosnia and Herzegovina, Bulgaria,
Georgia, Kazakhstan, Kosovo, Kyrgyz Republic, Lithuania, Former
Yugoslav Republic of Macedonia, Moldova, Montenegro, Romania,
Namibia, Niger, Nigeria, Rwanda, São Tomé and Principe, Senegal,
Seychelles, Sierra Leone, Somalia, South Africa, Sudan, Swaziland,
Tanzania, Togo, Uganda, Zambia, Zimbabwe.
Regional tables
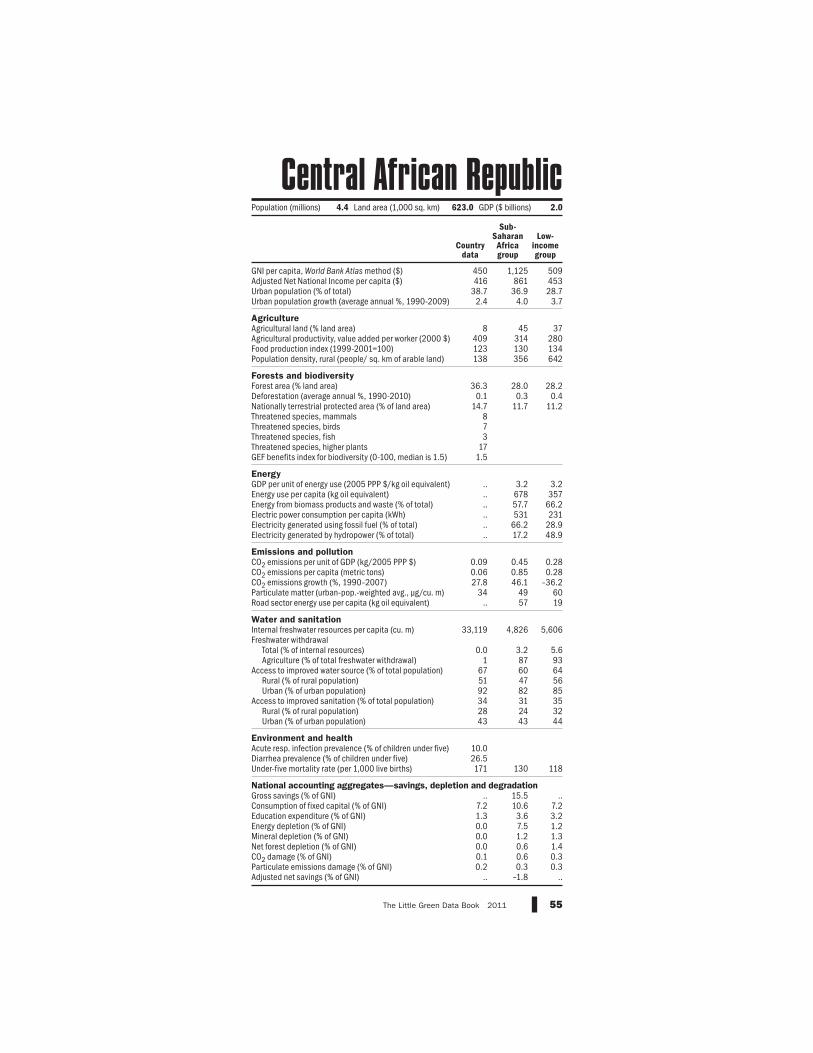
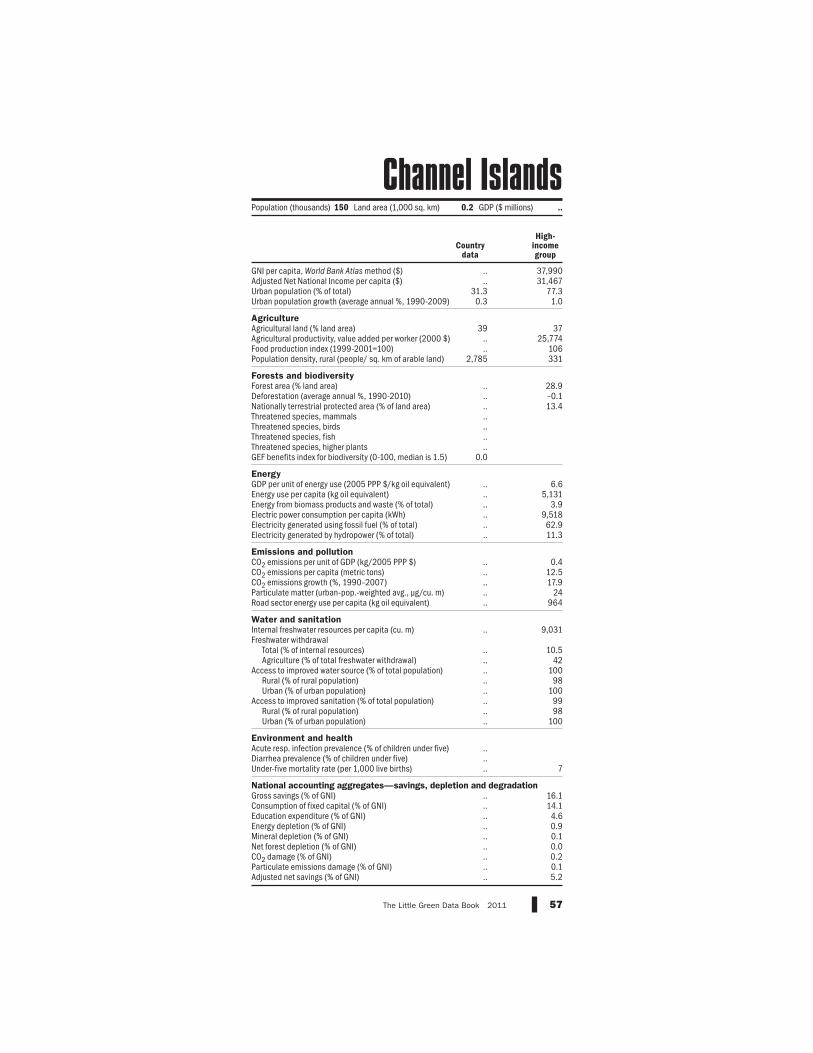
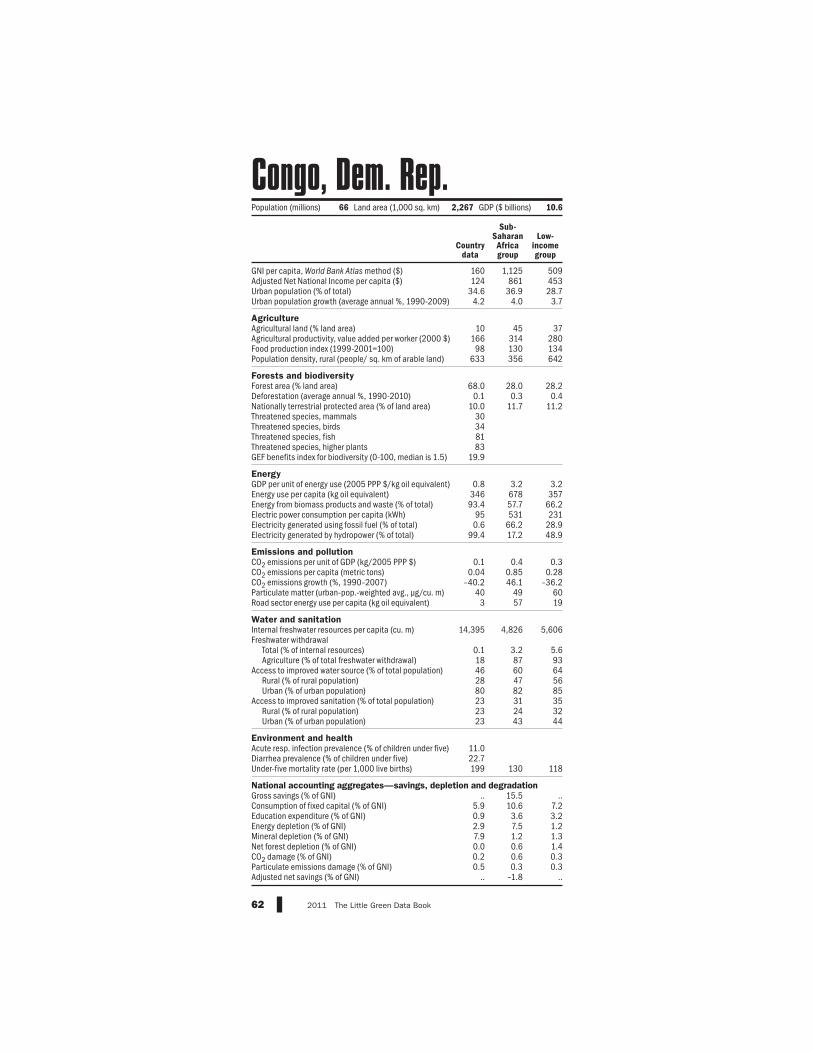
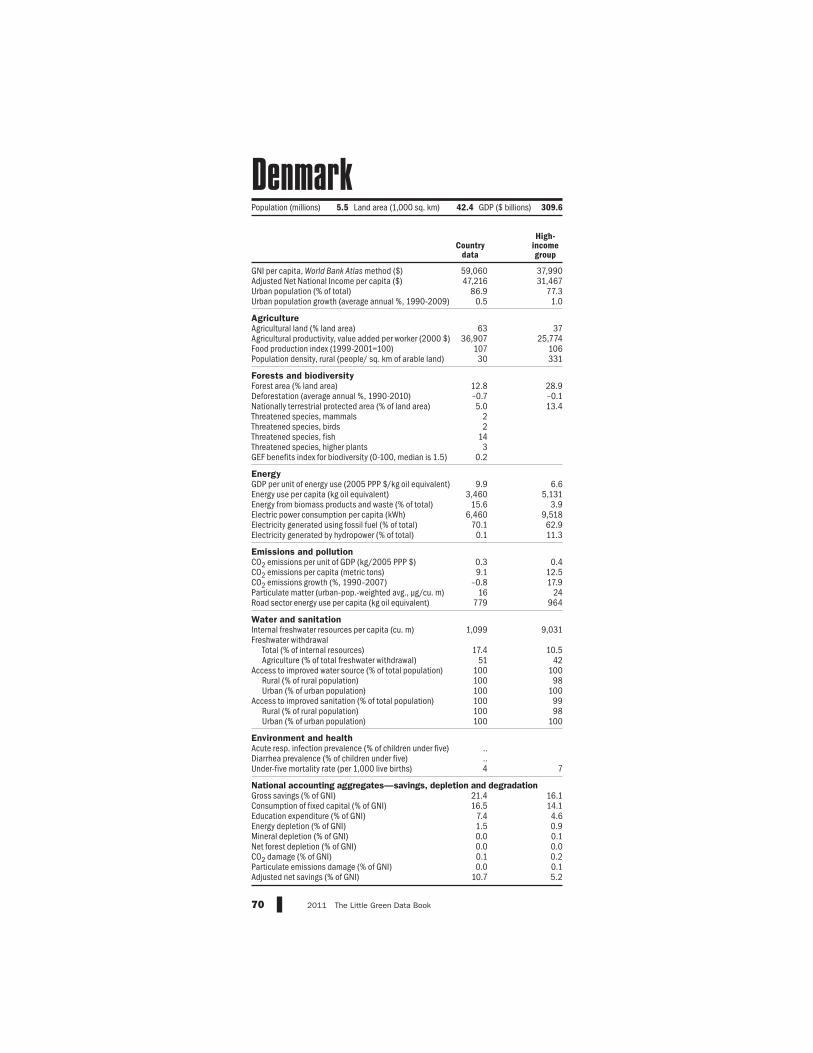
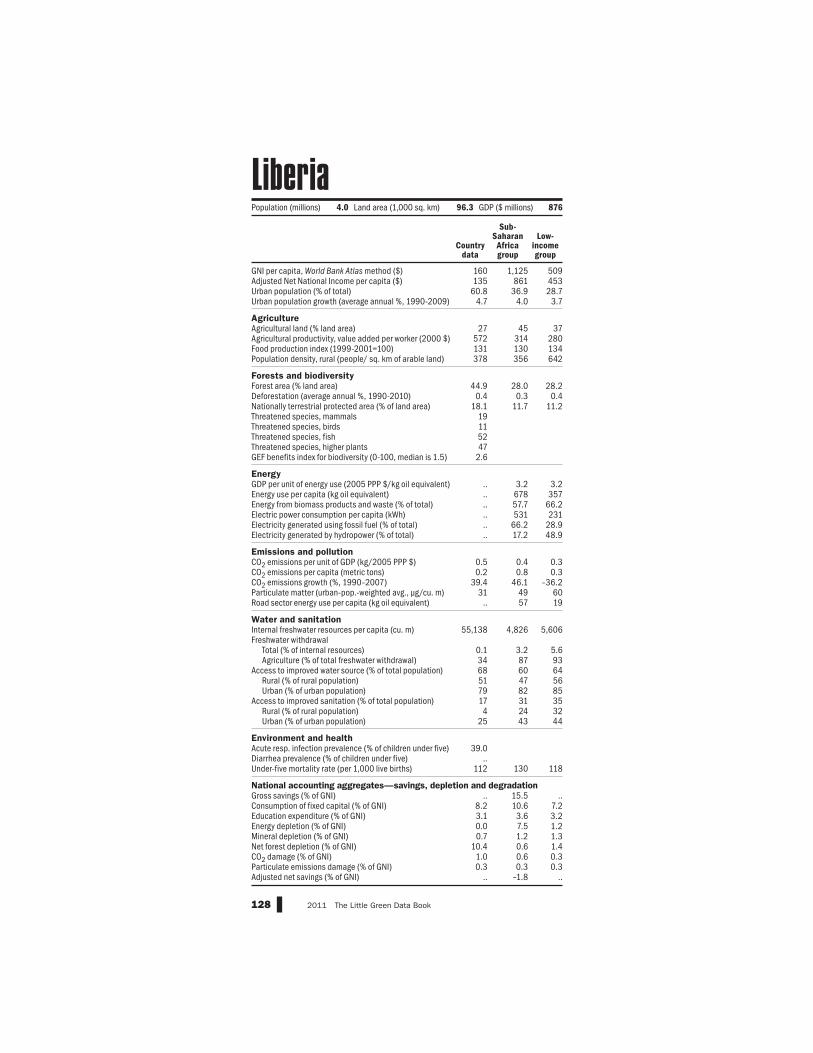
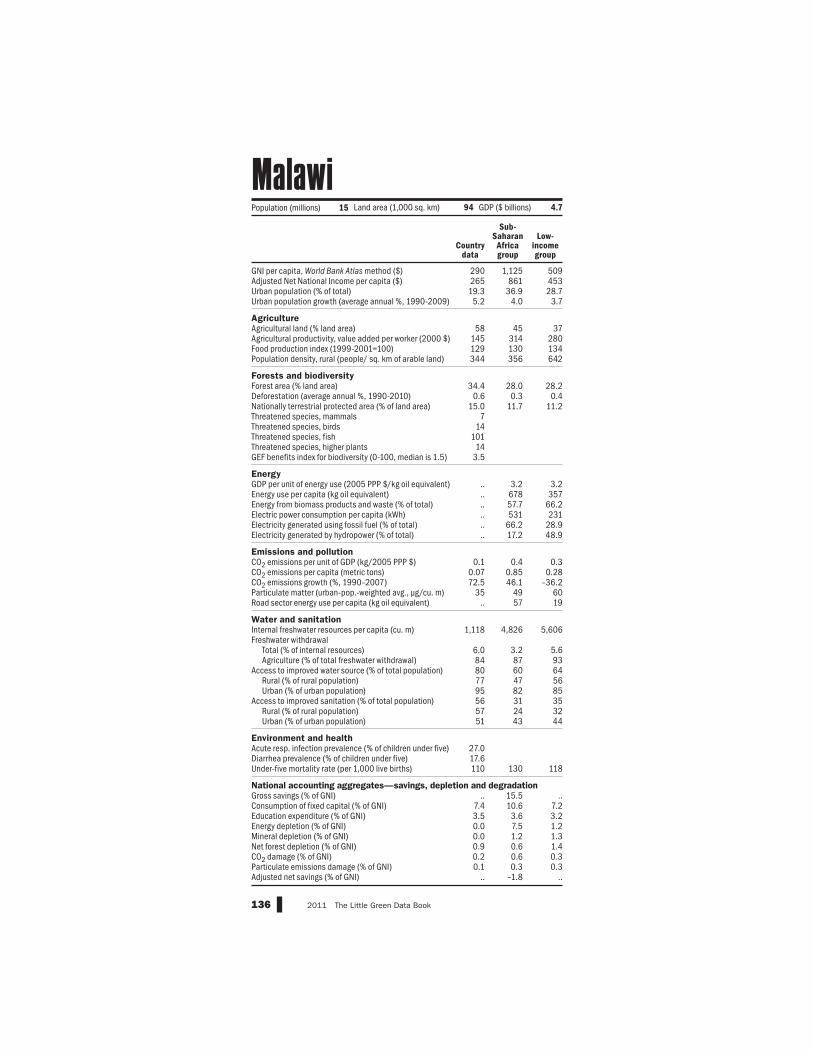
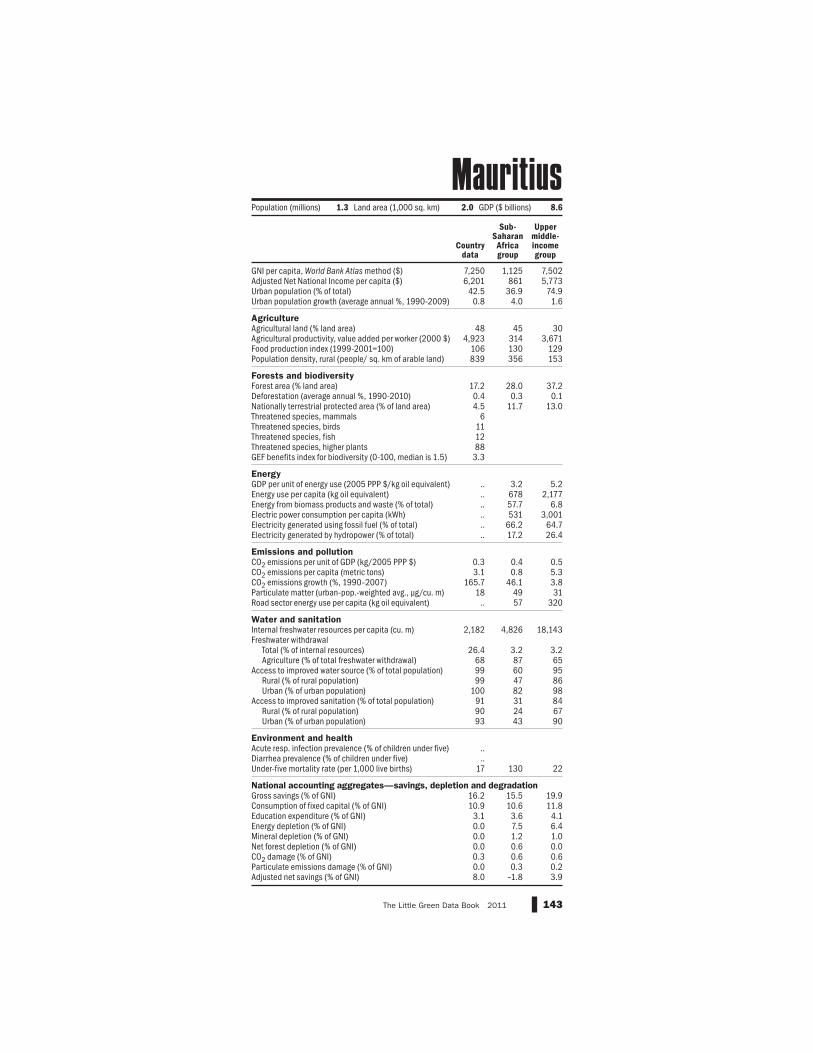
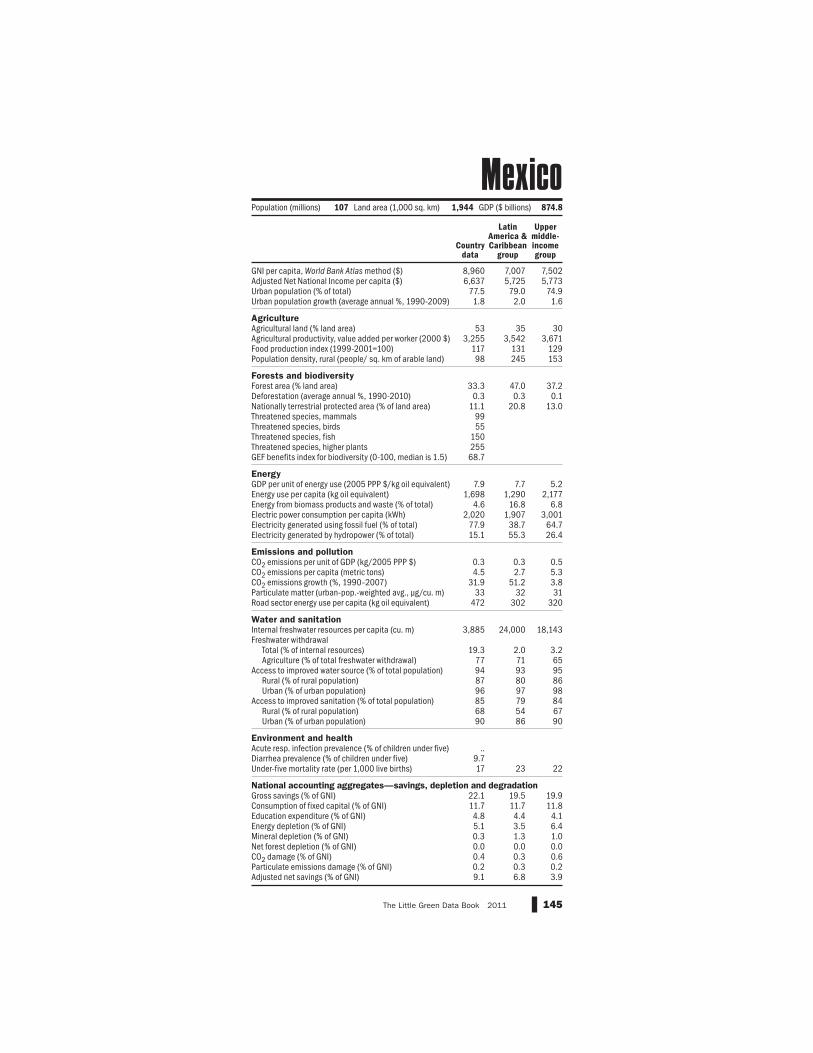
GNI per capita, World Bank Atlas method ($)Adjusted Net National Income per capita ($)Urban population (% of total)Urban population growth (average annual %, 1990-2009) AgricultureAgricultural land (% land area)Agricultural productivity, value added per worker (2000 $)Food production index (1999-2001=100)Population density, rural (people/ sq. km of arable land) Forests and biodiversityForest area (% land area)Deforestation (average annual %, 1990-2010)Nationally terrestrial protected area (% of land area)Threatened species, mammalsThreatened species, birdsThreatened species, fishThreatened species, higher plantsGEF benefits index for biodiversity (0-100, median is 1.5) EnergyGDP per unit of energy use (2005 PPP $/kg oil equivalent)Energy use per capita (kg oil equivalent)Energy from biomass products and waste (% of total)Electric power consumption per capita (kWh)Electricity generated using fossil fuel (% of total)Electricity generated by hydropower (% of total) Emissions and pollutionCO2 emissions per unit of GDP (kg/2005 PPP $)CO2 emissions per capita (metric tons)CO2 emissions growth (%, 1990–2007)Particulate matter (urban-pop.-weighted avg., μg/cu. m)Road sector energy use per capita (kg oil equivalent) Water and sanitationInternal freshwater resources per capita (cu. m)Freshwater withdrawal
Total (% of internal resources)Agriculture (% of total freshwater withdrawal)
Access to improved water source (% of total population)Rural (% of rural population)Urban (% of urban population)
Access to improved sanitation (% of total population)Rural (% of rural population)Urban (% of urban population)
Environment and healthAcute resp. infection prevalence (% of children under five)Diarrhea prevalence (% of children under five)Under-five mortality rate (per 1,000 live births) National accounting aggregates—savings, depletion and degradationGross savings (% of GNI)Consumption of fixed capital (% of GNI)Education expenditure (% of GNI)Energy depletion (% of GNI)Mineral depletion (% of GNI)Net forest depletion (% of GNI)CO2 damage (% of GNI)Particulate emissions damage (% of GNI)Adjusted net savings (% of GNI)
2 2011 The Little Green Data Book
8,7327,23250.3
2.2
381,072
123548
31.10.1
12.5
5.51,835
9.82,875
67.215.8
0.54.6
36.046
261
6,511
9.070877896614576
61
18.313.14.22.00.30.00.40.26.4
WorldPopulation (millions) 6,775 Land area (1,000 sq. km) 129,562 GDP ($ billions) 58,259.8
GNI per capita, World Bank Atlas method ($)Adjusted Net National Income per capita ($)Urban population (% of total)Urban population growth (average annual %, 1990-2009) AgricultureAgricultural land (% land area)Agricultural productivity, value added per worker (2000 $)Food production index (1999-2001=100)Population density, rural (people/ sq. km of arable land) Forests and biodiversityForest area (% land area)Deforestation (average annual %, 1990-2010)Nationally terrestrial protected area (% of land area)Threatened species, mammalsThreatened species, birdsThreatened species, fishThreatened species, higher plantsGEF benefits index for biodiversity (0-100, median is 1.5) EnergyGDP per unit of energy use (2005 PPP $/kg oil equivalent)Energy use per capita (kg oil equivalent)Energy from biomass products and waste (% of total)Electric power consumption per capita (kWh)Electricity generated using fossil fuel (% of total)Electricity generated by hydropower (% of total) Emissions and pollutionCO2 emissions per unit of GDP (kg/2005 PPP $)CO2 emissions per capita (metric tons)CO2 emissions growth (%, 1990–2007)Particulate matter (urban-pop.-weighted avg., μg/cu. m)Road sector energy use per capita (kg oil equivalent) Water and sanitationInternal freshwater resources per capita (cu. m)Freshwater withdrawal
Total (% of internal resources)Agriculture (% of total freshwater withdrawal)
Access to improved water source (% of total population)Rural (% of rural population)Urban (% of urban population)
Access to improved sanitation (% of total population)Rural (% of rural population)Urban (% of urban population)
Environment and healthAcute resp. infection prevalence (% of children under five)Diarrhea prevalence (% of children under five)Under-five mortality rate (per 1,000 live births) National accounting aggregates—savings, depletion and degradationGross savings (% of GNI)Consumption of fixed capital (% of GNI)Education expenditure (% of GNI)Energy depletion (% of GNI)Mineral depletion (% of GNI)Net forest depletion (% of GNI)CO2 damage (% of GNI)Particulate emissions damage (% of GNI)Adjusted net savings (% of GNI)
3The Little Green Data Book 2011
3,1632,80745.0
3.4
48550135657
29.6–0.214.9
3.81,380
12.41,97280.316.4
0.84.0
148.96197
4,582
10.274888196595464
26
46.510.3
2.13.30.30.01.00.7
33.1
Population (millions) 1,944 Land area (1,000 sq. km) 15,854 GDP ($ billions) 6,353.8
East Asia & Pacific
GNI per capita, World Bank Atlas method ($)Adjusted Net National Income per capita ($)Urban population (% of total)Urban population growth (average annual %, 1990-2009) AgricultureAgricultural land (% land area)Agricultural productivity, value added per worker (2000 $)Food production index (1999-2001=100)Population density, rural (people/ sq. km of arable land) Forests and biodiversityForest area (% land area)Deforestation (average annual %, 1990-2010)Nationally terrestrial protected area (% of land area)Threatened species, mammalsThreatened species, birdsThreatened species, fishThreatened species, higher plantsGEF benefits index for biodiversity (0-100, median is 1.5) EnergyGDP per unit of energy use (2005 PPP $/kg oil equivalent)Energy use per capita (kg oil equivalent)Energy from biomass products and waste (% of total)Electric power consumption per capita (kWh)Electricity generated using fossil fuel (% of total)Electricity generated by hydropower (% of total) Emissions and pollutionCO2 emissions per unit of GDP (kg/2005 PPP $)CO2 emissions per capita (metric tons)CO2 emissions growth (%, 1990–2007)Particulate matter (urban-pop.-weighted avg., μg/cu. m)Road sector energy use per capita (kg oil equivalent) Water and sanitationInternal freshwater resources per capita (cu. m)Freshwater withdrawal
Total (% of internal resources)Agriculture (% of total freshwater withdrawal)
Access to improved water source (% of total population)Rural (% of rural population)Urban (% of urban population)
Access to improved sanitation (% of total population)Rural (% of rural population)Urban (% of urban population)
Environment and healthAcute resp. infection prevalence (% of children under five)Diarrhea prevalence (% of children under five)Under-five mortality rate (per 1,000 live births) National accounting aggregates—savings, depletion and degradationGross savings (% of GNI)Consumption of fixed capital (% of GNI)Education expenditure (% of GNI)Energy depletion (% of GNI)Mineral depletion (% of GNI)Net forest depletion (% of GNI)CO2 damage (% of GNI)Particulate emissions damage (% of GNI)Adjusted net savings (% of GNI)
4 2011 The Little Green Data Book
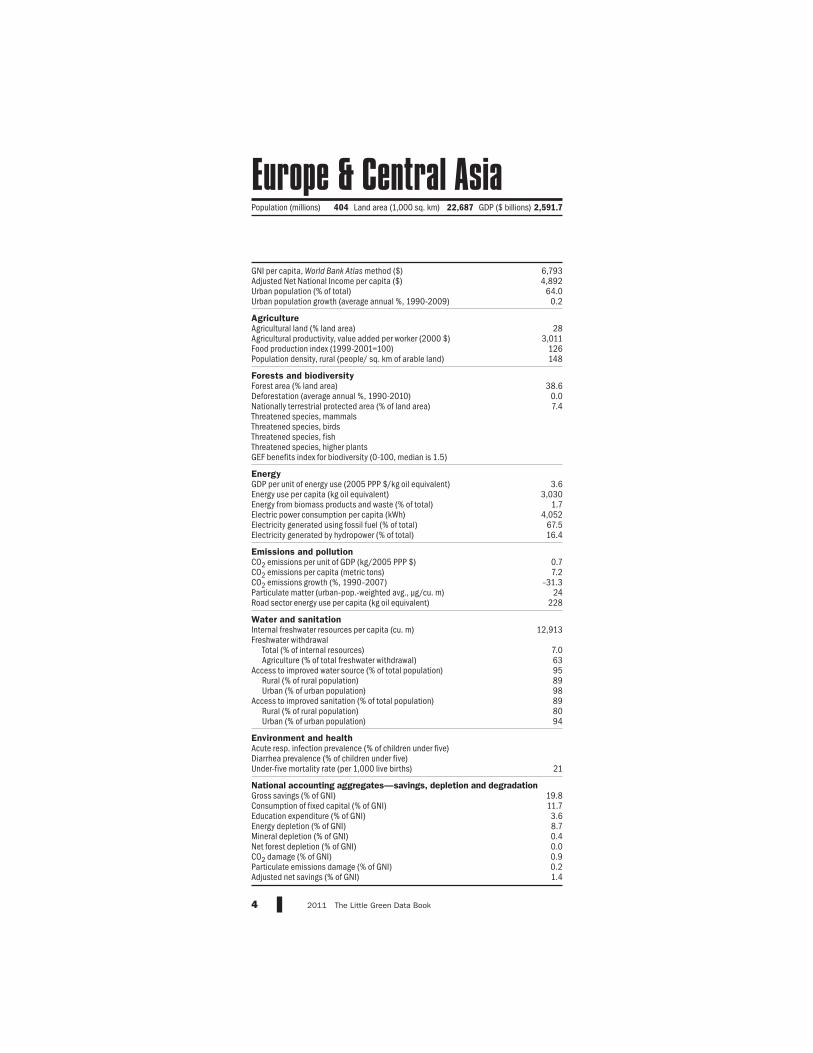
6,7934,892
64.00.2
283,011
126148
38.60.07.4
3.63,030
1.74,052
67.516.4
0.77.2
–31.324
228
12,913
7.063958998898094
21
19.811.73.68.70.40.00.90.21.4
Population (millions) 404 Land area (1,000 sq. km) 22,687 GDP ($ billions) 2,591.7
Europe & Central Asia
GNI per capita, World Bank Atlas method ($)Adjusted Net National Income per capita ($)Urban population (% of total)Urban population growth (average annual %, 1990-2009) AgricultureAgricultural land (% land area)Agricultural productivity, value added per worker (2000 $)Food production index (1999-2001=100)Population density, rural (people/ sq. km of arable land) Forests and biodiversityForest area (% land area)Deforestation (average annual %, 1990-2010)Nationally terrestrial protected area (% of land area)Threatened species, mammalsThreatened species, birdsThreatened species, fishThreatened species, higher plantsGEF benefits index for biodiversity (0-100, median is 1.5) EnergyGDP per unit of energy use (2005 PPP $/kg oil equivalent)Energy use per capita (kg oil equivalent)Energy from biomass products and waste (% of total)Electric power consumption per capita (kWh)Electricity generated using fossil fuel (% of total)Electricity generated by hydropower (% of total) Emissions and pollutionCO2 emissions per unit of GDP (kg/2005 PPP $)CO2 emissions per capita (metric tons)CO2 emissions growth (%, 1990–2007)Particulate matter (urban-pop.-weighted avg., μg/cu. m)Road sector energy use per capita (kg oil equivalent) Water and sanitationInternal freshwater resources per capita (cu. m)Freshwater withdrawal
Total (% of internal resources)Agriculture (% of total freshwater withdrawal)
Access to improved water source (% of total population)Rural (% of rural population)Urban (% of urban population)
Access to improved sanitation (% of total population)Rural (% of rural population)Urban (% of urban population)
Environment and healthAcute resp. infection prevalence (% of children under five)Diarrhea prevalence (% of children under five)Under-five mortality rate (per 1,000 live births) National accounting aggregates—savings, depletion and degradationGross savings (% of GNI)Consumption of fixed capital (% of GNI)Education expenditure (% of GNI)Energy depletion (% of GNI)Mineral depletion (% of GNI)Net forest depletion (% of GNI)CO2 damage (% of GNI)Particulate emissions damage (% of GNI)Adjusted net savings (% of GNI)
5The Little Green Data Book 2011
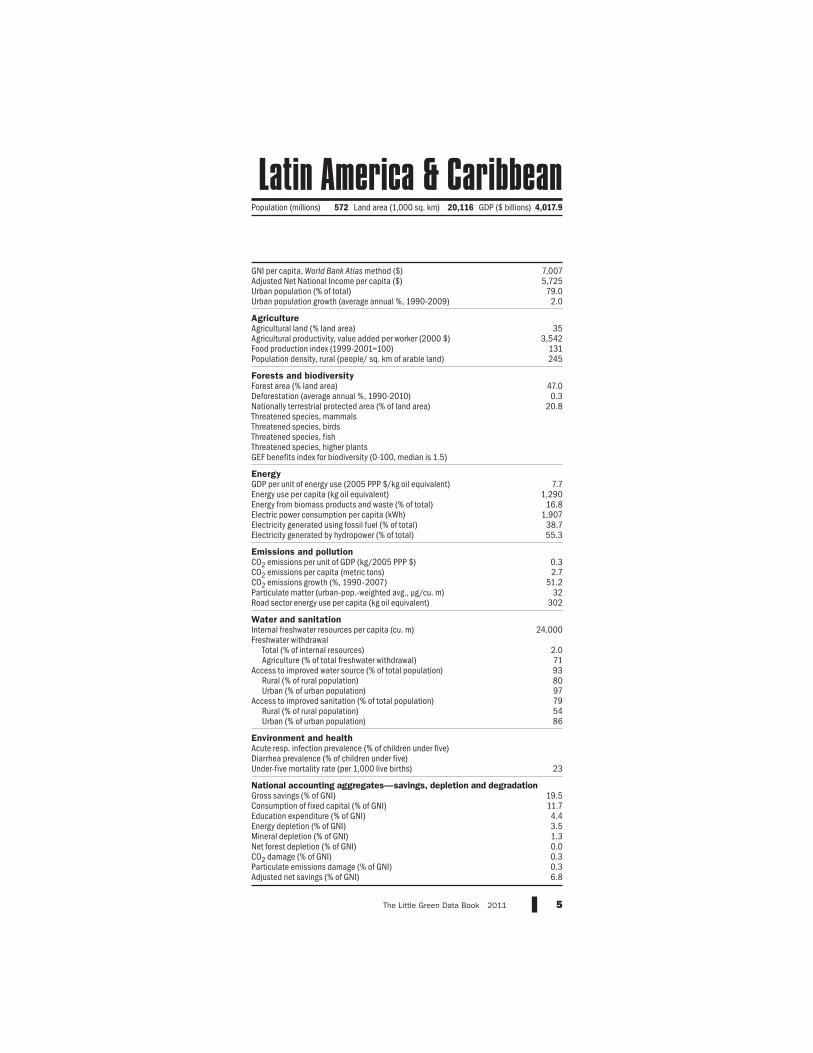
7,0075,72579.0
2.0
353,542
131245
47.00.3
20.8
7.71,290
16.81,907
38.755.3
0.32.7
51.232
302
24,000
2.071938097795486
23
19.511.74.43.51.30.00.30.36.8
Population (millions) 572 Land area (1,000 sq. km) 20,116 GDP ($ billions) 4,017.9
Latin America & Caribbean
GNI per capita, World Bank Atlas method ($)Adjusted Net National Income per capita ($)Urban population (% of total)Urban population growth (average annual %, 1990-2009) AgricultureAgricultural land (% land area)Agricultural productivity, value added per worker (2000 $)Food production index (1999-2001=100)Population density, rural (people/ sq. km of arable land) Forests and biodiversityForest area (% land area)Deforestation (average annual %, 1990-2010)Nationally terrestrial protected area (% of land area)Threatened species, mammalsThreatened species, birdsThreatened species, fishThreatened species, higher plantsGEF benefits index for biodiversity (0-100, median is 1.5) EnergyGDP per unit of energy use (2005 PPP $/kg oil equivalent)Energy use per capita (kg oil equivalent)Energy from biomass products and waste (% of total)Electric power consumption per capita (kWh)Electricity generated using fossil fuel (% of total)Electricity generated by hydropower (% of total) Emissions and pollutionCO2 emissions per unit of GDP (kg/2005 PPP $)CO2 emissions per capita (metric tons)CO2 emissions growth (%, 1990–2007)Particulate matter (urban-pop.-weighted avg., μg/cu. m)Road sector energy use per capita (kg oil equivalent) Water and sanitationInternal freshwater resources per capita (cu. m)Freshwater withdrawal
Total (% of internal resources)Agriculture (% of total freshwater withdrawal)
Access to improved water source (% of total population)Rural (% of rural population)Urban (% of urban population)
Access to improved sanitation (% of total population)Rural (% of rural population)Urban (% of urban population)
Environment and healthAcute resp. infection prevalence (% of children under five)Diarrhea prevalence (% of children under five)Under-five mortality rate (per 1,000 live births) National accounting aggregates—savings, depletion and degradationGross savings (% of GNI)Consumption of fixed capital (% of GNI)Education expenditure (% of GNI)Energy depletion (% of GNI)Mineral depletion (% of GNI)Net forest depletion (% of GNI)CO2 damage (% of GNI)Particulate emissions damage (% of GNI)Adjusted net savings (% of GNI)
6 2011 The Little Green Data Book
3,5972,859
57.62.6
232,896
132818
2.4–0.14.0
4.71,329
1.11,494
94.14.4
0.63.7
103.471
259
709
122.386878095847692
33
..10.44.3
14.50.30.00.90.6
..
Population (millions) 331 Land area (1,000 sq. km) 8,644 GDP ($ billions) 1,062.4
Middle East & North Africa
GNI per capita, World Bank Atlas method ($)Adjusted Net National Income per capita ($)Urban population (% of total)Urban population growth (average annual %, 1990-2009) AgricultureAgricultural land (% land area)Agricultural productivity, value added per worker (2000 $)Food production index (1999-2001=100)Population density, rural (people/ sq. km of arable land) Forests and biodiversityForest area (% land area)Deforestation (average annual %, 1990-2010)Nationally terrestrial protected area (% of land area)Threatened species, mammalsThreatened species, birdsThreatened species, fishThreatened species, higher plantsGEF benefits index for biodiversity (0-100, median is 1.5) EnergyGDP per unit of energy use (2005 PPP $/kg oil equivalent)Energy use per capita (kg oil equivalent)Energy from biomass products and waste (% of total)Electric power consumption per capita (kWh)Electricity generated using fossil fuel (% of total)Electricity generated by hydropower (% of total) Emissions and pollutionCO2 emissions per unit of GDP (kg/2005 PPP $)CO2 emissions per capita (metric tons)CO2 emissions growth (%, 1990–2007)Particulate matter (urban-pop.-weighted avg., μg/cu. m)Road sector energy use per capita (kg oil equivalent) Water and sanitationInternal freshwater resources per capita (cu. m)Freshwater withdrawal
Total (% of internal resources)Agriculture (% of total freshwater withdrawal)
Access to improved water source (% of total population)Rural (% of rural population)Urban (% of urban population)
Access to improved sanitation (% of total population)Rural (% of rural population)Urban (% of urban population)
Environment and healthAcute resp. infection prevalence (% of children under five)Diarrhea prevalence (% of children under five)Under-five mortality rate (per 1,000 live births) National accounting aggregates—savings, depletion and degradationGross savings (% of GNI)Consumption of fixed capital (% of GNI)Education expenditure (% of GNI)Energy depletion (% of GNI)Mineral depletion (% of GNI)Net forest depletion (% of GNI)CO2 damage (% of GNI)Particulate emissions damage (% of GNI)Adjusted net savings (% of GNI)
7The Little Green Data Book 2011
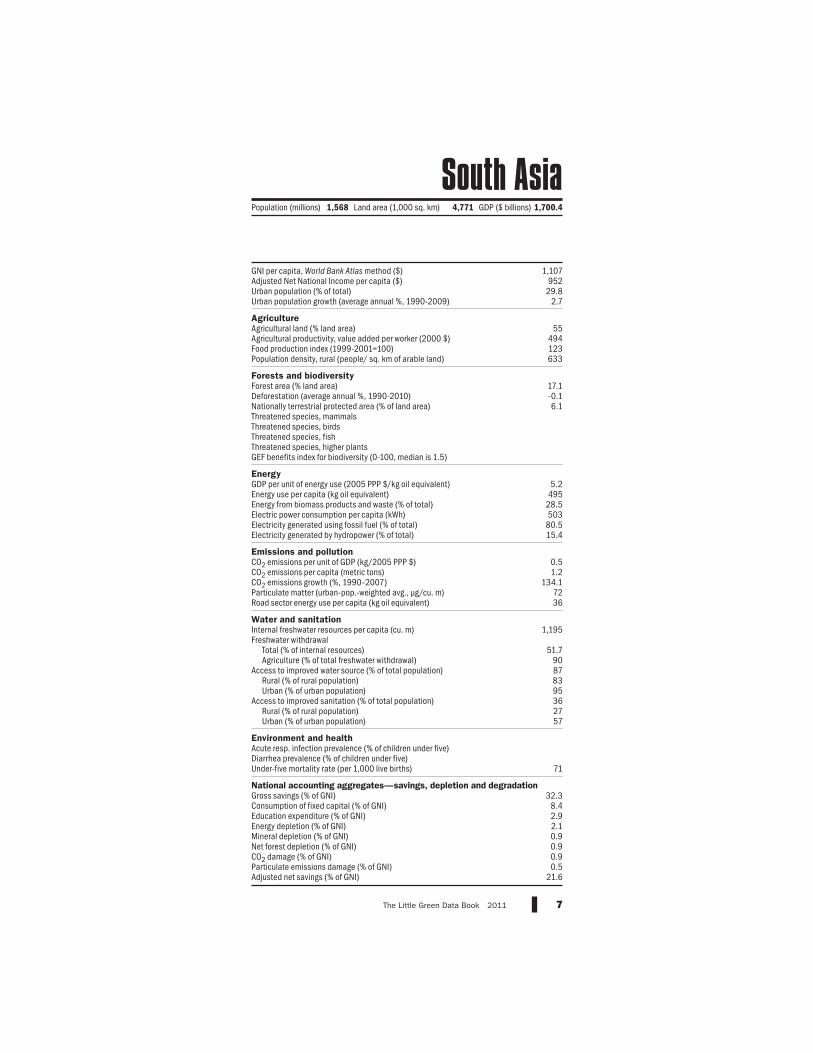
1,10795229.8
2.7
55494123633
17.1-0.16.1
5.2495
28.550380.515.4
0.51.2
134.17236
1,195
51.790878395362757
71
32.38.42.92.10.90.90.90.5
21.6
Population (millions) 1,568 Land area (1,000 sq. km) 4,771 GDP ($ billions) 1,700.4
South Asia
GNI per capita, World Bank Atlas method ($)Adjusted Net National Income per capita ($)Urban population (% of total)Urban population growth (average annual %, 1990-2009) AgricultureAgricultural land (% land area)Agricultural productivity, value added per worker (2000 $)Food production index (1999-2001=100)Population density, rural (people/ sq. km of arable land) Forests and biodiversityForest area (% land area)Deforestation (average annual %, 1990-2010)Nationally terrestrial protected area (% of land area)Threatened species, mammalsThreatened species, birdsThreatened species, fishThreatened species, higher plantsGEF benefits index for biodiversity (0-100, median is 1.5) EnergyGDP per unit of energy use (2005 PPP $/kg oil equivalent)Energy use per capita (kg oil equivalent)Energy from biomass products and waste (% of total)Electric power consumption per capita (kWh)Electricity generated using fossil fuel (% of total)Electricity generated by hydropower (% of total) Emissions and pollutionCO2 emissions per unit of GDP (kg/2005 PPP $)CO2 emissions per capita (metric tons)CO2 emissions growth (%, 1990–2007)Particulate matter (urban-pop.-weighted avg., μg/cu. m)Road sector energy use per capita (kg oil equivalent) Water and sanitationInternal freshwater resources per capita (cu. m)Freshwater withdrawal
Total (% of internal resources)Agriculture (% of total freshwater withdrawal)
Access to improved water source (% of total population)Rural (% of rural population)Urban (% of urban population)
Access to improved sanitation (% of total population)Rural (% of rural population)Urban (% of urban population)
Environment and healthAcute resp. infection prevalence (% of children under five)Diarrhea prevalence (% of children under five)Under-five mortality rate (per 1,000 live births) National accounting aggregates—savings, depletion and degradationGross savings (% of GNI)Consumption of fixed capital (% of GNI)Education expenditure (% of GNI)Energy depletion (% of GNI)Mineral depletion (% of GNI)Net forest depletion (% of GNI)CO2 damage (% of GNI)Particulate emissions damage (% of GNI)Adjusted net savings (% of GNI)
8 2011 The Little Green Data Book
1,125861
36.94.0
45314130356
28.00.3
11.7
3.267857.7531
66.217.2
0.40.8
46.14957
4,826
3.287604782312443
130
15.510.63.67.51.20.60.60.3
–1.8
Population (millions) 840 Land area (1,000 sq. km) 23,585 GDP ($ billions) 945.9
Sub-Saharan Africa
9The Little Green Data Book 2011
For operational and analytical purposes the World Bank’s main criterion for classifying economies is gross national income (GNI) per capita. Each economy in The Little Green Data Book is classified as low income, middle income, or high income. Low- and middle-income economies are sometimes referred to as developing economies. The use of the term is convenient; it is not intended to imply that all economies in the group are experiencing similar development or that other economies have reached a preferred or final stage of development. Classification by income does not necessarily reflect development status.
Low-income economies are those with a GNI per capita of $995 or less in 2009.
Middle-income economies are those with a GNI per capita of more than $995 but less than $12,196. Lower-middle-income and upper-middle-income economies are separated at a GNI per capita of $3,945.
High-income economies are those with a GNI per capita of $12,196 or more.
Euro area includes the member states of the Economic and Monetary Union of the European Union that have adopted the euro as their currency: Austria, Belgium, Cyprus, Estonia, Finland, France, Germany, Greece, Ireland, Italy, Luxembourg, Malta, Netherlands, Portugal, Slovak Republic, Slovenia, and Spain.
Income group tables
GNI per capita, World Bank Atlas method ($)Adjusted Net National Income per capita ($)Urban population (% of total)Urban population growth (average annual %, 1990-2009) AgricultureAgricultural land (% land area)Agricultural productivity, value added per worker (2000 $)Food production index (1999-2001=100)Population density, rural (people/ sq. km of arable land) Forests and biodiversityForest area (% land area)Deforestation (average annual %, 1990-2010)Nationally terrestrial protected area (% of land area)Threatened species, mammalsThreatened species, birdsThreatened species, fishThreatened species, higher plantsGEF benefits index for biodiversity (0-100, median is 1.5) EnergyGDP per unit of energy use (2005 PPP $/kg oil equivalent)Energy use per capita (kg oil equivalent)Energy from biomass products and waste (% of total)Electric power consumption per capita (kWh)Electricity generated using fossil fuel (% of total)Electricity generated by hydropower (% of total) Emissions and pollutionCO2 emissions per unit of GDP (kg/2005 PPP $)CO2 emissions per capita (metric tons)CO2 emissions growth (%, 1990–2007)Particulate matter (urban-pop.-weighted avg., μg/cu. m)Road sector energy use per capita (kg oil equivalent) Water and sanitationInternal freshwater resources per capita (cu. m)Freshwater withdrawal
Total (% of internal resources)Agriculture (% of total freshwater withdrawal)
Access to improved water source (% of total population)Rural (% of rural population)Urban (% of urban population)
Access to improved sanitation (% of total population)Rural (% of rural population)Urban (% of urban population)
Environment and healthAcute resp. infection prevalence (% of children under five)Diarrhea prevalence (% of children under five)Under-five mortality rate (per 1,000 live births) National accounting aggregates—savings, depletion and degradationGross savings (% of GNI)Consumption of fixed capital (% of GNI)Education expenditure (% of GNI)Energy depletion (% of GNI)Mineral depletion (% of GNI)Net forest depletion (% of GNI)CO2 damage (% of GNI)Particulate emissions damage (% of GNI)Adjusted net savings (% of GNI)
10 2011 The Little Green Data Book
50945328.7
3.7
37280134642
28.20.4
11.2
3.2357
66.2231
28.948.9
0.30.3
–36.26019
5,606
5.693645685353244
118
..7.23.21.21.31.40.30.3
..
Population (millions) 846 Land area (1,000 sq. km) 17,304 GDP ($ billions) 432.2
Low income
GNI per capita, World Bank Atlas method ($)Adjusted Net National Income per capita ($)Urban population (% of total)Urban population growth (average annual %, 1990-2009) AgricultureAgricultural land (% land area)Agricultural productivity, value added per worker (2000 $)Food production index (1999-2001=100)Population density, rural (people/ sq. km of arable land) Forests and biodiversityForest area (% land area)Deforestation (average annual %, 1990-2010)Nationally terrestrial protected area (% of land area)Threatened species, mammalsThreatened species, birdsThreatened species, fishThreatened species, higher plantsGEF benefits index for biodiversity (0-100, median is 1.5) EnergyGDP per unit of energy use (2005 PPP $/kg oil equivalent)Energy use per capita (kg oil equivalent)Energy from biomass products and waste (% of total)Electric power consumption per capita (kWh)Electricity generated using fossil fuel (% of total)Electricity generated by hydropower (% of total) Emissions and pollutionCO2 emissions per unit of GDP (kg/2005 PPP $)CO2 emissions per capita (metric tons)CO2 emissions growth (%, 1990–2007)Particulate matter (urban-pop.-weighted avg., μg/cu. m)Road sector energy use per capita (kg oil equivalent) Water and sanitationInternal freshwater resources per capita (cu. m)Freshwater withdrawal
Total (% of internal resources)Agriculture (% of total freshwater withdrawal)
Access to improved water source (% of total population)Rural (% of rural population)Urban (% of urban population)
Access to improved sanitation (% of total population)Rural (% of rural population)Urban (% of urban population)
Environment and healthAcute resp. infection prevalence (% of children under five)Diarrhea prevalence (% of children under five)Under-five mortality rate (per 1,000 live births) National accounting aggregates—savings, depletion and degradationGross savings (% of GNI)Consumption of fixed capital (% of GNI)Education expenditure (% of GNI)Energy depletion (% of GNI)Mineral depletion (% of GNI)Net forest depletion (% of GNI)CO2 damage (% of GNI)Particulate emissions damage (% of GNI)Adjusted net savings (% of GNI)
11The Little Green Data Book 2011
3,3972,804
48.02.5
38767130547
32.80.1
12.4
4.41,26113.3
1,67073.120.4
0.63.3
59.653
129
6,093
9.178888195574371
51
29.210.73.25.10.70.10.80.5
14.5
Population (millions) 4,813 Land area (1,000 sq. km) 78,353 GDP ($ billions) 16,213.2
Middle income
GNI per capita, World Bank Atlas method ($)Adjusted Net National Income per capita ($)Urban population (% of total)Urban population growth (average annual %, 1990-2009) AgricultureAgricultural land (% land area)Agricultural productivity, value added per worker (2000 $)Food production index (1999-2001=100)Population density, rural (people/ sq. km of arable land) Forests and biodiversityForest area (% land area)Deforestation (average annual %, 1990-2010)Nationally terrestrial protected area (% of land area)Threatened species, mammalsThreatened species, birdsThreatened species, fishThreatened species, higher plantsGEF benefits index for biodiversity (0-100, median is 1.5) EnergyGDP per unit of energy use (2005 PPP $/kg oil equivalent)Energy use per capita (kg oil equivalent)Energy from biomass products and waste (% of total)Electric power consumption per capita (kWh)Electricity generated using fossil fuel (% of total)Electricity generated by hydropower (% of total) Emissions and pollutionCO2 emissions per unit of GDP (kg/2005 PPP $)CO2 emissions per capita (metric tons)CO2 emissions growth (%, 1990–2007)Particulate matter (urban-pop.-weighted avg., μg/cu. m)Road sector energy use per capita (kg oil equivalent) Water and sanitationInternal freshwater resources per capita (cu. m)Freshwater withdrawal
Total (% of internal resources)Agriculture (% of total freshwater withdrawal)
Access to improved water source (% of total population)Rural (% of rural population)Urban (% of urban population)
Access to improved sanitation (% of total population)Rural (% of rural population)Urban (% of urban population)
Environment and healthAcute resp. infection prevalence (% of children under five)Diarrhea prevalence (% of children under five)Under-five mortality rate (per 1,000 live births) National accounting aggregates—savings, depletion and degradationGross savings (% of GNI)Consumption of fixed capital (% of GNI)Education expenditure (% of GNI)Energy depletion (% of GNI)Mineral depletion (% of GNI)Net forest depletion (% of GNI)CO2 damage (% of GNI)Particulate emissions damage (% of GNI)Adjusted net savings (% of GNI)
12 2011 The Little Green Data Book
2,3212,02840.9
3.0
50588131591
25.90.0
11.5
4.01,01916.9
1,31878.216.8
0.72.8
117.76378
2,936
17.981868194504163
57
39.99.92.44.00.40.21.00.7
26.2
Population (millions) 3,811 Land area (1,000 sq. km) 30,842 GDP ($ billions) 8,887.3
Lower middle income
GNI per capita, World Bank Atlas method ($)Adjusted Net National Income per capita ($)Urban population (% of total)Urban population growth (average annual %, 1990-2009) AgricultureAgricultural land (% land area)Agricultural productivity, value added per worker (2000 $)Food production index (1999-2001=100)Population density, rural (people/ sq. km of arable land) Forests and biodiversityForest area (% land area)Deforestation (average annual %, 1990-2010)Nationally terrestrial protected area (% of land area)Threatened species, mammalsThreatened species, birdsThreatened species, fishThreatened species, higher plantsGEF benefits index for biodiversity (0-100, median is 1.5) EnergyGDP per unit of energy use (2005 PPP $/kg oil equivalent)Energy use per capita (kg oil equivalent)Energy from biomass products and waste (% of total)Electric power consumption per capita (kWh)Electricity generated using fossil fuel (% of total)Electricity generated by hydropower (% of total) Emissions and pollutionCO2 emissions per unit of GDP (kg/2005 PPP $)CO2 emissions per capita (metric tons)CO2 emissions growth (%, 1990–2007)Particulate matter (urban-pop.-weighted avg., μg/cu. m)Road sector energy use per capita (kg oil equivalent) Water and sanitationInternal freshwater resources per capita (cu. m)Freshwater withdrawal
Total (% of internal resources)Agriculture (% of total freshwater withdrawal)
Access to improved water source (% of total population)Rural (% of rural population)Urban (% of urban population)
Access to improved sanitation (% of total population)Rural (% of rural population)Urban (% of urban population)
Environment and healthAcute resp. infection prevalence (% of children under five)Diarrhea prevalence (% of children under five)Under-five mortality rate (per 1,000 live births) National accounting aggregates—savings, depletion and degradationGross savings (% of GNI)Consumption of fixed capital (% of GNI)Education expenditure (% of GNI)Energy depletion (% of GNI)Mineral depletion (% of GNI)Net forest depletion (% of GNI)CO2 damage (% of GNI)Particulate emissions damage (% of GNI)Adjusted net savings (% of GNI)
13The Little Green Data Book 2011
7,5025,773
74.91.6
303,671
129153
37.20.1
13.0
5.22,177
6.83,001
64.726.4
0.55.33.831
320
18,143
3.265958698846790
22
19.911.8
4.16.41.00.00.60.23.9
Population (millions) 1,002 Land area (1,000 sq. km) 47,511 GDP ($ billions) 7,318.4
Upper middle income
GNI per capita, World Bank Atlas method ($)Adjusted Net National Income per capita ($)Urban population (% of total)Urban population growth (average annual %, 1990-2009) AgricultureAgricultural land (% land area)Agricultural productivity, value added per worker (2000 $)Food production index (1999-2001=100)Population density, rural (people/ sq. km of arable land) Forests and biodiversityForest area (% land area)Deforestation (average annual %, 1990-2010)Nationally terrestrial protected area (% of land area)Threatened species, mammalsThreatened species, birdsThreatened species, fishThreatened species, higher plantsGEF benefits index for biodiversity (0-100, median is 1.5) EnergyGDP per unit of energy use (2005 PPP $/kg oil equivalent)Energy use per capita (kg oil equivalent)Energy from biomass products and waste (% of total)Electric power consumption per capita (kWh)Electricity generated using fossil fuel (% of total)Electricity generated by hydropower (% of total) Emissions and pollutionCO2 emissions per unit of GDP (kg/2005 PPP $)CO2 emissions per capita (metric tons)CO2 emissions growth (%, 1990–2007)Particulate matter (urban-pop.-weighted avg., μg/cu. m)Road sector energy use per capita (kg oil equivalent) Water and sanitationInternal freshwater resources per capita (cu. m)Freshwater withdrawal
Total (% of internal resources)Agriculture (% of total freshwater withdrawal)
Access to improved water source (% of total population)Rural (% of rural population)Urban (% of urban population)
Access to improved sanitation (% of total population)Rural (% of rural population)Urban (% of urban population)
Environment and healthAcute resp. infection prevalence (% of children under five)Diarrhea prevalence (% of children under five)Under-five mortality rate (per 1,000 live births) National accounting aggregates—savings, depletion and degradationGross savings (% of GNI)Consumption of fixed capital (% of GNI)Education expenditure (% of GNI)Energy depletion (% of GNI)Mineral depletion (% of GNI)Net forest depletion (% of GNI)CO2 damage (% of GNI)Particulate emissions damage (% of GNI)Adjusted net savings (% of GNI)
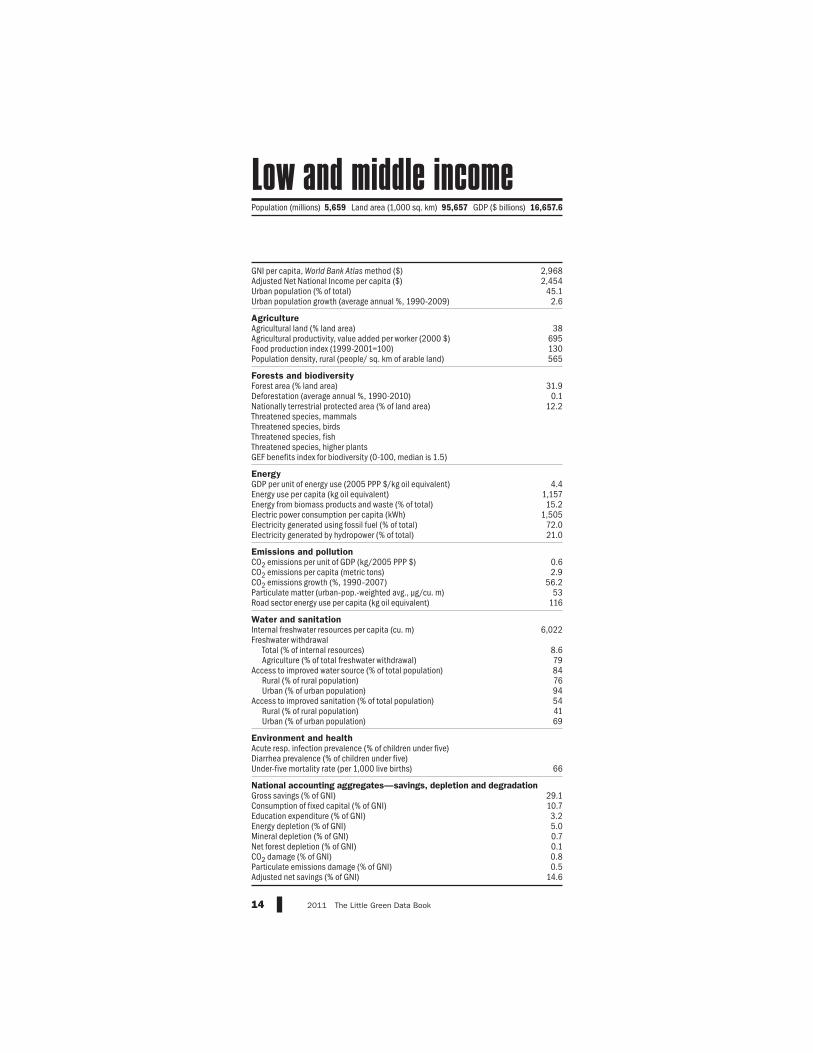
14 2011 The Little Green Data Book
2,9682,454
45.12.6
38695130565
31.90.1
12.2
4.41,15715.2
1,50572.021.0
0.62.9
56.253
116
6,022
8.679847694544169
66
29.110.73.25.00.70.10.80.5
14.6
Population (millions) 5,659 Land area (1,000 sq. km) 95,657 GDP ($ billions) 16,657.6
Low and middle income
GNI per capita, World Bank Atlas method ($)Adjusted Net National Income per capita ($)Urban population (% of total)Urban population growth (average annual %, 1990-2009) AgricultureAgricultural land (% land area)Agricultural productivity, value added per worker (2000 $)Food production index (1999-2001=100)Population density, rural (people/ sq. km of arable land) Forests and biodiversityForest area (% land area)Deforestation (average annual %, 1990-2010)Nationally terrestrial protected area (% of land area)Threatened species, mammalsThreatened species, birdsThreatened species, fishThreatened species, higher plantsGEF benefits index for biodiversity (0-100, median is 1.5) EnergyGDP per unit of energy use (2005 PPP $/kg oil equivalent)Energy use per capita (kg oil equivalent)Energy from biomass products and waste (% of total)Electric power consumption per capita (kWh)Electricity generated using fossil fuel (% of total)Electricity generated by hydropower (% of total) Emissions and pollutionCO2 emissions per unit of GDP (kg/2005 PPP $)CO2 emissions per capita (metric tons)CO2 emissions growth (%, 1990–2007)Particulate matter (urban-pop.-weighted avg., μg/cu. m)Road sector energy use per capita (kg oil equivalent) Water and sanitationInternal freshwater resources per capita (cu. m)Freshwater withdrawal
Total (% of internal resources)Agriculture (% of total freshwater withdrawal)
Access to improved water source (% of total population)Rural (% of rural population)Urban (% of urban population)
Access to improved sanitation (% of total population)Rural (% of rural population)Urban (% of urban population)
Environment and healthAcute resp. infection prevalence (% of children under five)Diarrhea prevalence (% of children under five)Under-five mortality rate (per 1,000 live births) National accounting aggregates—savings, depletion and degradationGross savings (% of GNI)Consumption of fixed capital (% of GNI)Education expenditure (% of GNI)Energy depletion (% of GNI)Mineral depletion (% of GNI)Net forest depletion (% of GNI)CO2 damage (% of GNI)Particulate emissions damage (% of GNI)Adjusted net savings (% of GNI)
15The Little Green Data Book 2011
38,87232,385
73.40.6
4424,856
98189
37.3–0.415.4
8.23,763
5.96,97050.3
9.5
0.38.22.420
665
2,998
22.038
100100100100100100
4
18.714.24.50.10.00.00.20.18.7
Population (millions) 327 Land area (1,000 sq. km) 2,552 GDP ($ billions) 12,465.3
Euro area
GNI per capita, World Bank Atlas method ($)Adjusted Net National Income per capita ($)Urban population (% of total)Urban population growth (average annual %, 1990-2009) AgricultureAgricultural land (% land area)Agricultural productivity, value added per worker (2000 $)Food production index (1999-2001=100)Population density, rural (people/ sq. km of arable land) Forests and biodiversityForest area (% land area)Deforestation (average annual %, 1990-2010)Nationally terrestrial protected area (% of land area)Threatened species, mammalsThreatened species, birdsThreatened species, fishThreatened species, higher plantsGEF benefits index for biodiversity (0-100, median is 1.5) EnergyGDP per unit of energy use (2005 PPP $/kg oil equivalent)Energy use per capita (kg oil equivalent)Energy from biomass products and waste (% of total)Electric power consumption per capita (kWh)Electricity generated using fossil fuel (% of total)Electricity generated by hydropower (% of total) Emissions and pollutionCO2 emissions per unit of GDP (kg/2005 PPP $)CO2 emissions per capita (metric tons)CO2 emissions growth (%, 1990–2007)Particulate matter (urban-pop.-weighted avg., μg/cu. m)Road sector energy use per capita (kg oil equivalent) Water and sanitationInternal freshwater resources per capita (cu. m)Freshwater withdrawal
Total (% of internal resources)Agriculture (% of total freshwater withdrawal)
Access to improved water source (% of total population)Rural (% of rural population)Urban (% of urban population)
Access to improved sanitation (% of total population)Rural (% of rural population)Urban (% of urban population)
Environment and healthAcute resp. infection prevalence (% of children under five)Diarrhea prevalence (% of children under five)Under-five mortality rate (per 1,000 live births) National accounting aggregates—savings, depletion and degradationGross savings (% of GNI)Consumption of fixed capital (% of GNI)Education expenditure (% of GNI)Energy depletion (% of GNI)Mineral depletion (% of GNI)Net forest depletion (% of GNI)CO2 damage (% of GNI)Particulate emissions damage (% of GNI)Adjusted net savings (% of GNI)
16 2011 The Little Green Data Book
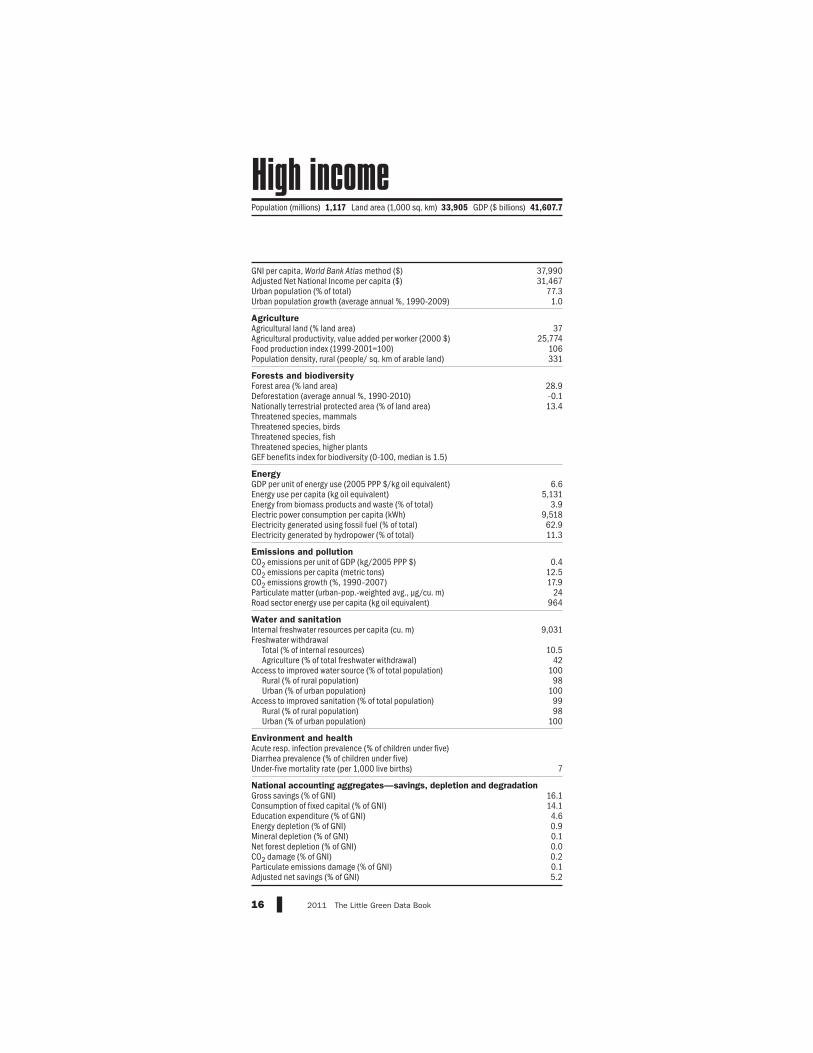
37,99031,467
77.31.0
3725,774
106331
28.9-0.113.4
6.65,131
3.99,51862.911.3
0.412.517.9
24964
9,031
10.542
10098
1009998
100
7
16.114.14.60.90.10.00.20.15.2
Population (millions) 1,117 Land area (1,000 sq. km) 33,905 GDP ($ billions) 41,607.7
High income
17The Little Green Data Book 2011
China
Data for China do not include data for Hong Kong SAR, China; Macao SAR,
China; or Taiwan, China.
Cyprus
GNI and GDP data and all data calculated using GNI and GDP data refer to
the area controlled by the government of the Republic of Cyprus. For more
information, see World Development Indicators 2011 or data.worldbank.org.
Georgia
GNI and GDP data and data calculated using GNI and GDP exclude Abkhazia
and South Ossetia. For more information, see World Development Indicators
2011 or data.worldbank.org.
Kosovo, Montenegro, and Serbia
Montenegro declared independence from Serbia and Montenegro on June 3,
2006. Where available, data for each country are shown separately. However,
some indicators for Serbia prior to 2006 include data for Montenegro.
Moreover, data for most indicators for Serbia from 1999 onward exclude
data for Kosovo, which in 1999 became a territory under international admin-
istration pursuant to UN Security Council Resolution 1244 (1999). Kosovo
became a member of the World Bank on June 29, 2009, and its data are
shown where available.
Moldova
GNI and GDP data and all data calculated using GNI and GDP data exclude
Transnistria. For more information, see World Development Indicators 2011
or data.worldbank.org.
Morocco
GNI and GDP data and all data calculated using GNI and GDP data include
Former Spanish Sahara. For more information, see World Development
Indicators 2011 or data.worldbank.org.
Country tables
18 2011 The Little Green Data Book
Netherlands Antilles
Netherlands Antilles ceased to exist on 10 October 2010. Curaçao and St
Maarten became countries within the Kingdom of the Netherlands. Bonaire,
St Eustatius and Saba became special municipalities of the Netherlands.
Tanzania
GNI and GDP data and all data calculated using GNI and GDP data refer to mainland Tanzania only. For more information, see World Development
Indicators 2011 or data.worldbank.org.
Country tables
GNI per capita, World Bank Atlas method ($)Adjusted Net National Income per capita ($)Urban population (% of total)Urban population growth (average annual %, 1990-2009) AgricultureAgricultural land (% land area)Agricultural productivity, value added per worker (2000 $)Food production index (1999-2001=100)Population density, rural (people/ sq. km of arable land) Forests and biodiversityForest area (% land area)Deforestation (average annual %, 1990-2010)Nationally terrestrial protected area (% of land area)Threatened species, mammalsThreatened species, birdsThreatened species, fishThreatened species, higher plantsGEF benefits index for biodiversity (0-100, median is 1.5) EnergyGDP per unit of energy use (2005 PPP $/kg oil equivalent)Energy use per capita (kg oil equivalent)Energy from biomass products and waste (% of total)Electric power consumption per capita (kWh)Electricity generated using fossil fuel (% of total)Electricity generated by hydropower (% of total) Emissions and pollutionCO2 emissions per unit of GDP (kg/2005 PPP $)CO2 emissions per capita (metric tons)CO2 emissions growth (%, 1990–2007)Particulate matter (urban-pop.-weighted avg., μg/cu. m)Road sector energy use per capita (kg oil equivalent) Water and sanitationInternal freshwater resources per capita (cu. m)Freshwater withdrawal
Total (% of internal resources)Agriculture (% of total freshwater withdrawal)
Access to improved water source (% of total population)Rural (% of rural population)Urban (% of urban population)
Access to improved sanitation (% of total population)Rural (% of rural population)Urban (% of urban population)
Environment and healthAcute resp. infection prevalence (% of children under five)Diarrhea prevalence (% of children under five)Under-five mortality rate (per 1,000 live births) National accounting aggregates—savings, depletion and degradationGross savings (% of GNI)Consumption of fixed capital (% of GNI)Education expenditure (% of GNI)Energy depletion (% of GNI)Mineral depletion (% of GNI)Net forest depletion (% of GNI)CO2 damage (% of GNI)Particulate emissions damage (% of GNI)Adjusted net savings (% of GNI)
19The Little Green Data Book 2011
Country data
South Asia
group
Low-income group
Population (millions) 30 Land area (1,000 sq. km) 652 GDP ($ billions) 14.5
GNI per capita, World Bank Atlas method ($)Adjusted Net National Income per capita ($)Urban population (% of total)Urban population growth (average annual %, 1990-2009) AgricultureAgricultural land (% land area)Agricultural productivity, value added per worker (2000 $)Food production index (1999-2001=100)Population density, rural (people/ sq. km of arable land) Forests and biodiversityForest area (% land area)Deforestation (average annual %, 1990-2010)Nationally terrestrial protected area (% of land area)Threatened species, mammalsThreatened species, birdsThreatened species, fishThreatened species, higher plantsGEF benefits index for biodiversity (0-100, median is 1.5) EnergyGDP per unit of energy use (2005 PPP $/kg oil equivalent)Energy use per capita (kg oil equivalent)Energy from biomass products and waste (% of total)Electric power consumption per capita (kWh)Electricity generated using fossil fuel (% of total)Electricity generated by hydropower (% of total) Emissions and pollutionCO2 emissions per unit of GDP (kg/2005 PPP $)CO2 emissions per capita (metric tons)CO2 emissions growth (%, 1990–2007)Particulate matter (urban-pop.-weighted avg., μg/cu. m)Road sector energy use per capita (kg oil equivalent) Water and sanitationInternal freshwater resources per capita (cu. m)Freshwater withdrawal
Total (% of internal resources)Agriculture (% of total freshwater withdrawal)
Access to improved water source (% of total population)Rural (% of rural population)Urban (% of urban population)
Access to improved sanitation (% of total population)Rural (% of rural population)Urban (% of urban population)
Environment and healthAcute resp. infection prevalence (% of children under five)Diarrhea prevalence (% of children under five)Under-five mortality rate (per 1,000 live births) National accounting aggregates—savings, depletion and degradationGross savings (% of GNI)Consumption of fixed capital (% of GNI)Education expenditure (% of GNI)Energy depletion (% of GNI)Mineral depletion (% of GNI)Net forest depletion (% of GNI)CO2 damage (% of GNI)Particulate emissions damage (% of GNI)Adjusted net savings (% of GNI)
20 2011 The Little Green Data Book
Country data
Europe & Central
Asia group
Lower middle-income group
Population (millions) 3.2 Land area (1,000 sq. km) 27.4 GDP ($ billions) 12.0
GNI per capita, World Bank Atlas method ($)Adjusted Net National Income per capita ($)Urban population (% of total)Urban population growth (average annual %, 1990-2009) AgricultureAgricultural land (% land area)Agricultural productivity, value added per worker (2000 $)Food production index (1999-2001=100)Population density, rural (people/ sq. km of arable land) Forests and biodiversityForest area (% land area)Deforestation (average annual %, 1990-2010)Nationally terrestrial protected area (% of land area)Threatened species, mammalsThreatened species, birdsThreatened species, fishThreatened species, higher plantsGEF benefits index for biodiversity (0-100, median is 1.5) EnergyGDP per unit of energy use (2005 PPP $/kg oil equivalent)Energy use per capita (kg oil equivalent)Energy from biomass products and waste (% of total)Electric power consumption per capita (kWh)Electricity generated using fossil fuel (% of total)Electricity generated by hydropower (% of total) Emissions and pollutionCO2 emissions per unit of GDP (kg/2005 PPP $)CO2 emissions per capita (metric tons)CO2 emissions growth (%, 1990–2007)Particulate matter (urban-pop.-weighted avg., μg/cu. m)Road sector energy use per capita (kg oil equivalent) Water and sanitationInternal freshwater resources per capita (cu. m)Freshwater withdrawal
Total (% of internal resources)Agriculture (% of total freshwater withdrawal)
Access to improved water source (% of total population)Rural (% of rural population)Urban (% of urban population)
Access to improved sanitation (% of total population)Rural (% of rural population)Urban (% of urban population)
Environment and healthAcute resp. infection prevalence (% of children under five)Diarrhea prevalence (% of children under five)Under-five mortality rate (per 1,000 live births) National accounting aggregates—savings, depletion and degradationGross savings (% of GNI)Consumption of fixed capital (% of GNI)Education expenditure (% of GNI)Energy depletion (% of GNI)Mineral depletion (% of GNI)Net forest depletion (% of GNI)CO2 damage (% of GNI)Particulate emissions damage (% of GNI)Adjusted net savings (% of GNI)
21The Little Green Data Book 2011
Country data
Middle East &
N. Africa group
Upper middle-income group
Population (millions) 35 Land area (1,000 sq. km) 2,382 GDP ($ billions) 140.6
GNI per capita, World Bank Atlas method ($)Adjusted Net National Income per capita ($)Urban population (% of total)Urban population growth (average annual %, 1990-2009) AgricultureAgricultural land (% land area)Agricultural productivity, value added per worker (2000 $)Food production index (1999-2001=100)Population density, rural (people/ sq. km of arable land) Forests and biodiversityForest area (% land area)Deforestation (average annual %, 1990-2010)Nationally terrestrial protected area (% of land area)Threatened species, mammalsThreatened species, birdsThreatened species, fishThreatened species, higher plantsGEF benefits index for biodiversity (0-100, median is 1.5) EnergyGDP per unit of energy use (2005 PPP $/kg oil equivalent)Energy use per capita (kg oil equivalent)Energy from biomass products and waste (% of total)Electric power consumption per capita (kWh)Electricity generated using fossil fuel (% of total)Electricity generated by hydropower (% of total) Emissions and pollutionCO2 emissions per unit of GDP (kg/2005 PPP $)CO2 emissions per capita (metric tons)CO2 emissions growth (%, 1990–2007)Particulate matter (urban-pop.-weighted avg., μg/cu. m)Road sector energy use per capita (kg oil equivalent) Water and sanitationInternal freshwater resources per capita (cu. m)Freshwater withdrawal
Total (% of internal resources)Agriculture (% of total freshwater withdrawal)
Access to improved water source (% of total population)Rural (% of rural population)Urban (% of urban population)
Access to improved sanitation (% of total population)Rural (% of rural population)Urban (% of urban population)
Environment and healthAcute resp. infection prevalence (% of children under five)Diarrhea prevalence (% of children under five)Under-five mortality rate (per 1,000 live births) National accounting aggregates—savings, depletion and degradationGross savings (% of GNI)Consumption of fixed capital (% of GNI)Education expenditure (% of GNI)Energy depletion (% of GNI)Mineral depletion (% of GNI)Net forest depletion (% of GNI)CO2 damage (% of GNI)Particulate emissions damage (% of GNI)Adjusted net savings (% of GNI)
22 2011 The Little Green Data Book
Country data
East Asia & Pacific
group
Upper middle-income group
Population (thousands) 67 Land area (1,000 sq. km) 0.2 GDP ($ millions) ..
.. 3,163 7,502
.. 2,807 5,77392.7 45.0 74.9
.. 3.4 1.6
25 48 30.. 550 3,671
128 135 129254 657 153
90.0 29.6 37.20.0 –0.2 0.10.3 14.9 13.0
1881
0.3
.. 3.8 5.2
.. 1,380 2,177
.. 12.4 6.8
.. 1,972 3,001
.. 80.3 64.7
.. 16.4 26.4
.. 0.8 0.5
.. 4.0 5.3
.. 148.9 3.8
.. 61 31
.. 97 320
.. 4,582 18,143
.. 10.2 3.2
.. 74 65
.. 88 95
.. 81 86
.. 96 98
.. 59 84
.. 54 67
.. 64 90
..
..
.. 26 22
.. 46.5 19.9
.. 10.3 11.8
.. 2.1 4.1
.. 3.3 6.4
.. 0.3 1.0
.. 0.0 0.0
.. 1.0 0.6
.. 0.7 0.2
.. 33.1 3.9
American Samoa
GNI per capita, World Bank Atlas method ($)Adjusted Net National Income per capita ($)Urban population (% of total)Urban population growth (average annual %, 1990-2009) AgricultureAgricultural land (% land area)Agricultural productivity, value added per worker (2000 $)Food production index (1999-2001=100)Population density, rural (people/ sq. km of arable land) Forests and biodiversityForest area (% land area)Deforestation (average annual %, 1990-2010)Nationally terrestrial protected area (% of land area)Threatened species, mammalsThreatened species, birdsThreatened species, fishThreatened species, higher plantsGEF benefits index for biodiversity (0-100, median is 1.5) EnergyGDP per unit of energy use (2005 PPP $/kg oil equivalent)Energy use per capita (kg oil equivalent)Energy from biomass products and waste (% of total)Electric power consumption per capita (kWh)Electricity generated using fossil fuel (% of total)Electricity generated by hydropower (% of total) Emissions and pollutionCO2 emissions per unit of GDP (kg/2005 PPP $)CO2 emissions per capita (metric tons)CO2 emissions growth (%, 1990–2007)Particulate matter (urban-pop.-weighted avg., μg/cu. m)Road sector energy use per capita (kg oil equivalent) Water and sanitationInternal freshwater resources per capita (cu. m)Freshwater withdrawal
Total (% of internal resources)Agriculture (% of total freshwater withdrawal)
Access to improved water source (% of total population)Rural (% of rural population)Urban (% of urban population)
Access to improved sanitation (% of total population)Rural (% of rural population)Urban (% of urban population)
Environment and healthAcute resp. infection prevalence (% of children under five)Diarrhea prevalence (% of children under five)Under-five mortality rate (per 1,000 live births) National accounting aggregates—savings, depletion and degradationGross savings (% of GNI)Consumption of fixed capital (% of GNI)Education expenditure (% of GNI)Energy depletion (% of GNI)Mineral depletion (% of GNI)Net forest depletion (% of GNI)CO2 damage (% of GNI)Particulate emissions damage (% of GNI)Adjusted net savings (% of GNI)
23The Little Green Data Book 2011
Country data
High-income group
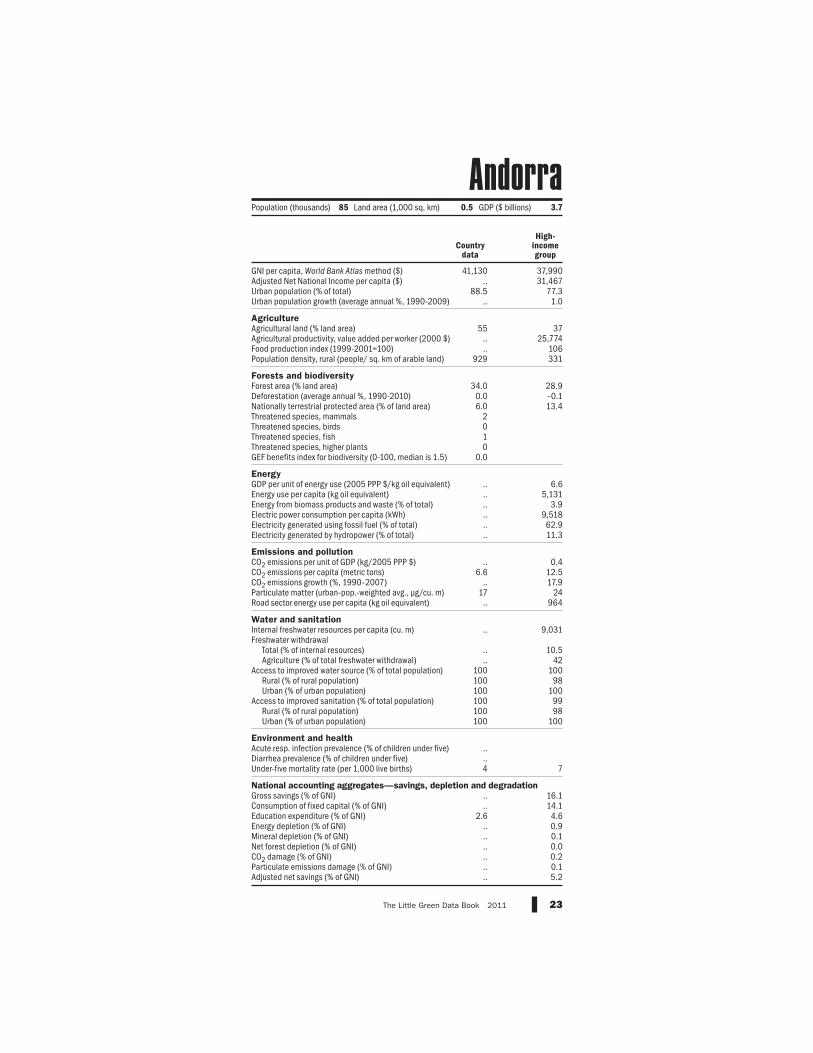
Population (thousands) 85 Land area (1,000 sq. km) 0.5 GDP ($ billions) 3.7
41,130 37,990.. 31,467
88.5 77.3.. 1.0
55 37.. 25,774.. 106
929 331
34.0 28.90.0 –0.16.0 13.4
2010
0.0
.. 6.6
.. 5,131
.. 3.9
.. 9,518
.. 62.9
.. 11.3
.. 0.46.6 12.5
.. 17.917 24.. 964
.. 9,031
.. 10.5
.. 42100 100100 98100 100100 99100 98100 100
..
..4 7
.. 16.1
.. 14.12.6 4.6
.. 0.9
.. 0.1
.. 0.0
.. 0.2
.. 0.1
.. 5.2
Andorra
GNI per capita, World Bank Atlas method ($)Adjusted Net National Income per capita ($)Urban population (% of total)Urban population growth (average annual %, 1990-2009) AgricultureAgricultural land (% land area)Agricultural productivity, value added per worker (2000 $)Food production index (1999-2001=100)Population density, rural (people/ sq. km of arable land) Forests and biodiversityForest area (% land area)Deforestation (average annual %, 1990-2010)Nationally terrestrial protected area (% of land area)Threatened species, mammalsThreatened species, birdsThreatened species, fishThreatened species, higher plantsGEF benefits index for biodiversity (0-100, median is 1.5) EnergyGDP per unit of energy use (2005 PPP $/kg oil equivalent)Energy use per capita (kg oil equivalent)Energy from biomass products and waste (% of total)Electric power consumption per capita (kWh)Electricity generated using fossil fuel (% of total)Electricity generated by hydropower (% of total) Emissions and pollutionCO2 emissions per unit of GDP (kg/2005 PPP $)CO2 emissions per capita (metric tons)CO2 emissions growth (%, 1990–2007)Particulate matter (urban-pop.-weighted avg., μg/cu. m)Road sector energy use per capita (kg oil equivalent) Water and sanitationInternal freshwater resources per capita (cu. m)Freshwater withdrawal
Total (% of internal resources)Agriculture (% of total freshwater withdrawal)
Access to improved water source (% of total population)Rural (% of rural population)Urban (% of urban population)
Access to improved sanitation (% of total population)Rural (% of rural population)Urban (% of urban population)
Environment and healthAcute resp. infection prevalence (% of children under five)Diarrhea prevalence (% of children under five)Under-five mortality rate (per 1,000 live births) National accounting aggregates—savings, depletion and degradationGross savings (% of GNI)Consumption of fixed capital (% of GNI)Education expenditure (% of GNI)Energy depletion (% of GNI)Mineral depletion (% of GNI)Net forest depletion (% of GNI)CO2 damage (% of GNI)Particulate emissions damage (% of GNI)Adjusted net savings (% of GNI)
24 2011 The Little Green Data Book
Country data
Sub-Saharan Africa group
Lower middle-income group
Population (millions) 18 Land area (1,000 sq. km) 1,247 GDP ($ billions) 75.5
GNI per capita, World Bank Atlas method ($)Adjusted Net National Income per capita ($)Urban population (% of total)Urban population growth (average annual %, 1990-2009) AgricultureAgricultural land (% land area)Agricultural productivity, value added per worker (2000 $)Food production index (1999-2001=100)Population density, rural (people/ sq. km of arable land) Forests and biodiversityForest area (% land area)Deforestation (average annual %, 1990-2010)Nationally terrestrial protected area (% of land area)Threatened species, mammalsThreatened species, birdsThreatened species, fishThreatened species, higher plantsGEF benefits index for biodiversity (0-100, median is 1.5) EnergyGDP per unit of energy use (2005 PPP $/kg oil equivalent)Energy use per capita (kg oil equivalent)Energy from biomass products and waste (% of total)Electric power consumption per capita (kWh)Electricity generated using fossil fuel (% of total)Electricity generated by hydropower (% of total) Emissions and pollutionCO2 emissions per unit of GDP (kg/2005 PPP $)CO2 emissions per capita (metric tons)CO2 emissions growth (%, 1990–2007)Particulate matter (urban-pop.-weighted avg., μg/cu. m)Road sector energy use per capita (kg oil equivalent) Water and sanitationInternal freshwater resources per capita (cu. m)Freshwater withdrawal
Total (% of internal resources)Agriculture (% of total freshwater withdrawal)
Access to improved water source (% of total population)Rural (% of rural population)Urban (% of urban population)
Access to improved sanitation (% of total population)Rural (% of rural population)Urban (% of urban population)
Environment and healthAcute resp. infection prevalence (% of children under five)Diarrhea prevalence (% of children under five)Under-five mortality rate (per 1,000 live births) National accounting aggregates—savings, depletion and degradationGross savings (% of GNI)Consumption of fixed capital (% of GNI)Education expenditure (% of GNI)Energy depletion (% of GNI)Mineral depletion (% of GNI)Net forest depletion (% of GNI)CO2 damage (% of GNI)Particulate emissions damage (% of GNI)Adjusted net savings (% of GNI)
25The Little Green Data Book 2011
Country data
Latin America & Caribbean
group
Upper middle-income group
Population (thousands) 88 Land area (1,000 sq. km) 0.4 GDP ($ billions) 1.1
12,130 7,007 7,502.. 5,725 5,773
30.4 79.0 74.91.0 2.0 1.6
30 35 303,378 3,542 3,671
112 131 129753 245 153
22.7 47.0 37.20.0 0.3 0.17.0 20.8 13.0
21
144
0.7
.. 7.7 5.2
.. 1,290 2,177
.. 16.8 6.8
.. 1,907 3,001
.. 38.7 64.7
.. 55.3 26.4
0.3 0.3 0.55.1 2.7 5.3
45.1 51.2 3.813 32 31
.. 302 320
607 24,000 18,143
3.3 2.0 3.2.. 71 65
91 93 9589 80 8695 97 9895 79 8494 54 6798 86 90
..
..12 23 22
53.7 19.5 19.913.0 11.7 11.8
4.0 4.4 4.10.0 3.5 6.40.0 1.3 1.0
.. 0.0 0.00.3 0.3 0.6
.. 0.3 0.2
.. 6.8 3.9
Antigua and Barbuda
GNI per capita, World Bank Atlas method ($)Adjusted Net National Income per capita ($)Urban population (% of total)Urban population growth (average annual %, 1990-2009) AgricultureAgricultural land (% land area)Agricultural productivity, value added per worker (2000 $)Food production index (1999-2001=100)Population density, rural (people/ sq. km of arable land) Forests and biodiversityForest area (% land area)Deforestation (average annual %, 1990-2010)Nationally terrestrial protected area (% of land area)Threatened species, mammalsThreatened species, birdsThreatened species, fishThreatened species, higher plantsGEF benefits index for biodiversity (0-100, median is 1.5) EnergyGDP per unit of energy use (2005 PPP $/kg oil equivalent)Energy use per capita (kg oil equivalent)Energy from biomass products and waste (% of total)Electric power consumption per capita (kWh)Electricity generated using fossil fuel (% of total)Electricity generated by hydropower (% of total) Emissions and pollutionCO2 emissions per unit of GDP (kg/2005 PPP $)CO2 emissions per capita (metric tons)CO2 emissions growth (%, 1990–2007)Particulate matter (urban-pop.-weighted avg., μg/cu. m)Road sector energy use per capita (kg oil equivalent) Water and sanitationInternal freshwater resources per capita (cu. m)Freshwater withdrawal
Total (% of internal resources)Agriculture (% of total freshwater withdrawal)
Access to improved water source (% of total population)Rural (% of rural population)Urban (% of urban population)
Access to improved sanitation (% of total population)Rural (% of rural population)Urban (% of urban population)
Environment and healthAcute resp. infection prevalence (% of children under five)Diarrhea prevalence (% of children under five)Under-five mortality rate (per 1,000 live births) National accounting aggregates—savings, depletion and degradationGross savings (% of GNI)Consumption of fixed capital (% of GNI)Education expenditure (% of GNI)Energy depletion (% of GNI)Mineral depletion (% of GNI)Net forest depletion (% of GNI)CO2 damage (% of GNI)Particulate emissions damage (% of GNI)Adjusted net savings (% of GNI)
26 2011 The Little Green Data Book
Country data
Latin America & Caribbean
group
Upper middle-income group
Population (millions) 40 Land area (1,000 sq. km) 2,737 GDP ($ billions) 307.2
GNI per capita, World Bank Atlas method ($)Adjusted Net National Income per capita ($)Urban population (% of total)Urban population growth (average annual %, 1990-2009) AgricultureAgricultural land (% land area)Agricultural productivity, value added per worker (2000 $)Food production index (1999-2001=100)Population density, rural (people/ sq. km of arable land) Forests and biodiversityForest area (% land area)Deforestation (average annual %, 1990-2010)Nationally terrestrial protected area (% of land area)Threatened species, mammalsThreatened species, birdsThreatened species, fishThreatened species, higher plantsGEF benefits index for biodiversity (0-100, median is 1.5) EnergyGDP per unit of energy use (2005 PPP $/kg oil equivalent)Energy use per capita (kg oil equivalent)Energy from biomass products and waste (% of total)Electric power consumption per capita (kWh)Electricity generated using fossil fuel (% of total)Electricity generated by hydropower (% of total) Emissions and pollutionCO2 emissions per unit of GDP (kg/2005 PPP $)CO2 emissions per capita (metric tons)CO2 emissions growth (%, 1990–2007)Particulate matter (urban-pop.-weighted avg., μg/cu. m)Road sector energy use per capita (kg oil equivalent) Water and sanitationInternal freshwater resources per capita (cu. m)Freshwater withdrawal
Total (% of internal resources)Agriculture (% of total freshwater withdrawal)
Access to improved water source (% of total population)Rural (% of rural population)Urban (% of urban population)
Access to improved sanitation (% of total population)Rural (% of rural population)Urban (% of urban population)
Environment and healthAcute resp. infection prevalence (% of children under five)Diarrhea prevalence (% of children under five)Under-five mortality rate (per 1,000 live births) National accounting aggregates—savings, depletion and degradationGross savings (% of GNI)Consumption of fixed capital (% of GNI)Education expenditure (% of GNI)Energy depletion (% of GNI)Mineral depletion (% of GNI)Net forest depletion (% of GNI)CO2 damage (% of GNI)Particulate emissions damage (% of GNI)Adjusted net savings (% of GNI)
27The Little Green Data Book 2011
Country data
Europe & Central
Asia group
Lower middle-income group
Population (millions) 3.1 Land area (1,000 sq. km) 28.5 GDP ($ billions) 8.7
GNI per capita, World Bank Atlas method ($)Adjusted Net National Income per capita ($)Urban population (% of total)Urban population growth (average annual %, 1990-2009) AgricultureAgricultural land (% land area)Agricultural productivity, value added per worker (2000 $)Food production index (1999-2001=100)Population density, rural (people/ sq. km of arable land) Forests and biodiversityForest area (% land area)Deforestation (average annual %, 1990-2010)Nationally terrestrial protected area (% of land area)Threatened species, mammalsThreatened species, birdsThreatened species, fishThreatened species, higher plantsGEF benefits index for biodiversity (0-100, median is 1.5) EnergyGDP per unit of energy use (2005 PPP $/kg oil equivalent)Energy use per capita (kg oil equivalent)Energy from biomass products and waste (% of total)Electric power consumption per capita (kWh)Electricity generated using fossil fuel (% of total)Electricity generated by hydropower (% of total) Emissions and pollutionCO2 emissions per unit of GDP (kg/2005 PPP $)CO2 emissions per capita (metric tons)CO2 emissions growth (%, 1990–2007)Particulate matter (urban-pop.-weighted avg., μg/cu. m)Road sector energy use per capita (kg oil equivalent) Water and sanitationInternal freshwater resources per capita (cu. m)Freshwater withdrawal
Total (% of internal resources)Agriculture (% of total freshwater withdrawal)
Access to improved water source (% of total population)Rural (% of rural population)Urban (% of urban population)
Access to improved sanitation (% of total population)Rural (% of rural population)Urban (% of urban population)
Environment and healthAcute resp. infection prevalence (% of children under five)Diarrhea prevalence (% of children under five)Under-five mortality rate (per 1,000 live births) National accounting aggregates—savings, depletion and degradationGross savings (% of GNI)Consumption of fixed capital (% of GNI)Education expenditure (% of GNI)Energy depletion (% of GNI)Mineral depletion (% of GNI)Net forest depletion (% of GNI)CO2 damage (% of GNI)Particulate emissions damage (% of GNI)Adjusted net savings (% of GNI)
28 2011 The Little Green Data Book
Country data
High-income group
Population (thousands) 107 Land area (1,000 sq. km) 0.2 GDP ($ millions) ..
.. 37,990
.. 31,46746.8 77.3
2.4 1.0
11 37.. 25,774.. 106
2,806 331
.. 28.9
.. –0.10.1 13.4
21
151
0.3
.. 6.6
.. 5,131
.. 3.9
.. 9,518
.. 62.9
.. 11.3
.. 0.423.0 12.530.3 17.9
.. 24
.. 964
.. 9,031
.. 10.5
.. 42100 100100 98100 100
.. 99
.. 98
.. 100
..
..
.. 7
.. 16.1
.. 14.14.6 4.6
.. 0.9
.. 0.1
.. 0.0
.. 0.2
.. 0.1
.. 5.2
Aruba
GNI per capita, World Bank Atlas method ($)Adjusted Net National Income per capita ($)Urban population (% of total)Urban population growth (average annual %, 1990-2009) AgricultureAgricultural land (% land area)Agricultural productivity, value added per worker (2000 $)Food production index (1999-2001=100)Population density, rural (people/ sq. km of arable land) Forests and biodiversityForest area (% land area)Deforestation (average annual %, 1990-2010)Nationally terrestrial protected area (% of land area)Threatened species, mammalsThreatened species, birdsThreatened species, fishThreatened species, higher plantsGEF benefits index for biodiversity (0-100, median is 1.5) EnergyGDP per unit of energy use (2005 PPP $/kg oil equivalent)Energy use per capita (kg oil equivalent)Energy from biomass products and waste (% of total)Electric power consumption per capita (kWh)Electricity generated using fossil fuel (% of total)Electricity generated by hydropower (% of total) Emissions and pollutionCO2 emissions per unit of GDP (kg/2005 PPP $)CO2 emissions per capita (metric tons)CO2 emissions growth (%, 1990–2007)Particulate matter (urban-pop.-weighted avg., μg/cu. m)Road sector energy use per capita (kg oil equivalent) Water and sanitationInternal freshwater resources per capita (cu. m)Freshwater withdrawal
Total (% of internal resources)Agriculture (% of total freshwater withdrawal)
Access to improved water source (% of total population)Rural (% of rural population)Urban (% of urban population)
Access to improved sanitation (% of total population)Rural (% of rural population)Urban (% of urban population)
Environment and healthAcute resp. infection prevalence (% of children under five)Diarrhea prevalence (% of children under five)Under-five mortality rate (per 1,000 live births) National accounting aggregates—savings, depletion and degradationGross savings (% of GNI)Consumption of fixed capital (% of GNI)Education expenditure (% of GNI)Energy depletion (% of GNI)Mineral depletion (% of GNI)Net forest depletion (% of GNI)CO2 damage (% of GNI)Particulate emissions damage (% of GNI)Adjusted net savings (% of GNI)
29The Little Green Data Book 2011
Country data
High-income group
Population (millions) 22 Land area (1,000 sq. km) 7,682 GDP ($ billions) 924.8
GNI per capita, World Bank Atlas method ($)Adjusted Net National Income per capita ($)Urban population (% of total)Urban population growth (average annual %, 1990-2009) AgricultureAgricultural land (% land area)Agricultural productivity, value added per worker (2000 $)Food production index (1999-2001=100)Population density, rural (people/ sq. km of arable land) Forests and biodiversityForest area (% land area)Deforestation (average annual %, 1990-2010)Nationally terrestrial protected area (% of land area)Threatened species, mammalsThreatened species, birdsThreatened species, fishThreatened species, higher plantsGEF benefits index for biodiversity (0-100, median is 1.5) EnergyGDP per unit of energy use (2005 PPP $/kg oil equivalent)Energy use per capita (kg oil equivalent)Energy from biomass products and waste (% of total)Electric power consumption per capita (kWh)Electricity generated using fossil fuel (% of total)Electricity generated by hydropower (% of total) Emissions and pollutionCO2 emissions per unit of GDP (kg/2005 PPP $)CO2 emissions per capita (metric tons)CO2 emissions growth (%, 1990–2007)Particulate matter (urban-pop.-weighted avg., μg/cu. m)Road sector energy use per capita (kg oil equivalent) Water and sanitationInternal freshwater resources per capita (cu. m)Freshwater withdrawal
Total (% of internal resources)Agriculture (% of total freshwater withdrawal)
Access to improved water source (% of total population)Rural (% of rural population)Urban (% of urban population)
Access to improved sanitation (% of total population)Rural (% of rural population)Urban (% of urban population)
Environment and healthAcute resp. infection prevalence (% of children under five)Diarrhea prevalence (% of children under five)Under-five mortality rate (per 1,000 live births) National accounting aggregates—savings, depletion and degradationGross savings (% of GNI)Consumption of fixed capital (% of GNI)Education expenditure (% of GNI)Energy depletion (% of GNI)Mineral depletion (% of GNI)Net forest depletion (% of GNI)CO2 damage (% of GNI)Particulate emissions damage (% of GNI)Adjusted net savings (% of GNI)
30 2011 The Little Green Data Book
Country data
High-income group
Population (millions) 8.4 Land area (1,000 sq. km) 82.5 GDP ($ billions) 381.1
GNI per capita, World Bank Atlas method ($)Adjusted Net National Income per capita ($)Urban population (% of total)Urban population growth (average annual %, 1990-2009) AgricultureAgricultural land (% land area)Agricultural productivity, value added per worker (2000 $)Food production index (1999-2001=100)Population density, rural (people/ sq. km of arable land) Forests and biodiversityForest area (% land area)Deforestation (average annual %, 1990-2010)Nationally terrestrial protected area (% of land area)Threatened species, mammalsThreatened species, birdsThreatened species, fishThreatened species, higher plantsGEF benefits index for biodiversity (0-100, median is 1.5) EnergyGDP per unit of energy use (2005 PPP $/kg oil equivalent)Energy use per capita (kg oil equivalent)Energy from biomass products and waste (% of total)Electric power consumption per capita (kWh)Electricity generated using fossil fuel (% of total)Electricity generated by hydropower (% of total) Emissions and pollutionCO2 emissions per unit of GDP (kg/2005 PPP $)CO2 emissions per capita (metric tons)CO2 emissions growth (%, 1990–2007)Particulate matter (urban-pop.-weighted avg., μg/cu. m)Road sector energy use per capita (kg oil equivalent) Water and sanitationInternal freshwater resources per capita (cu. m)Freshwater withdrawal
Total (% of internal resources)Agriculture (% of total freshwater withdrawal)
Access to improved water source (% of total population)Rural (% of rural population)Urban (% of urban population)
Access to improved sanitation (% of total population)Rural (% of rural population)Urban (% of urban population)
Environment and healthAcute resp. infection prevalence (% of children under five)Diarrhea prevalence (% of children under five)Under-five mortality rate (per 1,000 live births) National accounting aggregates—savings, depletion and degradationGross savings (% of GNI)Consumption of fixed capital (% of GNI)Education expenditure (% of GNI)Energy depletion (% of GNI)Mineral depletion (% of GNI)Net forest depletion (% of GNI)CO2 damage (% of GNI)Particulate emissions damage (% of GNI)Adjusted net savings (% of GNI)
31The Little Green Data Book 2011
Country data
Europe & Central
Asia group
Upper middle-income group
Population (millions) 8.8 Land area (1,000 sq. km) 82.6 GDP ($ billions) 43.0
GNI per capita, World Bank Atlas method ($)Adjusted Net National Income per capita ($)Urban population (% of total)Urban population growth (average annual %, 1990-2009) AgricultureAgricultural land (% land area)Agricultural productivity, value added per worker (2000 $)Food production index (1999-2001=100)Population density, rural (people/ sq. km of arable land) Forests and biodiversityForest area (% land area)Deforestation (average annual %, 1990-2010)Nationally terrestrial protected area (% of land area)Threatened species, mammalsThreatened species, birdsThreatened species, fishThreatened species, higher plantsGEF benefits index for biodiversity (0-100, median is 1.5) EnergyGDP per unit of energy use (2005 PPP $/kg oil equivalent)Energy use per capita (kg oil equivalent)Energy from biomass products and waste (% of total)Electric power consumption per capita (kWh)Electricity generated using fossil fuel (% of total)Electricity generated by hydropower (% of total) Emissions and pollutionCO2 emissions per unit of GDP (kg/2005 PPP $)CO2 emissions per capita (metric tons)CO2 emissions growth (%, 1990–2007)Particulate matter (urban-pop.-weighted avg., μg/cu. m)Road sector energy use per capita (kg oil equivalent) Water and sanitationInternal freshwater resources per capita (cu. m)Freshwater withdrawal
Total (% of internal resources)Agriculture (% of total freshwater withdrawal)
Access to improved water source (% of total population)Rural (% of rural population)Urban (% of urban population)
Access to improved sanitation (% of total population)Rural (% of rural population)Urban (% of urban population)
Environment and healthAcute resp. infection prevalence (% of children under five)Diarrhea prevalence (% of children under five)Under-five mortality rate (per 1,000 live births) National accounting aggregates—savings, depletion and degradationGross savings (% of GNI)Consumption of fixed capital (% of GNI)Education expenditure (% of GNI)Energy depletion (% of GNI)Mineral depletion (% of GNI)Net forest depletion (% of GNI)CO2 damage (% of GNI)Particulate emissions damage (% of GNI)Adjusted net savings (% of GNI)
32 2011 The Little Green Data Book
Country data
High-income group
Population (thousands) 342 Land area (1,000 sq. km) 10 GDP ($ millions) ..
.. 37,990
.. 31,46783.9 77.3
1.8 1.0
1 3715,764 25,774
116 106786 331
51.4 28.90.0 –0.1
13.7 13.475
257
3.6
.. 6.6
.. 5,131
.. 3.9
.. 9,518
.. 62.9
.. 11.3
.. 0.46.4 12.5
10.2 17.934 24
.. 964
60 9,031
.. 10.5
.. 4297 10086 9898 100
100 99100 98100 100
..
..12 7
.. 16.1
.. 14.13.8 4.6
.. 0.9
.. 0.1
.. 0.0
.. 0.2
.. 0.1
.. 5.2
Bahamas, The
GNI per capita, World Bank Atlas method ($)Adjusted Net National Income per capita ($)Urban population (% of total)Urban population growth (average annual %, 1990-2009) AgricultureAgricultural land (% land area)Agricultural productivity, value added per worker (2000 $)Food production index (1999-2001=100)Population density, rural (people/ sq. km of arable land) Forests and biodiversityForest area (% land area)Deforestation (average annual %, 1990-2010)Nationally terrestrial protected area (% of land area)Threatened species, mammalsThreatened species, birdsThreatened species, fishThreatened species, higher plantsGEF benefits index for biodiversity (0-100, median is 1.5) EnergyGDP per unit of energy use (2005 PPP $/kg oil equivalent)Energy use per capita (kg oil equivalent)Energy from biomass products and waste (% of total)Electric power consumption per capita (kWh)Electricity generated using fossil fuel (% of total)Electricity generated by hydropower (% of total) Emissions and pollutionCO2 emissions per unit of GDP (kg/2005 PPP $)CO2 emissions per capita (metric tons)CO2 emissions growth (%, 1990–2007)Particulate matter (urban-pop.-weighted avg., μg/cu. m)Road sector energy use per capita (kg oil equivalent) Water and sanitationInternal freshwater resources per capita (cu. m)Freshwater withdrawal
Total (% of internal resources)Agriculture (% of total freshwater withdrawal)
Access to improved water source (% of total population)Rural (% of rural population)Urban (% of urban population)
Access to improved sanitation (% of total population)Rural (% of rural population)Urban (% of urban population)
Environment and healthAcute resp. infection prevalence (% of children under five)Diarrhea prevalence (% of children under five)Under-five mortality rate (per 1,000 live births) National accounting aggregates—savings, depletion and degradationGross savings (% of GNI)Consumption of fixed capital (% of GNI)Education expenditure (% of GNI)Energy depletion (% of GNI)Mineral depletion (% of GNI)Net forest depletion (% of GNI)CO2 damage (% of GNI)Particulate emissions damage (% of GNI)Adjusted net savings (% of GNI)
33The Little Green Data Book 2011
Country data
High-income group
Population (thousands) 791 Land area (1,000 sq. km) 0.8 GDP ($ billions) 20.6
25,420 37,99014,450 31,467
88.6 77.32.5 1.0
11 37.. 25,774
130 1066,360 331
1.3 28.9–5.5 –0.11.3 13.4
3480
0.0
2.7 6.611,896 5,131
0.0 3.913,144 9,518100.0 62.9
0.0 11.3
1.0 0.429.6 12.589.0 17.9
49 241,324 964
5 9,031
6,375.0 10.545 42
.. 100
.. 98100 100
.. 99
.. 98100 100
8.38.412 7
.. 16.1
.. 14.13.0 4.6
.. 0.9
.. 0.10.0 0.0
.. 0.20.2 0.1
.. 5.2
Bahrain
GNI per capita, World Bank Atlas method ($)Adjusted Net National Income per capita ($)Urban population (% of total)Urban population growth (average annual %, 1990-2009) AgricultureAgricultural land (% land area)Agricultural productivity, value added per worker (2000 $)Food production index (1999-2001=100)Population density, rural (people/ sq. km of arable land) Forests and biodiversityForest area (% land area)Deforestation (average annual %, 1990-2010)Nationally terrestrial protected area (% of land area)Threatened species, mammalsThreatened species, birdsThreatened species, fishThreatened species, higher plantsGEF benefits index for biodiversity (0-100, median is 1.5) EnergyGDP per unit of energy use (2005 PPP $/kg oil equivalent)Energy use per capita (kg oil equivalent)Energy from biomass products and waste (% of total)Electric power consumption per capita (kWh)Electricity generated using fossil fuel (% of total)Electricity generated by hydropower (% of total) Emissions and pollutionCO2 emissions per unit of GDP (kg/2005 PPP $)CO2 emissions per capita (metric tons)CO2 emissions growth (%, 1990–2007)Particulate matter (urban-pop.-weighted avg., μg/cu. m)Road sector energy use per capita (kg oil equivalent) Water and sanitationInternal freshwater resources per capita (cu. m)Freshwater withdrawal
Total (% of internal resources)Agriculture (% of total freshwater withdrawal)
Access to improved water source (% of total population)Rural (% of rural population)Urban (% of urban population)
Access to improved sanitation (% of total population)Rural (% of rural population)Urban (% of urban population)
Environment and healthAcute resp. infection prevalence (% of children under five)Diarrhea prevalence (% of children under five)Under-five mortality rate (per 1,000 live births) National accounting aggregates—savings, depletion and degradationGross savings (% of GNI)Consumption of fixed capital (% of GNI)Education expenditure (% of GNI)Energy depletion (% of GNI)Mineral depletion (% of GNI)Net forest depletion (% of GNI)CO2 damage (% of GNI)Particulate emissions damage (% of GNI)Adjusted net savings (% of GNI)
34 2011 The Little Green Data Book
Country data
South Asia
group
Low-income group
Population (millions) 162 Land area (1,000 sq. km) 130 GDP ($ billions) 89.4
GNI per capita, World Bank Atlas method ($)Adjusted Net National Income per capita ($)Urban population (% of total)Urban population growth (average annual %, 1990-2009) AgricultureAgricultural land (% land area)Agricultural productivity, value added per worker (2000 $)Food production index (1999-2001=100)Population density, rural (people/ sq. km of arable land) Forests and biodiversityForest area (% land area)Deforestation (average annual %, 1990-2010)Nationally terrestrial protected area (% of land area)Threatened species, mammalsThreatened species, birdsThreatened species, fishThreatened species, higher plantsGEF benefits index for biodiversity (0-100, median is 1.5) EnergyGDP per unit of energy use (2005 PPP $/kg oil equivalent)Energy use per capita (kg oil equivalent)Energy from biomass products and waste (% of total)Electric power consumption per capita (kWh)Electricity generated using fossil fuel (% of total)Electricity generated by hydropower (% of total) Emissions and pollutionCO2 emissions per unit of GDP (kg/2005 PPP $)CO2 emissions per capita (metric tons)CO2 emissions growth (%, 1990–2007)Particulate matter (urban-pop.-weighted avg., μg/cu. m)Road sector energy use per capita (kg oil equivalent) Water and sanitationInternal freshwater resources per capita (cu. m)Freshwater withdrawal
Total (% of internal resources)Agriculture (% of total freshwater withdrawal)
Access to improved water source (% of total population)Rural (% of rural population)Urban (% of urban population)
Access to improved sanitation (% of total population)Rural (% of rural population)Urban (% of urban population)
Environment and healthAcute resp. infection prevalence (% of children under five)Diarrhea prevalence (% of children under five)Under-five mortality rate (per 1,000 live births) National accounting aggregates—savings, depletion and degradationGross savings (% of GNI)Consumption of fixed capital (% of GNI)Education expenditure (% of GNI)Energy depletion (% of GNI)Mineral depletion (% of GNI)Net forest depletion (% of GNI)CO2 damage (% of GNI)Particulate emissions damage (% of GNI)Adjusted net savings (% of GNI)
35The Little Green Data Book 2011
Country data
High-income group
Population (thousands) 256 Land area (1,000 sq. km) 0.4 GDP ($ billions) 3.6
.. 37,990
.. 31,46740.3 77.3
1.0 1.0
44 3715,621 25,774
97 106960 331
18.6 28.90.0 –0.10.1 13.4
31
162
0.4
.. 6.6
.. 5,131
.. 3.9
.. 9,518
.. 62.9
.. 11.3
0.3 0.45.3 12.5
25.3 17.938 24
.. 964
314 9,031
76.1 10.533 42
100 100100 98100 100100 99100 98100 100
..
..11 7
.. 16.1
.. 14.16.8 4.6
.. 0.9
.. 0.1
.. 0.0
.. 0.20.0 0.1
.. 5.2
Barbados
GNI per capita, World Bank Atlas method ($)Adjusted Net National Income per capita ($)Urban population (% of total)Urban population growth (average annual %, 1990-2009) AgricultureAgricultural land (% land area)Agricultural productivity, value added per worker (2000 $)Food production index (1999-2001=100)Population density, rural (people/ sq. km of arable land) Forests and biodiversityForest area (% land area)Deforestation (average annual %, 1990-2010)Nationally terrestrial protected area (% of land area)Threatened species, mammalsThreatened species, birdsThreatened species, fishThreatened species, higher plantsGEF benefits index for biodiversity (0-100, median is 1.5) EnergyGDP per unit of energy use (2005 PPP $/kg oil equivalent)Energy use per capita (kg oil equivalent)Energy from biomass products and waste (% of total)Electric power consumption per capita (kWh)Electricity generated using fossil fuel (% of total)Electricity generated by hydropower (% of total) Emissions and pollutionCO2 emissions per unit of GDP (kg/2005 PPP $)CO2 emissions per capita (metric tons)CO2 emissions growth (%, 1990–2007)Particulate matter (urban-pop.-weighted avg., μg/cu. m)Road sector energy use per capita (kg oil equivalent) Water and sanitationInternal freshwater resources per capita (cu. m)Freshwater withdrawal
Total (% of internal resources)Agriculture (% of total freshwater withdrawal)
Access to improved water source (% of total population)Rural (% of rural population)Urban (% of urban population)
Access to improved sanitation (% of total population)Rural (% of rural population)Urban (% of urban population)
Environment and healthAcute resp. infection prevalence (% of children under five)Diarrhea prevalence (% of children under five)Under-five mortality rate (per 1,000 live births) National accounting aggregates—savings, depletion and degradationGross savings (% of GNI)Consumption of fixed capital (% of GNI)Education expenditure (% of GNI)Energy depletion (% of GNI)Mineral depletion (% of GNI)Net forest depletion (% of GNI)CO2 damage (% of GNI)Particulate emissions damage (% of GNI)Adjusted net savings (% of GNI)
36 2011 The Little Green Data Book
Country data
Europe & Central
Asia group
Upper middle-income group
Population (millions) 9.7 Land area (1,000 sq. km) 202.9 GDP ($ billions) 49.0
GNI per capita, World Bank Atlas method ($)Adjusted Net National Income per capita ($)Urban population (% of total)Urban population growth (average annual %, 1990-2009) AgricultureAgricultural land (% land area)Agricultural productivity, value added per worker (2000 $)Food production index (1999-2001=100)Population density, rural (people/ sq. km of arable land) Forests and biodiversityForest area (% land area)Deforestation (average annual %, 1990-2010)Nationally terrestrial protected area (% of land area)Threatened species, mammalsThreatened species, birdsThreatened species, fishThreatened species, higher plantsGEF benefits index for biodiversity (0-100, median is 1.5) EnergyGDP per unit of energy use (2005 PPP $/kg oil equivalent)Energy use per capita (kg oil equivalent)Energy from biomass products and waste (% of total)Electric power consumption per capita (kWh)Electricity generated using fossil fuel (% of total)Electricity generated by hydropower (% of total) Emissions and pollutionCO2 emissions per unit of GDP (kg/2005 PPP $)CO2 emissions per capita (metric tons)CO2 emissions growth (%, 1990–2007)Particulate matter (urban-pop.-weighted avg., μg/cu. m)Road sector energy use per capita (kg oil equivalent) Water and sanitationInternal freshwater resources per capita (cu. m)Freshwater withdrawal
Total (% of internal resources)Agriculture (% of total freshwater withdrawal)
Access to improved water source (% of total population)Rural (% of rural population)Urban (% of urban population)
Access to improved sanitation (% of total population)Rural (% of rural population)Urban (% of urban population)
Environment and healthAcute resp. infection prevalence (% of children under five)Diarrhea prevalence (% of children under five)Under-five mortality rate (per 1,000 live births) National accounting aggregates—savings, depletion and degradationGross savings (% of GNI)Consumption of fixed capital (% of GNI)Education expenditure (% of GNI)Energy depletion (% of GNI)Mineral depletion (% of GNI)Net forest depletion (% of GNI)CO2 damage (% of GNI)Particulate emissions damage (% of GNI)Adjusted net savings (% of GNI)
37The Little Green Data Book 2011
Country data
High-income group
Population (millions) 11 Land area (1,000 sq. km) 30 GDP ($ billions) 471.2
GNI per capita, World Bank Atlas method ($)Adjusted Net National Income per capita ($)Urban population (% of total)Urban population growth (average annual %, 1990-2009) AgricultureAgricultural land (% land area)Agricultural productivity, value added per worker (2000 $)Food production index (1999-2001=100)Population density, rural (people/ sq. km of arable land) Forests and biodiversityForest area (% land area)Deforestation (average annual %, 1990-2010)Nationally terrestrial protected area (% of land area)Threatened species, mammalsThreatened species, birdsThreatened species, fishThreatened species, higher plantsGEF benefits index for biodiversity (0-100, median is 1.5) EnergyGDP per unit of energy use (2005 PPP $/kg oil equivalent)Energy use per capita (kg oil equivalent)Energy from biomass products and waste (% of total)Electric power consumption per capita (kWh)Electricity generated using fossil fuel (% of total)Electricity generated by hydropower (% of total) Emissions and pollutionCO2 emissions per unit of GDP (kg/2005 PPP $)CO2 emissions per capita (metric tons)CO2 emissions growth (%, 1990–2007)Particulate matter (urban-pop.-weighted avg., μg/cu. m)Road sector energy use per capita (kg oil equivalent) Water and sanitationInternal freshwater resources per capita (cu. m)Freshwater withdrawal
Total (% of internal resources)Agriculture (% of total freshwater withdrawal)
Access to improved water source (% of total population)Rural (% of rural population)Urban (% of urban population)
Access to improved sanitation (% of total population)Rural (% of rural population)Urban (% of urban population)
Environment and healthAcute resp. infection prevalence (% of children under five)Diarrhea prevalence (% of children under five)Under-five mortality rate (per 1,000 live births) National accounting aggregates—savings, depletion and degradationGross savings (% of GNI)Consumption of fixed capital (% of GNI)Education expenditure (% of GNI)Energy depletion (% of GNI)Mineral depletion (% of GNI)Net forest depletion (% of GNI)CO2 damage (% of GNI)Particulate emissions damage (% of GNI)Adjusted net savings (% of GNI)
38 2011 The Little Green Data Book
Country data
Latin America & Caribbean
group
Lower middle-income group
Population (thousands) 333 Land area (1,000 sq. km) 23 GDP ($ billions) 1.4
3,740 7,007 2,3213,274 5,725 2,02852.2 79.0 40.9
3.5 2.0 3.0
7 35 504,735 3,542 588
106 131 131222 245 591
61.1 47.0 25.90.4 0.3 0.0
27.9 20.8 11.584
25321.7
.. 7.7 4.0
.. 1,290 1,019
.. 16.8 16.9
.. 1,907 1,318
.. 38.7 78.2
.. 55.3 16.8
0.2 0.3 0.71.4 2.7 2.8
36.5 51.2 117.713 32 63
.. 302 78
51,364 24,000 2,936
0.9 2.0 17.920 71 8199 93 86
100 80 8199 97 9490 79 5086 54 4193 86 63
6.711.0
18 23 57
.. 19.5 39.9
.. 11.7 9.95.7 4.4 2.4
.. 3.5 4.0
.. 1.3 0.4
.. 0.0 0.2
.. 0.3 1.00.0 0.3 0.7
.. 6.8 26.2
Belize
GNI per capita, World Bank Atlas method ($)Adjusted Net National Income per capita ($)Urban population (% of total)Urban population growth (average annual %, 1990-2009) AgricultureAgricultural land (% land area)Agricultural productivity, value added per worker (2000 $)Food production index (1999-2001=100)Population density, rural (people/ sq. km of arable land) Forests and biodiversityForest area (% land area)Deforestation (average annual %, 1990-2010)Nationally terrestrial protected area (% of land area)Threatened species, mammalsThreatened species, birdsThreatened species, fishThreatened species, higher plantsGEF benefits index for biodiversity (0-100, median is 1.5) EnergyGDP per unit of energy use (2005 PPP $/kg oil equivalent)Energy use per capita (kg oil equivalent)Energy from biomass products and waste (% of total)Electric power consumption per capita (kWh)Electricity generated using fossil fuel (% of total)Electricity generated by hydropower (% of total) Emissions and pollutionCO2 emissions per unit of GDP (kg/2005 PPP $)CO2 emissions per capita (metric tons)CO2 emissions growth (%, 1990–2007)Particulate matter (urban-pop.-weighted avg., μg/cu. m)Road sector energy use per capita (kg oil equivalent) Water and sanitationInternal freshwater resources per capita (cu. m)Freshwater withdrawal
Total (% of internal resources)Agriculture (% of total freshwater withdrawal)
Access to improved water source (% of total population)Rural (% of rural population)Urban (% of urban population)
Access to improved sanitation (% of total population)Rural (% of rural population)Urban (% of urban population)
Environment and healthAcute resp. infection prevalence (% of children under five)Diarrhea prevalence (% of children under five)Under-five mortality rate (per 1,000 live births) National accounting aggregates—savings, depletion and degradationGross savings (% of GNI)Consumption of fixed capital (% of GNI)Education expenditure (% of GNI)Energy depletion (% of GNI)Mineral depletion (% of GNI)Net forest depletion (% of GNI)CO2 damage (% of GNI)Particulate emissions damage (% of GNI)Adjusted net savings (% of GNI)
39The Little Green Data Book 2011
Country data
Sub-Saharan Africa group
Low-income group
Population (millions) 8.9 Land area (1,000 sq. km) 110.6 GDP ($ billions) 6.7
GNI per capita, World Bank Atlas method ($)Adjusted Net National Income per capita ($)Urban population (% of total)Urban population growth (average annual %, 1990-2009) AgricultureAgricultural land (% land area)Agricultural productivity, value added per worker (2000 $)Food production index (1999-2001=100)Population density, rural (people/ sq. km of arable land) Forests and biodiversityForest area (% land area)Deforestation (average annual %, 1990-2010)Nationally terrestrial protected area (% of land area)Threatened species, mammalsThreatened species, birdsThreatened species, fishThreatened species, higher plantsGEF benefits index for biodiversity (0-100, median is 1.5) EnergyGDP per unit of energy use (2005 PPP $/kg oil equivalent)Energy use per capita (kg oil equivalent)Energy from biomass products and waste (% of total)Electric power consumption per capita (kWh)Electricity generated using fossil fuel (% of total)Electricity generated by hydropower (% of total) Emissions and pollutionCO2 emissions per unit of GDP (kg/2005 PPP $)CO2 emissions per capita (metric tons)CO2 emissions growth (%, 1990–2007)Particulate matter (urban-pop.-weighted avg., μg/cu. m)Road sector energy use per capita (kg oil equivalent) Water and sanitationInternal freshwater resources per capita (cu. m)Freshwater withdrawal
Total (% of internal resources)Agriculture (% of total freshwater withdrawal)
Access to improved water source (% of total population)Rural (% of rural population)Urban (% of urban population)
Access to improved sanitation (% of total population)Rural (% of rural population)Urban (% of urban population)
Environment and healthAcute resp. infection prevalence (% of children under five)Diarrhea prevalence (% of children under five)Under-five mortality rate (per 1,000 live births) National accounting aggregates—savings, depletion and degradationGross savings (% of GNI)Consumption of fixed capital (% of GNI)Education expenditure (% of GNI)Energy depletion (% of GNI)Mineral depletion (% of GNI)Net forest depletion (% of GNI)CO2 damage (% of GNI)Particulate emissions damage (% of GNI)Adjusted net savings (% of GNI)
40 2011 The Little Green Data Book
Country data
High-income group
Population (thousands) 64 Land area (sq. km) 50 GDP ($ billions) 5.7
.. 37,990
.. 31,467100.0 77.3
0.3 1.0
15 3736,570 25,774
103 1060 331
20.0 28.90.0 –0.15.6 13.4
41
114
1.2
.. 6.6
.. 5,131
.. 3.9
.. 9,518
.. 62.9
.. 11.3
.. 0.48.0 12.5
–14.1 17.9.. 24.. 964
.. 9,031
.. 10.5
.. 42
.. 100
.. 98
.. 100
.. 99
.. 98
.. 100
..
..
.. 7
.. 16.1
.. 14.12.8 4.6
.. 0.9
.. 0.1
.. 0.0
.. 0.2
.. 0.1
.. 5.2
Bermuda
GNI per capita, World Bank Atlas method ($)Adjusted Net National Income per capita ($)Urban population (% of total)Urban population growth (average annual %, 1990-2009) AgricultureAgricultural land (% land area)Agricultural productivity, value added per worker (2000 $)Food production index (1999-2001=100)Population density, rural (people/ sq. km of arable land) Forests and biodiversityForest area (% land area)Deforestation (average annual %, 1990-2010)Nationally terrestrial protected area (% of land area)Threatened species, mammalsThreatened species, birdsThreatened species, fishThreatened species, higher plantsGEF benefits index for biodiversity (0-100, median is 1.5) EnergyGDP per unit of energy use (2005 PPP $/kg oil equivalent)Energy use per capita (kg oil equivalent)Energy from biomass products and waste (% of total)Electric power consumption per capita (kWh)Electricity generated using fossil fuel (% of total)Electricity generated by hydropower (% of total) Emissions and pollutionCO2 emissions per unit of GDP (kg/2005 PPP $)CO2 emissions per capita (metric tons)CO2 emissions growth (%, 1990–2007)Particulate matter (urban-pop.-weighted avg., μg/cu. m)Road sector energy use per capita (kg oil equivalent) Water and sanitationInternal freshwater resources per capita (cu. m)Freshwater withdrawal
Total (% of internal resources)Agriculture (% of total freshwater withdrawal)
Access to improved water source (% of total population)Rural (% of rural population)Urban (% of urban population)
Access to improved sanitation (% of total population)Rural (% of rural population)Urban (% of urban population)
Environment and healthAcute resp. infection prevalence (% of children under five)Diarrhea prevalence (% of children under five)Under-five mortality rate (per 1,000 live births) National accounting aggregates—savings, depletion and degradationGross savings (% of GNI)Consumption of fixed capital (% of GNI)Education expenditure (% of GNI)Energy depletion (% of GNI)Mineral depletion (% of GNI)Net forest depletion (% of GNI)CO2 damage (% of GNI)Particulate emissions damage (% of GNI)Adjusted net savings (% of GNI)
41The Little Green Data Book 2011
Country data
South Asia
group
Lower middle-income group
Population (thousands) 697 Land area (1,000 sq. km) 38 GDP ($ billions) 1.3
GNI per capita, World Bank Atlas method ($)Adjusted Net National Income per capita ($)Urban population (% of total)Urban population growth (average annual %, 1990-2009) AgricultureAgricultural land (% land area)Agricultural productivity, value added per worker (2000 $)Food production index (1999-2001=100)Population density, rural (people/ sq. km of arable land) Forests and biodiversityForest area (% land area)Deforestation (average annual %, 1990-2010)Nationally terrestrial protected area (% of land area)Threatened species, mammalsThreatened species, birdsThreatened species, fishThreatened species, higher plantsGEF benefits index for biodiversity (0-100, median is 1.5) EnergyGDP per unit of energy use (2005 PPP $/kg oil equivalent)Energy use per capita (kg oil equivalent)Energy from biomass products and waste (% of total)Electric power consumption per capita (kWh)Electricity generated using fossil fuel (% of total)Electricity generated by hydropower (% of total) Emissions and pollutionCO2 emissions per unit of GDP (kg/2005 PPP $)CO2 emissions per capita (metric tons)CO2 emissions growth (%, 1990–2007)Particulate matter (urban-pop.-weighted avg., μg/cu. m)Road sector energy use per capita (kg oil equivalent) Water and sanitationInternal freshwater resources per capita (cu. m)Freshwater withdrawal
Total (% of internal resources)Agriculture (% of total freshwater withdrawal)
Access to improved water source (% of total population)Rural (% of rural population)Urban (% of urban population)
Access to improved sanitation (% of total population)Rural (% of rural population)Urban (% of urban population)
Environment and healthAcute resp. infection prevalence (% of children under five)Diarrhea prevalence (% of children under five)Under-five mortality rate (per 1,000 live births) National accounting aggregates—savings, depletion and degradationGross savings (% of GNI)Consumption of fixed capital (% of GNI)Education expenditure (% of GNI)Energy depletion (% of GNI)Mineral depletion (% of GNI)Net forest depletion (% of GNI)CO2 damage (% of GNI)Particulate emissions damage (% of GNI)Adjusted net savings (% of GNI)
42 2011 The Little Green Data Book
Country data
Latin America & Caribbean
group
Lower middle-income group
Population (millions) 9.9 Land area (1,000 sq. km) 1,083.3 GDP ($ billions) 17.3
GNI per capita, World Bank Atlas method ($)Adjusted Net National Income per capita ($)Urban population (% of total)Urban population growth (average annual %, 1990-2009) AgricultureAgricultural land (% land area)Agricultural productivity, value added per worker (2000 $)Food production index (1999-2001=100)Population density, rural (people/ sq. km of arable land) Forests and biodiversityForest area (% land area)Deforestation (average annual %, 1990-2010)Nationally terrestrial protected area (% of land area)Threatened species, mammalsThreatened species, birdsThreatened species, fishThreatened species, higher plantsGEF benefits index for biodiversity (0-100, median is 1.5) EnergyGDP per unit of energy use (2005 PPP $/kg oil equivalent)Energy use per capita (kg oil equivalent)Energy from biomass products and waste (% of total)Electric power consumption per capita (kWh)Electricity generated using fossil fuel (% of total)Electricity generated by hydropower (% of total) Emissions and pollutionCO2 emissions per unit of GDP (kg/2005 PPP $)CO2 emissions per capita (metric tons)CO2 emissions growth (%, 1990–2007)Particulate matter (urban-pop.-weighted avg., μg/cu. m)Road sector energy use per capita (kg oil equivalent) Water and sanitationInternal freshwater resources per capita (cu. m)Freshwater withdrawal
Total (% of internal resources)Agriculture (% of total freshwater withdrawal)
Access to improved water source (% of total population)Rural (% of rural population)Urban (% of urban population)
Access to improved sanitation (% of total population)Rural (% of rural population)Urban (% of urban population)
Environment and healthAcute resp. infection prevalence (% of children under five)Diarrhea prevalence (% of children under five)Under-five mortality rate (per 1,000 live births) National accounting aggregates—savings, depletion and degradationGross savings (% of GNI)Consumption of fixed capital (% of GNI)Education expenditure (% of GNI)Energy depletion (% of GNI)Mineral depletion (% of GNI)Net forest depletion (% of GNI)CO2 damage (% of GNI)Particulate emissions damage (% of GNI)Adjusted net savings (% of GNI)
43The Little Green Data Book 2011
Country data
Europe & Central
Asia group
Upper middle-income group
Population (millions) 3.8 Land area (1,000 sq. km) 51.2 GDP ($ billions) 17.0
4,700 6,793 7,502.. 4,892 5,773
48.0 64.0 74.90.4 0.2 1.6
42 28 3013,301 3,011 3,671
138 126 129197 148 153
42.7 38.6 37.20.0 0.0 0.10.6 7.4 13.0
46
311
0.4
4.7 3.6 5.21,588 3,030 2,177
3.1 1.7 6.82,467 4,052 3,001
65.7 67.5 64.734.3 16.4 26.4
1.1 0.7 0.57.7 7.2 5.3
.. –31.3 3.819 24 31
242 228 320
9,395 12,913 18,143
.. 7.0 3.2
.. 63 6599 95 9598 89 86
100 98 9895 89 8492 80 6799 94 90
2.08.914 21 22
12.9 19.8 19.910.4 11.7 11.8
.. 3.6 4.10.7 8.7 6.40.9 0.4 1.0
.. 0.0 0.01.3 0.9 0.60.1 0.2 0.2
.. 1.4 3.9
Bosnia and Herzegovina
GNI per capita, World Bank Atlas method ($)Adjusted Net National Income per capita ($)Urban population (% of total)Urban population growth (average annual %, 1990-2009) AgricultureAgricultural land (% land area)Agricultural productivity, value added per worker (2000 $)Food production index (1999-2001=100)Population density, rural (people/ sq. km of arable land) Forests and biodiversityForest area (% land area)Deforestation (average annual %, 1990-2010)Nationally terrestrial protected area (% of land area)Threatened species, mammalsThreatened species, birdsThreatened species, fishThreatened species, higher plantsGEF benefits index for biodiversity (0-100, median is 1.5) EnergyGDP per unit of energy use (2005 PPP $/kg oil equivalent)Energy use per capita (kg oil equivalent)Energy from biomass products and waste (% of total)Electric power consumption per capita (kWh)Electricity generated using fossil fuel (% of total)Electricity generated by hydropower (% of total) Emissions and pollutionCO2 emissions per unit of GDP (kg/2005 PPP $)CO2 emissions per capita (metric tons)CO2 emissions growth (%, 1990–2007)Particulate matter (urban-pop.-weighted avg., μg/cu. m)Road sector energy use per capita (kg oil equivalent) Water and sanitationInternal freshwater resources per capita (cu. m)Freshwater withdrawal
Total (% of internal resources)Agriculture (% of total freshwater withdrawal)
Access to improved water source (% of total population)Rural (% of rural population)Urban (% of urban population)
Access to improved sanitation (% of total population)Rural (% of rural population)Urban (% of urban population)
Environment and healthAcute resp. infection prevalence (% of children under five)Diarrhea prevalence (% of children under five)Under-five mortality rate (per 1,000 live births) National accounting aggregates—savings, depletion and degradationGross savings (% of GNI)Consumption of fixed capital (% of GNI)Education expenditure (% of GNI)Energy depletion (% of GNI)Mineral depletion (% of GNI)Net forest depletion (% of GNI)CO2 damage (% of GNI)Particulate emissions damage (% of GNI)Adjusted net savings (% of GNI)
44 2011 The Little Green Data Book
Country data
Sub-Saharan Africa group
Upper middle-income group
Population (millions) 1.9 Land area (1,000 sq. km) 566.7 GDP ($ billions) 11.8
GNI per capita, World Bank Atlas method ($)Adjusted Net National Income per capita ($)Urban population (% of total)Urban population growth (average annual %, 1990-2009) AgricultureAgricultural land (% land area)Agricultural productivity, value added per worker (2000 $)Food production index (1999-2001=100)Population density, rural (people/ sq. km of arable land) Forests and biodiversityForest area (% land area)Deforestation (average annual %, 1990-2010)Nationally terrestrial protected area (% of land area)Threatened species, mammalsThreatened species, birdsThreatened species, fishThreatened species, higher plantsGEF benefits index for biodiversity (0-100, median is 1.5) EnergyGDP per unit of energy use (2005 PPP $/kg oil equivalent)Energy use per capita (kg oil equivalent)Energy from biomass products and waste (% of total)Electric power consumption per capita (kWh)Electricity generated using fossil fuel (% of total)Electricity generated by hydropower (% of total) Emissions and pollutionCO2 emissions per unit of GDP (kg/2005 PPP $)CO2 emissions per capita (metric tons)CO2 emissions growth (%, 1990–2007)Particulate matter (urban-pop.-weighted avg., μg/cu. m)Road sector energy use per capita (kg oil equivalent) Water and sanitationInternal freshwater resources per capita (cu. m)Freshwater withdrawal
Total (% of internal resources)Agriculture (% of total freshwater withdrawal)
Access to improved water source (% of total population)Rural (% of rural population)Urban (% of urban population)
Access to improved sanitation (% of total population)Rural (% of rural population)Urban (% of urban population)
Environment and healthAcute resp. infection prevalence (% of children under five)Diarrhea prevalence (% of children under five)Under-five mortality rate (per 1,000 live births) National accounting aggregates—savings, depletion and degradationGross savings (% of GNI)Consumption of fixed capital (% of GNI)Education expenditure (% of GNI)Energy depletion (% of GNI)Mineral depletion (% of GNI)Net forest depletion (% of GNI)CO2 damage (% of GNI)Particulate emissions damage (% of GNI)Adjusted net savings (% of GNI)
45The Little Green Data Book 2011
Country data
Latin America & Caribbean
group
Upper middle-income group
Population (millions) 194 Land area (1,000 sq. km) 8,459 GDP ($ billions) 1,594.5
GNI per capita, World Bank Atlas method ($)Adjusted Net National Income per capita ($)Urban population (% of total)Urban population growth (average annual %, 1990-2009) AgricultureAgricultural land (% land area)Agricultural productivity, value added per worker (2000 $)Food production index (1999-2001=100)Population density, rural (people/ sq. km of arable land) Forests and biodiversityForest area (% land area)Deforestation (average annual %, 1990-2010)Nationally terrestrial protected area (% of land area)Threatened species, mammalsThreatened species, birdsThreatened species, fishThreatened species, higher plantsGEF benefits index for biodiversity (0-100, median is 1.5) EnergyGDP per unit of energy use (2005 PPP $/kg oil equivalent)Energy use per capita (kg oil equivalent)Energy from biomass products and waste (% of total)Electric power consumption per capita (kWh)Electricity generated using fossil fuel (% of total)Electricity generated by hydropower (% of total) Emissions and pollutionCO2 emissions per unit of GDP (kg/2005 PPP $)CO2 emissions per capita (metric tons)CO2 emissions growth (%, 1990–2007)Particulate matter (urban-pop.-weighted avg., μg/cu. m)Road sector energy use per capita (kg oil equivalent) Water and sanitationInternal freshwater resources per capita (cu. m)Freshwater withdrawal
Total (% of internal resources)Agriculture (% of total freshwater withdrawal)
Access to improved water source (% of total population)Rural (% of rural population)Urban (% of urban population)
Access to improved sanitation (% of total population)Rural (% of rural population)Urban (% of urban population)
Environment and healthAcute resp. infection prevalence (% of children under five)Diarrhea prevalence (% of children under five)Under-five mortality rate (per 1,000 live births) National accounting aggregates—savings, depletion and degradationGross savings (% of GNI)Consumption of fixed capital (% of GNI)Education expenditure (% of GNI)Energy depletion (% of GNI)Mineral depletion (% of GNI)Net forest depletion (% of GNI)CO2 damage (% of GNI)Particulate emissions damage (% of GNI)Adjusted net savings (% of GNI)
46 2011 The Little Green Data Book
Country data
High-income group
Population (thousands) 400 Land area (1,000 sq. km) 5 GDP ($ millions) ..
.. 37,990
.. 31,46775.3 77.3
3.0 1.0
2 3774,363 25,774
150 1063,293 331
72.1 28.90.3 –0.1
42.9 13.43419
8990.1
5.6 6.69,251 5,131
0.0 3.98,308 9,518100.0 62.9
0.0 11.3
0.4 0.419.7 12.518.4 17.9
51 24969 964
22,086 9,031
1.1 10.5.. 42
99 100.. 98.. 100.. 99.. 98.. 100
..
..7 7
.. 16.1
.. 14.13.6 4.6
.. 0.9
.. 0.1
.. 0.0
.. 0.20.1 0.1
.. 5.2
Brunei Darussalam
GNI per capita, World Bank Atlas method ($)Adjusted Net National Income per capita ($)Urban population (% of total)Urban population growth (average annual %, 1990-2009) AgricultureAgricultural land (% land area)Agricultural productivity, value added per worker (2000 $)Food production index (1999-2001=100)Population density, rural (people/ sq. km of arable land) Forests and biodiversityForest area (% land area)Deforestation (average annual %, 1990-2010)Nationally terrestrial protected area (% of land area)Threatened species, mammalsThreatened species, birdsThreatened species, fishThreatened species, higher plantsGEF benefits index for biodiversity (0-100, median is 1.5) EnergyGDP per unit of energy use (2005 PPP $/kg oil equivalent)Energy use per capita (kg oil equivalent)Energy from biomass products and waste (% of total)Electric power consumption per capita (kWh)Electricity generated using fossil fuel (% of total)Electricity generated by hydropower (% of total) Emissions and pollutionCO2 emissions per unit of GDP (kg/2005 PPP $)CO2 emissions per capita (metric tons)CO2 emissions growth (%, 1990–2007)Particulate matter (urban-pop.-weighted avg., μg/cu. m)Road sector energy use per capita (kg oil equivalent) Water and sanitationInternal freshwater resources per capita (cu. m)Freshwater withdrawal
Total (% of internal resources)Agriculture (% of total freshwater withdrawal)
Access to improved water source (% of total population)Rural (% of rural population)Urban (% of urban population)
Access to improved sanitation (% of total population)Rural (% of rural population)Urban (% of urban population)
Environment and healthAcute resp. infection prevalence (% of children under five)Diarrhea prevalence (% of children under five)Under-five mortality rate (per 1,000 live births) National accounting aggregates—savings, depletion and degradationGross savings (% of GNI)Consumption of fixed capital (% of GNI)Education expenditure (% of GNI)Energy depletion (% of GNI)Mineral depletion (% of GNI)Net forest depletion (% of GNI)CO2 damage (% of GNI)Particulate emissions damage (% of GNI)Adjusted net savings (% of GNI)
47The Little Green Data Book 2011
Country data
Europe & Central
Asia group
Upper middle-income group
Population (millions) 7.6 Land area (1,000 sq. km) 108.6 GDP ($ billions) 48.7
GNI per capita, World Bank Atlas method ($)Adjusted Net National Income per capita ($)Urban population (% of total)Urban population growth (average annual %, 1990-2009) AgricultureAgricultural land (% land area)Agricultural productivity, value added per worker (2000 $)Food production index (1999-2001=100)Population density, rural (people/ sq. km of arable land) Forests and biodiversityForest area (% land area)Deforestation (average annual %, 1990-2010)Nationally terrestrial protected area (% of land area)Threatened species, mammalsThreatened species, birdsThreatened species, fishThreatened species, higher plantsGEF benefits index for biodiversity (0-100, median is 1.5) EnergyGDP per unit of energy use (2005 PPP $/kg oil equivalent)Energy use per capita (kg oil equivalent)Energy from biomass products and waste (% of total)Electric power consumption per capita (kWh)Electricity generated using fossil fuel (% of total)Electricity generated by hydropower (% of total) Emissions and pollutionCO2 emissions per unit of GDP (kg/2005 PPP $)CO2 emissions per capita (metric tons)CO2 emissions growth (%, 1990–2007)Particulate matter (urban-pop.-weighted avg., μg/cu. m)Road sector energy use per capita (kg oil equivalent) Water and sanitationInternal freshwater resources per capita (cu. m)Freshwater withdrawal
Total (% of internal resources)Agriculture (% of total freshwater withdrawal)
Access to improved water source (% of total population)Rural (% of rural population)Urban (% of urban population)
Access to improved sanitation (% of total population)Rural (% of rural population)Urban (% of urban population)
Environment and healthAcute resp. infection prevalence (% of children under five)Diarrhea prevalence (% of children under five)Under-five mortality rate (per 1,000 live births) National accounting aggregates—savings, depletion and degradationGross savings (% of GNI)Consumption of fixed capital (% of GNI)Education expenditure (% of GNI)Energy depletion (% of GNI)Mineral depletion (% of GNI)Net forest depletion (% of GNI)CO2 damage (% of GNI)Particulate emissions damage (% of GNI)Adjusted net savings (% of GNI)
48 2011 The Little Green Data Book
Country data
Sub-Saharan Africa group
Low-income group
Population (millions) 16 Land area (1,000 sq. km) 274 GDP ($ billions) 8.1
GNI per capita, World Bank Atlas method ($)Adjusted Net National Income per capita ($)Urban population (% of total)Urban population growth (average annual %, 1990-2009) AgricultureAgricultural land (% land area)Agricultural productivity, value added per worker (2000 $)Food production index (1999-2001=100)Population density, rural (people/ sq. km of arable land) Forests and biodiversityForest area (% land area)Deforestation (average annual %, 1990-2010)Nationally terrestrial protected area (% of land area)Threatened species, mammalsThreatened species, birdsThreatened species, fishThreatened species, higher plantsGEF benefits index for biodiversity (0-100, median is 1.5) EnergyGDP per unit of energy use (2005 PPP $/kg oil equivalent)Energy use per capita (kg oil equivalent)Energy from biomass products and waste (% of total)Electric power consumption per capita (kWh)Electricity generated using fossil fuel (% of total)Electricity generated by hydropower (% of total) Emissions and pollutionCO2 emissions per unit of GDP (kg/2005 PPP $)CO2 emissions per capita (metric tons)CO2 emissions growth (%, 1990–2007)Particulate matter (urban-pop.-weighted avg., μg/cu. m)Road sector energy use per capita (kg oil equivalent) Water and sanitationInternal freshwater resources per capita (cu. m)Freshwater withdrawal
Total (% of internal resources)Agriculture (% of total freshwater withdrawal)
Access to improved water source (% of total population)Rural (% of rural population)Urban (% of urban population)
Access to improved sanitation (% of total population)Rural (% of rural population)Urban (% of urban population)
Environment and healthAcute resp. infection prevalence (% of children under five)Diarrhea prevalence (% of children under five)Under-five mortality rate (per 1,000 live births) National accounting aggregates—savings, depletion and degradationGross savings (% of GNI)Consumption of fixed capital (% of GNI)Education expenditure (% of GNI)Energy depletion (% of GNI)Mineral depletion (% of GNI)Net forest depletion (% of GNI)CO2 damage (% of GNI)Particulate emissions damage (% of GNI)Adjusted net savings (% of GNI)
49The Little Green Data Book 2011
Country data
Sub-Saharan Africa group
Low-income group
Population (millions) 8.3 Land area (1,000 sq. km) 25.7 GDP ($ billions) 1.3
GNI per capita, World Bank Atlas method ($)Adjusted Net National Income per capita ($)Urban population (% of total)Urban population growth (average annual %, 1990-2009) AgricultureAgricultural land (% land area)Agricultural productivity, value added per worker (2000 $)Food production index (1999-2001=100)Population density, rural (people/ sq. km of arable land) Forests and biodiversityForest area (% land area)Deforestation (average annual %, 1990-2010)Nationally terrestrial protected area (% of land area)Threatened species, mammalsThreatened species, birdsThreatened species, fishThreatened species, higher plantsGEF benefits index for biodiversity (0-100, median is 1.5) EnergyGDP per unit of energy use (2005 PPP $/kg oil equivalent)Energy use per capita (kg oil equivalent)Energy from biomass products and waste (% of total)Electric power consumption per capita (kWh)Electricity generated using fossil fuel (% of total)Electricity generated by hydropower (% of total) Emissions and pollutionCO2 emissions per unit of GDP (kg/2005 PPP $)CO2 emissions per capita (metric tons)CO2 emissions growth (%, 1990–2007)Particulate matter (urban-pop.-weighted avg., μg/cu. m)Road sector energy use per capita (kg oil equivalent) Water and sanitationInternal freshwater resources per capita (cu. m)Freshwater withdrawal
Total (% of internal resources)Agriculture (% of total freshwater withdrawal)
Access to improved water source (% of total population)Rural (% of rural population)Urban (% of urban population)
Access to improved sanitation (% of total population)Rural (% of rural population)Urban (% of urban population)
Environment and healthAcute resp. infection prevalence (% of children under five)Diarrhea prevalence (% of children under five)Under-five mortality rate (per 1,000 live births) National accounting aggregates—savings, depletion and degradationGross savings (% of GNI)Consumption of fixed capital (% of GNI)Education expenditure (% of GNI)Energy depletion (% of GNI)Mineral depletion (% of GNI)Net forest depletion (% of GNI)CO2 damage (% of GNI)Particulate emissions damage (% of GNI)Adjusted net savings (% of GNI)
Population (millions) 15 Land area (1,000 sq. km) 177 GDP ($ billions) 10.4
Cambodia
GNI per capita, World Bank Atlas method ($)Adjusted Net National Income per capita ($)Urban population (% of total)Urban population growth (average annual %, 1990-2009) AgricultureAgricultural land (% land area)Agricultural productivity, value added per worker (2000 $)Food production index (1999-2001=100)Population density, rural (people/ sq. km of arable land) Forests and biodiversityForest area (% land area)Deforestation (average annual %, 1990-2010)Nationally terrestrial protected area (% of land area)Threatened species, mammalsThreatened species, birdsThreatened species, fishThreatened species, higher plantsGEF benefits index for biodiversity (0-100, median is 1.5) EnergyGDP per unit of energy use (2005 PPP $/kg oil equivalent)Energy use per capita (kg oil equivalent)Energy from biomass products and waste (% of total)Electric power consumption per capita (kWh)Electricity generated using fossil fuel (% of total)Electricity generated by hydropower (% of total) Emissions and pollutionCO2 emissions per unit of GDP (kg/2005 PPP $)CO2 emissions per capita (metric tons)CO2 emissions growth (%, 1990–2007)Particulate matter (urban-pop.-weighted avg., μg/cu. m)Road sector energy use per capita (kg oil equivalent) Water and sanitationInternal freshwater resources per capita (cu. m)Freshwater withdrawal
Total (% of internal resources)Agriculture (% of total freshwater withdrawal)
Access to improved water source (% of total population)Rural (% of rural population)Urban (% of urban population)
Access to improved sanitation (% of total population)Rural (% of rural population)Urban (% of urban population)
Environment and healthAcute resp. infection prevalence (% of children under five)Diarrhea prevalence (% of children under five)Under-five mortality rate (per 1,000 live births) National accounting aggregates—savings, depletion and degradationGross savings (% of GNI)Consumption of fixed capital (% of GNI)Education expenditure (% of GNI)Energy depletion (% of GNI)Mineral depletion (% of GNI)Net forest depletion (% of GNI)CO2 damage (% of GNI)Particulate emissions damage (% of GNI)Adjusted net savings (% of GNI)
51The Little Green Data Book 2011
Country data
Sub-Saharan Africa group
Lower middle-income group
Population (millions) 20 Land area (1,000 sq. km) 473 GDP ($ billions) 22.2
GNI per capita, World Bank Atlas method ($)Adjusted Net National Income per capita ($)Urban population (% of total)Urban population growth (average annual %, 1990-2009) AgricultureAgricultural land (% land area)Agricultural productivity, value added per worker (2000 $)Food production index (1999-2001=100)Population density, rural (people/ sq. km of arable land) Forests and biodiversityForest area (% land area)Deforestation (average annual %, 1990-2010)Nationally terrestrial protected area (% of land area)Threatened species, mammalsThreatened species, birdsThreatened species, fishThreatened species, higher plantsGEF benefits index for biodiversity (0-100, median is 1.5) EnergyGDP per unit of energy use (2005 PPP $/kg oil equivalent)Energy use per capita (kg oil equivalent)Energy from biomass products and waste (% of total)Electric power consumption per capita (kWh)Electricity generated using fossil fuel (% of total)Electricity generated by hydropower (% of total) Emissions and pollutionCO2 emissions per unit of GDP (kg/2005 PPP $)CO2 emissions per capita (metric tons)CO2 emissions growth (%, 1990–2007)Particulate matter (urban-pop.-weighted avg., μg/cu. m)Road sector energy use per capita (kg oil equivalent) Water and sanitationInternal freshwater resources per capita (cu. m)Freshwater withdrawal
Total (% of internal resources)Agriculture (% of total freshwater withdrawal)
Access to improved water source (% of total population)Rural (% of rural population)Urban (% of urban population)
Access to improved sanitation (% of total population)Rural (% of rural population)Urban (% of urban population)
Environment and healthAcute resp. infection prevalence (% of children under five)Diarrhea prevalence (% of children under five)Under-five mortality rate (per 1,000 live births) National accounting aggregates—savings, depletion and degradationGross savings (% of GNI)Consumption of fixed capital (% of GNI)Education expenditure (% of GNI)Energy depletion (% of GNI)Mineral depletion (% of GNI)Net forest depletion (% of GNI)CO2 damage (% of GNI)Particulate emissions damage (% of GNI)Adjusted net savings (% of GNI)
52 2011 The Little Green Data Book
Country data
High-income group
Population (millions) 34 Land area (1,000 sq. km) 9,094 GDP ($ billions) 1,336.1
41,980 37,99032,597 31,467
80.5 77.31.3 1.0
7 3748,710 25,774
119 10614 331
34.1 28.90.0 –0.18.0 13.4121532
221.5
4.5 6.68,008 5,131
4.5 3.917,061 9,518
24.9 62.958.7 11.3
0.5 0.416.9 12.523.8 17.9
15 241,324 964
86,426 9,031
1.6 10.512 42
100 10099 98
100 100100 9999 98
100 100
..
..6 7
18.0 16.114.2 14.1
4.7 4.61.9 0.90.4 0.10.0 0.00.3 0.20.0 0.15.8 5.2
Canada
GNI per capita, World Bank Atlas method ($)Adjusted Net National Income per capita ($)Urban population (% of total)Urban population growth (average annual %, 1990-2009) AgricultureAgricultural land (% land area)Agricultural productivity, value added per worker (2000 $)Food production index (1999-2001=100)Population density, rural (people/ sq. km of arable land) Forests and biodiversityForest area (% land area)Deforestation (average annual %, 1990-2010)Nationally terrestrial protected area (% of land area)Threatened species, mammalsThreatened species, birdsThreatened species, fishThreatened species, higher plantsGEF benefits index for biodiversity (0-100, median is 1.5) EnergyGDP per unit of energy use (2005 PPP $/kg oil equivalent)Energy use per capita (kg oil equivalent)Energy from biomass products and waste (% of total)Electric power consumption per capita (kWh)Electricity generated using fossil fuel (% of total)Electricity generated by hydropower (% of total) Emissions and pollutionCO2 emissions per unit of GDP (kg/2005 PPP $)CO2 emissions per capita (metric tons)CO2 emissions growth (%, 1990–2007)Particulate matter (urban-pop.-weighted avg., μg/cu. m)Road sector energy use per capita (kg oil equivalent) Water and sanitationInternal freshwater resources per capita (cu. m)Freshwater withdrawal
Total (% of internal resources)Agriculture (% of total freshwater withdrawal)
Access to improved water source (% of total population)Rural (% of rural population)Urban (% of urban population)
Access to improved sanitation (% of total population)Rural (% of rural population)Urban (% of urban population)
Environment and healthAcute resp. infection prevalence (% of children under five)Diarrhea prevalence (% of children under five)Under-five mortality rate (per 1,000 live births) National accounting aggregates—savings, depletion and degradationGross savings (% of GNI)Consumption of fixed capital (% of GNI)Education expenditure (% of GNI)Energy depletion (% of GNI)Mineral depletion (% of GNI)Net forest depletion (% of GNI)CO2 damage (% of GNI)Particulate emissions damage (% of GNI)Adjusted net savings (% of GNI)
53The Little Green Data Book 2011
Country data
Sub-Saharan Africa group
Lower middle-income group
Population (thousands) 506 Land area (1,000 sq. km) 4 GDP ($ billions) 1.5
GNI per capita, World Bank Atlas method ($)Adjusted Net National Income per capita ($)Urban population (% of total)Urban population growth (average annual %, 1990-2009) AgricultureAgricultural land (% land area)Agricultural productivity, value added per worker (2000 $)Food production index (1999-2001=100)Population density, rural (people/ sq. km of arable land) Forests and biodiversityForest area (% land area)Deforestation (average annual %, 1990-2010)Nationally terrestrial protected area (% of land area)Threatened species, mammalsThreatened species, birdsThreatened species, fishThreatened species, higher plantsGEF benefits index for biodiversity (0-100, median is 1.5) EnergyGDP per unit of energy use (2005 PPP $/kg oil equivalent)Energy use per capita (kg oil equivalent)Energy from biomass products and waste (% of total)Electric power consumption per capita (kWh)Electricity generated using fossil fuel (% of total)Electricity generated by hydropower (% of total) Emissions and pollutionCO2 emissions per unit of GDP (kg/2005 PPP $)CO2 emissions per capita (metric tons)CO2 emissions growth (%, 1990–2007)Particulate matter (urban-pop.-weighted avg., μg/cu. m)Road sector energy use per capita (kg oil equivalent) Water and sanitationInternal freshwater resources per capita (cu. m)Freshwater withdrawal
Total (% of internal resources)Agriculture (% of total freshwater withdrawal)
Access to improved water source (% of total population)Rural (% of rural population)Urban (% of urban population)
Access to improved sanitation (% of total population)Rural (% of rural population)Urban (% of urban population)
Environment and healthAcute resp. infection prevalence (% of children under five)Diarrhea prevalence (% of children under five)Under-five mortality rate (per 1,000 live births) National accounting aggregates—savings, depletion and degradationGross savings (% of GNI)Consumption of fixed capital (% of GNI)Education expenditure (% of GNI)Energy depletion (% of GNI)Mineral depletion (% of GNI)Net forest depletion (% of GNI)CO2 damage (% of GNI)Particulate emissions damage (% of GNI)Adjusted net savings (% of GNI)
54 2011 The Little Green Data Book
Country data
High-income group
Population (thousands) 55 Land area (1,000 sq. km) 0.2 GDP ($ millions) ..
.. 37,990
.. 31,467100.0 77.3
3.9 1.0
11 37.. 25,774
97 1060 331
54.2 28.90.0 –0.18.7 13.4
11
152
0.6
.. 6.6
.. 5,131
.. 3.9
.. 9,518
.. 62.9
.. 11.3
.. 0.410.1 12.5
113.0 17.918 24
.. 964
.. 9,031
.. 10.5
.. 4295 100
.. 9895 10096 99
.. 9896 100
..
..
.. 7
.. 16.1
.. 14.1
.. 4.6
.. 0.9
.. 0.1
.. 0.0
.. 0.2
.. 0.1
.. 5.2
Cayman Islands
GNI per capita, World Bank Atlas method ($)Adjusted Net National Income per capita ($)Urban population (% of total)Urban population growth (average annual %, 1990-2009) AgricultureAgricultural land (% land area)Agricultural productivity, value added per worker (2000 $)Food production index (1999-2001=100)Population density, rural (people/ sq. km of arable land) Forests and biodiversityForest area (% land area)Deforestation (average annual %, 1990-2010)Nationally terrestrial protected area (% of land area)Threatened species, mammalsThreatened species, birdsThreatened species, fishThreatened species, higher plantsGEF benefits index for biodiversity (0-100, median is 1.5) EnergyGDP per unit of energy use (2005 PPP $/kg oil equivalent)Energy use per capita (kg oil equivalent)Energy from biomass products and waste (% of total)Electric power consumption per capita (kWh)Electricity generated using fossil fuel (% of total)Electricity generated by hydropower (% of total) Emissions and pollutionCO2 emissions per unit of GDP (kg/2005 PPP $)CO2 emissions per capita (metric tons)CO2 emissions growth (%, 1990–2007)Particulate matter (urban-pop.-weighted avg., μg/cu. m)Road sector energy use per capita (kg oil equivalent) Water and sanitationInternal freshwater resources per capita (cu. m)Freshwater withdrawal
Total (% of internal resources)Agriculture (% of total freshwater withdrawal)
Access to improved water source (% of total population)Rural (% of rural population)Urban (% of urban population)
Access to improved sanitation (% of total population)Rural (% of rural population)Urban (% of urban population)
Environment and healthAcute resp. infection prevalence (% of children under five)Diarrhea prevalence (% of children under five)Under-five mortality rate (per 1,000 live births) National accounting aggregates—savings, depletion and degradationGross savings (% of GNI)Consumption of fixed capital (% of GNI)Education expenditure (% of GNI)Energy depletion (% of GNI)Mineral depletion (% of GNI)Net forest depletion (% of GNI)CO2 damage (% of GNI)Particulate emissions damage (% of GNI)Adjusted net savings (% of GNI)
55The Little Green Data Book 2011
Country data
Sub-Saharan Africa group
Low-income group
Population (millions) 4.4 Land area (1,000 sq. km) 623.0 GDP ($ billions) 2.0
GNI per capita, World Bank Atlas method ($)Adjusted Net National Income per capita ($)Urban population (% of total)Urban population growth (average annual %, 1990-2009) AgricultureAgricultural land (% land area)Agricultural productivity, value added per worker (2000 $)Food production index (1999-2001=100)Population density, rural (people/ sq. km of arable land) Forests and biodiversityForest area (% land area)Deforestation (average annual %, 1990-2010)Nationally terrestrial protected area (% of land area)Threatened species, mammalsThreatened species, birdsThreatened species, fishThreatened species, higher plantsGEF benefits index for biodiversity (0-100, median is 1.5) EnergyGDP per unit of energy use (2005 PPP $/kg oil equivalent)Energy use per capita (kg oil equivalent)Energy from biomass products and waste (% of total)Electric power consumption per capita (kWh)Electricity generated using fossil fuel (% of total)Electricity generated by hydropower (% of total) Emissions and pollutionCO2 emissions per unit of GDP (kg/2005 PPP $)CO2 emissions per capita (metric tons)CO2 emissions growth (%, 1990–2007)Particulate matter (urban-pop.-weighted avg., μg/cu. m)Road sector energy use per capita (kg oil equivalent) Water and sanitationInternal freshwater resources per capita (cu. m)Freshwater withdrawal
Total (% of internal resources)Agriculture (% of total freshwater withdrawal)
Access to improved water source (% of total population)Rural (% of rural population)Urban (% of urban population)
Access to improved sanitation (% of total population)Rural (% of rural population)Urban (% of urban population)
Environment and healthAcute resp. infection prevalence (% of children under five)Diarrhea prevalence (% of children under five)Under-five mortality rate (per 1,000 live births) National accounting aggregates—savings, depletion and degradationGross savings (% of GNI)Consumption of fixed capital (% of GNI)Education expenditure (% of GNI)Energy depletion (% of GNI)Mineral depletion (% of GNI)Net forest depletion (% of GNI)CO2 damage (% of GNI)Particulate emissions damage (% of GNI)Adjusted net savings (% of GNI)
56 2011 The Little Green Data Book
Country data
Sub-Saharan Africa group
Low-income group
Population (millions) 11 Land area (1,000 sq. km) 1,259 GDP ($ billions) 6.8
GNI per capita, World Bank Atlas method ($)Adjusted Net National Income per capita ($)Urban population (% of total)Urban population growth (average annual %, 1990-2009) AgricultureAgricultural land (% land area)Agricultural productivity, value added per worker (2000 $)Food production index (1999-2001=100)Population density, rural (people/ sq. km of arable land) Forests and biodiversityForest area (% land area)Deforestation (average annual %, 1990-2010)Nationally terrestrial protected area (% of land area)Threatened species, mammalsThreatened species, birdsThreatened species, fishThreatened species, higher plantsGEF benefits index for biodiversity (0-100, median is 1.5) EnergyGDP per unit of energy use (2005 PPP $/kg oil equivalent)Energy use per capita (kg oil equivalent)Energy from biomass products and waste (% of total)Electric power consumption per capita (kWh)Electricity generated using fossil fuel (% of total)Electricity generated by hydropower (% of total) Emissions and pollutionCO2 emissions per unit of GDP (kg/2005 PPP $)CO2 emissions per capita (metric tons)CO2 emissions growth (%, 1990–2007)Particulate matter (urban-pop.-weighted avg., μg/cu. m)Road sector energy use per capita (kg oil equivalent) Water and sanitationInternal freshwater resources per capita (cu. m)Freshwater withdrawal
Total (% of internal resources)Agriculture (% of total freshwater withdrawal)
Access to improved water source (% of total population)Rural (% of rural population)Urban (% of urban population)
Access to improved sanitation (% of total population)Rural (% of rural population)Urban (% of urban population)
Environment and healthAcute resp. infection prevalence (% of children under five)Diarrhea prevalence (% of children under five)Under-five mortality rate (per 1,000 live births) National accounting aggregates—savings, depletion and degradationGross savings (% of GNI)Consumption of fixed capital (% of GNI)Education expenditure (% of GNI)Energy depletion (% of GNI)Mineral depletion (% of GNI)Net forest depletion (% of GNI)CO2 damage (% of GNI)Particulate emissions damage (% of GNI)Adjusted net savings (% of GNI)
57The Little Green Data Book 2011
Country data
High-income group
Population (thousands) 150 Land area (1,000 sq. km) 0.2 GDP ($ millions) ..
Channel Islands
.. 37,990
.. 31,46731.3 77.30.3 1.0
39 37.. 25,774.. 106
2,785 331
.. 28.9
.. –0.1
.. 13.4
..
..
..
..0.0
.. 6.6
.. 5,131
.. 3.9
.. 9,518
.. 62.9
.. 11.3
.. 0.4
.. 12.5
.. 17.9
.. 24
.. 964
.. 9,031
.. 10.5
.. 42
.. 100
.. 98
.. 100
.. 99
.. 98
.. 100
..
..
.. 7
.. 16.1
.. 14.1
.. 4.6
.. 0.9
.. 0.1
.. 0.0
.. 0.2
.. 0.1
.. 5.2
GNI per capita, World Bank Atlas method ($)Adjusted Net National Income per capita ($)Urban population (% of total)Urban population growth (average annual %, 1990-2009) AgricultureAgricultural land (% land area)Agricultural productivity, value added per worker (2000 $)Food production index (1999-2001=100)Population density, rural (people/ sq. km of arable land) Forests and biodiversityForest area (% land area)Deforestation (average annual %, 1990-2010)Nationally terrestrial protected area (% of land area)Threatened species, mammalsThreatened species, birdsThreatened species, fishThreatened species, higher plantsGEF benefits index for biodiversity (0-100, median is 1.5) EnergyGDP per unit of energy use (2005 PPP $/kg oil equivalent)Energy use per capita (kg oil equivalent)Energy from biomass products and waste (% of total)Electric power consumption per capita (kWh)Electricity generated using fossil fuel (% of total)Electricity generated by hydropower (% of total) Emissions and pollutionCO2 emissions per unit of GDP (kg/2005 PPP $)CO2 emissions per capita (metric tons)CO2 emissions growth (%, 1990–2007)Particulate matter (urban-pop.-weighted avg., μg/cu. m)Road sector energy use per capita (kg oil equivalent) Water and sanitationInternal freshwater resources per capita (cu. m)Freshwater withdrawal
Total (% of internal resources)Agriculture (% of total freshwater withdrawal)
Access to improved water source (% of total population)Rural (% of rural population)Urban (% of urban population)
Access to improved sanitation (% of total population)Rural (% of rural population)Urban (% of urban population)
Environment and healthAcute resp. infection prevalence (% of children under five)Diarrhea prevalence (% of children under five)Under-five mortality rate (per 1,000 live births) National accounting aggregates—savings, depletion and degradationGross savings (% of GNI)Consumption of fixed capital (% of GNI)Education expenditure (% of GNI)Energy depletion (% of GNI)Mineral depletion (% of GNI)Net forest depletion (% of GNI)CO2 damage (% of GNI)Particulate emissions damage (% of GNI)Adjusted net savings (% of GNI)
58 2011 The Little Green Data Book
Country data
Latin America & Caribbean
group
Upper middle-income group
Population (millions) 17 Land area (1,000 sq. km) 744 GDP ($ billions) 163.7
GNI per capita, World Bank Atlas method ($)Adjusted Net National Income per capita ($)Urban population (% of total)Urban population growth (average annual %, 1990-2009) AgricultureAgricultural land (% land area)Agricultural productivity, value added per worker (2000 $)Food production index (1999-2001=100)Population density, rural (people/ sq. km of arable land) Forests and biodiversityForest area (% land area)Deforestation (average annual %, 1990-2010)Nationally terrestrial protected area (% of land area)Threatened species, mammalsThreatened species, birdsThreatened species, fishThreatened species, higher plantsGEF benefits index for biodiversity (0-100, median is 1.5) EnergyGDP per unit of energy use (2005 PPP $/kg oil equivalent)Energy use per capita (kg oil equivalent)Energy from biomass products and waste (% of total)Electric power consumption per capita (kWh)Electricity generated using fossil fuel (% of total)Electricity generated by hydropower (% of total) Emissions and pollutionCO2 emissions per unit of GDP (kg/2005 PPP $)CO2 emissions per capita (metric tons)CO2 emissions growth (%, 1990–2007)Particulate matter (urban-pop.-weighted avg., μg/cu. m)Road sector energy use per capita (kg oil equivalent) Water and sanitationInternal freshwater resources per capita (cu. m)Freshwater withdrawal
Total (% of internal resources)Agriculture (% of total freshwater withdrawal)
Access to improved water source (% of total population)Rural (% of rural population)Urban (% of urban population)
Access to improved sanitation (% of total population)Rural (% of rural population)Urban (% of urban population)
Environment and healthAcute resp. infection prevalence (% of children under five)Diarrhea prevalence (% of children under five)Under-five mortality rate (per 1,000 live births) National accounting aggregates—savings, depletion and degradationGross savings (% of GNI)Consumption of fixed capital (% of GNI)Education expenditure (% of GNI)Energy depletion (% of GNI)Mineral depletion (% of GNI)Net forest depletion (% of GNI)CO2 damage (% of GNI)Particulate emissions damage (% of GNI)Adjusted net savings (% of GNI)
59The Little Green Data Book 2011
Country data
East Asia & Pacific
group
Lower middle-income group
Population (millions) 1,331 Land area (1,000 sq. km) 9,327 GDP ($ billions) 4,985.5
GNI per capita, World Bank Atlas method ($)Adjusted Net National Income per capita ($)Urban population (% of total)Urban population growth (average annual %, 1990-2009) AgricultureAgricultural land (% land area)Agricultural productivity, value added per worker (2000 $)Food production index (1999-2001=100)Population density, rural (people/ sq. km of arable land) Forests and biodiversityForest area (% land area)Deforestation (average annual %, 1990-2010)Nationally terrestrial protected area (% of land area)Threatened species, mammalsThreatened species, birdsThreatened species, fishThreatened species, higher plantsGEF benefits index for biodiversity (0-100, median is 1.5) EnergyGDP per unit of energy use (2005 PPP $/kg oil equivalent)Energy use per capita (kg oil equivalent)Energy from biomass products and waste (% of total)Electric power consumption per capita (kWh)Electricity generated using fossil fuel (% of total)Electricity generated by hydropower (% of total) Emissions and pollutionCO2 emissions per unit of GDP (kg/2005 PPP $)CO2 emissions per capita (metric tons)CO2 emissions growth (%, 1990–2007)Particulate matter (urban-pop.-weighted avg., μg/cu. m)Road sector energy use per capita (kg oil equivalent) Water and sanitationInternal freshwater resources per capita (cu. m)Freshwater withdrawal
Total (% of internal resources)Agriculture (% of total freshwater withdrawal)
Access to improved water source (% of total population)Rural (% of rural population)Urban (% of urban population)
Access to improved sanitation (% of total population)Rural (% of rural population)Urban (% of urban population)
Environment and healthAcute resp. infection prevalence (% of children under five)Diarrhea prevalence (% of children under five)Under-five mortality rate (per 1,000 live births) National accounting aggregates—savings, depletion and degradationGross savings (% of GNI)Consumption of fixed capital (% of GNI)Education expenditure (% of GNI)Energy depletion (% of GNI)Mineral depletion (% of GNI)Net forest depletion (% of GNI)CO2 damage (% of GNI)Particulate emissions damage (% of GNI)Adjusted net savings (% of GNI)
60 2011 The Little Green Data Book
Country data
Latin America & Caribbean
group
Upper middle-income group
Population (millions) 46 Land area (1,000 sq. km) 1,110 GDP ($ billions) 234.0
GNI per capita, World Bank Atlas method ($)Adjusted Net National Income per capita ($)Urban population (% of total)Urban population growth (average annual %, 1990-2009) AgricultureAgricultural land (% land area)Agricultural productivity, value added per worker (2000 $)Food production index (1999-2001=100)Population density, rural (people/ sq. km of arable land) Forests and biodiversityForest area (% land area)Deforestation (average annual %, 1990-2010)Nationally terrestrial protected area (% of land area)Threatened species, mammalsThreatened species, birdsThreatened species, fishThreatened species, higher plantsGEF benefits index for biodiversity (0-100, median is 1.5) EnergyGDP per unit of energy use (2005 PPP $/kg oil equivalent)Energy use per capita (kg oil equivalent)Energy from biomass products and waste (% of total)Electric power consumption per capita (kWh)Electricity generated using fossil fuel (% of total)Electricity generated by hydropower (% of total) Emissions and pollutionCO2 emissions per unit of GDP (kg/2005 PPP $)CO2 emissions per capita (metric tons)CO2 emissions growth (%, 1990–2007)Particulate matter (urban-pop.-weighted avg., μg/cu. m)Road sector energy use per capita (kg oil equivalent) Water and sanitationInternal freshwater resources per capita (cu. m)Freshwater withdrawal
Total (% of internal resources)Agriculture (% of total freshwater withdrawal)
Access to improved water source (% of total population)Rural (% of rural population)Urban (% of urban population)
Access to improved sanitation (% of total population)Rural (% of rural population)Urban (% of urban population)
Environment and healthAcute resp. infection prevalence (% of children under five)Diarrhea prevalence (% of children under five)Under-five mortality rate (per 1,000 live births) National accounting aggregates—savings, depletion and degradationGross savings (% of GNI)Consumption of fixed capital (% of GNI)Education expenditure (% of GNI)Energy depletion (% of GNI)Mineral depletion (% of GNI)Net forest depletion (% of GNI)CO2 damage (% of GNI)Particulate emissions damage (% of GNI)Adjusted net savings (% of GNI)
61The Little Green Data Book 2011
Country data
Sub-Saharan Africa group
Low-income group
Population (thousands) 659 Land area (1,000 sq. km) 2 GDP ($ millions) 535
GNI per capita, World Bank Atlas method ($)Adjusted Net National Income per capita ($)Urban population (% of total)Urban population growth (average annual %, 1990-2009) AgricultureAgricultural land (% land area)Agricultural productivity, value added per worker (2000 $)Food production index (1999-2001=100)Population density, rural (people/ sq. km of arable land) Forests and biodiversityForest area (% land area)Deforestation (average annual %, 1990-2010)Nationally terrestrial protected area (% of land area)Threatened species, mammalsThreatened species, birdsThreatened species, fishThreatened species, higher plantsGEF benefits index for biodiversity (0-100, median is 1.5) EnergyGDP per unit of energy use (2005 PPP $/kg oil equivalent)Energy use per capita (kg oil equivalent)Energy from biomass products and waste (% of total)Electric power consumption per capita (kWh)Electricity generated using fossil fuel (% of total)Electricity generated by hydropower (% of total) Emissions and pollutionCO2 emissions per unit of GDP (kg/2005 PPP $)CO2 emissions per capita (metric tons)CO2 emissions growth (%, 1990–2007)Particulate matter (urban-pop.-weighted avg., μg/cu. m)Road sector energy use per capita (kg oil equivalent) Water and sanitationInternal freshwater resources per capita (cu. m)Freshwater withdrawal
Total (% of internal resources)Agriculture (% of total freshwater withdrawal)
Access to improved water source (% of total population)Rural (% of rural population)Urban (% of urban population)
Access to improved sanitation (% of total population)Rural (% of rural population)Urban (% of urban population)
Environment and healthAcute resp. infection prevalence (% of children under five)Diarrhea prevalence (% of children under five)Under-five mortality rate (per 1,000 live births) National accounting aggregates—savings, depletion and degradationGross savings (% of GNI)Consumption of fixed capital (% of GNI)Education expenditure (% of GNI)Energy depletion (% of GNI)Mineral depletion (% of GNI)Net forest depletion (% of GNI)CO2 damage (% of GNI)Particulate emissions damage (% of GNI)Adjusted net savings (% of GNI)
62 2011 The Little Green Data Book
Country data
Sub-Saharan Africa group
Low-income group
Population (millions) 66 Land area (1,000 sq. km) 2,267 GDP ($ billions) 10.6
GNI per capita, World Bank Atlas method ($)Adjusted Net National Income per capita ($)Urban population (% of total)Urban population growth (average annual %, 1990-2009) AgricultureAgricultural land (% land area)Agricultural productivity, value added per worker (2000 $)Food production index (1999-2001=100)Population density, rural (people/ sq. km of arable land) Forests and biodiversityForest area (% land area)Deforestation (average annual %, 1990-2010)Nationally terrestrial protected area (% of land area)Threatened species, mammalsThreatened species, birdsThreatened species, fishThreatened species, higher plantsGEF benefits index for biodiversity (0-100, median is 1.5) EnergyGDP per unit of energy use (2005 PPP $/kg oil equivalent)Energy use per capita (kg oil equivalent)Energy from biomass products and waste (% of total)Electric power consumption per capita (kWh)Electricity generated using fossil fuel (% of total)Electricity generated by hydropower (% of total) Emissions and pollutionCO2 emissions per unit of GDP (kg/2005 PPP $)CO2 emissions per capita (metric tons)CO2 emissions growth (%, 1990–2007)Particulate matter (urban-pop.-weighted avg., μg/cu. m)Road sector energy use per capita (kg oil equivalent) Water and sanitationInternal freshwater resources per capita (cu. m)Freshwater withdrawal
Total (% of internal resources)Agriculture (% of total freshwater withdrawal)
Access to improved water source (% of total population)Rural (% of rural population)Urban (% of urban population)
Access to improved sanitation (% of total population)Rural (% of rural population)Urban (% of urban population)
Environment and healthAcute resp. infection prevalence (% of children under five)Diarrhea prevalence (% of children under five)Under-five mortality rate (per 1,000 live births) National accounting aggregates—savings, depletion and degradationGross savings (% of GNI)Consumption of fixed capital (% of GNI)Education expenditure (% of GNI)Energy depletion (% of GNI)Mineral depletion (% of GNI)Net forest depletion (% of GNI)CO2 damage (% of GNI)Particulate emissions damage (% of GNI)Adjusted net savings (% of GNI)
63The Little Green Data Book 2011
Country data
Sub-Saharan Africa group
Lower middle-income group
Population (millions) 3.7 Land area (1,000 sq. km) 341.5 GDP ($ billions) 9.6
GNI per capita, World Bank Atlas method ($)Adjusted Net National Income per capita ($)Urban population (% of total)Urban population growth (average annual %, 1990-2009) AgricultureAgricultural land (% land area)Agricultural productivity, value added per worker (2000 $)Food production index (1999-2001=100)Population density, rural (people/ sq. km of arable land) Forests and biodiversityForest area (% land area)Deforestation (average annual %, 1990-2010)Nationally terrestrial protected area (% of land area)Threatened species, mammalsThreatened species, birdsThreatened species, fishThreatened species, higher plantsGEF benefits index for biodiversity (0-100, median is 1.5) EnergyGDP per unit of energy use (2005 PPP $/kg oil equivalent)Energy use per capita (kg oil equivalent)Energy from biomass products and waste (% of total)Electric power consumption per capita (kWh)Electricity generated using fossil fuel (% of total)Electricity generated by hydropower (% of total) Emissions and pollutionCO2 emissions per unit of GDP (kg/2005 PPP $)CO2 emissions per capita (metric tons)CO2 emissions growth (%, 1990–2007)Particulate matter (urban-pop.-weighted avg., μg/cu. m)Road sector energy use per capita (kg oil equivalent) Water and sanitationInternal freshwater resources per capita (cu. m)Freshwater withdrawal
Total (% of internal resources)Agriculture (% of total freshwater withdrawal)
Access to improved water source (% of total population)Rural (% of rural population)Urban (% of urban population)
Access to improved sanitation (% of total population)Rural (% of rural population)Urban (% of urban population)
Environment and healthAcute resp. infection prevalence (% of children under five)Diarrhea prevalence (% of children under five)Under-five mortality rate (per 1,000 live births) National accounting aggregates—savings, depletion and degradationGross savings (% of GNI)Consumption of fixed capital (% of GNI)Education expenditure (% of GNI)Energy depletion (% of GNI)Mineral depletion (% of GNI)Net forest depletion (% of GNI)CO2 damage (% of GNI)Particulate emissions damage (% of GNI)Adjusted net savings (% of GNI)
64 2011 The Little Green Data Book
Country data
Latin America & Caribbean
group
Upper middle-income group
Population (millions) 4.6 Land area (1,000 sq. km) 51.1 GDP ($ billions) 29.2
GNI per capita, World Bank Atlas method ($)Adjusted Net National Income per capita ($)Urban population (% of total)Urban population growth (average annual %, 1990-2009) AgricultureAgricultural land (% land area)Agricultural productivity, value added per worker (2000 $)Food production index (1999-2001=100)Population density, rural (people/ sq. km of arable land) Forests and biodiversityForest area (% land area)Deforestation (average annual %, 1990-2010)Nationally terrestrial protected area (% of land area)Threatened species, mammalsThreatened species, birdsThreatened species, fishThreatened species, higher plantsGEF benefits index for biodiversity (0-100, median is 1.5) EnergyGDP per unit of energy use (2005 PPP $/kg oil equivalent)Energy use per capita (kg oil equivalent)Energy from biomass products and waste (% of total)Electric power consumption per capita (kWh)Electricity generated using fossil fuel (% of total)Electricity generated by hydropower (% of total) Emissions and pollutionCO2 emissions per unit of GDP (kg/2005 PPP $)CO2 emissions per capita (metric tons)CO2 emissions growth (%, 1990–2007)Particulate matter (urban-pop.-weighted avg., μg/cu. m)Road sector energy use per capita (kg oil equivalent) Water and sanitationInternal freshwater resources per capita (cu. m)Freshwater withdrawal
Total (% of internal resources)Agriculture (% of total freshwater withdrawal)
Access to improved water source (% of total population)Rural (% of rural population)Urban (% of urban population)
Access to improved sanitation (% of total population)Rural (% of rural population)Urban (% of urban population)
Environment and healthAcute resp. infection prevalence (% of children under five)Diarrhea prevalence (% of children under five)Under-five mortality rate (per 1,000 live births) National accounting aggregates—savings, depletion and degradationGross savings (% of GNI)Consumption of fixed capital (% of GNI)Education expenditure (% of GNI)Energy depletion (% of GNI)Mineral depletion (% of GNI)Net forest depletion (% of GNI)CO2 damage (% of GNI)Particulate emissions damage (% of GNI)Adjusted net savings (% of GNI)
65The Little Green Data Book 2011
Country data
Sub-Saharan Africa group
Lower middle-income group
Population (millions) 21 Land area (1,000 sq. km) 318 GDP ($ billions) 23.3
GNI per capita, World Bank Atlas method ($)Adjusted Net National Income per capita ($)Urban population (% of total)Urban population growth (average annual %, 1990-2009) AgricultureAgricultural land (% land area)Agricultural productivity, value added per worker (2000 $)Food production index (1999-2001=100)Population density, rural (people/ sq. km of arable land) Forests and biodiversityForest area (% land area)Deforestation (average annual %, 1990-2010)Nationally terrestrial protected area (% of land area)Threatened species, mammalsThreatened species, birdsThreatened species, fishThreatened species, higher plantsGEF benefits index for biodiversity (0-100, median is 1.5) EnergyGDP per unit of energy use (2005 PPP $/kg oil equivalent)Energy use per capita (kg oil equivalent)Energy from biomass products and waste (% of total)Electric power consumption per capita (kWh)Electricity generated using fossil fuel (% of total)Electricity generated by hydropower (% of total) Emissions and pollutionCO2 emissions per unit of GDP (kg/2005 PPP $)CO2 emissions per capita (metric tons)CO2 emissions growth (%, 1990–2007)Particulate matter (urban-pop.-weighted avg., μg/cu. m)Road sector energy use per capita (kg oil equivalent) Water and sanitationInternal freshwater resources per capita (cu. m)Freshwater withdrawal
Total (% of internal resources)Agriculture (% of total freshwater withdrawal)
Access to improved water source (% of total population)Rural (% of rural population)Urban (% of urban population)
Access to improved sanitation (% of total population)Rural (% of rural population)Urban (% of urban population)
Environment and healthAcute resp. infection prevalence (% of children under five)Diarrhea prevalence (% of children under five)Under-five mortality rate (per 1,000 live births) National accounting aggregates—savings, depletion and degradationGross savings (% of GNI)Consumption of fixed capital (% of GNI)Education expenditure (% of GNI)Energy depletion (% of GNI)Mineral depletion (% of GNI)Net forest depletion (% of GNI)CO2 damage (% of GNI)Particulate emissions damage (% of GNI)Adjusted net savings (% of GNI)
66 2011 The Little Green Data Book
Country data
High-income group
Population (millions) 4.4 Land area (1,000 sq. km) 56.0 GDP ($ billions) 63.0
13,770 37,99011,797 31,467
57.5 77.3–0.1 1.0
23 3713,909 25,774
104 106220 331
34.3 28.9–0.1 –0.17.3 13.4
71056
30.6
8.5 6.62,047 5,131
3.6 3.93,878 9,51856.8 62.942.7 11.3
0.3 0.45.6 12.5
.. 17.927 24
432 964
8,499 9,031
.. 10.5
.. 4299 10097 98
100 10099 9998 9899 100
..11.3
5 7
22.6 16.112.9 14.1
3.9 4.60.7 0.90.0 0.10.2 0.00.3 0.20.2 0.1
12.3 5.2
Croatia
GNI per capita, World Bank Atlas method ($)Adjusted Net National Income per capita ($)Urban population (% of total)Urban population growth (average annual %, 1990-2009) AgricultureAgricultural land (% land area)Agricultural productivity, value added per worker (2000 $)Food production index (1999-2001=100)Population density, rural (people/ sq. km of arable land) Forests and biodiversityForest area (% land area)Deforestation (average annual %, 1990-2010)Nationally terrestrial protected area (% of land area)Threatened species, mammalsThreatened species, birdsThreatened species, fishThreatened species, higher plantsGEF benefits index for biodiversity (0-100, median is 1.5) EnergyGDP per unit of energy use (2005 PPP $/kg oil equivalent)Energy use per capita (kg oil equivalent)Energy from biomass products and waste (% of total)Electric power consumption per capita (kWh)Electricity generated using fossil fuel (% of total)Electricity generated by hydropower (% of total) Emissions and pollutionCO2 emissions per unit of GDP (kg/2005 PPP $)CO2 emissions per capita (metric tons)CO2 emissions growth (%, 1990–2007)Particulate matter (urban-pop.-weighted avg., μg/cu. m)Road sector energy use per capita (kg oil equivalent) Water and sanitationInternal freshwater resources per capita (cu. m)Freshwater withdrawal
Total (% of internal resources)Agriculture (% of total freshwater withdrawal)
Access to improved water source (% of total population)Rural (% of rural population)Urban (% of urban population)
Access to improved sanitation (% of total population)Rural (% of rural population)Urban (% of urban population)
Environment and healthAcute resp. infection prevalence (% of children under five)Diarrhea prevalence (% of children under five)Under-five mortality rate (per 1,000 live births) National accounting aggregates—savings, depletion and degradationGross savings (% of GNI)Consumption of fixed capital (% of GNI)Education expenditure (% of GNI)Energy depletion (% of GNI)Mineral depletion (% of GNI)Net forest depletion (% of GNI)CO2 damage (% of GNI)Particulate emissions damage (% of GNI)Adjusted net savings (% of GNI)
67The Little Green Data Book 2011
Country data
Latin America & Caribbean
group
Upper middle-income group
Population (millions) 11 Land area (1,000 sq. km) 106 GDP ($ billions) 62.7
GNI per capita, World Bank Atlas method ($)Adjusted Net National Income per capita ($)Urban population (% of total)Urban population growth (average annual %, 1990-2009) AgricultureAgricultural land (% land area)Agricultural productivity, value added per worker (2000 $)Food production index (1999-2001=100)Population density, rural (people/ sq. km of arable land) Forests and biodiversityForest area (% land area)Deforestation (average annual %, 1990-2010)Nationally terrestrial protected area (% of land area)Threatened species, mammalsThreatened species, birdsThreatened species, fishThreatened species, higher plantsGEF benefits index for biodiversity (0-100, median is 1.5) EnergyGDP per unit of energy use (2005 PPP $/kg oil equivalent)Energy use per capita (kg oil equivalent)Energy from biomass products and waste (% of total)Electric power consumption per capita (kWh)Electricity generated using fossil fuel (% of total)Electricity generated by hydropower (% of total) Emissions and pollutionCO2 emissions per unit of GDP (kg/2005 PPP $)CO2 emissions per capita (metric tons)CO2 emissions growth (%, 1990–2007)Particulate matter (urban-pop.-weighted avg., μg/cu. m)Road sector energy use per capita (kg oil equivalent) Water and sanitationInternal freshwater resources per capita (cu. m)Freshwater withdrawal
Total (% of internal resources)Agriculture (% of total freshwater withdrawal)
Access to improved water source (% of total population)Rural (% of rural population)Urban (% of urban population)
Access to improved sanitation (% of total population)Rural (% of rural population)Urban (% of urban population)
Environment and healthAcute resp. infection prevalence (% of children under five)Diarrhea prevalence (% of children under five)Under-five mortality rate (per 1,000 live births) National accounting aggregates—savings, depletion and degradationGross savings (% of GNI)Consumption of fixed capital (% of GNI)Education expenditure (% of GNI)Energy depletion (% of GNI)Mineral depletion (% of GNI)Net forest depletion (% of GNI)CO2 damage (% of GNI)Particulate emissions damage (% of GNI)Adjusted net savings (% of GNI)
68 2011 The Little Green Data Book
Country data
High-income group
Population (thousands) 871 Land area (1,000 sq. km) 9 GDP ($ billions) 25.0
30,480 37,99023,767 31,467
70.1 77.31.6 1.0
13 3710,149 25,774
84 106315 331
18.7 28.9–0.2 –0.111.0 13.4
55
178
0.5
8.1 6.62,998 5,131
1.8 3.95,711 9,51899.7 62.90.0 11.3
0.4 0.49.6 12.5
76.2 17.934 24
788 964
914 9,031
24.5 10.578 42
100 100100 98100 100100 99100 98100 100
..
..4 7
.. 16.1
.. 14.14.0 4.60.0 0.90.0 0.10.0 0.00.3 0.20.3 0.1
.. 5.2
Cyprus
GNI per capita, World Bank Atlas method ($)Adjusted Net National Income per capita ($)Urban population (% of total)Urban population growth (average annual %, 1990-2009) AgricultureAgricultural land (% land area)Agricultural productivity, value added per worker (2000 $)Food production index (1999-2001=100)Population density, rural (people/ sq. km of arable land) Forests and biodiversityForest area (% land area)Deforestation (average annual %, 1990-2010)Nationally terrestrial protected area (% of land area)Threatened species, mammalsThreatened species, birdsThreatened species, fishThreatened species, higher plantsGEF benefits index for biodiversity (0-100, median is 1.5) EnergyGDP per unit of energy use (2005 PPP $/kg oil equivalent)Energy use per capita (kg oil equivalent)Energy from biomass products and waste (% of total)Electric power consumption per capita (kWh)Electricity generated using fossil fuel (% of total)Electricity generated by hydropower (% of total) Emissions and pollutionCO2 emissions per unit of GDP (kg/2005 PPP $)CO2 emissions per capita (metric tons)CO2 emissions growth (%, 1990–2007)Particulate matter (urban-pop.-weighted avg., μg/cu. m)Road sector energy use per capita (kg oil equivalent) Water and sanitationInternal freshwater resources per capita (cu. m)Freshwater withdrawal
Total (% of internal resources)Agriculture (% of total freshwater withdrawal)
Access to improved water source (% of total population)Rural (% of rural population)Urban (% of urban population)
Access to improved sanitation (% of total population)Rural (% of rural population)Urban (% of urban population)
Environment and healthAcute resp. infection prevalence (% of children under five)Diarrhea prevalence (% of children under five)Under-five mortality rate (per 1,000 live births) National accounting aggregates—savings, depletion and degradationGross savings (% of GNI)Consumption of fixed capital (% of GNI)Education expenditure (% of GNI)Energy depletion (% of GNI)Mineral depletion (% of GNI)Net forest depletion (% of GNI)CO2 damage (% of GNI)Particulate emissions damage (% of GNI)Adjusted net savings (% of GNI)
69The Little Green Data Book 2011
Country data
High-income group
Population (millions) 10 Land area (1,000 sq. km) 77 GDP ($ billions) 190.3
17,310 37,99014,602 31,467
73.5 77.30.0 1.0
55 375,687 25,774
99 10691 331
34.4 28.90.0 –0.1
15.1 13.42624
0.1
5.4 6.64,282 5,131
4.9 3.96,464 9,518
61.3 62.92.4 11.3
0.5 0.412.1 12.5
.. 17.918 24
553 964
1,272 9,031
13.6 10.53 42
100 100100 98100 100
98 9997 9899 100
..
..4 7
21.8 16.113.6 14.1
4.0 4.60.3 0.90.0 0.10.0 0.00.6 0.20.0 0.1
11.3 5.2
Czech Republic
GNI per capita, World Bank Atlas method ($)Adjusted Net National Income per capita ($)Urban population (% of total)Urban population growth (average annual %, 1990-2009) AgricultureAgricultural land (% land area)Agricultural productivity, value added per worker (2000 $)Food production index (1999-2001=100)Population density, rural (people/ sq. km of arable land) Forests and biodiversityForest area (% land area)Deforestation (average annual %, 1990-2010)Nationally terrestrial protected area (% of land area)Threatened species, mammalsThreatened species, birdsThreatened species, fishThreatened species, higher plantsGEF benefits index for biodiversity (0-100, median is 1.5) EnergyGDP per unit of energy use (2005 PPP $/kg oil equivalent)Energy use per capita (kg oil equivalent)Energy from biomass products and waste (% of total)Electric power consumption per capita (kWh)Electricity generated using fossil fuel (% of total)Electricity generated by hydropower (% of total) Emissions and pollutionCO2 emissions per unit of GDP (kg/2005 PPP $)CO2 emissions per capita (metric tons)CO2 emissions growth (%, 1990–2007)Particulate matter (urban-pop.-weighted avg., μg/cu. m)Road sector energy use per capita (kg oil equivalent) Water and sanitationInternal freshwater resources per capita (cu. m)Freshwater withdrawal
Total (% of internal resources)Agriculture (% of total freshwater withdrawal)
Access to improved water source (% of total population)Rural (% of rural population)Urban (% of urban population)
Access to improved sanitation (% of total population)Rural (% of rural population)Urban (% of urban population)
Environment and healthAcute resp. infection prevalence (% of children under five)Diarrhea prevalence (% of children under five)Under-five mortality rate (per 1,000 live births) National accounting aggregates—savings, depletion and degradationGross savings (% of GNI)Consumption of fixed capital (% of GNI)Education expenditure (% of GNI)Energy depletion (% of GNI)Mineral depletion (% of GNI)Net forest depletion (% of GNI)CO2 damage (% of GNI)Particulate emissions damage (% of GNI)Adjusted net savings (% of GNI)
70 2011 The Little Green Data Book
Country data
High-income group
Population (millions) 5.5 Land area (1,000 sq. km) 42.4 GDP ($ billions) 309.6
59,060 37,99047,216 31,467
86.9 77.30.5 1.0
63 3736,907 25,774
107 10630 331
12.8 28.9–0.7 –0.15.0 13.4
22
143
0.2
9.9 6.63,460 5,131
15.6 3.96,460 9,518
70.1 62.90.1 11.3
0.3 0.49.1 12.5
–0.8 17.916 24
779 964
1,099 9,031
17.4 10.551 42
100 100100 98100 100100 99100 98100 100
..
..4 7
21.4 16.116.5 14.1
7.4 4.61.5 0.90.0 0.10.0 0.00.1 0.20.0 0.1
10.7 5.2
Denmark
GNI per capita, World Bank Atlas method ($)Adjusted Net National Income per capita ($)Urban population (% of total)Urban population growth (average annual %, 1990-2009) AgricultureAgricultural land (% land area)Agricultural productivity, value added per worker (2000 $)Food production index (1999-2001=100)Population density, rural (people/ sq. km of arable land) Forests and biodiversityForest area (% land area)Deforestation (average annual %, 1990-2010)Nationally terrestrial protected area (% of land area)Threatened species, mammalsThreatened species, birdsThreatened species, fishThreatened species, higher plantsGEF benefits index for biodiversity (0-100, median is 1.5) EnergyGDP per unit of energy use (2005 PPP $/kg oil equivalent)Energy use per capita (kg oil equivalent)Energy from biomass products and waste (% of total)Electric power consumption per capita (kWh)Electricity generated using fossil fuel (% of total)Electricity generated by hydropower (% of total) Emissions and pollutionCO2 emissions per unit of GDP (kg/2005 PPP $)CO2 emissions per capita (metric tons)CO2 emissions growth (%, 1990–2007)Particulate matter (urban-pop.-weighted avg., μg/cu. m)Road sector energy use per capita (kg oil equivalent) Water and sanitationInternal freshwater resources per capita (cu. m)Freshwater withdrawal
Total (% of internal resources)Agriculture (% of total freshwater withdrawal)
Access to improved water source (% of total population)Rural (% of rural population)Urban (% of urban population)
Access to improved sanitation (% of total population)Rural (% of rural population)Urban (% of urban population)
Environment and healthAcute resp. infection prevalence (% of children under five)Diarrhea prevalence (% of children under five)Under-five mortality rate (per 1,000 live births) National accounting aggregates—savings, depletion and degradationGross savings (% of GNI)Consumption of fixed capital (% of GNI)Education expenditure (% of GNI)Energy depletion (% of GNI)Mineral depletion (% of GNI)Net forest depletion (% of GNI)CO2 damage (% of GNI)Particulate emissions damage (% of GNI)Adjusted net savings (% of GNI)
71The Little Green Data Book 2011
Country data
Middle East &
N. Africa group
Lower middle-income group
Population (thousands) 864 Land area (1,000 sq. km) 23 GDP ($ billions) 1.0
GNI per capita, World Bank Atlas method ($)Adjusted Net National Income per capita ($)Urban population (% of total)Urban population growth (average annual %, 1990-2009) AgricultureAgricultural land (% land area)Agricultural productivity, value added per worker (2000 $)Food production index (1999-2001=100)Population density, rural (people/ sq. km of arable land) Forests and biodiversityForest area (% land area)Deforestation (average annual %, 1990-2010)Nationally terrestrial protected area (% of land area)Threatened species, mammalsThreatened species, birdsThreatened species, fishThreatened species, higher plantsGEF benefits index for biodiversity (0-100, median is 1.5) EnergyGDP per unit of energy use (2005 PPP $/kg oil equivalent)Energy use per capita (kg oil equivalent)Energy from biomass products and waste (% of total)Electric power consumption per capita (kWh)Electricity generated using fossil fuel (% of total)Electricity generated by hydropower (% of total) Emissions and pollutionCO2 emissions per unit of GDP (kg/2005 PPP $)CO2 emissions per capita (metric tons)CO2 emissions growth (%, 1990–2007)Particulate matter (urban-pop.-weighted avg., μg/cu. m)Road sector energy use per capita (kg oil equivalent) Water and sanitationInternal freshwater resources per capita (cu. m)Freshwater withdrawal
Total (% of internal resources)Agriculture (% of total freshwater withdrawal)
Access to improved water source (% of total population)Rural (% of rural population)Urban (% of urban population)
Access to improved sanitation (% of total population)Rural (% of rural population)Urban (% of urban population)
Environment and healthAcute resp. infection prevalence (% of children under five)Diarrhea prevalence (% of children under five)Under-five mortality rate (per 1,000 live births) National accounting aggregates—savings, depletion and degradationGross savings (% of GNI)Consumption of fixed capital (% of GNI)Education expenditure (% of GNI)Energy depletion (% of GNI)Mineral depletion (% of GNI)Net forest depletion (% of GNI)CO2 damage (% of GNI)Particulate emissions damage (% of GNI)Adjusted net savings (% of GNI)
72 2011 The Little Green Data Book
Country data
Latin America & Caribbean
group
Upper middle-income group
Population (thousands) 74 Land area (1,000 sq. km) 0.8 GDP ($ millions) 378
GNI per capita, World Bank Atlas method ($)Adjusted Net National Income per capita ($)Urban population (% of total)Urban population growth (average annual %, 1990-2009) AgricultureAgricultural land (% land area)Agricultural productivity, value added per worker (2000 $)Food production index (1999-2001=100)Population density, rural (people/ sq. km of arable land) Forests and biodiversityForest area (% land area)Deforestation (average annual %, 1990-2010)Nationally terrestrial protected area (% of land area)Threatened species, mammalsThreatened species, birdsThreatened species, fishThreatened species, higher plantsGEF benefits index for biodiversity (0-100, median is 1.5) EnergyGDP per unit of energy use (2005 PPP $/kg oil equivalent)Energy use per capita (kg oil equivalent)Energy from biomass products and waste (% of total)Electric power consumption per capita (kWh)Electricity generated using fossil fuel (% of total)Electricity generated by hydropower (% of total) Emissions and pollutionCO2 emissions per unit of GDP (kg/2005 PPP $)CO2 emissions per capita (metric tons)CO2 emissions growth (%, 1990–2007)Particulate matter (urban-pop.-weighted avg., μg/cu. m)Road sector energy use per capita (kg oil equivalent) Water and sanitationInternal freshwater resources per capita (cu. m)Freshwater withdrawal
Total (% of internal resources)Agriculture (% of total freshwater withdrawal)
Access to improved water source (% of total population)Rural (% of rural population)Urban (% of urban population)
Access to improved sanitation (% of total population)Rural (% of rural population)Urban (% of urban population)
Environment and healthAcute resp. infection prevalence (% of children under five)Diarrhea prevalence (% of children under five)Under-five mortality rate (per 1,000 live births) National accounting aggregates—savings, depletion and degradationGross savings (% of GNI)Consumption of fixed capital (% of GNI)Education expenditure (% of GNI)Energy depletion (% of GNI)Mineral depletion (% of GNI)Net forest depletion (% of GNI)CO2 damage (% of GNI)Particulate emissions damage (% of GNI)Adjusted net savings (% of GNI)
73The Little Green Data Book 2011
Country data
Latin America & Caribbean
group
Upper middle-income group
Population (millions) 10 Land area (1,000 sq. km) 48 GDP ($ billions) 46.8
GNI per capita, World Bank Atlas method ($)Adjusted Net National Income per capita ($)Urban population (% of total)Urban population growth (average annual %, 1990-2009) AgricultureAgricultural land (% land area)Agricultural productivity, value added per worker (2000 $)Food production index (1999-2001=100)Population density, rural (people/ sq. km of arable land) Forests and biodiversityForest area (% land area)Deforestation (average annual %, 1990-2010)Nationally terrestrial protected area (% of land area)Threatened species, mammalsThreatened species, birdsThreatened species, fishThreatened species, higher plantsGEF benefits index for biodiversity (0-100, median is 1.5) EnergyGDP per unit of energy use (2005 PPP $/kg oil equivalent)Energy use per capita (kg oil equivalent)Energy from biomass products and waste (% of total)Electric power consumption per capita (kWh)Electricity generated using fossil fuel (% of total)Electricity generated by hydropower (% of total) Emissions and pollutionCO2 emissions per unit of GDP (kg/2005 PPP $)CO2 emissions per capita (metric tons)CO2 emissions growth (%, 1990–2007)Particulate matter (urban-pop.-weighted avg., μg/cu. m)Road sector energy use per capita (kg oil equivalent) Water and sanitationInternal freshwater resources per capita (cu. m)Freshwater withdrawal
Total (% of internal resources)Agriculture (% of total freshwater withdrawal)
Access to improved water source (% of total population)Rural (% of rural population)Urban (% of urban population)
Access to improved sanitation (% of total population)Rural (% of rural population)Urban (% of urban population)
Environment and healthAcute resp. infection prevalence (% of children under five)Diarrhea prevalence (% of children under five)Under-five mortality rate (per 1,000 live births) National accounting aggregates—savings, depletion and degradationGross savings (% of GNI)Consumption of fixed capital (% of GNI)Education expenditure (% of GNI)Energy depletion (% of GNI)Mineral depletion (% of GNI)Net forest depletion (% of GNI)CO2 damage (% of GNI)Particulate emissions damage (% of GNI)Adjusted net savings (% of GNI)
74 2011 The Little Green Data Book
Country data
Latin America & Caribbean
group
Lower middle-income group
Population (millions) 14 Land area (1,000 sq. km) 248 GDP ($ billions) 57.2
GNI per capita, World Bank Atlas method ($)Adjusted Net National Income per capita ($)Urban population (% of total)Urban population growth (average annual %, 1990-2009) AgricultureAgricultural land (% land area)Agricultural productivity, value added per worker (2000 $)Food production index (1999-2001=100)Population density, rural (people/ sq. km of arable land) Forests and biodiversityForest area (% land area)Deforestation (average annual %, 1990-2010)Nationally terrestrial protected area (% of land area)Threatened species, mammalsThreatened species, birdsThreatened species, fishThreatened species, higher plantsGEF benefits index for biodiversity (0-100, median is 1.5) EnergyGDP per unit of energy use (2005 PPP $/kg oil equivalent)Energy use per capita (kg oil equivalent)Energy from biomass products and waste (% of total)Electric power consumption per capita (kWh)Electricity generated using fossil fuel (% of total)Electricity generated by hydropower (% of total) Emissions and pollutionCO2 emissions per unit of GDP (kg/2005 PPP $)CO2 emissions per capita (metric tons)CO2 emissions growth (%, 1990–2007)Particulate matter (urban-pop.-weighted avg., μg/cu. m)Road sector energy use per capita (kg oil equivalent) Water and sanitationInternal freshwater resources per capita (cu. m)Freshwater withdrawal
Total (% of internal resources)Agriculture (% of total freshwater withdrawal)
Access to improved water source (% of total population)Rural (% of rural population)Urban (% of urban population)
Access to improved sanitation (% of total population)Rural (% of rural population)Urban (% of urban population)
Environment and healthAcute resp. infection prevalence (% of children under five)Diarrhea prevalence (% of children under five)Under-five mortality rate (per 1,000 live births) National accounting aggregates—savings, depletion and degradationGross savings (% of GNI)Consumption of fixed capital (% of GNI)Education expenditure (% of GNI)Energy depletion (% of GNI)Mineral depletion (% of GNI)Net forest depletion (% of GNI)CO2 damage (% of GNI)Particulate emissions damage (% of GNI)Adjusted net savings (% of GNI)
75The Little Green Data Book 2011
Country data
Middle East &
N. Africa group
Lower middle-income group
Population (millions) 83 Land area (1,000 sq. km) 995 GDP ($ billions) 188.4
GNI per capita, World Bank Atlas method ($)Adjusted Net National Income per capita ($)Urban population (% of total)Urban population growth (average annual %, 1990-2009) AgricultureAgricultural land (% land area)Agricultural productivity, value added per worker (2000 $)Food production index (1999-2001=100)Population density, rural (people/ sq. km of arable land) Forests and biodiversityForest area (% land area)Deforestation (average annual %, 1990-2010)Nationally terrestrial protected area (% of land area)Threatened species, mammalsThreatened species, birdsThreatened species, fishThreatened species, higher plantsGEF benefits index for biodiversity (0-100, median is 1.5) EnergyGDP per unit of energy use (2005 PPP $/kg oil equivalent)Energy use per capita (kg oil equivalent)Energy from biomass products and waste (% of total)Electric power consumption per capita (kWh)Electricity generated using fossil fuel (% of total)Electricity generated by hydropower (% of total) Emissions and pollutionCO2 emissions per unit of GDP (kg/2005 PPP $)CO2 emissions per capita (metric tons)CO2 emissions growth (%, 1990–2007)Particulate matter (urban-pop.-weighted avg., μg/cu. m)Road sector energy use per capita (kg oil equivalent) Water and sanitationInternal freshwater resources per capita (cu. m)Freshwater withdrawal
Total (% of internal resources)Agriculture (% of total freshwater withdrawal)
Access to improved water source (% of total population)Rural (% of rural population)Urban (% of urban population)
Access to improved sanitation (% of total population)Rural (% of rural population)Urban (% of urban population)
Environment and healthAcute resp. infection prevalence (% of children under five)Diarrhea prevalence (% of children under five)Under-five mortality rate (per 1,000 live births) National accounting aggregates—savings, depletion and degradationGross savings (% of GNI)Consumption of fixed capital (% of GNI)Education expenditure (% of GNI)Energy depletion (% of GNI)Mineral depletion (% of GNI)Net forest depletion (% of GNI)CO2 damage (% of GNI)Particulate emissions damage (% of GNI)Adjusted net savings (% of GNI)
76 2011 The Little Green Data Book
Country data
Latin America & Caribbean
group
Lower middle-income group
Population (millions) 6.2 Land area (1,000 sq. km) 20.7 GDP ($ billions) 21.1
GNI per capita, World Bank Atlas method ($)Adjusted Net National Income per capita ($)Urban population (% of total)Urban population growth (average annual %, 1990-2009) AgricultureAgricultural land (% land area)Agricultural productivity, value added per worker (2000 $)Food production index (1999-2001=100)Population density, rural (people/ sq. km of arable land) Forests and biodiversityForest area (% land area)Deforestation (average annual %, 1990-2010)Nationally terrestrial protected area (% of land area)Threatened species, mammalsThreatened species, birdsThreatened species, fishThreatened species, higher plantsGEF benefits index for biodiversity (0-100, median is 1.5) EnergyGDP per unit of energy use (2005 PPP $/kg oil equivalent)Energy use per capita (kg oil equivalent)Energy from biomass products and waste (% of total)Electric power consumption per capita (kWh)Electricity generated using fossil fuel (% of total)Electricity generated by hydropower (% of total) Emissions and pollutionCO2 emissions per unit of GDP (kg/2005 PPP $)CO2 emissions per capita (metric tons)CO2 emissions growth (%, 1990–2007)Particulate matter (urban-pop.-weighted avg., μg/cu. m)Road sector energy use per capita (kg oil equivalent) Water and sanitationInternal freshwater resources per capita (cu. m)Freshwater withdrawal
Total (% of internal resources)Agriculture (% of total freshwater withdrawal)
Access to improved water source (% of total population)Rural (% of rural population)Urban (% of urban population)
Access to improved sanitation (% of total population)Rural (% of rural population)Urban (% of urban population)
Environment and healthAcute resp. infection prevalence (% of children under five)Diarrhea prevalence (% of children under five)Under-five mortality rate (per 1,000 live births) National accounting aggregates—savings, depletion and degradationGross savings (% of GNI)Consumption of fixed capital (% of GNI)Education expenditure (% of GNI)Energy depletion (% of GNI)Mineral depletion (% of GNI)Net forest depletion (% of GNI)CO2 damage (% of GNI)Particulate emissions damage (% of GNI)Adjusted net savings (% of GNI)
77The Little Green Data Book 2011
Population (thousands) 676 Land area (1,000 sq. km) 28 GDP ($ billions) 10.4
Country data
High-income group
12,420 37,9902,205 31,467
39.5 77.33.7 1.0
11 37993 25,774
89 106305 331
58.0 28.90.4 –0.1
19.2 13.419
527681.5
.. 6.6
.. 5,131
.. 3.9
.. 9,518
.. 62.9
.. 11.3
0.3 0.47.5 12.5
3,863.6 17.97 24.. 964
40,485 9,031
0.1 10.56 42
43 10042 9845 10051 9946 9860 100
..
..145 7
.. 16.120.6 14.11.2 4.6
66.0 0.90.0 0.10.0 0.00.7 0.20.0 0.1
.. 5.2
Equatorial Guinea
GNI per capita, World Bank Atlas method ($)Adjusted Net National Income per capita ($)Urban population (% of total)Urban population growth (average annual %, 1990-2009) AgricultureAgricultural land (% land area)Agricultural productivity, value added per worker (2000 $)Food production index (1999-2001=100)Population density, rural (people/ sq. km of arable land) Forests and biodiversityForest area (% land area)Deforestation (average annual %, 1990-2010)Nationally terrestrial protected area (% of land area)Threatened species, mammalsThreatened species, birdsThreatened species, fishThreatened species, higher plantsGEF benefits index for biodiversity (0-100, median is 1.5) EnergyGDP per unit of energy use (2005 PPP $/kg oil equivalent)Energy use per capita (kg oil equivalent)Energy from biomass products and waste (% of total)Electric power consumption per capita (kWh)Electricity generated using fossil fuel (% of total)Electricity generated by hydropower (% of total) Emissions and pollutionCO2 emissions per unit of GDP (kg/2005 PPP $)CO2 emissions per capita (metric tons)CO2 emissions growth (%, 1990–2007)Particulate matter (urban-pop.-weighted avg., μg/cu. m)Road sector energy use per capita (kg oil equivalent) Water and sanitationInternal freshwater resources per capita (cu. m)Freshwater withdrawal
Total (% of internal resources)Agriculture (% of total freshwater withdrawal)
Access to improved water source (% of total population)Rural (% of rural population)Urban (% of urban population)
Access to improved sanitation (% of total population)Rural (% of rural population)Urban (% of urban population)
Environment and healthAcute resp. infection prevalence (% of children under five)Diarrhea prevalence (% of children under five)Under-five mortality rate (per 1,000 live births) National accounting aggregates—savings, depletion and degradationGross savings (% of GNI)Consumption of fixed capital (% of GNI)Education expenditure (% of GNI)Energy depletion (% of GNI)Mineral depletion (% of GNI)Net forest depletion (% of GNI)CO2 damage (% of GNI)Particulate emissions damage (% of GNI)Adjusted net savings (% of GNI)
78 2011 The Little Green Data Book
Country data
Sub-Saharan Africa group
Low-income group
Population (millions) 5.1 Land area (1,000 sq. km) 101.0 GDP ($ billions) 1.9
GNI per capita, World Bank Atlas method ($)Adjusted Net National Income per capita ($)Urban population (% of total)Urban population growth (average annual %, 1990-2009) AgricultureAgricultural land (% land area)Agricultural productivity, value added per worker (2000 $)Food production index (1999-2001=100)Population density, rural (people/ sq. km of arable land) Forests and biodiversityForest area (% land area)Deforestation (average annual %, 1990-2010)Nationally terrestrial protected area (% of land area)Threatened species, mammalsThreatened species, birdsThreatened species, fishThreatened species, higher plantsGEF benefits index for biodiversity (0-100, median is 1.5) EnergyGDP per unit of energy use (2005 PPP $/kg oil equivalent)Energy use per capita (kg oil equivalent)Energy from biomass products and waste (% of total)Electric power consumption per capita (kWh)Electricity generated using fossil fuel (% of total)Electricity generated by hydropower (% of total) Emissions and pollutionCO2 emissions per unit of GDP (kg/2005 PPP $)CO2 emissions per capita (metric tons)CO2 emissions growth (%, 1990–2007)Particulate matter (urban-pop.-weighted avg., μg/cu. m)Road sector energy use per capita (kg oil equivalent) Water and sanitationInternal freshwater resources per capita (cu. m)Freshwater withdrawal
Total (% of internal resources)Agriculture (% of total freshwater withdrawal)
Access to improved water source (% of total population)Rural (% of rural population)Urban (% of urban population)
Access to improved sanitation (% of total population)Rural (% of rural population)Urban (% of urban population)
Environment and healthAcute resp. infection prevalence (% of children under five)Diarrhea prevalence (% of children under five)Under-five mortality rate (per 1,000 live births) National accounting aggregates—savings, depletion and degradationGross savings (% of GNI)Consumption of fixed capital (% of GNI)Education expenditure (% of GNI)Energy depletion (% of GNI)Mineral depletion (% of GNI)Net forest depletion (% of GNI)CO2 damage (% of GNI)Particulate emissions damage (% of GNI)Adjusted net savings (% of GNI)
79The Little Green Data Book 2011
Country data
High-income group
Population (millions) 1.3 Land area (1,000 sq. km) 42.4 GDP ($ billions) 19.1
14,060 37,99011,945 31,467
69.5 77.3–1.0 1.0
19 373,207 25,774
134 10668 331
52.3 28.9–0.2 –0.120.0 13.4
1340
0.1
4.7 6.64,026 5,131
11.7 3.96,348 9,518
95.4 62.90.3 11.3
0.8 0.415.2 12.5
.. 17.913 24
542 964
9,473 9,031
1.2 10.5.. 42
98 10097 9899 10095 9994 9896 100
..
..6 7
24.2 16.112.8 14.1
4.4 4.60.7 0.90.0 0.10.0 0.00.8 0.20.0 0.1
14.4 5.2
Estonia
GNI per capita, World Bank Atlas method ($)Adjusted Net National Income per capita ($)Urban population (% of total)Urban population growth (average annual %, 1990-2009) AgricultureAgricultural land (% land area)Agricultural productivity, value added per worker (2000 $)Food production index (1999-2001=100)Population density, rural (people/ sq. km of arable land) Forests and biodiversityForest area (% land area)Deforestation (average annual %, 1990-2010)Nationally terrestrial protected area (% of land area)Threatened species, mammalsThreatened species, birdsThreatened species, fishThreatened species, higher plantsGEF benefits index for biodiversity (0-100, median is 1.5) EnergyGDP per unit of energy use (2005 PPP $/kg oil equivalent)Energy use per capita (kg oil equivalent)Energy from biomass products and waste (% of total)Electric power consumption per capita (kWh)Electricity generated using fossil fuel (% of total)Electricity generated by hydropower (% of total) Emissions and pollutionCO2 emissions per unit of GDP (kg/2005 PPP $)CO2 emissions per capita (metric tons)CO2 emissions growth (%, 1990–2007)Particulate matter (urban-pop.-weighted avg., μg/cu. m)Road sector energy use per capita (kg oil equivalent) Water and sanitationInternal freshwater resources per capita (cu. m)Freshwater withdrawal
Total (% of internal resources)Agriculture (% of total freshwater withdrawal)
Access to improved water source (% of total population)Rural (% of rural population)Urban (% of urban population)
Access to improved sanitation (% of total population)Rural (% of rural population)Urban (% of urban population)
Environment and healthAcute resp. infection prevalence (% of children under five)Diarrhea prevalence (% of children under five)Under-five mortality rate (per 1,000 live births) National accounting aggregates—savings, depletion and degradationGross savings (% of GNI)Consumption of fixed capital (% of GNI)Education expenditure (% of GNI)Energy depletion (% of GNI)Mineral depletion (% of GNI)Net forest depletion (% of GNI)CO2 damage (% of GNI)Particulate emissions damage (% of GNI)Adjusted net savings (% of GNI)
80 2011 The Little Green Data Book
Country data
Sub-Saharan Africa group
Low-income group
Population (millions) 83 Land area (1,000 sq. km) 1,000 GDP ($ billions) 28.5
GNI per capita, World Bank Atlas method ($)Adjusted Net National Income per capita ($)Urban population (% of total)Urban population growth (average annual %, 1990-2009) AgricultureAgricultural land (% land area)Agricultural productivity, value added per worker (2000 $)Food production index (1999-2001=100)Population density, rural (people/ sq. km of arable land) Forests and biodiversityForest area (% land area)Deforestation (average annual %, 1990-2010)Nationally terrestrial protected area (% of land area)Threatened species, mammalsThreatened species, birdsThreatened species, fishThreatened species, higher plantsGEF benefits index for biodiversity (0-100, median is 1.5) EnergyGDP per unit of energy use (2005 PPP $/kg oil equivalent)Energy use per capita (kg oil equivalent)Energy from biomass products and waste (% of total)Electric power consumption per capita (kWh)Electricity generated using fossil fuel (% of total)Electricity generated by hydropower (% of total) Emissions and pollutionCO2 emissions per unit of GDP (kg/2005 PPP $)CO2 emissions per capita (metric tons)CO2 emissions growth (%, 1990–2007)Particulate matter (urban-pop.-weighted avg., μg/cu. m)Road sector energy use per capita (kg oil equivalent) Water and sanitationInternal freshwater resources per capita (cu. m)Freshwater withdrawal
Total (% of internal resources)Agriculture (% of total freshwater withdrawal)
Access to improved water source (% of total population)Rural (% of rural population)Urban (% of urban population)
Access to improved sanitation (% of total population)Rural (% of rural population)Urban (% of urban population)
Environment and healthAcute resp. infection prevalence (% of children under five)Diarrhea prevalence (% of children under five)Under-five mortality rate (per 1,000 live births) National accounting aggregates—savings, depletion and degradationGross savings (% of GNI)Consumption of fixed capital (% of GNI)Education expenditure (% of GNI)Energy depletion (% of GNI)Mineral depletion (% of GNI)Net forest depletion (% of GNI)CO2 damage (% of GNI)Particulate emissions damage (% of GNI)Adjusted net savings (% of GNI)
81The Little Green Data Book 2011
Country data
High-income group
Population (thousands) 49 Land area (1,000 sq. km) 1.4 GDP ($ billions) 2.2
.. 37,990
.. 31,46742.0 77.31.8 1.0
2 37.. 25,774
79 106947 331
.. 28.9
.. –0.1
.. 13.45080
0.3
.. 6.6
.. 5,131
.. 3.9
.. 9,518
.. 62.9
.. 11.3
.. 0.414.4 12.511.8 17.9
10 24.. 964
.. 9,031
.. 10.5
.. 42
.. 100
.. 98
.. 100
.. 99
.. 98
.. 100
..
..
.. 7
.. 16.1
.. 14.1
.. 4.6
.. 0.9
.. 0.1
.. 0.0
.. 0.2
.. 0.1
.. 5.2
Faeroe Islands
GNI per capita, World Bank Atlas method ($)Adjusted Net National Income per capita ($)Urban population (% of total)Urban population growth (average annual %, 1990-2009) AgricultureAgricultural land (% land area)Agricultural productivity, value added per worker (2000 $)Food production index (1999-2001=100)Population density, rural (people/ sq. km of arable land) Forests and biodiversityForest area (% land area)Deforestation (average annual %, 1990-2010)Nationally terrestrial protected area (% of land area)Threatened species, mammalsThreatened species, birdsThreatened species, fishThreatened species, higher plantsGEF benefits index for biodiversity (0-100, median is 1.5) EnergyGDP per unit of energy use (2005 PPP $/kg oil equivalent)Energy use per capita (kg oil equivalent)Energy from biomass products and waste (% of total)Electric power consumption per capita (kWh)Electricity generated using fossil fuel (% of total)Electricity generated by hydropower (% of total) Emissions and pollutionCO2 emissions per unit of GDP (kg/2005 PPP $)CO2 emissions per capita (metric tons)CO2 emissions growth (%, 1990–2007)Particulate matter (urban-pop.-weighted avg., μg/cu. m)Road sector energy use per capita (kg oil equivalent) Water and sanitationInternal freshwater resources per capita (cu. m)Freshwater withdrawal
Total (% of internal resources)Agriculture (% of total freshwater withdrawal)
Access to improved water source (% of total population)Rural (% of rural population)Urban (% of urban population)
Access to improved sanitation (% of total population)Rural (% of rural population)Urban (% of urban population)
Environment and healthAcute resp. infection prevalence (% of children under five)Diarrhea prevalence (% of children under five)Under-five mortality rate (per 1,000 live births) National accounting aggregates—savings, depletion and degradationGross savings (% of GNI)Consumption of fixed capital (% of GNI)Education expenditure (% of GNI)Energy depletion (% of GNI)Mineral depletion (% of GNI)Net forest depletion (% of GNI)CO2 damage (% of GNI)Particulate emissions damage (% of GNI)Adjusted net savings (% of GNI)
82 2011 The Little Green Data Book
Country data
East Asia & Pacific
group
Upper middle-income group
Population (thousands) 849 Land area (1,000 sq. km) 18 GDP ($ billions) 2.8
GNI per capita, World Bank Atlas method ($)Adjusted Net National Income per capita ($)Urban population (% of total)Urban population growth (average annual %, 1990-2009) AgricultureAgricultural land (% land area)Agricultural productivity, value added per worker (2000 $)Food production index (1999-2001=100)Population density, rural (people/ sq. km of arable land) Forests and biodiversityForest area (% land area)Deforestation (average annual %, 1990-2010)Nationally terrestrial protected area (% of land area)Threatened species, mammalsThreatened species, birdsThreatened species, fishThreatened species, higher plantsGEF benefits index for biodiversity (0-100, median is 1.5) EnergyGDP per unit of energy use (2005 PPP $/kg oil equivalent)Energy use per capita (kg oil equivalent)Energy from biomass products and waste (% of total)Electric power consumption per capita (kWh)Electricity generated using fossil fuel (% of total)Electricity generated by hydropower (% of total) Emissions and pollutionCO2 emissions per unit of GDP (kg/2005 PPP $)CO2 emissions per capita (metric tons)CO2 emissions growth (%, 1990–2007)Particulate matter (urban-pop.-weighted avg., μg/cu. m)Road sector energy use per capita (kg oil equivalent) Water and sanitationInternal freshwater resources per capita (cu. m)Freshwater withdrawal
Total (% of internal resources)Agriculture (% of total freshwater withdrawal)
Access to improved water source (% of total population)Rural (% of rural population)Urban (% of urban population)
Access to improved sanitation (% of total population)Rural (% of rural population)Urban (% of urban population)
Environment and healthAcute resp. infection prevalence (% of children under five)Diarrhea prevalence (% of children under five)Under-five mortality rate (per 1,000 live births) National accounting aggregates—savings, depletion and degradationGross savings (% of GNI)Consumption of fixed capital (% of GNI)Education expenditure (% of GNI)Energy depletion (% of GNI)Mineral depletion (% of GNI)Net forest depletion (% of GNI)CO2 damage (% of GNI)Particulate emissions damage (% of GNI)Adjusted net savings (% of GNI)
83The Little Green Data Book 2011
Country data
High-income group
Population (millions) 5.3 Land area (1,000 sq. km) 303.9 GDP ($ billions) 238.0
GNI per capita, World Bank Atlas method ($)Adjusted Net National Income per capita ($)Urban population (% of total)Urban population growth (average annual %, 1990-2009) AgricultureAgricultural land (% land area)Agricultural productivity, value added per worker (2000 $)Food production index (1999-2001=100)Population density, rural (people/ sq. km of arable land) Forests and biodiversityForest area (% land area)Deforestation (average annual %, 1990-2010)Nationally terrestrial protected area (% of land area)Threatened species, mammalsThreatened species, birdsThreatened species, fishThreatened species, higher plantsGEF benefits index for biodiversity (0-100, median is 1.5) EnergyGDP per unit of energy use (2005 PPP $/kg oil equivalent)Energy use per capita (kg oil equivalent)Energy from biomass products and waste (% of total)Electric power consumption per capita (kWh)Electricity generated using fossil fuel (% of total)Electricity generated by hydropower (% of total) Emissions and pollutionCO2 emissions per unit of GDP (kg/2005 PPP $)CO2 emissions per capita (metric tons)CO2 emissions growth (%, 1990–2007)Particulate matter (urban-pop.-weighted avg., μg/cu. m)Road sector energy use per capita (kg oil equivalent) Water and sanitationInternal freshwater resources per capita (cu. m)Freshwater withdrawal
Total (% of internal resources)Agriculture (% of total freshwater withdrawal)
Access to improved water source (% of total population)Rural (% of rural population)Urban (% of urban population)
Access to improved sanitation (% of total population)Rural (% of rural population)Urban (% of urban population)
Environment and healthAcute resp. infection prevalence (% of children under five)Diarrhea prevalence (% of children under five)Under-five mortality rate (per 1,000 live births) National accounting aggregates—savings, depletion and degradationGross savings (% of GNI)Consumption of fixed capital (% of GNI)Education expenditure (% of GNI)Energy depletion (% of GNI)Mineral depletion (% of GNI)Net forest depletion (% of GNI)CO2 damage (% of GNI)Particulate emissions damage (% of GNI)Adjusted net savings (% of GNI)
84 2011 The Little Green Data Book
Country data
High-income group
Population (millions)a 63 Land area (1,000 sq. km) 548 GDP ($ billions) 2,649.4
a. Excludes the French overseas departments of French Guiana, Guadeloupe, Martinique, and Réunion.
France
GNI per capita, World Bank Atlas method ($)Adjusted Net National Income per capita ($)Urban population (% of total)Urban population growth (average annual %, 1990-2009) AgricultureAgricultural land (% land area)Agricultural productivity, value added per worker (2000 $)Food production index (1999-2001=100)Population density, rural (people/ sq. km of arable land) Forests and biodiversityForest area (% land area)Deforestation (average annual %, 1990-2010)Nationally terrestrial protected area (% of land area)Threatened species, mammalsThreatened species, birdsThreatened species, fishThreatened species, higher plantsGEF benefits index for biodiversity (0-100, median is 1.5) EnergyGDP per unit of energy use (2005 PPP $/kg oil equivalent)Energy use per capita (kg oil equivalent)Energy from biomass products and waste (% of total)Electric power consumption per capita (kWh)Electricity generated using fossil fuel (% of total)Electricity generated by hydropower (% of total) Emissions and pollutionCO2 emissions per unit of GDP (kg/2005 PPP $)CO2 emissions per capita (metric tons)CO2 emissions growth (%, 1990–2007)Particulate matter (urban-pop.-weighted avg., μg/cu. m)Road sector energy use per capita (kg oil equivalent) Water and sanitationInternal freshwater resources per capita (cu. m)Freshwater withdrawal
Total (% of internal resources)Agriculture (% of total freshwater withdrawal)
Access to improved water source (% of total population)Rural (% of rural population)Urban (% of urban population)
Access to improved sanitation (% of total population)Rural (% of rural population)Urban (% of urban population)
Environment and healthAcute resp. infection prevalence (% of children under five)Diarrhea prevalence (% of children under five)Under-five mortality rate (per 1,000 live births) National accounting aggregates—savings, depletion and degradationGross savings (% of GNI)Consumption of fixed capital (% of GNI)Education expenditure (% of GNI)Energy depletion (% of GNI)Mineral depletion (% of GNI)Net forest depletion (% of GNI)CO2 damage (% of GNI)Particulate emissions damage (% of GNI)Adjusted net savings (% of GNI)
85The Little Green Data Book 2011
Country data
High-income group
Population (thousands) 269 Land area (1,000 sq. km) 4 GDP ($ millions) ..
.. 37,990
.. 31,46751.6 77.31.3 1.0
12 374,772 25,774
113 1064,283 331
42.3 28.9–3.5 –0.10.4 13.4
1322047
4.6
.. 6.6
.. 5,131
.. 3.9
.. 9,518
.. 62.9
.. 11.3
.. 0.43.1 12.5
27.9 17.9.. 24.. 964
38,120 9,031
.. 10.5
.. 42100 100100 98100 100
98 9997 9899 100
..
..
.. 7
.. 16.1
.. 14.1
.. 4.6
.. 0.9
.. 0.1
.. 0.0
.. 0.2
.. 0.1
.. 5.2
French Polynesia
GNI per capita, World Bank Atlas method ($)Adjusted Net National Income per capita ($)Urban population (% of total)Urban population growth (average annual %, 1990-2009) AgricultureAgricultural land (% land area)Agricultural productivity, value added per worker (2000 $)Food production index (1999-2001=100)Population density, rural (people/ sq. km of arable land) Forests and biodiversityForest area (% land area)Deforestation (average annual %, 1990-2010)Nationally terrestrial protected area (% of land area)Threatened species, mammalsThreatened species, birdsThreatened species, fishThreatened species, higher plantsGEF benefits index for biodiversity (0-100, median is 1.5) EnergyGDP per unit of energy use (2005 PPP $/kg oil equivalent)Energy use per capita (kg oil equivalent)Energy from biomass products and waste (% of total)Electric power consumption per capita (kWh)Electricity generated using fossil fuel (% of total)Electricity generated by hydropower (% of total) Emissions and pollutionCO2 emissions per unit of GDP (kg/2005 PPP $)CO2 emissions per capita (metric tons)CO2 emissions growth (%, 1990–2007)Particulate matter (urban-pop.-weighted avg., μg/cu. m)Road sector energy use per capita (kg oil equivalent) Water and sanitationInternal freshwater resources per capita (cu. m)Freshwater withdrawal
Total (% of internal resources)Agriculture (% of total freshwater withdrawal)
Access to improved water source (% of total population)Rural (% of rural population)Urban (% of urban population)
Access to improved sanitation (% of total population)Rural (% of rural population)Urban (% of urban population)
Environment and healthAcute resp. infection prevalence (% of children under five)Diarrhea prevalence (% of children under five)Under-five mortality rate (per 1,000 live births) National accounting aggregates—savings, depletion and degradationGross savings (% of GNI)Consumption of fixed capital (% of GNI)Education expenditure (% of GNI)Energy depletion (% of GNI)Mineral depletion (% of GNI)Net forest depletion (% of GNI)CO2 damage (% of GNI)Particulate emissions damage (% of GNI)Adjusted net savings (% of GNI)
86 2011 The Little Green Data Book
Country data
Sub-Saharan Africa group
Upper middle-income group
Population (millions) 1.5 Land area (1,000 sq. km) 257.7 GDP ($ billions) 11.1
GNI per capita, World Bank Atlas method ($)Adjusted Net National Income per capita ($)Urban population (% of total)Urban population growth (average annual %, 1990-2009) AgricultureAgricultural land (% land area)Agricultural productivity, value added per worker (2000 $)Food production index (1999-2001=100)Population density, rural (people/ sq. km of arable land) Forests and biodiversityForest area (% land area)Deforestation (average annual %, 1990-2010)Nationally terrestrial protected area (% of land area)Threatened species, mammalsThreatened species, birdsThreatened species, fishThreatened species, higher plantsGEF benefits index for biodiversity (0-100, median is 1.5) EnergyGDP per unit of energy use (2005 PPP $/kg oil equivalent)Energy use per capita (kg oil equivalent)Energy from biomass products and waste (% of total)Electric power consumption per capita (kWh)Electricity generated using fossil fuel (% of total)Electricity generated by hydropower (% of total) Emissions and pollutionCO2 emissions per unit of GDP (kg/2005 PPP $)CO2 emissions per capita (metric tons)CO2 emissions growth (%, 1990–2007)Particulate matter (urban-pop.-weighted avg., μg/cu. m)Road sector energy use per capita (kg oil equivalent) Water and sanitationInternal freshwater resources per capita (cu. m)Freshwater withdrawal
Total (% of internal resources)Agriculture (% of total freshwater withdrawal)
Access to improved water source (% of total population)Rural (% of rural population)Urban (% of urban population)
Access to improved sanitation (% of total population)Rural (% of rural population)Urban (% of urban population)
Environment and healthAcute resp. infection prevalence (% of children under five)Diarrhea prevalence (% of children under five)Under-five mortality rate (per 1,000 live births) National accounting aggregates—savings, depletion and degradationGross savings (% of GNI)Consumption of fixed capital (% of GNI)Education expenditure (% of GNI)Energy depletion (% of GNI)Mineral depletion (% of GNI)Net forest depletion (% of GNI)CO2 damage (% of GNI)Particulate emissions damage (% of GNI)Adjusted net savings (% of GNI)
87The Little Green Data Book 2011
Country data
Sub-Saharan Africa group
Low-income group
Population (millions) 1.7 Land area (1,000 sq. km) 10 GDP ($ millions) 733
GNI per capita, World Bank Atlas method ($)Adjusted Net National Income per capita ($)Urban population (% of total)Urban population growth (average annual %, 1990-2009) AgricultureAgricultural land (% land area)Agricultural productivity, value added per worker (2000 $)Food production index (1999-2001=100)Population density, rural (people/ sq. km of arable land) Forests and biodiversityForest area (% land area)Deforestation (average annual %, 1990-2010)Nationally terrestrial protected area (% of land area)Threatened species, mammalsThreatened species, birdsThreatened species, fishThreatened species, higher plantsGEF benefits index for biodiversity (0-100, median is 1.5) EnergyGDP per unit of energy use (2005 PPP $/kg oil equivalent)Energy use per capita (kg oil equivalent)Energy from biomass products and waste (% of total)Electric power consumption per capita (kWh)Electricity generated using fossil fuel (% of total)Electricity generated by hydropower (% of total) Emissions and pollutionCO2 emissions per unit of GDP (kg/2005 PPP $)CO2 emissions per capita (metric tons)CO2 emissions growth (%, 1990–2007)Particulate matter (urban-pop.-weighted avg., μg/cu. m)Road sector energy use per capita (kg oil equivalent) Water and sanitationInternal freshwater resources per capita (cu. m)Freshwater withdrawal
Total (% of internal resources)Agriculture (% of total freshwater withdrawal)
Access to improved water source (% of total population)Rural (% of rural population)Urban (% of urban population)
Access to improved sanitation (% of total population)Rural (% of rural population)Urban (% of urban population)
Environment and healthAcute resp. infection prevalence (% of children under five)Diarrhea prevalence (% of children under five)Under-five mortality rate (per 1,000 live births) National accounting aggregates—savings, depletion and degradationGross savings (% of GNI)Consumption of fixed capital (% of GNI)Education expenditure (% of GNI)Energy depletion (% of GNI)Mineral depletion (% of GNI)Net forest depletion (% of GNI)CO2 damage (% of GNI)Particulate emissions damage (% of GNI)Adjusted net savings (% of GNI)
88 2011 The Little Green Data Book
Country data
Europe & Central
Asia group
Lower middle-income group
Population (millions) 4.3 Land area (1,000 sq. km) 69.5 GDP ($ billions) 10.7
GNI per capita, World Bank Atlas method ($)Adjusted Net National Income per capita ($)Urban population (% of total)Urban population growth (average annual %, 1990-2009) AgricultureAgricultural land (% land area)Agricultural productivity, value added per worker (2000 $)Food production index (1999-2001=100)Population density, rural (people/ sq. km of arable land) Forests and biodiversityForest area (% land area)Deforestation (average annual %, 1990-2010)Nationally terrestrial protected area (% of land area)Threatened species, mammalsThreatened species, birdsThreatened species, fishThreatened species, higher plantsGEF benefits index for biodiversity (0-100, median is 1.5) EnergyGDP per unit of energy use (2005 PPP $/kg oil equivalent)Energy use per capita (kg oil equivalent)Energy from biomass products and waste (% of total)Electric power consumption per capita (kWh)Electricity generated using fossil fuel (% of total)Electricity generated by hydropower (% of total) Emissions and pollutionCO2 emissions per unit of GDP (kg/2005 PPP $)CO2 emissions per capita (metric tons)CO2 emissions growth (%, 1990–2007)Particulate matter (urban-pop.-weighted avg., μg/cu. m)Road sector energy use per capita (kg oil equivalent) Water and sanitationInternal freshwater resources per capita (cu. m)Freshwater withdrawal
Total (% of internal resources)Agriculture (% of total freshwater withdrawal)
Access to improved water source (% of total population)Rural (% of rural population)Urban (% of urban population)
Access to improved sanitation (% of total population)Rural (% of rural population)Urban (% of urban population)
Environment and healthAcute resp. infection prevalence (% of children under five)Diarrhea prevalence (% of children under five)Under-five mortality rate (per 1,000 live births) National accounting aggregates—savings, depletion and degradationGross savings (% of GNI)Consumption of fixed capital (% of GNI)Education expenditure (% of GNI)Energy depletion (% of GNI)Mineral depletion (% of GNI)Net forest depletion (% of GNI)CO2 damage (% of GNI)Particulate emissions damage (% of GNI)Adjusted net savings (% of GNI)
89The Little Green Data Book 2011
Country data
High-income group
Population (millions) 82 Land area (1,000 sq. km) 349 GDP ($ billions) 3,330.0
42,450 37,99035,503 31,467
73.7 77.30.2 1.0
49 3727,855 25,774
103 106181 331
31.8 28.9–0.1 –0.140.5 13.4
66
21120.6
8.3 6.64,083 5,131
7.0 3.97,149 9,51861.4 62.93.3 11.3
0.3 0.49.6 12.5
.. 17.916 24
609 964
1,301 9,031
36.6 10.53 42
100 100100 98100 100100 99100 98100 100
..
..4 7
21.2 16.113.8 14.1
4.3 4.60.1 0.90.0 0.10.0 0.00.2 0.20.0 0.1
11.4 5.2
Germany
GNI per capita, World Bank Atlas method ($)Adjusted Net National Income per capita ($)Urban population (% of total)Urban population growth (average annual %, 1990-2009) AgricultureAgricultural land (% land area)Agricultural productivity, value added per worker (2000 $)Food production index (1999-2001=100)Population density, rural (people/ sq. km of arable land) Forests and biodiversityForest area (% land area)Deforestation (average annual %, 1990-2010)Nationally terrestrial protected area (% of land area)Threatened species, mammalsThreatened species, birdsThreatened species, fishThreatened species, higher plantsGEF benefits index for biodiversity (0-100, median is 1.5) EnergyGDP per unit of energy use (2005 PPP $/kg oil equivalent)Energy use per capita (kg oil equivalent)Energy from biomass products and waste (% of total)Electric power consumption per capita (kWh)Electricity generated using fossil fuel (% of total)Electricity generated by hydropower (% of total) Emissions and pollutionCO2 emissions per unit of GDP (kg/2005 PPP $)CO2 emissions per capita (metric tons)CO2 emissions growth (%, 1990–2007)Particulate matter (urban-pop.-weighted avg., μg/cu. m)Road sector energy use per capita (kg oil equivalent) Water and sanitationInternal freshwater resources per capita (cu. m)Freshwater withdrawal
Total (% of internal resources)Agriculture (% of total freshwater withdrawal)
Access to improved water source (% of total population)Rural (% of rural population)Urban (% of urban population)
Access to improved sanitation (% of total population)Rural (% of rural population)Urban (% of urban population)
Environment and healthAcute resp. infection prevalence (% of children under five)Diarrhea prevalence (% of children under five)Under-five mortality rate (per 1,000 live births) National accounting aggregates—savings, depletion and degradationGross savings (% of GNI)Consumption of fixed capital (% of GNI)Education expenditure (% of GNI)Energy depletion (% of GNI)Mineral depletion (% of GNI)Net forest depletion (% of GNI)CO2 damage (% of GNI)Particulate emissions damage (% of GNI)Adjusted net savings (% of GNI)
90 2011 The Little Green Data Book
Country data
Sub-Saharan Africa group
Low-income group
Population (millions) 24 Land area (1,000 sq. km) 228 GDP ($ billions) 26.2
GNI per capita, World Bank Atlas method ($)Adjusted Net National Income per capita ($)Urban population (% of total)Urban population growth (average annual %, 1990-2009) AgricultureAgricultural land (% land area)Agricultural productivity, value added per worker (2000 $)Food production index (1999-2001=100)Population density, rural (people/ sq. km of arable land) Forests and biodiversityForest area (% land area)Deforestation (average annual %, 1990-2010)Nationally terrestrial protected area (% of land area)Threatened species, mammalsThreatened species, birdsThreatened species, fishThreatened species, higher plantsGEF benefits index for biodiversity (0-100, median is 1.5) EnergyGDP per unit of energy use (2005 PPP $/kg oil equivalent)Energy use per capita (kg oil equivalent)Energy from biomass products and waste (% of total)Electric power consumption per capita (kWh)Electricity generated using fossil fuel (% of total)Electricity generated by hydropower (% of total) Emissions and pollutionCO2 emissions per unit of GDP (kg/2005 PPP $)CO2 emissions per capita (metric tons)CO2 emissions growth (%, 1990–2007)Particulate matter (urban-pop.-weighted avg., μg/cu. m)Road sector energy use per capita (kg oil equivalent) Water and sanitationInternal freshwater resources per capita (cu. m)Freshwater withdrawal
Total (% of internal resources)Agriculture (% of total freshwater withdrawal)
Access to improved water source (% of total population)Rural (% of rural population)Urban (% of urban population)
Access to improved sanitation (% of total population)Rural (% of rural population)Urban (% of urban population)
Environment and healthAcute resp. infection prevalence (% of children under five)Diarrhea prevalence (% of children under five)Under-five mortality rate (per 1,000 live births) National accounting aggregates—savings, depletion and degradationGross savings (% of GNI)Consumption of fixed capital (% of GNI)Education expenditure (% of GNI)Energy depletion (% of GNI)Mineral depletion (% of GNI)Net forest depletion (% of GNI)CO2 damage (% of GNI)Particulate emissions damage (% of GNI)Adjusted net savings (% of GNI)
91The Little Green Data Book 2011
Population (thousands) 31 Land area (sq. km) 10 GDP ($ billions) ..
Country data
High-income group
.. 37,990
.. 31,467100.0 77.3
0.0 1.0
.. 37
.. 25,774
.. 1060 331
0.0 28.90.0 –0.14.7 13.4
53
120
0.0
.. 6.65,124 5,131
0.0 3.95,349 9,518100.0 62.9
0.0 11.3
.. 0.413.1 12.58.5 17.9
.. 243 964
.. 9,031
.. 10.5
.. 42
.. 100
.. 98
.. 100
.. 99
.. 98
.. 100
..
..
.. 7
.. 16.1
.. 14.1
.. 4.6
.. 0.9
.. 0.1
.. 0.0
.. 0.2
.. 0.1
.. 5.2
Gibraltar
GNI per capita, World Bank Atlas method ($)Adjusted Net National Income per capita ($)Urban population (% of total)Urban population growth (average annual %, 1990-2009) AgricultureAgricultural land (% land area)Agricultural productivity, value added per worker (2000 $)Food production index (1999-2001=100)Population density, rural (people/ sq. km of arable land) Forests and biodiversityForest area (% land area)Deforestation (average annual %, 1990-2010)Nationally terrestrial protected area (% of land area)Threatened species, mammalsThreatened species, birdsThreatened species, fishThreatened species, higher plantsGEF benefits index for biodiversity (0-100, median is 1.5) EnergyGDP per unit of energy use (2005 PPP $/kg oil equivalent)Energy use per capita (kg oil equivalent)Energy from biomass products and waste (% of total)Electric power consumption per capita (kWh)Electricity generated using fossil fuel (% of total)Electricity generated by hydropower (% of total) Emissions and pollutionCO2 emissions per unit of GDP (kg/2005 PPP $)CO2 emissions per capita (metric tons)CO2 emissions growth (%, 1990–2007)Particulate matter (urban-pop.-weighted avg., μg/cu. m)Road sector energy use per capita (kg oil equivalent) Water and sanitationInternal freshwater resources per capita (cu. m)Freshwater withdrawal
Total (% of internal resources)Agriculture (% of total freshwater withdrawal)
Access to improved water source (% of total population)Rural (% of rural population)Urban (% of urban population)
Access to improved sanitation (% of total population)Rural (% of rural population)Urban (% of urban population)
Environment and healthAcute resp. infection prevalence (% of children under five)Diarrhea prevalence (% of children under five)Under-five mortality rate (per 1,000 live births) National accounting aggregates—savings, depletion and degradationGross savings (% of GNI)Consumption of fixed capital (% of GNI)Education expenditure (% of GNI)Energy depletion (% of GNI)Mineral depletion (% of GNI)Net forest depletion (% of GNI)CO2 damage (% of GNI)Particulate emissions damage (% of GNI)Adjusted net savings (% of GNI)
92 2011 The Little Green Data Book
Population (millions) 11 Land area (1,000 sq. km) 129 GDP ($ billions) 329.9
Country data
High-income group
29,040 37,99024,430 31,467
61.2 77.30.8 1.0
36 379,524 25,774
83 106209 331
30.3 28.9–0.6 –0.113.8 13.4
10117313
2.8
10.0 6.62,707 5,131
3.4 3.95,723 9,51890.8 62.9
5.3 11.3
0.3 0.48.8 12.5
34.9 17.932 24
581 964
5,182 9,031
12.2 10.588 42
100 10099 98
100 10098 9997 9899 100
..
..3 7
3.4 16.113.9 14.1
3.3 4.60.1 0.90.0 0.10.0 0.00.2 0.20.3 0.1
–7.9 5.2
Greece
GNI per capita, World Bank Atlas method ($)Adjusted Net National Income per capita ($)Urban population (% of total)Urban population growth (average annual %, 1990-2009) AgricultureAgricultural land (% land area)Agricultural productivity, value added per worker (2000 $)Food production index (1999-2001=100)Population density, rural (people/ sq. km of arable land) Forests and biodiversityForest area (% land area)Deforestation (average annual %, 1990-2010)Nationally terrestrial protected area (% of land area)Threatened species, mammalsThreatened species, birdsThreatened species, fishThreatened species, higher plantsGEF benefits index for biodiversity (0-100, median is 1.5) EnergyGDP per unit of energy use (2005 PPP $/kg oil equivalent)Energy use per capita (kg oil equivalent)Energy from biomass products and waste (% of total)Electric power consumption per capita (kWh)Electricity generated using fossil fuel (% of total)Electricity generated by hydropower (% of total) Emissions and pollutionCO2 emissions per unit of GDP (kg/2005 PPP $)CO2 emissions per capita (metric tons)CO2 emissions growth (%, 1990–2007)Particulate matter (urban-pop.-weighted avg., μg/cu. m)Road sector energy use per capita (kg oil equivalent) Water and sanitationInternal freshwater resources per capita (cu. m)Freshwater withdrawal
Total (% of internal resources)Agriculture (% of total freshwater withdrawal)
Access to improved water source (% of total population)Rural (% of rural population)Urban (% of urban population)
Access to improved sanitation (% of total population)Rural (% of rural population)Urban (% of urban population)
Environment and healthAcute resp. infection prevalence (% of children under five)Diarrhea prevalence (% of children under five)Under-five mortality rate (per 1,000 live births) National accounting aggregates—savings, depletion and degradationGross savings (% of GNI)Consumption of fixed capital (% of GNI)Education expenditure (% of GNI)Energy depletion (% of GNI)Mineral depletion (% of GNI)Net forest depletion (% of GNI)CO2 damage (% of GNI)Particulate emissions damage (% of GNI)Adjusted net savings (% of GNI)
93The Little Green Data Book 2011
Country data
High-income group
Population (thousands) 56 Land area (1,000 sq. km) 410 GDP ($ billions) 1.3
26,160 37,990.. 31,467
83.8 77.30.3 1.0
1 37.. 25,774
99 106.. 331
.. 28.9
.. –0.140.5 13.4
6071
1.1
.. 6.6
.. 5,131
.. 3.9
.. 9,518
.. 62.9
.. 11.3
.. 0.49.2 12.5
–6.6 17.9.. 24.. 964
10,662,187 9,031
.. 10.5
.. 42
.. 100
.. 98
.. 100
.. 99
.. 98
.. 100
..
..
.. 7
.. 16.1
.. 14.1
.. 4.60.0 0.90.0 0.1
.. 0.00.3 0.2
.. 0.1
.. 5.2
Greenland
GNI per capita, World Bank Atlas method ($)Adjusted Net National Income per capita ($)Urban population (% of total)Urban population growth (average annual %, 1990-2009) AgricultureAgricultural land (% land area)Agricultural productivity, value added per worker (2000 $)Food production index (1999-2001=100)Population density, rural (people/ sq. km of arable land) Forests and biodiversityForest area (% land area)Deforestation (average annual %, 1990-2010)Nationally terrestrial protected area (% of land area)Threatened species, mammalsThreatened species, birdsThreatened species, fishThreatened species, higher plantsGEF benefits index for biodiversity (0-100, median is 1.5) EnergyGDP per unit of energy use (2005 PPP $/kg oil equivalent)Energy use per capita (kg oil equivalent)Energy from biomass products and waste (% of total)Electric power consumption per capita (kWh)Electricity generated using fossil fuel (% of total)Electricity generated by hydropower (% of total) Emissions and pollutionCO2 emissions per unit of GDP (kg/2005 PPP $)CO2 emissions per capita (metric tons)CO2 emissions growth (%, 1990–2007)Particulate matter (urban-pop.-weighted avg., μg/cu. m)Road sector energy use per capita (kg oil equivalent) Water and sanitationInternal freshwater resources per capita (cu. m)Freshwater withdrawal
Total (% of internal resources)Agriculture (% of total freshwater withdrawal)
Access to improved water source (% of total population)Rural (% of rural population)Urban (% of urban population)
Access to improved sanitation (% of total population)Rural (% of rural population)Urban (% of urban population)
Environment and healthAcute resp. infection prevalence (% of children under five)Diarrhea prevalence (% of children under five)Under-five mortality rate (per 1,000 live births) National accounting aggregates—savings, depletion and degradationGross savings (% of GNI)Consumption of fixed capital (% of GNI)Education expenditure (% of GNI)Energy depletion (% of GNI)Mineral depletion (% of GNI)Net forest depletion (% of GNI)CO2 damage (% of GNI)Particulate emissions damage (% of GNI)Adjusted net savings (% of GNI)
94 2011 The Little Green Data Book
Country data
Latin America & Caribbean
group
Upper middle-income group
Population (thousands) 104 Land area (1,000 sq. km) 0.3 GDP ($ millions) 627
GNI per capita, World Bank Atlas method ($)Adjusted Net National Income per capita ($)Urban population (% of total)Urban population growth (average annual %, 1990-2009) AgricultureAgricultural land (% land area)Agricultural productivity, value added per worker (2000 $)Food production index (1999-2001=100)Population density, rural (people/ sq. km of arable land) Forests and biodiversityForest area (% land area)Deforestation (average annual %, 1990-2010)Nationally terrestrial protected area (% of land area)Threatened species, mammalsThreatened species, birdsThreatened species, fishThreatened species, higher plantsGEF benefits index for biodiversity (0-100, median is 1.5) EnergyGDP per unit of energy use (2005 PPP $/kg oil equivalent)Energy use per capita (kg oil equivalent)Energy from biomass products and waste (% of total)Electric power consumption per capita (kWh)Electricity generated using fossil fuel (% of total)Electricity generated by hydropower (% of total) Emissions and pollutionCO2 emissions per unit of GDP (kg/2005 PPP $)CO2 emissions per capita (metric tons)CO2 emissions growth (%, 1990–2007)Particulate matter (urban-pop.-weighted avg., μg/cu. m)Road sector energy use per capita (kg oil equivalent) Water and sanitationInternal freshwater resources per capita (cu. m)Freshwater withdrawal
Total (% of internal resources)Agriculture (% of total freshwater withdrawal)
Access to improved water source (% of total population)Rural (% of rural population)Urban (% of urban population)
Access to improved sanitation (% of total population)Rural (% of rural population)Urban (% of urban population)
Environment and healthAcute resp. infection prevalence (% of children under five)Diarrhea prevalence (% of children under five)Under-five mortality rate (per 1,000 live births) National accounting aggregates—savings, depletion and degradationGross savings (% of GNI)Consumption of fixed capital (% of GNI)Education expenditure (% of GNI)Energy depletion (% of GNI)Mineral depletion (% of GNI)Net forest depletion (% of GNI)CO2 damage (% of GNI)Particulate emissions damage (% of GNI)Adjusted net savings (% of GNI)
95The Little Green Data Book 2011
Country data
High-income group
Population (thousands) 178 Land area (1,000 sq. km) 0.5 GDP ($ millions) ..
.. 37,990
.. 31,46793.2 77.3
1.6 1.0
35 37.. 25,774
109 1061,201 331
48.1 28.90.0 –0.1
26.4 13.42
1464
0.2
.. 6.6
.. 5,131
.. 3.9
.. 9,518
.. 62.9
.. 11.3
.. 0.4
.. 12.5
.. 17.9
.. 24
.. 964
.. 9,031
.. 10.5
.. 42100 100100 98100 10099 9998 9899 100
..
..
.. 7
.. 16.1
.. 14.1
.. 4.6
.. 0.9
.. 0.1
.. 0.0
.. 0.2
.. 0.1
.. 5.2
Guam
GNI per capita, World Bank Atlas method ($)Adjusted Net National Income per capita ($)Urban population (% of total)Urban population growth (average annual %, 1990-2009) AgricultureAgricultural land (% land area)Agricultural productivity, value added per worker (2000 $)Food production index (1999-2001=100)Population density, rural (people/ sq. km of arable land) Forests and biodiversityForest area (% land area)Deforestation (average annual %, 1990-2010)Nationally terrestrial protected area (% of land area)Threatened species, mammalsThreatened species, birdsThreatened species, fishThreatened species, higher plantsGEF benefits index for biodiversity (0-100, median is 1.5) EnergyGDP per unit of energy use (2005 PPP $/kg oil equivalent)Energy use per capita (kg oil equivalent)Energy from biomass products and waste (% of total)Electric power consumption per capita (kWh)Electricity generated using fossil fuel (% of total)Electricity generated by hydropower (% of total) Emissions and pollutionCO2 emissions per unit of GDP (kg/2005 PPP $)CO2 emissions per capita (metric tons)CO2 emissions growth (%, 1990–2007)Particulate matter (urban-pop.-weighted avg., μg/cu. m)Road sector energy use per capita (kg oil equivalent) Water and sanitationInternal freshwater resources per capita (cu. m)Freshwater withdrawal
Total (% of internal resources)Agriculture (% of total freshwater withdrawal)
Access to improved water source (% of total population)Rural (% of rural population)Urban (% of urban population)
Access to improved sanitation (% of total population)Rural (% of rural population)Urban (% of urban population)
Environment and healthAcute resp. infection prevalence (% of children under five)Diarrhea prevalence (% of children under five)Under-five mortality rate (per 1,000 live births) National accounting aggregates—savings, depletion and degradationGross savings (% of GNI)Consumption of fixed capital (% of GNI)Education expenditure (% of GNI)Energy depletion (% of GNI)Mineral depletion (% of GNI)Net forest depletion (% of GNI)CO2 damage (% of GNI)Particulate emissions damage (% of GNI)Adjusted net savings (% of GNI)
Population (millions) 14 Land area (1,000 sq. km) 107 GDP ($ billions) 37.3
Guatemala
GNI per capita, World Bank Atlas method ($)Adjusted Net National Income per capita ($)Urban population (% of total)Urban population growth (average annual %, 1990-2009) AgricultureAgricultural land (% land area)Agricultural productivity, value added per worker (2000 $)Food production index (1999-2001=100)Population density, rural (people/ sq. km of arable land) Forests and biodiversityForest area (% land area)Deforestation (average annual %, 1990-2010)Nationally terrestrial protected area (% of land area)Threatened species, mammalsThreatened species, birdsThreatened species, fishThreatened species, higher plantsGEF benefits index for biodiversity (0-100, median is 1.5) EnergyGDP per unit of energy use (2005 PPP $/kg oil equivalent)Energy use per capita (kg oil equivalent)Energy from biomass products and waste (% of total)Electric power consumption per capita (kWh)Electricity generated using fossil fuel (% of total)Electricity generated by hydropower (% of total) Emissions and pollutionCO2 emissions per unit of GDP (kg/2005 PPP $)CO2 emissions per capita (metric tons)CO2 emissions growth (%, 1990–2007)Particulate matter (urban-pop.-weighted avg., μg/cu. m)Road sector energy use per capita (kg oil equivalent) Water and sanitationInternal freshwater resources per capita (cu. m)Freshwater withdrawal
Total (% of internal resources)Agriculture (% of total freshwater withdrawal)
Access to improved water source (% of total population)Rural (% of rural population)Urban (% of urban population)
Access to improved sanitation (% of total population)Rural (% of rural population)Urban (% of urban population)
Environment and healthAcute resp. infection prevalence (% of children under five)Diarrhea prevalence (% of children under five)Under-five mortality rate (per 1,000 live births) National accounting aggregates—savings, depletion and degradationGross savings (% of GNI)Consumption of fixed capital (% of GNI)Education expenditure (% of GNI)Energy depletion (% of GNI)Mineral depletion (% of GNI)Net forest depletion (% of GNI)CO2 damage (% of GNI)Particulate emissions damage (% of GNI)Adjusted net savings (% of GNI)
97The Little Green Data Book 2011
Population (millions) 10 Land area (1,000 sq. km) 246 GDP ($ billions) 4.1
GNI per capita, World Bank Atlas method ($)Adjusted Net National Income per capita ($)Urban population (% of total)Urban population growth (average annual %, 1990-2009) AgricultureAgricultural land (% land area)Agricultural productivity, value added per worker (2000 $)Food production index (1999-2001=100)Population density, rural (people/ sq. km of arable land) Forests and biodiversityForest area (% land area)Deforestation (average annual %, 1990-2010)Nationally terrestrial protected area (% of land area)Threatened species, mammalsThreatened species, birdsThreatened species, fishThreatened species, higher plantsGEF benefits index for biodiversity (0-100, median is 1.5) EnergyGDP per unit of energy use (2005 PPP $/kg oil equivalent)Energy use per capita (kg oil equivalent)Energy from biomass products and waste (% of total)Electric power consumption per capita (kWh)Electricity generated using fossil fuel (% of total)Electricity generated by hydropower (% of total) Emissions and pollutionCO2 emissions per unit of GDP (kg/2005 PPP $)CO2 emissions per capita (metric tons)CO2 emissions growth (%, 1990–2007)Particulate matter (urban-pop.-weighted avg., μg/cu. m)Road sector energy use per capita (kg oil equivalent) Water and sanitationInternal freshwater resources per capita (cu. m)Freshwater withdrawal
Total (% of internal resources)Agriculture (% of total freshwater withdrawal)
Access to improved water source (% of total population)Rural (% of rural population)Urban (% of urban population)
Access to improved sanitation (% of total population)Rural (% of rural population)Urban (% of urban population)
Environment and healthAcute resp. infection prevalence (% of children under five)Diarrhea prevalence (% of children under five)Under-five mortality rate (per 1,000 live births) National accounting aggregates—savings, depletion and degradationGross savings (% of GNI)Consumption of fixed capital (% of GNI)Education expenditure (% of GNI)Energy depletion (% of GNI)Mineral depletion (% of GNI)Net forest depletion (% of GNI)CO2 damage (% of GNI)Particulate emissions damage (% of GNI)Adjusted net savings (% of GNI)
98 2011 The Little Green Data Book
Population (millions) 1.6 Land area (1,000 sq. km) 28.1 GDP ($ millions) 837
GNI per capita, World Bank Atlas method ($)Adjusted Net National Income per capita ($)Urban population (% of total)Urban population growth (average annual %, 1990-2009) AgricultureAgricultural land (% land area)Agricultural productivity, value added per worker (2000 $)Food production index (1999-2001=100)Population density, rural (people/ sq. km of arable land) Forests and biodiversityForest area (% land area)Deforestation (average annual %, 1990-2010)Nationally terrestrial protected area (% of land area)Threatened species, mammalsThreatened species, birdsThreatened species, fishThreatened species, higher plantsGEF benefits index for biodiversity (0-100, median is 1.5) EnergyGDP per unit of energy use (2005 PPP $/kg oil equivalent)Energy use per capita (kg oil equivalent)Energy from biomass products and waste (% of total)Electric power consumption per capita (kWh)Electricity generated using fossil fuel (% of total)Electricity generated by hydropower (% of total) Emissions and pollutionCO2 emissions per unit of GDP (kg/2005 PPP $)CO2 emissions per capita (metric tons)CO2 emissions growth (%, 1990–2007)Particulate matter (urban-pop.-weighted avg., μg/cu. m)Road sector energy use per capita (kg oil equivalent) Water and sanitationInternal freshwater resources per capita (cu. m)Freshwater withdrawal
Total (% of internal resources)Agriculture (% of total freshwater withdrawal)
Access to improved water source (% of total population)Rural (% of rural population)Urban (% of urban population)
Access to improved sanitation (% of total population)Rural (% of rural population)Urban (% of urban population)
Environment and healthAcute resp. infection prevalence (% of children under five)Diarrhea prevalence (% of children under five)Under-five mortality rate (per 1,000 live births) National accounting aggregates—savings, depletion and degradationGross savings (% of GNI)Consumption of fixed capital (% of GNI)Education expenditure (% of GNI)Energy depletion (% of GNI)Mineral depletion (% of GNI)Net forest depletion (% of GNI)CO2 damage (% of GNI)Particulate emissions damage (% of GNI)Adjusted net savings (% of GNI)
99The Little Green Data Book 2011
Country data
Latin America & Caribbean
group
Lower middle-income group
Population (thousands) 762 Land area (1,000 sq. km) 197 GDP ($ billions) 2.0
GNI per capita, World Bank Atlas method ($)Adjusted Net National Income per capita ($)Urban population (% of total)Urban population growth (average annual %, 1990-2009) AgricultureAgricultural land (% land area)Agricultural productivity, value added per worker (2000 $)Food production index (1999-2001=100)Population density, rural (people/ sq. km of arable land) Forests and biodiversityForest area (% land area)Deforestation (average annual %, 1990-2010)Nationally terrestrial protected area (% of land area)Threatened species, mammalsThreatened species, birdsThreatened species, fishThreatened species, higher plantsGEF benefits index for biodiversity (0-100, median is 1.5) EnergyGDP per unit of energy use (2005 PPP $/kg oil equivalent)Energy use per capita (kg oil equivalent)Energy from biomass products and waste (% of total)Electric power consumption per capita (kWh)Electricity generated using fossil fuel (% of total)Electricity generated by hydropower (% of total) Emissions and pollutionCO2 emissions per unit of GDP (kg/2005 PPP $)CO2 emissions per capita (metric tons)CO2 emissions growth (%, 1990–2007)Particulate matter (urban-pop.-weighted avg., μg/cu. m)Road sector energy use per capita (kg oil equivalent) Water and sanitationInternal freshwater resources per capita (cu. m)Freshwater withdrawal
Total (% of internal resources)Agriculture (% of total freshwater withdrawal)
Access to improved water source (% of total population)Rural (% of rural population)Urban (% of urban population)
Access to improved sanitation (% of total population)Rural (% of rural population)Urban (% of urban population)
Environment and healthAcute resp. infection prevalence (% of children under five)Diarrhea prevalence (% of children under five)Under-five mortality rate (per 1,000 live births) National accounting aggregates—savings, depletion and degradationGross savings (% of GNI)Consumption of fixed capital (% of GNI)Education expenditure (% of GNI)Energy depletion (% of GNI)Mineral depletion (% of GNI)Net forest depletion (% of GNI)CO2 damage (% of GNI)Particulate emissions damage (% of GNI)Adjusted net savings (% of GNI)
100 2011 The Little Green Data Book
Country data
Latin America & Caribbean
group
Low-income group
Population (millions) 10 Land area (1,000 sq. km) 28 GDP ($ billions) 6.5
GNI per capita, World Bank Atlas method ($)Adjusted Net National Income per capita ($)Urban population (% of total)Urban population growth (average annual %, 1990-2009) AgricultureAgricultural land (% land area)Agricultural productivity, value added per worker (2000 $)Food production index (1999-2001=100)Population density, rural (people/ sq. km of arable land) Forests and biodiversityForest area (% land area)Deforestation (average annual %, 1990-2010)Nationally terrestrial protected area (% of land area)Threatened species, mammalsThreatened species, birdsThreatened species, fishThreatened species, higher plantsGEF benefits index for biodiversity (0-100, median is 1.5) EnergyGDP per unit of energy use (2005 PPP $/kg oil equivalent)Energy use per capita (kg oil equivalent)Energy from biomass products and waste (% of total)Electric power consumption per capita (kWh)Electricity generated using fossil fuel (% of total)Electricity generated by hydropower (% of total) Emissions and pollutionCO2 emissions per unit of GDP (kg/2005 PPP $)CO2 emissions per capita (metric tons)CO2 emissions growth (%, 1990–2007)Particulate matter (urban-pop.-weighted avg., μg/cu. m)Road sector energy use per capita (kg oil equivalent) Water and sanitationInternal freshwater resources per capita (cu. m)Freshwater withdrawal
Total (% of internal resources)Agriculture (% of total freshwater withdrawal)
Access to improved water source (% of total population)Rural (% of rural population)Urban (% of urban population)
Access to improved sanitation (% of total population)Rural (% of rural population)Urban (% of urban population)
Environment and healthAcute resp. infection prevalence (% of children under five)Diarrhea prevalence (% of children under five)Under-five mortality rate (per 1,000 live births) National accounting aggregates—savings, depletion and degradationGross savings (% of GNI)Consumption of fixed capital (% of GNI)Education expenditure (% of GNI)Energy depletion (% of GNI)Mineral depletion (% of GNI)Net forest depletion (% of GNI)CO2 damage (% of GNI)Particulate emissions damage (% of GNI)Adjusted net savings (% of GNI)
101The Little Green Data Book 2011
Country data
Latin America & Caribbean
group
Lower middle-income group
Population (millions) 7.5 Land area (1,000 sq. km) 111.9 GDP ($ billions) 14.3
GNI per capita, World Bank Atlas method ($)Adjusted Net National Income per capita ($)Urban population (% of total)Urban population growth (average annual %, 1990-2009) AgricultureAgricultural land (% land area)Agricultural productivity, value added per worker (2000 $)Food production index (1999-2001=100)Population density, rural (people/ sq. km of arable land) Forests and biodiversityForest area (% land area)Deforestation (average annual %, 1990-2010)Nationally terrestrial protected area (% of land area)Threatened species, mammalsThreatened species, birdsThreatened species, fishThreatened species, higher plantsGEF benefits index for biodiversity (0-100, median is 1.5) EnergyGDP per unit of energy use (2005 PPP $/kg oil equivalent)Energy use per capita (kg oil equivalent)Energy from biomass products and waste (% of total)Electric power consumption per capita (kWh)Electricity generated using fossil fuel (% of total)Electricity generated by hydropower (% of total) Emissions and pollutionCO2 emissions per unit of GDP (kg/2005 PPP $)CO2 emissions per capita (metric tons)CO2 emissions growth (%, 1990–2007)Particulate matter (urban-pop.-weighted avg., μg/cu. m)Road sector energy use per capita (kg oil equivalent) Water and sanitationInternal freshwater resources per capita (cu. m)Freshwater withdrawal
Total (% of internal resources)Agriculture (% of total freshwater withdrawal)
Access to improved water source (% of total population)Rural (% of rural population)Urban (% of urban population)
Access to improved sanitation (% of total population)Rural (% of rural population)Urban (% of urban population)
Environment and healthAcute resp. infection prevalence (% of children under five)Diarrhea prevalence (% of children under five)Under-five mortality rate (per 1,000 live births) National accounting aggregates—savings, depletion and degradationGross savings (% of GNI)Consumption of fixed capital (% of GNI)Education expenditure (% of GNI)Energy depletion (% of GNI)Mineral depletion (% of GNI)Net forest depletion (% of GNI)CO2 damage (% of GNI)Particulate emissions damage (% of GNI)Adjusted net savings (% of GNI)
102 2011 The Little Green Data Book
Country data
High-income group
Population (millions) 7.0 Land area (1,000 sq. km) 1.0 GDP ($ billions) 210.6
31,570 37,99026,703 31,467100.0 77.3
1.1 1.0
.. 37
.. 25,774
.. 106
.. 331
.. 28.9
.. –0.141.8 13.4
217116..
20.0 6.62,026 5,131
0.4 3.95,866 9,518100.0 62.9
0.0 11.3
0.1 0.45.8 12.5
44.5 17.9.. 24
204 964
.. 9,031
.. 10.5
.. 42
.. 100
.. 98
.. 100
.. 99
.. 98
.. 100
..
..
.. 7
.. 16.1
.. 14.13.0 4.60.0 0.90.0 0.10.0 0.00.1 0.2
.. 0.1
.. 5.2
Hong Kong SAR, China
GNI per capita, World Bank Atlas method ($)Adjusted Net National Income per capita ($)Urban population (% of total)Urban population growth (average annual %, 1990-2009) AgricultureAgricultural land (% land area)Agricultural productivity, value added per worker (2000 $)Food production index (1999-2001=100)Population density, rural (people/ sq. km of arable land) Forests and biodiversityForest area (% land area)Deforestation (average annual %, 1990-2010)Nationally terrestrial protected area (% of land area)Threatened species, mammalsThreatened species, birdsThreatened species, fishThreatened species, higher plantsGEF benefits index for biodiversity (0-100, median is 1.5) EnergyGDP per unit of energy use (2005 PPP $/kg oil equivalent)Energy use per capita (kg oil equivalent)Energy from biomass products and waste (% of total)Electric power consumption per capita (kWh)Electricity generated using fossil fuel (% of total)Electricity generated by hydropower (% of total) Emissions and pollutionCO2 emissions per unit of GDP (kg/2005 PPP $)CO2 emissions per capita (metric tons)CO2 emissions growth (%, 1990–2007)Particulate matter (urban-pop.-weighted avg., μg/cu. m)Road sector energy use per capita (kg oil equivalent) Water and sanitationInternal freshwater resources per capita (cu. m)Freshwater withdrawal
Total (% of internal resources)Agriculture (% of total freshwater withdrawal)
Access to improved water source (% of total population)Rural (% of rural population)Urban (% of urban population)
Access to improved sanitation (% of total population)Rural (% of rural population)Urban (% of urban population)
Environment and healthAcute resp. infection prevalence (% of children under five)Diarrhea prevalence (% of children under five)Under-five mortality rate (per 1,000 live births) National accounting aggregates—savings, depletion and degradationGross savings (% of GNI)Consumption of fixed capital (% of GNI)Education expenditure (% of GNI)Energy depletion (% of GNI)Mineral depletion (% of GNI)Net forest depletion (% of GNI)CO2 damage (% of GNI)Particulate emissions damage (% of GNI)Adjusted net savings (% of GNI)
103The Little Green Data Book 2011
Country data
High-income group
Population (millions) 10 Land area (1,000 sq. km) 90 GDP ($ billions) 129.0
GNI per capita, World Bank Atlas method ($)Adjusted Net National Income per capita ($)Urban population (% of total)Urban population growth (average annual %, 1990-2009) AgricultureAgricultural land (% land area)Agricultural productivity, value added per worker (2000 $)Food production index (1999-2001=100)Population density, rural (people/ sq. km of arable land) Forests and biodiversityForest area (% land area)Deforestation (average annual %, 1990-2010)Nationally terrestrial protected area (% of land area)Threatened species, mammalsThreatened species, birdsThreatened species, fishThreatened species, higher plantsGEF benefits index for biodiversity (0-100, median is 1.5) EnergyGDP per unit of energy use (2005 PPP $/kg oil equivalent)Energy use per capita (kg oil equivalent)Energy from biomass products and waste (% of total)Electric power consumption per capita (kWh)Electricity generated using fossil fuel (% of total)Electricity generated by hydropower (% of total) Emissions and pollutionCO2 emissions per unit of GDP (kg/2005 PPP $)CO2 emissions per capita (metric tons)CO2 emissions growth (%, 1990–2007)Particulate matter (urban-pop.-weighted avg., μg/cu. m)Road sector energy use per capita (kg oil equivalent) Water and sanitationInternal freshwater resources per capita (cu. m)Freshwater withdrawal
Total (% of internal resources)Agriculture (% of total freshwater withdrawal)
Access to improved water source (% of total population)Rural (% of rural population)Urban (% of urban population)
Access to improved sanitation (% of total population)Rural (% of rural population)Urban (% of urban population)
Environment and healthAcute resp. infection prevalence (% of children under five)Diarrhea prevalence (% of children under five)Under-five mortality rate (per 1,000 live births) National accounting aggregates—savings, depletion and degradationGross savings (% of GNI)Consumption of fixed capital (% of GNI)Education expenditure (% of GNI)Energy depletion (% of GNI)Mineral depletion (% of GNI)Net forest depletion (% of GNI)CO2 damage (% of GNI)Particulate emissions damage (% of GNI)Adjusted net savings (% of GNI)
104 2011 The Little Green Data Book
Country data
High-income group
Population (thousands) 319 Land area (1,000 sq. km) 100 GDP ($ billions) 12.1
43,430 37,99028,659 31,467
92.3 77.31.3 1.0
23 3755,355 25,774
109 106351 331
0.3 28.9–4.1 –0.19.7 13.4
50
120
0.7
2.2 6.616,556 5,131
0.1 3.950,067 9,518
0.0 62.975.5 11.3
0.2 0.47.5 12.5
12.9 17.914 24
885 964
545,631 9,031
0.1 10.50 42
100 100100 98100 100100 99100 98100 100
..
..3 7
12.6 16.115.6 14.1
7.3 4.60.0 0.90.0 0.10.0 0.00.2 0.20.0 0.14.1 5.2
Iceland
GNI per capita, World Bank Atlas method ($)Adjusted Net National Income per capita ($)Urban population (% of total)Urban population growth (average annual %, 1990-2009) AgricultureAgricultural land (% land area)Agricultural productivity, value added per worker (2000 $)Food production index (1999-2001=100)Population density, rural (people/ sq. km of arable land) Forests and biodiversityForest area (% land area)Deforestation (average annual %, 1990-2010)Nationally terrestrial protected area (% of land area)Threatened species, mammalsThreatened species, birdsThreatened species, fishThreatened species, higher plantsGEF benefits index for biodiversity (0-100, median is 1.5) EnergyGDP per unit of energy use (2005 PPP $/kg oil equivalent)Energy use per capita (kg oil equivalent)Energy from biomass products and waste (% of total)Electric power consumption per capita (kWh)Electricity generated using fossil fuel (% of total)Electricity generated by hydropower (% of total) Emissions and pollutionCO2 emissions per unit of GDP (kg/2005 PPP $)CO2 emissions per capita (metric tons)CO2 emissions growth (%, 1990–2007)Particulate matter (urban-pop.-weighted avg., μg/cu. m)Road sector energy use per capita (kg oil equivalent) Water and sanitationInternal freshwater resources per capita (cu. m)Freshwater withdrawal
Total (% of internal resources)Agriculture (% of total freshwater withdrawal)
Access to improved water source (% of total population)Rural (% of rural population)Urban (% of urban population)
Access to improved sanitation (% of total population)Rural (% of rural population)Urban (% of urban population)
Environment and healthAcute resp. infection prevalence (% of children under five)Diarrhea prevalence (% of children under five)Under-five mortality rate (per 1,000 live births) National accounting aggregates—savings, depletion and degradationGross savings (% of GNI)Consumption of fixed capital (% of GNI)Education expenditure (% of GNI)Energy depletion (% of GNI)Mineral depletion (% of GNI)Net forest depletion (% of GNI)CO2 damage (% of GNI)Particulate emissions damage (% of GNI)Adjusted net savings (% of GNI)
105The Little Green Data Book 2011
Country data
South Asia
group
Lower middle-income group
Population (millions) 1,155 Land area (1,000 sq. km) 2,973 GDP ($ billions) 1,377.3
GNI per capita, World Bank Atlas method ($)Adjusted Net National Income per capita ($)Urban population (% of total)Urban population growth (average annual %, 1990-2009) AgricultureAgricultural land (% land area)Agricultural productivity, value added per worker (2000 $)Food production index (1999-2001=100)Population density, rural (people/ sq. km of arable land) Forests and biodiversityForest area (% land area)Deforestation (average annual %, 1990-2010)Nationally terrestrial protected area (% of land area)Threatened species, mammalsThreatened species, birdsThreatened species, fishThreatened species, higher plantsGEF benefits index for biodiversity (0-100, median is 1.5) EnergyGDP per unit of energy use (2005 PPP $/kg oil equivalent)Energy use per capita (kg oil equivalent)Energy from biomass products and waste (% of total)Electric power consumption per capita (kWh)Electricity generated using fossil fuel (% of total)Electricity generated by hydropower (% of total) Emissions and pollutionCO2 emissions per unit of GDP (kg/2005 PPP $)CO2 emissions per capita (metric tons)CO2 emissions growth (%, 1990–2007)Particulate matter (urban-pop.-weighted avg., μg/cu. m)Road sector energy use per capita (kg oil equivalent) Water and sanitationInternal freshwater resources per capita (cu. m)Freshwater withdrawal
Total (% of internal resources)Agriculture (% of total freshwater withdrawal)
Access to improved water source (% of total population)Rural (% of rural population)Urban (% of urban population)
Access to improved sanitation (% of total population)Rural (% of rural population)Urban (% of urban population)
Environment and healthAcute resp. infection prevalence (% of children under five)Diarrhea prevalence (% of children under five)Under-five mortality rate (per 1,000 live births) National accounting aggregates—savings, depletion and degradationGross savings (% of GNI)Consumption of fixed capital (% of GNI)Education expenditure (% of GNI)Energy depletion (% of GNI)Mineral depletion (% of GNI)Net forest depletion (% of GNI)CO2 damage (% of GNI)Particulate emissions damage (% of GNI)Adjusted net savings (% of GNI)
106 2011 The Little Green Data Book
Country data
East Asia & Pacific
group
Lower middle-income group
Population (millions) 230 Land area (1,000 sq. km) 1,812 GDP ($ billions) 540.3
GNI per capita, World Bank Atlas method ($)Adjusted Net National Income per capita ($)Urban population (% of total)Urban population growth (average annual %, 1990-2009) AgricultureAgricultural land (% land area)Agricultural productivity, value added per worker (2000 $)Food production index (1999-2001=100)Population density, rural (people/ sq. km of arable land) Forests and biodiversityForest area (% land area)Deforestation (average annual %, 1990-2010)Nationally terrestrial protected area (% of land area)Threatened species, mammalsThreatened species, birdsThreatened species, fishThreatened species, higher plantsGEF benefits index for biodiversity (0-100, median is 1.5) EnergyGDP per unit of energy use (2005 PPP $/kg oil equivalent)Energy use per capita (kg oil equivalent)Energy from biomass products and waste (% of total)Electric power consumption per capita (kWh)Electricity generated using fossil fuel (% of total)Electricity generated by hydropower (% of total) Emissions and pollutionCO2 emissions per unit of GDP (kg/2005 PPP $)CO2 emissions per capita (metric tons)CO2 emissions growth (%, 1990–2007)Particulate matter (urban-pop.-weighted avg., μg/cu. m)Road sector energy use per capita (kg oil equivalent) Water and sanitationInternal freshwater resources per capita (cu. m)Freshwater withdrawal
Total (% of internal resources)Agriculture (% of total freshwater withdrawal)
Access to improved water source (% of total population)Rural (% of rural population)Urban (% of urban population)
Access to improved sanitation (% of total population)Rural (% of rural population)Urban (% of urban population)
Environment and healthAcute resp. infection prevalence (% of children under five)Diarrhea prevalence (% of children under five)Under-five mortality rate (per 1,000 live births) National accounting aggregates—savings, depletion and degradationGross savings (% of GNI)Consumption of fixed capital (% of GNI)Education expenditure (% of GNI)Energy depletion (% of GNI)Mineral depletion (% of GNI)Net forest depletion (% of GNI)CO2 damage (% of GNI)Particulate emissions damage (% of GNI)Adjusted net savings (% of GNI)
107The Little Green Data Book 2011
Country data
Middle East &
N. Africa group
Lower middle-income group
Population (millions) 73 Land area (1,000 sq. km) 1,629 GDP ($ billions) 331.0
GNI per capita, World Bank Atlas method ($)Adjusted Net National Income per capita ($)Urban population (% of total)Urban population growth (average annual %, 1990-2009) AgricultureAgricultural land (% land area)Agricultural productivity, value added per worker (2000 $)Food production index (1999-2001=100)Population density, rural (people/ sq. km of arable land) Forests and biodiversityForest area (% land area)Deforestation (average annual %, 1990-2010)Nationally terrestrial protected area (% of land area)Threatened species, mammalsThreatened species, birdsThreatened species, fishThreatened species, higher plantsGEF benefits index for biodiversity (0-100, median is 1.5) EnergyGDP per unit of energy use (2005 PPP $/kg oil equivalent)Energy use per capita (kg oil equivalent)Energy from biomass products and waste (% of total)Electric power consumption per capita (kWh)Electricity generated using fossil fuel (% of total)Electricity generated by hydropower (% of total) Emissions and pollutionCO2 emissions per unit of GDP (kg/2005 PPP $)CO2 emissions per capita (metric tons)CO2 emissions growth (%, 1990–2007)Particulate matter (urban-pop.-weighted avg., μg/cu. m)Road sector energy use per capita (kg oil equivalent) Water and sanitationInternal freshwater resources per capita (cu. m)Freshwater withdrawal
Total (% of internal resources)Agriculture (% of total freshwater withdrawal)
Access to improved water source (% of total population)Rural (% of rural population)Urban (% of urban population)
Access to improved sanitation (% of total population)Rural (% of rural population)Urban (% of urban population)
Environment and healthAcute resp. infection prevalence (% of children under five)Diarrhea prevalence (% of children under five)Under-five mortality rate (per 1,000 live births) National accounting aggregates—savings, depletion and degradationGross savings (% of GNI)Consumption of fixed capital (% of GNI)Education expenditure (% of GNI)Energy depletion (% of GNI)Mineral depletion (% of GNI)Net forest depletion (% of GNI)CO2 damage (% of GNI)Particulate emissions damage (% of GNI)Adjusted net savings (% of GNI)
108 2011 The Little Green Data Book
Country data
Middle East &
N. Africa group
Lower middle-income group
Population (millions) 31 Land area (1,000 sq. km) 437 GDP ($ billions) 65.8
GNI per capita, World Bank Atlas method ($)Adjusted Net National Income per capita ($)Urban population (% of total)Urban population growth (average annual %, 1990-2009) AgricultureAgricultural land (% land area)Agricultural productivity, value added per worker (2000 $)Food production index (1999-2001=100)Population density, rural (people/ sq. km of arable land) Forests and biodiversityForest area (% land area)Deforestation (average annual %, 1990-2010)Nationally terrestrial protected area (% of land area)Threatened species, mammalsThreatened species, birdsThreatened species, fishThreatened species, higher plantsGEF benefits index for biodiversity (0-100, median is 1.5) EnergyGDP per unit of energy use (2005 PPP $/kg oil equivalent)Energy use per capita (kg oil equivalent)Energy from biomass products and waste (% of total)Electric power consumption per capita (kWh)Electricity generated using fossil fuel (% of total)Electricity generated by hydropower (% of total) Emissions and pollutionCO2 emissions per unit of GDP (kg/2005 PPP $)CO2 emissions per capita (metric tons)CO2 emissions growth (%, 1990–2007)Particulate matter (urban-pop.-weighted avg., μg/cu. m)Road sector energy use per capita (kg oil equivalent) Water and sanitationInternal freshwater resources per capita (cu. m)Freshwater withdrawal
Total (% of internal resources)Agriculture (% of total freshwater withdrawal)
Access to improved water source (% of total population)Rural (% of rural population)Urban (% of urban population)
Access to improved sanitation (% of total population)Rural (% of rural population)Urban (% of urban population)
Environment and healthAcute resp. infection prevalence (% of children under five)Diarrhea prevalence (% of children under five)Under-five mortality rate (per 1,000 live births) National accounting aggregates—savings, depletion and degradationGross savings (% of GNI)Consumption of fixed capital (% of GNI)Education expenditure (% of GNI)Energy depletion (% of GNI)Mineral depletion (% of GNI)Net forest depletion (% of GNI)CO2 damage (% of GNI)Particulate emissions damage (% of GNI)Adjusted net savings (% of GNI)
109The Little Green Data Book 2011
Country data
High-income group
Population (millions) 4.5 Land area (1,000 sq. km) 68.9 GDP ($ billions) 227.2
GNI per capita, World Bank Atlas method ($)Adjusted Net National Income per capita ($)Urban population (% of total)Urban population growth (average annual %, 1990-2009) AgricultureAgricultural land (% land area)Agricultural productivity, value added per worker (2000 $)Food production index (1999-2001=100)Population density, rural (people/ sq. km of arable land) Forests and biodiversityForest area (% land area)Deforestation (average annual %, 1990-2010)Nationally terrestrial protected area (% of land area)Threatened species, mammalsThreatened species, birdsThreatened species, fishThreatened species, higher plantsGEF benefits index for biodiversity (0-100, median is 1.5) EnergyGDP per unit of energy use (2005 PPP $/kg oil equivalent)Energy use per capita (kg oil equivalent)Energy from biomass products and waste (% of total)Electric power consumption per capita (kWh)Electricity generated using fossil fuel (% of total)Electricity generated by hydropower (% of total) Emissions and pollutionCO2 emissions per unit of GDP (kg/2005 PPP $)CO2 emissions per capita (metric tons)CO2 emissions growth (%, 1990–2007)Particulate matter (urban-pop.-weighted avg., μg/cu. m)Road sector energy use per capita (kg oil equivalent) Water and sanitationInternal freshwater resources per capita (cu. m)Freshwater withdrawal
Total (% of internal resources)Agriculture (% of total freshwater withdrawal)
Access to improved water source (% of total population)Rural (% of rural population)Urban (% of urban population)
Access to improved sanitation (% of total population)Rural (% of rural population)Urban (% of urban population)
Environment and healthAcute resp. infection prevalence (% of children under five)Diarrhea prevalence (% of children under five)Under-five mortality rate (per 1,000 live births) National accounting aggregates—savings, depletion and degradationGross savings (% of GNI)Consumption of fixed capital (% of GNI)Education expenditure (% of GNI)Energy depletion (% of GNI)Mineral depletion (% of GNI)Net forest depletion (% of GNI)CO2 damage (% of GNI)Particulate emissions damage (% of GNI)Adjusted net savings (% of GNI)
110 2011 The Little Green Data Book
Country data
High-income group
Population (thousands) 80 Land area (1,000 sq. km) 0.6 GDP ($ millions) ..
.. 37,990
.. 31,46750.7 77.30.6 1.0
74 37.. 25,774.. 106
761 331
5.3 28.90.0 –0.1
.. 13.40020
0.0
.. 6.6
.. 5,131
.. 3.9
.. 9,518
.. 62.9
.. 11.3
.. 0.4
.. 12.5
.. 17.9
.. 24
.. 964
.. 9,031
.. 10.5
.. 42
.. 100
.. 98
.. 100
.. 99
.. 98
.. 100
..
..
.. 7
.. 16.1
.. 14.1
.. 4.6
.. 0.9
.. 0.1
.. 0.0
.. 0.2
.. 0.1
.. 5.2
Isle of Man
GNI per capita, World Bank Atlas method ($)Adjusted Net National Income per capita ($)Urban population (% of total)Urban population growth (average annual %, 1990-2009) AgricultureAgricultural land (% land area)Agricultural productivity, value added per worker (2000 $)Food production index (1999-2001=100)Population density, rural (people/ sq. km of arable land) Forests and biodiversityForest area (% land area)Deforestation (average annual %, 1990-2010)Nationally terrestrial protected area (% of land area)Threatened species, mammalsThreatened species, birdsThreatened species, fishThreatened species, higher plantsGEF benefits index for biodiversity (0-100, median is 1.5) EnergyGDP per unit of energy use (2005 PPP $/kg oil equivalent)Energy use per capita (kg oil equivalent)Energy from biomass products and waste (% of total)Electric power consumption per capita (kWh)Electricity generated using fossil fuel (% of total)Electricity generated by hydropower (% of total) Emissions and pollutionCO2 emissions per unit of GDP (kg/2005 PPP $)CO2 emissions per capita (metric tons)CO2 emissions growth (%, 1990–2007)Particulate matter (urban-pop.-weighted avg., μg/cu. m)Road sector energy use per capita (kg oil equivalent) Water and sanitationInternal freshwater resources per capita (cu. m)Freshwater withdrawal
Total (% of internal resources)Agriculture (% of total freshwater withdrawal)
Access to improved water source (% of total population)Rural (% of rural population)Urban (% of urban population)
Access to improved sanitation (% of total population)Rural (% of rural population)Urban (% of urban population)
Environment and healthAcute resp. infection prevalence (% of children under five)Diarrhea prevalence (% of children under five)Under-five mortality rate (per 1,000 live births) National accounting aggregates—savings, depletion and degradationGross savings (% of GNI)Consumption of fixed capital (% of GNI)Education expenditure (% of GNI)Energy depletion (% of GNI)Mineral depletion (% of GNI)Net forest depletion (% of GNI)CO2 damage (% of GNI)Particulate emissions damage (% of GNI)Adjusted net savings (% of GNI)
111The Little Green Data Book 2011
Country data
High-income group
25,790 37,99022,092 31,467
91.7 77.32.5 1.0
23 37.. 25,774
122 106202 331
7.1 28.9–0.5 –0.118.7 13.4
151335
00.8
8.5 6.63,011 5,131
0.0 3.97,054 9,51899.6 62.9
0.0 11.3
0.4 0.49.3 12.5
99.0 17.928 24
481 964
104 9,031
241.9 10.558 42
100 100100 98100 100100 99100 98100 100
..
..4 7
20.8 16.113.6 14.1
5.7 4.60.1 0.90.1 0.10.0 0.00.3 0.20.1 0.1
12.2 5.2
Population (millions) 7.4 Land area (1,000 sq. km) 21.6 GDP ($ billions) 195.4
Israel
GNI per capita, World Bank Atlas method ($)Adjusted Net National Income per capita ($)Urban population (% of total)Urban population growth (average annual %, 1990-2009) AgricultureAgricultural land (% land area)Agricultural productivity, value added per worker (2000 $)Food production index (1999-2001=100)Population density, rural (people/ sq. km of arable land) Forests and biodiversityForest area (% land area)Deforestation (average annual %, 1990-2010)Nationally terrestrial protected area (% of land area)Threatened species, mammalsThreatened species, birdsThreatened species, fishThreatened species, higher plantsGEF benefits index for biodiversity (0-100, median is 1.5) EnergyGDP per unit of energy use (2005 PPP $/kg oil equivalent)Energy use per capita (kg oil equivalent)Energy from biomass products and waste (% of total)Electric power consumption per capita (kWh)Electricity generated using fossil fuel (% of total)Electricity generated by hydropower (% of total) Emissions and pollutionCO2 emissions per unit of GDP (kg/2005 PPP $)CO2 emissions per capita (metric tons)CO2 emissions growth (%, 1990–2007)Particulate matter (urban-pop.-weighted avg., μg/cu. m)Road sector energy use per capita (kg oil equivalent) Water and sanitationInternal freshwater resources per capita (cu. m)Freshwater withdrawal
Total (% of internal resources)Agriculture (% of total freshwater withdrawal)
Access to improved water source (% of total population)Rural (% of rural population)Urban (% of urban population)
Access to improved sanitation (% of total population)Rural (% of rural population)Urban (% of urban population)
Environment and healthAcute resp. infection prevalence (% of children under five)Diarrhea prevalence (% of children under five)Under-five mortality rate (per 1,000 live births) National accounting aggregates—savings, depletion and degradationGross savings (% of GNI)Consumption of fixed capital (% of GNI)Education expenditure (% of GNI)Energy depletion (% of GNI)Mineral depletion (% of GNI)Net forest depletion (% of GNI)CO2 damage (% of GNI)Particulate emissions damage (% of GNI)Adjusted net savings (% of GNI)
112 2011 The Little Green Data Book
Population (millions) 60 Land area (1,000 sq. km) 294 GDP ($ billions) 2,112.8
Country data
High-income group
35,110 37,99029,618 31,467
68.2 77.30.4 1.0
46 3729,199 25,774
95 106268 331
31.1 28.9–0.6 –0.19.9 13.4
78
4227
3.8
9.6 6.62,942 5,131
3.0 3.95,661 9,51880.6 62.913.3 11.3
0.3 0.47.7 12.57.4 17.923 24
626 964
3,074 9,031
24.8 10.544 42
100 100100 98100 100
.. 99
.. 98
.. 100
..
..4 7
16.3 16.114.0 14.1
4.1 4.60.1 0.90.0 0.10.0 0.00.2 0.20.1 0.16.1 5.2
Italy
GNI per capita, World Bank Atlas method ($)Adjusted Net National Income per capita ($)Urban population (% of total)Urban population growth (average annual %, 1990-2009) AgricultureAgricultural land (% land area)Agricultural productivity, value added per worker (2000 $)Food production index (1999-2001=100)Population density, rural (people/ sq. km of arable land) Forests and biodiversityForest area (% land area)Deforestation (average annual %, 1990-2010)Nationally terrestrial protected area (% of land area)Threatened species, mammalsThreatened species, birdsThreatened species, fishThreatened species, higher plantsGEF benefits index for biodiversity (0-100, median is 1.5) EnergyGDP per unit of energy use (2005 PPP $/kg oil equivalent)Energy use per capita (kg oil equivalent)Energy from biomass products and waste (% of total)Electric power consumption per capita (kWh)Electricity generated using fossil fuel (% of total)Electricity generated by hydropower (% of total) Emissions and pollutionCO2 emissions per unit of GDP (kg/2005 PPP $)CO2 emissions per capita (metric tons)CO2 emissions growth (%, 1990–2007)Particulate matter (urban-pop.-weighted avg., μg/cu. m)Road sector energy use per capita (kg oil equivalent) Water and sanitationInternal freshwater resources per capita (cu. m)Freshwater withdrawal
Total (% of internal resources)Agriculture (% of total freshwater withdrawal)
Access to improved water source (% of total population)Rural (% of rural population)Urban (% of urban population)
Access to improved sanitation (% of total population)Rural (% of rural population)Urban (% of urban population)
Environment and healthAcute resp. infection prevalence (% of children under five)Diarrhea prevalence (% of children under five)Under-five mortality rate (per 1,000 live births) National accounting aggregates—savings, depletion and degradationGross savings (% of GNI)Consumption of fixed capital (% of GNI)Education expenditure (% of GNI)Energy depletion (% of GNI)Mineral depletion (% of GNI)Net forest depletion (% of GNI)CO2 damage (% of GNI)Particulate emissions damage (% of GNI)Adjusted net savings (% of GNI)
113The Little Green Data Book 2011
Population (millions) 2.7 Land area (1,000 sq. km) 10.8 GDP ($ billions) 12.1
GNI per capita, World Bank Atlas method ($)Adjusted Net National Income per capita ($)Urban population (% of total)Urban population growth (average annual %, 1990-2009) AgricultureAgricultural land (% land area)Agricultural productivity, value added per worker (2000 $)Food production index (1999-2001=100)Population density, rural (people/ sq. km of arable land) Forests and biodiversityForest area (% land area)Deforestation (average annual %, 1990-2010)Nationally terrestrial protected area (% of land area)Threatened species, mammalsThreatened species, birdsThreatened species, fishThreatened species, higher plantsGEF benefits index for biodiversity (0-100, median is 1.5) EnergyGDP per unit of energy use (2005 PPP $/kg oil equivalent)Energy use per capita (kg oil equivalent)Energy from biomass products and waste (% of total)Electric power consumption per capita (kWh)Electricity generated using fossil fuel (% of total)Electricity generated by hydropower (% of total) Emissions and pollutionCO2 emissions per unit of GDP (kg/2005 PPP $)CO2 emissions per capita (metric tons)CO2 emissions growth (%, 1990–2007)Particulate matter (urban-pop.-weighted avg., μg/cu. m)Road sector energy use per capita (kg oil equivalent) Water and sanitationInternal freshwater resources per capita (cu. m)Freshwater withdrawal
Total (% of internal resources)Agriculture (% of total freshwater withdrawal)
Access to improved water source (% of total population)Rural (% of rural population)Urban (% of urban population)
Access to improved sanitation (% of total population)Rural (% of rural population)Urban (% of urban population)
Environment and healthAcute resp. infection prevalence (% of children under five)Diarrhea prevalence (% of children under five)Under-five mortality rate (per 1,000 live births) National accounting aggregates—savings, depletion and degradationGross savings (% of GNI)Consumption of fixed capital (% of GNI)Education expenditure (% of GNI)Energy depletion (% of GNI)Mineral depletion (% of GNI)Net forest depletion (% of GNI)CO2 damage (% of GNI)Particulate emissions damage (% of GNI)Adjusted net savings (% of GNI)
114 2011 The Little Green Data Book
Population (millions) 128 Land area (1,000 sq. km) 365 GDP ($ billions) 5,069.0
GNI per capita, World Bank Atlas method ($)Adjusted Net National Income per capita ($)Urban population (% of total)Urban population growth (average annual %, 1990-2009) AgricultureAgricultural land (% land area)Agricultural productivity, value added per worker (2000 $)Food production index (1999-2001=100)Population density, rural (people/ sq. km of arable land) Forests and biodiversityForest area (% land area)Deforestation (average annual %, 1990-2010)Nationally terrestrial protected area (% of land area)Threatened species, mammalsThreatened species, birdsThreatened species, fishThreatened species, higher plantsGEF benefits index for biodiversity (0-100, median is 1.5) EnergyGDP per unit of energy use (2005 PPP $/kg oil equivalent)Energy use per capita (kg oil equivalent)Energy from biomass products and waste (% of total)Electric power consumption per capita (kWh)Electricity generated using fossil fuel (% of total)Electricity generated by hydropower (% of total) Emissions and pollutionCO2 emissions per unit of GDP (kg/2005 PPP $)CO2 emissions per capita (metric tons)CO2 emissions growth (%, 1990–2007)Particulate matter (urban-pop.-weighted avg., μg/cu. m)Road sector energy use per capita (kg oil equivalent) Water and sanitationInternal freshwater resources per capita (cu. m)Freshwater withdrawal
Total (% of internal resources)Agriculture (% of total freshwater withdrawal)
Access to improved water source (% of total population)Rural (% of rural population)Urban (% of urban population)
Access to improved sanitation (% of total population)Rural (% of rural population)Urban (% of urban population)
Environment and healthAcute resp. infection prevalence (% of children under five)Diarrhea prevalence (% of children under five)Under-five mortality rate (per 1,000 live births) National accounting aggregates—savings, depletion and degradationGross savings (% of GNI)Consumption of fixed capital (% of GNI)Education expenditure (% of GNI)Energy depletion (% of GNI)Mineral depletion (% of GNI)Net forest depletion (% of GNI)CO2 damage (% of GNI)Particulate emissions damage (% of GNI)Adjusted net savings (% of GNI)
115The Little Green Data Book 2011
Country data
Middle East &
N. Africa group
Lower middle-income group
Population (millions) 6.0 Land area (1,000 sq. km) 88.2 GDP ($ billions) 25.1
GNI per capita, World Bank Atlas method ($)Adjusted Net National Income per capita ($)Urban population (% of total)Urban population growth (average annual %, 1990-2009) AgricultureAgricultural land (% land area)Agricultural productivity, value added per worker (2000 $)Food production index (1999-2001=100)Population density, rural (people/ sq. km of arable land) Forests and biodiversityForest area (% land area)Deforestation (average annual %, 1990-2010)Nationally terrestrial protected area (% of land area)Threatened species, mammalsThreatened species, birdsThreatened species, fishThreatened species, higher plantsGEF benefits index for biodiversity (0-100, median is 1.5) EnergyGDP per unit of energy use (2005 PPP $/kg oil equivalent)Energy use per capita (kg oil equivalent)Energy from biomass products and waste (% of total)Electric power consumption per capita (kWh)Electricity generated using fossil fuel (% of total)Electricity generated by hydropower (% of total) Emissions and pollutionCO2 emissions per unit of GDP (kg/2005 PPP $)CO2 emissions per capita (metric tons)CO2 emissions growth (%, 1990–2007)Particulate matter (urban-pop.-weighted avg., μg/cu. m)Road sector energy use per capita (kg oil equivalent) Water and sanitationInternal freshwater resources per capita (cu. m)Freshwater withdrawal
Total (% of internal resources)Agriculture (% of total freshwater withdrawal)
Access to improved water source (% of total population)Rural (% of rural population)Urban (% of urban population)
Access to improved sanitation (% of total population)Rural (% of rural population)Urban (% of urban population)
Environment and healthAcute resp. infection prevalence (% of children under five)Diarrhea prevalence (% of children under five)Under-five mortality rate (per 1,000 live births) National accounting aggregates—savings, depletion and degradationGross savings (% of GNI)Consumption of fixed capital (% of GNI)Education expenditure (% of GNI)Energy depletion (% of GNI)Mineral depletion (% of GNI)Net forest depletion (% of GNI)CO2 damage (% of GNI)Particulate emissions damage (% of GNI)Adjusted net savings (% of GNI)
116 2011 The Little Green Data Book
Country data
Europe & Central
Asia group
Upper middle-income group
Population (millions) 16 Land area (1,000 sq. km) 2,700 GDP ($ billions) 115.3
GNI per capita, World Bank Atlas method ($)Adjusted Net National Income per capita ($)Urban population (% of total)Urban population growth (average annual %, 1990-2009) AgricultureAgricultural land (% land area)Agricultural productivity, value added per worker (2000 $)Food production index (1999-2001=100)Population density, rural (people/ sq. km of arable land) Forests and biodiversityForest area (% land area)Deforestation (average annual %, 1990-2010)Nationally terrestrial protected area (% of land area)Threatened species, mammalsThreatened species, birdsThreatened species, fishThreatened species, higher plantsGEF benefits index for biodiversity (0-100, median is 1.5) EnergyGDP per unit of energy use (2005 PPP $/kg oil equivalent)Energy use per capita (kg oil equivalent)Energy from biomass products and waste (% of total)Electric power consumption per capita (kWh)Electricity generated using fossil fuel (% of total)Electricity generated by hydropower (% of total) Emissions and pollutionCO2 emissions per unit of GDP (kg/2005 PPP $)CO2 emissions per capita (metric tons)CO2 emissions growth (%, 1990–2007)Particulate matter (urban-pop.-weighted avg., μg/cu. m)Road sector energy use per capita (kg oil equivalent) Water and sanitationInternal freshwater resources per capita (cu. m)Freshwater withdrawal
Total (% of internal resources)Agriculture (% of total freshwater withdrawal)
Access to improved water source (% of total population)Rural (% of rural population)Urban (% of urban population)
Access to improved sanitation (% of total population)Rural (% of rural population)Urban (% of urban population)
Environment and healthAcute resp. infection prevalence (% of children under five)Diarrhea prevalence (% of children under five)Under-five mortality rate (per 1,000 live births) National accounting aggregates—savings, depletion and degradationGross savings (% of GNI)Consumption of fixed capital (% of GNI)Education expenditure (% of GNI)Energy depletion (% of GNI)Mineral depletion (% of GNI)Net forest depletion (% of GNI)CO2 damage (% of GNI)Particulate emissions damage (% of GNI)Adjusted net savings (% of GNI)
117The Little Green Data Book 2011
Population (millions) 40 Land area (1,000 sq. km) 569 GDP ($ billions) 29.4
GNI per capita, World Bank Atlas method ($)Adjusted Net National Income per capita ($)Urban population (% of total)Urban population growth (average annual %, 1990-2009) AgricultureAgricultural land (% land area)Agricultural productivity, value added per worker (2000 $)Food production index (1999-2001=100)Population density, rural (people/ sq. km of arable land) Forests and biodiversityForest area (% land area)Deforestation (average annual %, 1990-2010)Nationally terrestrial protected area (% of land area)Threatened species, mammalsThreatened species, birdsThreatened species, fishThreatened species, higher plantsGEF benefits index for biodiversity (0-100, median is 1.5) EnergyGDP per unit of energy use (2005 PPP $/kg oil equivalent)Energy use per capita (kg oil equivalent)Energy from biomass products and waste (% of total)Electric power consumption per capita (kWh)Electricity generated using fossil fuel (% of total)Electricity generated by hydropower (% of total) Emissions and pollutionCO2 emissions per unit of GDP (kg/2005 PPP $)CO2 emissions per capita (metric tons)CO2 emissions growth (%, 1990–2007)Particulate matter (urban-pop.-weighted avg., μg/cu. m)Road sector energy use per capita (kg oil equivalent) Water and sanitationInternal freshwater resources per capita (cu. m)Freshwater withdrawal
Total (% of internal resources)Agriculture (% of total freshwater withdrawal)
Access to improved water source (% of total population)Rural (% of rural population)Urban (% of urban population)
Access to improved sanitation (% of total population)Rural (% of rural population)Urban (% of urban population)
Environment and healthAcute resp. infection prevalence (% of children under five)Diarrhea prevalence (% of children under five)Under-five mortality rate (per 1,000 live births) National accounting aggregates—savings, depletion and degradationGross savings (% of GNI)Consumption of fixed capital (% of GNI)Education expenditure (% of GNI)Energy depletion (% of GNI)Mineral depletion (% of GNI)Net forest depletion (% of GNI)CO2 damage (% of GNI)Particulate emissions damage (% of GNI)Adjusted net savings (% of GNI)
118 2011 The Little Green Data Book
Country data
East Asia & Pacific
group
Lower middle-income group
Population (thousands) 98 Land area (1,000 sq. km) 0.8 GDP ($ millions) 128
GNI per capita, World Bank Atlas method ($)Adjusted Net National Income per capita ($)Urban population (% of total)Urban population growth (average annual %, 1990-2009) AgricultureAgricultural land (% land area)Agricultural productivity, value added per worker (2000 $)Food production index (1999-2001=100)Population density, rural (people/ sq. km of arable land) Forests and biodiversityForest area (% land area)Deforestation (average annual %, 1990-2010)Nationally terrestrial protected area (% of land area)Threatened species, mammalsThreatened species, birdsThreatened species, fishThreatened species, higher plantsGEF benefits index for biodiversity (0-100, median is 1.5) EnergyGDP per unit of energy use (2005 PPP $/kg oil equivalent)Energy use per capita (kg oil equivalent)Energy from biomass products and waste (% of total)Electric power consumption per capita (kWh)Electricity generated using fossil fuel (% of total)Electricity generated by hydropower (% of total) Emissions and pollutionCO2 emissions per unit of GDP (kg/2005 PPP $)CO2 emissions per capita (metric tons)CO2 emissions growth (%, 1990–2007)Particulate matter (urban-pop.-weighted avg., μg/cu. m)Road sector energy use per capita (kg oil equivalent) Water and sanitationInternal freshwater resources per capita (cu. m)Freshwater withdrawal
Total (% of internal resources)Agriculture (% of total freshwater withdrawal)
Access to improved water source (% of total population)Rural (% of rural population)Urban (% of urban population)
Access to improved sanitation (% of total population)Rural (% of rural population)Urban (% of urban population)
Environment and healthAcute resp. infection prevalence (% of children under five)Diarrhea prevalence (% of children under five)Under-five mortality rate (per 1,000 live births) National accounting aggregates—savings, depletion and degradationGross savings (% of GNI)Consumption of fixed capital (% of GNI)Education expenditure (% of GNI)Energy depletion (% of GNI)Mineral depletion (% of GNI)Net forest depletion (% of GNI)CO2 damage (% of GNI)Particulate emissions damage (% of GNI)Adjusted net savings (% of GNI)
119The Little Green Data Book 2011
Country data
East Asia & Pacific
group
Low-income group
.. 3,163 50963 2,807 4531.3 45.0 28.70.9 3.4 3.7
25 48 37.. 550 280
111 135 134319 657 642
49.3 29.6 28.21.9 –0.2 0.42.6 14.9 11.2
920
83
0.7
.. 3.8 3.2774 1,380 3575.7 12.4 66.2
764 1,972 23138.3 80.3 28.961.7 16.4 48.9
.. 0.8 0.33.6 4.0 0.3
–65.4 148.9 –36.268 61 6017 97 19
2,824 4,582 5,606
13.5 10.2 5.655 74 93
100 88 64100 81 56100 96 85
.. 59 35
.. 54 32
.. 64 44
12.0..
55 26 118
.. 46.5 ..
.. 10.3 7.2
.. 2.1 3.2
.. 3.3 1.2
.. 0.3 1.3
.. 0.0 1.4
.. 1.0 0.3
.. 0.7 0.3
.. 33.1 ..
Population (millions) 24 Land area (1,000 sq. km) 120 GDP ($ billions) ..
Korea, Dem. Rep.
GNI per capita, World Bank Atlas method ($)Adjusted Net National Income per capita ($)Urban population (% of total)Urban population growth (average annual %, 1990-2009) AgricultureAgricultural land (% land area)Agricultural productivity, value added per worker (2000 $)Food production index (1999-2001=100)Population density, rural (people/ sq. km of arable land) Forests and biodiversityForest area (% land area)Deforestation (average annual %, 1990-2010)Nationally terrestrial protected area (% of land area)Threatened species, mammalsThreatened species, birdsThreatened species, fishThreatened species, higher plantsGEF benefits index for biodiversity (0-100, median is 1.5) EnergyGDP per unit of energy use (2005 PPP $/kg oil equivalent)Energy use per capita (kg oil equivalent)Energy from biomass products and waste (% of total)Electric power consumption per capita (kWh)Electricity generated using fossil fuel (% of total)Electricity generated by hydropower (% of total) Emissions and pollutionCO2 emissions per unit of GDP (kg/2005 PPP $)CO2 emissions per capita (metric tons)CO2 emissions growth (%, 1990–2007)Particulate matter (urban-pop.-weighted avg., μg/cu. m)Road sector energy use per capita (kg oil equivalent) Water and sanitationInternal freshwater resources per capita (cu. m)Freshwater withdrawal
Total (% of internal resources)Agriculture (% of total freshwater withdrawal)
Access to improved water source (% of total population)Rural (% of rural population)Urban (% of urban population)
Access to improved sanitation (% of total population)Rural (% of rural population)Urban (% of urban population)
Environment and healthAcute resp. infection prevalence (% of children under five)Diarrhea prevalence (% of children under five)Under-five mortality rate (per 1,000 live births) National accounting aggregates—savings, depletion and degradationGross savings (% of GNI)Consumption of fixed capital (% of GNI)Education expenditure (% of GNI)Energy depletion (% of GNI)Mineral depletion (% of GNI)Net forest depletion (% of GNI)CO2 damage (% of GNI)Particulate emissions damage (% of GNI)Adjusted net savings (% of GNI)
120 2011 The Little Green Data Book
Country data
High-income group
Population (millions) 49 Land area (1,000 sq. km) 97 GDP ($ billions) 832.5
19,830 37,99014,879 31,467
81.7 77.31.2 1.0
19 3717,728 25,774
101 106580 331
64.2 28.90.1 –0.12.4 13.4
930173
1.7
5.5 6.64,669 5,131
1.3 3.98,853 9,518
65.0 62.90.7 11.3
0.4 0.410.4 12.5
108.2 17.931 24
559 964
1,338 9,031
39.3 10.562 4298 10088 98
100 100100 99100 98100 100
..
..5 7
30.1 16.113.3 14.1
3.9 4.60.0 0.90.0 0.10.0 0.00.5 0.20.3 0.1
20.0 5.2
Korea, Rep.
GNI per capita, World Bank Atlas method ($)Adjusted Net National Income per capita ($)Urban population (% of total)Urban population growth (average annual %, 1990-2009) AgricultureAgricultural land (% land area)Agricultural productivity, value added per worker (2000 $)Food production index (1999-2001=100)Population density, rural (people/ sq. km of arable land) Forests and biodiversityForest area (% land area)Deforestation (average annual %, 1990-2010)Nationally terrestrial protected area (% of land area)Threatened species, mammalsThreatened species, birdsThreatened species, fishThreatened species, higher plantsGEF benefits index for biodiversity (0-100, median is 1.5) EnergyGDP per unit of energy use (2005 PPP $/kg oil equivalent)Energy use per capita (kg oil equivalent)Energy from biomass products and waste (% of total)Electric power consumption per capita (kWh)Electricity generated using fossil fuel (% of total)Electricity generated by hydropower (% of total) Emissions and pollutionCO2 emissions per unit of GDP (kg/2005 PPP $)CO2 emissions per capita (metric tons)CO2 emissions growth (%, 1990–2007)Particulate matter (urban-pop.-weighted avg., μg/cu. m)Road sector energy use per capita (kg oil equivalent) Water and sanitationInternal freshwater resources per capita (cu. m)Freshwater withdrawal
Total (% of internal resources)Agriculture (% of total freshwater withdrawal)
Access to improved water source (% of total population)Rural (% of rural population)Urban (% of urban population)
Access to improved sanitation (% of total population)Rural (% of rural population)Urban (% of urban population)
Environment and healthAcute resp. infection prevalence (% of children under five)Diarrhea prevalence (% of children under five)Under-five mortality rate (per 1,000 live births) National accounting aggregates—savings, depletion and degradationGross savings (% of GNI)Consumption of fixed capital (% of GNI)Education expenditure (% of GNI)Energy depletion (% of GNI)Mineral depletion (% of GNI)Net forest depletion (% of GNI)CO2 damage (% of GNI)Particulate emissions damage (% of GNI)Adjusted net savings (% of GNI)
121The Little Green Data Book 2011
Country data
Europe & Central
Asia group
Lower middle-income group
Population (millions) 1.8 Land area (1,000 sq. km) 10.9 GDP ($ billions) 5.4
GNI per capita, World Bank Atlas method ($)Adjusted Net National Income per capita ($)Urban population (% of total)Urban population growth (average annual %, 1990-2009) AgricultureAgricultural land (% land area)Agricultural productivity, value added per worker (2000 $)Food production index (1999-2001=100)Population density, rural (people/ sq. km of arable land) Forests and biodiversityForest area (% land area)Deforestation (average annual %, 1990-2010)Nationally terrestrial protected area (% of land area)Threatened species, mammalsThreatened species, birdsThreatened species, fishThreatened species, higher plantsGEF benefits index for biodiversity (0-100, median is 1.5) EnergyGDP per unit of energy use (2005 PPP $/kg oil equivalent)Energy use per capita (kg oil equivalent)Energy from biomass products and waste (% of total)Electric power consumption per capita (kWh)Electricity generated using fossil fuel (% of total)Electricity generated by hydropower (% of total) Emissions and pollutionCO2 emissions per unit of GDP (kg/2005 PPP $)CO2 emissions per capita (metric tons)CO2 emissions growth (%, 1990–2007)Particulate matter (urban-pop.-weighted avg., μg/cu. m)Road sector energy use per capita (kg oil equivalent) Water and sanitationInternal freshwater resources per capita (cu. m)Freshwater withdrawal
Total (% of internal resources)Agriculture (% of total freshwater withdrawal)
Access to improved water source (% of total population)Rural (% of rural population)Urban (% of urban population)
Access to improved sanitation (% of total population)Rural (% of rural population)Urban (% of urban population)
Environment and healthAcute resp. infection prevalence (% of children under five)Diarrhea prevalence (% of children under five)Under-five mortality rate (per 1,000 live births) National accounting aggregates—savings, depletion and degradationGross savings (% of GNI)Consumption of fixed capital (% of GNI)Education expenditure (% of GNI)Energy depletion (% of GNI)Mineral depletion (% of GNI)Net forest depletion (% of GNI)CO2 damage (% of GNI)Particulate emissions damage (% of GNI)Adjusted net savings (% of GNI)
122 2011 The Little Green Data Book
KuwaitPopulation (millions) 2.8 Land area (1,000 sq. km) 17.8 GDP ($ billions) 148.0
Country data
High-income group
.. 37,99033,479 31,467
98.4 77.31.5 1.0
8 3714,486 25,774
114 106392 331
0.3 28.9–2.3 –0.11.6 13.4
69
110
0.1
4.8 6.69,637 5,131
0.0 3.916,747 9,518100.0 62.9
0.0 11.3
0.7 0.432.3 12.5
111.4 17.995 24
1,343 964
0 9,031
.. 10.554 4299 10099 9899 100
100 99100 98100 100
9.910.2
10 7
.. 16.1
.. 14.13.2 4.6
.. 0.9
.. 0.10.0 0.0
.. 0.20.3 0.1
.. 5.2
GNI per capita, World Bank Atlas method ($)Adjusted Net National Income per capita ($)Urban population (% of total)Urban population growth (average annual %, 1990-2009) AgricultureAgricultural land (% land area)Agricultural productivity, value added per worker (2000 $)Food production index (1999-2001=100)Population density, rural (people/ sq. km of arable land) Forests and biodiversityForest area (% land area)Deforestation (average annual %, 1990-2010)Nationally terrestrial protected area (% of land area)Threatened species, mammalsThreatened species, birdsThreatened species, fishThreatened species, higher plantsGEF benefits index for biodiversity (0-100, median is 1.5) EnergyGDP per unit of energy use (2005 PPP $/kg oil equivalent)Energy use per capita (kg oil equivalent)Energy from biomass products and waste (% of total)Electric power consumption per capita (kWh)Electricity generated using fossil fuel (% of total)Electricity generated by hydropower (% of total) Emissions and pollutionCO2 emissions per unit of GDP (kg/2005 PPP $)CO2 emissions per capita (metric tons)CO2 emissions growth (%, 1990–2007)Particulate matter (urban-pop.-weighted avg., μg/cu. m)Road sector energy use per capita (kg oil equivalent) Water and sanitationInternal freshwater resources per capita (cu. m)Freshwater withdrawal
Total (% of internal resources)Agriculture (% of total freshwater withdrawal)
Access to improved water source (% of total population)Rural (% of rural population)Urban (% of urban population)
Access to improved sanitation (% of total population)Rural (% of rural population)Urban (% of urban population)
Environment and healthAcute resp. infection prevalence (% of children under five)Diarrhea prevalence (% of children under five)Under-five mortality rate (per 1,000 live births) National accounting aggregates—savings, depletion and degradationGross savings (% of GNI)Consumption of fixed capital (% of GNI)Education expenditure (% of GNI)Energy depletion (% of GNI)Mineral depletion (% of GNI)Net forest depletion (% of GNI)CO2 damage (% of GNI)Particulate emissions damage (% of GNI)Adjusted net savings (% of GNI)
123The Little Green Data Book 2011
Population (millions) 5.3 Land area (1,000 sq. km) 191.8 GDP ($ billions) 4.6
GNI per capita, World Bank Atlas method ($)Adjusted Net National Income per capita ($)Urban population (% of total)Urban population growth (average annual %, 1990-2009) AgricultureAgricultural land (% land area)Agricultural productivity, value added per worker (2000 $)Food production index (1999-2001=100)Population density, rural (people/ sq. km of arable land) Forests and biodiversityForest area (% land area)Deforestation (average annual %, 1990-2010)Nationally terrestrial protected area (% of land area)Threatened species, mammalsThreatened species, birdsThreatened species, fishThreatened species, higher plantsGEF benefits index for biodiversity (0-100, median is 1.5) EnergyGDP per unit of energy use (2005 PPP $/kg oil equivalent)Energy use per capita (kg oil equivalent)Energy from biomass products and waste (% of total)Electric power consumption per capita (kWh)Electricity generated using fossil fuel (% of total)Electricity generated by hydropower (% of total) Emissions and pollutionCO2 emissions per unit of GDP (kg/2005 PPP $)CO2 emissions per capita (metric tons)CO2 emissions growth (%, 1990–2007)Particulate matter (urban-pop.-weighted avg., μg/cu. m)Road sector energy use per capita (kg oil equivalent) Water and sanitationInternal freshwater resources per capita (cu. m)Freshwater withdrawal
Total (% of internal resources)Agriculture (% of total freshwater withdrawal)
Access to improved water source (% of total population)Rural (% of rural population)Urban (% of urban population)
Access to improved sanitation (% of total population)Rural (% of rural population)Urban (% of urban population)
Environment and healthAcute resp. infection prevalence (% of children under five)Diarrhea prevalence (% of children under five)Under-five mortality rate (per 1,000 live births) National accounting aggregates—savings, depletion and degradationGross savings (% of GNI)Consumption of fixed capital (% of GNI)Education expenditure (% of GNI)Energy depletion (% of GNI)Mineral depletion (% of GNI)Net forest depletion (% of GNI)CO2 damage (% of GNI)Particulate emissions damage (% of GNI)Adjusted net savings (% of GNI)
Population (millions) 6.3 Land area (1,000 sq. km) 230.8 GDP ($ billions) 5.9
GNI per capita, World Bank Atlas method ($)Adjusted Net National Income per capita ($)Urban population (% of total)Urban population growth (average annual %, 1990-2009) AgricultureAgricultural land (% land area)Agricultural productivity, value added per worker (2000 $)Food production index (1999-2001=100)Population density, rural (people/ sq. km of arable land) Forests and biodiversityForest area (% land area)Deforestation (average annual %, 1990-2010)Nationally terrestrial protected area (% of land area)Threatened species, mammalsThreatened species, birdsThreatened species, fishThreatened species, higher plantsGEF benefits index for biodiversity (0-100, median is 1.5) EnergyGDP per unit of energy use (2005 PPP $/kg oil equivalent)Energy use per capita (kg oil equivalent)Energy from biomass products and waste (% of total)Electric power consumption per capita (kWh)Electricity generated using fossil fuel (% of total)Electricity generated by hydropower (% of total) Emissions and pollutionCO2 emissions per unit of GDP (kg/2005 PPP $)CO2 emissions per capita (metric tons)CO2 emissions growth (%, 1990–2007)Particulate matter (urban-pop.-weighted avg., μg/cu. m)Road sector energy use per capita (kg oil equivalent) Water and sanitationInternal freshwater resources per capita (cu. m)Freshwater withdrawal
Total (% of internal resources)Agriculture (% of total freshwater withdrawal)
Access to improved water source (% of total population)Rural (% of rural population)Urban (% of urban population)
Access to improved sanitation (% of total population)Rural (% of rural population)Urban (% of urban population)
Environment and healthAcute resp. infection prevalence (% of children under five)Diarrhea prevalence (% of children under five)Under-five mortality rate (per 1,000 live births) National accounting aggregates—savings, depletion and degradationGross savings (% of GNI)Consumption of fixed capital (% of GNI)Education expenditure (% of GNI)Energy depletion (% of GNI)Mineral depletion (% of GNI)Net forest depletion (% of GNI)CO2 damage (% of GNI)Particulate emissions damage (% of GNI)Adjusted net savings (% of GNI)
Population (millions) 2.3 Land area (1,000 sq. km) 62.2 GDP ($ billions) 26.2
Latvia
GNI per capita, World Bank Atlas method ($)Adjusted Net National Income per capita ($)Urban population (% of total)Urban population growth (average annual %, 1990-2009) AgricultureAgricultural land (% land area)Agricultural productivity, value added per worker (2000 $)Food production index (1999-2001=100)Population density, rural (people/ sq. km of arable land) Forests and biodiversityForest area (% land area)Deforestation (average annual %, 1990-2010)Nationally terrestrial protected area (% of land area)Threatened species, mammalsThreatened species, birdsThreatened species, fishThreatened species, higher plantsGEF benefits index for biodiversity (0-100, median is 1.5) EnergyGDP per unit of energy use (2005 PPP $/kg oil equivalent)Energy use per capita (kg oil equivalent)Energy from biomass products and waste (% of total)Electric power consumption per capita (kWh)Electricity generated using fossil fuel (% of total)Electricity generated by hydropower (% of total) Emissions and pollutionCO2 emissions per unit of GDP (kg/2005 PPP $)CO2 emissions per capita (metric tons)CO2 emissions growth (%, 1990–2007)Particulate matter (urban-pop.-weighted avg., μg/cu. m)Road sector energy use per capita (kg oil equivalent) Water and sanitationInternal freshwater resources per capita (cu. m)Freshwater withdrawal
Total (% of internal resources)Agriculture (% of total freshwater withdrawal)
Access to improved water source (% of total population)Rural (% of rural population)Urban (% of urban population)
Access to improved sanitation (% of total population)Rural (% of rural population)Urban (% of urban population)
Environment and healthAcute resp. infection prevalence (% of children under five)Diarrhea prevalence (% of children under five)Under-five mortality rate (per 1,000 live births) National accounting aggregates—savings, depletion and degradationGross savings (% of GNI)Consumption of fixed capital (% of GNI)Education expenditure (% of GNI)Energy depletion (% of GNI)Mineral depletion (% of GNI)Net forest depletion (% of GNI)CO2 damage (% of GNI)Particulate emissions damage (% of GNI)Adjusted net savings (% of GNI)
Population (millions) 4.2 Land area (1,000 sq. km) 10.2 GDP ($ billions) 34.5
GNI per capita, World Bank Atlas method ($)Adjusted Net National Income per capita ($)Urban population (% of total)Urban population growth (average annual %, 1990-2009) AgricultureAgricultural land (% land area)Agricultural productivity, value added per worker (2000 $)Food production index (1999-2001=100)Population density, rural (people/ sq. km of arable land) Forests and biodiversityForest area (% land area)Deforestation (average annual %, 1990-2010)Nationally terrestrial protected area (% of land area)Threatened species, mammalsThreatened species, birdsThreatened species, fishThreatened species, higher plantsGEF benefits index for biodiversity (0-100, median is 1.5) EnergyGDP per unit of energy use (2005 PPP $/kg oil equivalent)Energy use per capita (kg oil equivalent)Energy from biomass products and waste (% of total)Electric power consumption per capita (kWh)Electricity generated using fossil fuel (% of total)Electricity generated by hydropower (% of total) Emissions and pollutionCO2 emissions per unit of GDP (kg/2005 PPP $)CO2 emissions per capita (metric tons)CO2 emissions growth (%, 1990–2007)Particulate matter (urban-pop.-weighted avg., μg/cu. m)Road sector energy use per capita (kg oil equivalent) Water and sanitationInternal freshwater resources per capita (cu. m)Freshwater withdrawal
Total (% of internal resources)Agriculture (% of total freshwater withdrawal)
Access to improved water source (% of total population)Rural (% of rural population)Urban (% of urban population)
Access to improved sanitation (% of total population)Rural (% of rural population)Urban (% of urban population)
Environment and healthAcute resp. infection prevalence (% of children under five)Diarrhea prevalence (% of children under five)Under-five mortality rate (per 1,000 live births) National accounting aggregates—savings, depletion and degradationGross savings (% of GNI)Consumption of fixed capital (% of GNI)Education expenditure (% of GNI)Energy depletion (% of GNI)Mineral depletion (% of GNI)Net forest depletion (% of GNI)CO2 damage (% of GNI)Particulate emissions damage (% of GNI)Adjusted net savings (% of GNI)
Population (millions) 2.1 Land area (1,000 sq. km) 30.4 GDP ($ billions) 1.6
Country data
Sub-Saharan Africa group
Lower middle-income group
Lesotho
GNI per capita, World Bank Atlas method ($)Adjusted Net National Income per capita ($)Urban population (% of total)Urban population growth (average annual %, 1990-2009) AgricultureAgricultural land (% land area)Agricultural productivity, value added per worker (2000 $)Food production index (1999-2001=100)Population density, rural (people/ sq. km of arable land) Forests and biodiversityForest area (% land area)Deforestation (average annual %, 1990-2010)Nationally terrestrial protected area (% of land area)Threatened species, mammalsThreatened species, birdsThreatened species, fishThreatened species, higher plantsGEF benefits index for biodiversity (0-100, median is 1.5) EnergyGDP per unit of energy use (2005 PPP $/kg oil equivalent)Energy use per capita (kg oil equivalent)Energy from biomass products and waste (% of total)Electric power consumption per capita (kWh)Electricity generated using fossil fuel (% of total)Electricity generated by hydropower (% of total) Emissions and pollutionCO2 emissions per unit of GDP (kg/2005 PPP $)CO2 emissions per capita (metric tons)CO2 emissions growth (%, 1990–2007)Particulate matter (urban-pop.-weighted avg., μg/cu. m)Road sector energy use per capita (kg oil equivalent) Water and sanitationInternal freshwater resources per capita (cu. m)Freshwater withdrawal
Total (% of internal resources)Agriculture (% of total freshwater withdrawal)
Access to improved water source (% of total population)Rural (% of rural population)Urban (% of urban population)
Access to improved sanitation (% of total population)Rural (% of rural population)Urban (% of urban population)
Environment and healthAcute resp. infection prevalence (% of children under five)Diarrhea prevalence (% of children under five)Under-five mortality rate (per 1,000 live births) National accounting aggregates—savings, depletion and degradationGross savings (% of GNI)Consumption of fixed capital (% of GNI)Education expenditure (% of GNI)Energy depletion (% of GNI)Mineral depletion (% of GNI)Net forest depletion (% of GNI)CO2 damage (% of GNI)Particulate emissions damage (% of GNI)Adjusted net savings (% of GNI)
Population (millions) 4.0 Land area (1,000 sq. km) 96.3 GDP ($ millions) 876
GNI per capita, World Bank Atlas method ($)Adjusted Net National Income per capita ($)Urban population (% of total)Urban population growth (average annual %, 1990-2009) AgricultureAgricultural land (% land area)Agricultural productivity, value added per worker (2000 $)Food production index (1999-2001=100)Population density, rural (people/ sq. km of arable land) Forests and biodiversityForest area (% land area)Deforestation (average annual %, 1990-2010)Nationally terrestrial protected area (% of land area)Threatened species, mammalsThreatened species, birdsThreatened species, fishThreatened species, higher plantsGEF benefits index for biodiversity (0-100, median is 1.5) EnergyGDP per unit of energy use (2005 PPP $/kg oil equivalent)Energy use per capita (kg oil equivalent)Energy from biomass products and waste (% of total)Electric power consumption per capita (kWh)Electricity generated using fossil fuel (% of total)Electricity generated by hydropower (% of total) Emissions and pollutionCO2 emissions per unit of GDP (kg/2005 PPP $)CO2 emissions per capita (metric tons)CO2 emissions growth (%, 1990–2007)Particulate matter (urban-pop.-weighted avg., μg/cu. m)Road sector energy use per capita (kg oil equivalent) Water and sanitationInternal freshwater resources per capita (cu. m)Freshwater withdrawal
Total (% of internal resources)Agriculture (% of total freshwater withdrawal)
Access to improved water source (% of total population)Rural (% of rural population)Urban (% of urban population)
Access to improved sanitation (% of total population)Rural (% of rural population)Urban (% of urban population)
Environment and healthAcute resp. infection prevalence (% of children under five)Diarrhea prevalence (% of children under five)Under-five mortality rate (per 1,000 live births) National accounting aggregates—savings, depletion and degradationGross savings (% of GNI)Consumption of fixed capital (% of GNI)Education expenditure (% of GNI)Energy depletion (% of GNI)Mineral depletion (% of GNI)Net forest depletion (% of GNI)CO2 damage (% of GNI)Particulate emissions damage (% of GNI)Adjusted net savings (% of GNI)
Population (millions) 6.4 Land area (1,000 sq. km) 1,759.5 GDP ($ billions) 62.4
Country data
Middle East &
N. Africa group
Upper middle-income group
Libya
GNI per capita, World Bank Atlas method ($)Adjusted Net National Income per capita ($)Urban population (% of total)Urban population growth (average annual %, 1990-2009) AgricultureAgricultural land (% land area)Agricultural productivity, value added per worker (2000 $)Food production index (1999-2001=100)Population density, rural (people/ sq. km of arable land) Forests and biodiversityForest area (% land area)Deforestation (average annual %, 1990-2010)Nationally terrestrial protected area (% of land area)Threatened species, mammalsThreatened species, birdsThreatened species, fishThreatened species, higher plantsGEF benefits index for biodiversity (0-100, median is 1.5) EnergyGDP per unit of energy use (2005 PPP $/kg oil equivalent)Energy use per capita (kg oil equivalent)Energy from biomass products and waste (% of total)Electric power consumption per capita (kWh)Electricity generated using fossil fuel (% of total)Electricity generated by hydropower (% of total) Emissions and pollutionCO2 emissions per unit of GDP (kg/2005 PPP $)CO2 emissions per capita (metric tons)CO2 emissions growth (%, 1990–2007)Particulate matter (urban-pop.-weighted avg., μg/cu. m)Road sector energy use per capita (kg oil equivalent) Water and sanitationInternal freshwater resources per capita (cu. m)Freshwater withdrawal
Total (% of internal resources)Agriculture (% of total freshwater withdrawal)
Access to improved water source (% of total population)Rural (% of rural population)Urban (% of urban population)
Access to improved sanitation (% of total population)Rural (% of rural population)Urban (% of urban population)
Environment and healthAcute resp. infection prevalence (% of children under five)Diarrhea prevalence (% of children under five)Under-five mortality rate (per 1,000 live births) National accounting aggregates—savings, depletion and degradationGross savings (% of GNI)Consumption of fixed capital (% of GNI)Education expenditure (% of GNI)Energy depletion (% of GNI)Mineral depletion (% of GNI)Net forest depletion (% of GNI)CO2 damage (% of GNI)Particulate emissions damage (% of GNI)Adjusted net savings (% of GNI)
130 2011 The Little Green Data Book
136,630 37,990.. 31,467
14.3 77.30.2 1.0
38 37.. 25,774
96 106795 331
43.8 28.90.0 –0.1
42.4 13.40000
0.0
.. 6.6
.. 5,131
.. 3.9
.. 9,518
.. 62.9
.. 11.3
.. 0.4
.. 12.5
.. 17.917 24.. 964
.. 9,031
.. 10.5
.. 42
.. 100
.. 98
.. 100
.. 99
.. 98
.. 100
..
..2 7
.. 16.1
.. 14.12.3 4.60.0 0.90.0 0.1
.. 0.00.0 0.2
.. 0.1
.. 5.2
Population (thousands) 36 Land area (1,000 sq. km) 0.2 GDP ($ billions) 4.8
Country data
High-income group
Liechtenstein
GNI per capita, World Bank Atlas method ($)Adjusted Net National Income per capita ($)Urban population (% of total)Urban population growth (average annual %, 1990-2009) AgricultureAgricultural land (% land area)Agricultural productivity, value added per worker (2000 $)Food production index (1999-2001=100)Population density, rural (people/ sq. km of arable land) Forests and biodiversityForest area (% land area)Deforestation (average annual %, 1990-2010)Nationally terrestrial protected area (% of land area)Threatened species, mammalsThreatened species, birdsThreatened species, fishThreatened species, higher plantsGEF benefits index for biodiversity (0-100, median is 1.5) EnergyGDP per unit of energy use (2005 PPP $/kg oil equivalent)Energy use per capita (kg oil equivalent)Energy from biomass products and waste (% of total)Electric power consumption per capita (kWh)Electricity generated using fossil fuel (% of total)Electricity generated by hydropower (% of total) Emissions and pollutionCO2 emissions per unit of GDP (kg/2005 PPP $)CO2 emissions per capita (metric tons)CO2 emissions growth (%, 1990–2007)Particulate matter (urban-pop.-weighted avg., μg/cu. m)Road sector energy use per capita (kg oil equivalent) Water and sanitationInternal freshwater resources per capita (cu. m)Freshwater withdrawal
Total (% of internal resources)Agriculture (% of total freshwater withdrawal)
Access to improved water source (% of total population)Rural (% of rural population)Urban (% of urban population)
Access to improved sanitation (% of total population)Rural (% of rural population)Urban (% of urban population)
Environment and healthAcute resp. infection prevalence (% of children under five)Diarrhea prevalence (% of children under five)Under-five mortality rate (per 1,000 live births) National accounting aggregates—savings, depletion and degradationGross savings (% of GNI)Consumption of fixed capital (% of GNI)Education expenditure (% of GNI)Energy depletion (% of GNI)Mineral depletion (% of GNI)Net forest depletion (% of GNI)CO2 damage (% of GNI)Particulate emissions damage (% of GNI)Adjusted net savings (% of GNI)
Population (millions) 3.3 Land area (1,000 sq. km) 62.7 GDP ($ billions) 37.2
Lithuania
GNI per capita, World Bank Atlas method ($)Adjusted Net National Income per capita ($)Urban population (% of total)Urban population growth (average annual %, 1990-2009) AgricultureAgricultural land (% land area)Agricultural productivity, value added per worker (2000 $)Food production index (1999-2001=100)Population density, rural (people/ sq. km of arable land) Forests and biodiversityForest area (% land area)Deforestation (average annual %, 1990-2010)Nationally terrestrial protected area (% of land area)Threatened species, mammalsThreatened species, birdsThreatened species, fishThreatened species, higher plantsGEF benefits index for biodiversity (0-100, median is 1.5) EnergyGDP per unit of energy use (2005 PPP $/kg oil equivalent)Energy use per capita (kg oil equivalent)Energy from biomass products and waste (% of total)Electric power consumption per capita (kWh)Electricity generated using fossil fuel (% of total)Electricity generated by hydropower (% of total) Emissions and pollutionCO2 emissions per unit of GDP (kg/2005 PPP $)CO2 emissions per capita (metric tons)CO2 emissions growth (%, 1990–2007)Particulate matter (urban-pop.-weighted avg., μg/cu. m)Road sector energy use per capita (kg oil equivalent) Water and sanitationInternal freshwater resources per capita (cu. m)Freshwater withdrawal
Total (% of internal resources)Agriculture (% of total freshwater withdrawal)
Access to improved water source (% of total population)Rural (% of rural population)Urban (% of urban population)
Access to improved sanitation (% of total population)Rural (% of rural population)Urban (% of urban population)
Environment and healthAcute resp. infection prevalence (% of children under five)Diarrhea prevalence (% of children under five)Under-five mortality rate (per 1,000 live births) National accounting aggregates—savings, depletion and degradationGross savings (% of GNI)Consumption of fixed capital (% of GNI)Education expenditure (% of GNI)Energy depletion (% of GNI)Mineral depletion (% of GNI)Net forest depletion (% of GNI)CO2 damage (% of GNI)Particulate emissions damage (% of GNI)Adjusted net savings (% of GNI)
Population (thousands) 496 Land area (1,000 sq. km) 3 GDP ($ billions) 52.3
Luxembourg
GNI per capita, World Bank Atlas method ($)Adjusted Net National Income per capita ($)Urban population (% of total)Urban population growth (average annual %, 1990-2009) AgricultureAgricultural land (% land area)Agricultural productivity, value added per worker (2000 $)Food production index (1999-2001=100)Population density, rural (people/ sq. km of arable land) Forests and biodiversityForest area (% land area)Deforestation (average annual %, 1990-2010)Nationally terrestrial protected area (% of land area)Threatened species, mammalsThreatened species, birdsThreatened species, fishThreatened species, higher plantsGEF benefits index for biodiversity (0-100, median is 1.5) EnergyGDP per unit of energy use (2005 PPP $/kg oil equivalent)Energy use per capita (kg oil equivalent)Energy from biomass products and waste (% of total)Electric power consumption per capita (kWh)Electricity generated using fossil fuel (% of total)Electricity generated by hydropower (% of total) Emissions and pollutionCO2 emissions per unit of GDP (kg/2005 PPP $)CO2 emissions per capita (metric tons)CO2 emissions growth (%, 1990–2007)Particulate matter (urban-pop.-weighted avg., μg/cu. m)Road sector energy use per capita (kg oil equivalent) Water and sanitationInternal freshwater resources per capita (cu. m)Freshwater withdrawal
Total (% of internal resources)Agriculture (% of total freshwater withdrawal)
Access to improved water source (% of total population)Rural (% of rural population)Urban (% of urban population)
Access to improved sanitation (% of total population)Rural (% of rural population)Urban (% of urban population)
Environment and healthAcute resp. infection prevalence (% of children under five)Diarrhea prevalence (% of children under five)Under-five mortality rate (per 1,000 live births) National accounting aggregates—savings, depletion and degradationGross savings (% of GNI)Consumption of fixed capital (% of GNI)Education expenditure (% of GNI)Energy depletion (% of GNI)Mineral depletion (% of GNI)Net forest depletion (% of GNI)CO2 damage (% of GNI)Particulate emissions damage (% of GNI)Adjusted net savings (% of GNI)
133The Little Green Data Book 2011
39,550 37,990.. 31,467
100.0 77.32.0 1.0
.. 37
.. 25,774
.. 106
.. 331
.. 28.9
.. –0.1
.. 13.40450..
.. 6.6
.. 5,131
.. 3.9
.. 9,518
.. 62.9
.. 11.3
0.06 0.373.0 12.5
50.4 17.9.. 24.. 964
.. 9,031
.. 10.5
.. 42
.. 100
.. 98
.. 100
.. 99
.. 98
.. 100
..
..
.. 7
.. 16.1
.. 14.12.2 4.60.0 0.90.0 0.1
.. 0.00.1 0.2
.. 0.1
.. 5.2
Country data
High-income group
Population (thousands) 538 Land area (sq. km) 28 GDP ($ billions) 21.7
Macao SAR, China
GNI per capita, World Bank Atlas method ($)Adjusted Net National Income per capita ($)Urban population (% of total)Urban population growth (average annual %, 1990-2009) AgricultureAgricultural land (% land area)Agricultural productivity, value added per worker (2000 $)Food production index (1999-2001=100)Population density, rural (people/ sq. km of arable land) Forests and biodiversityForest area (% land area)Deforestation (average annual %, 1990-2010)Nationally terrestrial protected area (% of land area)Threatened species, mammalsThreatened species, birdsThreatened species, fishThreatened species, higher plantsGEF benefits index for biodiversity (0-100, median is 1.5) EnergyGDP per unit of energy use (2005 PPP $/kg oil equivalent)Energy use per capita (kg oil equivalent)Energy from biomass products and waste (% of total)Electric power consumption per capita (kWh)Electricity generated using fossil fuel (% of total)Electricity generated by hydropower (% of total) Emissions and pollutionCO2 emissions per unit of GDP (kg/2005 PPP $)CO2 emissions per capita (metric tons)CO2 emissions growth (%, 1990–2007)Particulate matter (urban-pop.-weighted avg., μg/cu. m)Road sector energy use per capita (kg oil equivalent) Water and sanitationInternal freshwater resources per capita (cu. m)Freshwater withdrawal
Total (% of internal resources)Agriculture (% of total freshwater withdrawal)
Access to improved water source (% of total population)Rural (% of rural population)Urban (% of urban population)
Access to improved sanitation (% of total population)Rural (% of rural population)Urban (% of urban population)
Environment and healthAcute resp. infection prevalence (% of children under five)Diarrhea prevalence (% of children under five)Under-five mortality rate (per 1,000 live births) National accounting aggregates—savings, depletion and degradationGross savings (% of GNI)Consumption of fixed capital (% of GNI)Education expenditure (% of GNI)Energy depletion (% of GNI)Mineral depletion (% of GNI)Net forest depletion (% of GNI)CO2 damage (% of GNI)Particulate emissions damage (% of GNI)Adjusted net savings (% of GNI)
Population (millions) 2.0 Land area (1,000 sq. km) 25.2 GDP ($ billions) 9.2
Country data
Europe & Central
Asia group
Upper middle-income group
Macedonia, FYR
GNI per capita, World Bank Atlas method ($)Adjusted Net National Income per capita ($)Urban population (% of total)Urban population growth (average annual %, 1990-2009) AgricultureAgricultural land (% land area)Agricultural productivity, value added per worker (2000 $)Food production index (1999-2001=100)Population density, rural (people/ sq. km of arable land) Forests and biodiversityForest area (% land area)Deforestation (average annual %, 1990-2010)Nationally terrestrial protected area (% of land area)Threatened species, mammalsThreatened species, birdsThreatened species, fishThreatened species, higher plantsGEF benefits index for biodiversity (0-100, median is 1.5) EnergyGDP per unit of energy use (2005 PPP $/kg oil equivalent)Energy use per capita (kg oil equivalent)Energy from biomass products and waste (% of total)Electric power consumption per capita (kWh)Electricity generated using fossil fuel (% of total)Electricity generated by hydropower (% of total) Emissions and pollutionCO2 emissions per unit of GDP (kg/2005 PPP $)CO2 emissions per capita (metric tons)CO2 emissions growth (%, 1990–2007)Particulate matter (urban-pop.-weighted avg., μg/cu. m)Road sector energy use per capita (kg oil equivalent) Water and sanitationInternal freshwater resources per capita (cu. m)Freshwater withdrawal
Total (% of internal resources)Agriculture (% of total freshwater withdrawal)
Access to improved water source (% of total population)Rural (% of rural population)Urban (% of urban population)
Access to improved sanitation (% of total population)Rural (% of rural population)Urban (% of urban population)
Environment and healthAcute resp. infection prevalence (% of children under five)Diarrhea prevalence (% of children under five)Under-five mortality rate (per 1,000 live births) National accounting aggregates—savings, depletion and degradationGross savings (% of GNI)Consumption of fixed capital (% of GNI)Education expenditure (% of GNI)Energy depletion (% of GNI)Mineral depletion (% of GNI)Net forest depletion (% of GNI)CO2 damage (% of GNI)Particulate emissions damage (% of GNI)Adjusted net savings (% of GNI)
Population (millions) 20 Land area (1,000 sq. km) 582 GDP ($ billions) 8.6
Country data
Sub-Saharan Africa group
Low-income group
Madagascar
GNI per capita, World Bank Atlas method ($)Adjusted Net National Income per capita ($)Urban population (% of total)Urban population growth (average annual %, 1990-2009) AgricultureAgricultural land (% land area)Agricultural productivity, value added per worker (2000 $)Food production index (1999-2001=100)Population density, rural (people/ sq. km of arable land) Forests and biodiversityForest area (% land area)Deforestation (average annual %, 1990-2010)Nationally terrestrial protected area (% of land area)Threatened species, mammalsThreatened species, birdsThreatened species, fishThreatened species, higher plantsGEF benefits index for biodiversity (0-100, median is 1.5) EnergyGDP per unit of energy use (2005 PPP $/kg oil equivalent)Energy use per capita (kg oil equivalent)Energy from biomass products and waste (% of total)Electric power consumption per capita (kWh)Electricity generated using fossil fuel (% of total)Electricity generated by hydropower (% of total) Emissions and pollutionCO2 emissions per unit of GDP (kg/2005 PPP $)CO2 emissions per capita (metric tons)CO2 emissions growth (%, 1990–2007)Particulate matter (urban-pop.-weighted avg., μg/cu. m)Road sector energy use per capita (kg oil equivalent) Water and sanitationInternal freshwater resources per capita (cu. m)Freshwater withdrawal
Total (% of internal resources)Agriculture (% of total freshwater withdrawal)
Access to improved water source (% of total population)Rural (% of rural population)Urban (% of urban population)
Access to improved sanitation (% of total population)Rural (% of rural population)Urban (% of urban population)
Environment and healthAcute resp. infection prevalence (% of children under five)Diarrhea prevalence (% of children under five)Under-five mortality rate (per 1,000 live births) National accounting aggregates—savings, depletion and degradationGross savings (% of GNI)Consumption of fixed capital (% of GNI)Education expenditure (% of GNI)Energy depletion (% of GNI)Mineral depletion (% of GNI)Net forest depletion (% of GNI)CO2 damage (% of GNI)Particulate emissions damage (% of GNI)Adjusted net savings (% of GNI)
Population (millions) 15 Land area (1,000 sq. km) 94 GDP ($ billions) 4.7
Malawi
GNI per capita, World Bank Atlas method ($)Adjusted Net National Income per capita ($)Urban population (% of total)Urban population growth (average annual %, 1990-2009) AgricultureAgricultural land (% land area)Agricultural productivity, value added per worker (2000 $)Food production index (1999-2001=100)Population density, rural (people/ sq. km of arable land) Forests and biodiversityForest area (% land area)Deforestation (average annual %, 1990-2010)Nationally terrestrial protected area (% of land area)Threatened species, mammalsThreatened species, birdsThreatened species, fishThreatened species, higher plantsGEF benefits index for biodiversity (0-100, median is 1.5) EnergyGDP per unit of energy use (2005 PPP $/kg oil equivalent)Energy use per capita (kg oil equivalent)Energy from biomass products and waste (% of total)Electric power consumption per capita (kWh)Electricity generated using fossil fuel (% of total)Electricity generated by hydropower (% of total) Emissions and pollutionCO2 emissions per unit of GDP (kg/2005 PPP $)CO2 emissions per capita (metric tons)CO2 emissions growth (%, 1990–2007)Particulate matter (urban-pop.-weighted avg., μg/cu. m)Road sector energy use per capita (kg oil equivalent) Water and sanitationInternal freshwater resources per capita (cu. m)Freshwater withdrawal
Total (% of internal resources)Agriculture (% of total freshwater withdrawal)
Access to improved water source (% of total population)Rural (% of rural population)Urban (% of urban population)
Access to improved sanitation (% of total population)Rural (% of rural population)Urban (% of urban population)
Environment and healthAcute resp. infection prevalence (% of children under five)Diarrhea prevalence (% of children under five)Under-five mortality rate (per 1,000 live births) National accounting aggregates—savings, depletion and degradationGross savings (% of GNI)Consumption of fixed capital (% of GNI)Education expenditure (% of GNI)Energy depletion (% of GNI)Mineral depletion (% of GNI)Net forest depletion (% of GNI)CO2 damage (% of GNI)Particulate emissions damage (% of GNI)Adjusted net savings (% of GNI)
Population (millions) 27 Land area (1,000 sq. km) 329 GDP ($ billions) 193.1
Malaysia
GNI per capita, World Bank Atlas method ($)Adjusted Net National Income per capita ($)Urban population (% of total)Urban population growth (average annual %, 1990-2009) AgricultureAgricultural land (% land area)Agricultural productivity, value added per worker (2000 $)Food production index (1999-2001=100)Population density, rural (people/ sq. km of arable land) Forests and biodiversityForest area (% land area)Deforestation (average annual %, 1990-2010)Nationally terrestrial protected area (% of land area)Threatened species, mammalsThreatened species, birdsThreatened species, fishThreatened species, higher plantsGEF benefits index for biodiversity (0-100, median is 1.5) EnergyGDP per unit of energy use (2005 PPP $/kg oil equivalent)Energy use per capita (kg oil equivalent)Energy from biomass products and waste (% of total)Electric power consumption per capita (kWh)Electricity generated using fossil fuel (% of total)Electricity generated by hydropower (% of total) Emissions and pollutionCO2 emissions per unit of GDP (kg/2005 PPP $)CO2 emissions per capita (metric tons)CO2 emissions growth (%, 1990–2007)Particulate matter (urban-pop.-weighted avg., μg/cu. m)Road sector energy use per capita (kg oil equivalent) Water and sanitationInternal freshwater resources per capita (cu. m)Freshwater withdrawal
Total (% of internal resources)Agriculture (% of total freshwater withdrawal)
Access to improved water source (% of total population)Rural (% of rural population)Urban (% of urban population)
Access to improved sanitation (% of total population)Rural (% of rural population)Urban (% of urban population)
Environment and healthAcute resp. infection prevalence (% of children under five)Diarrhea prevalence (% of children under five)Under-five mortality rate (per 1,000 live births) National accounting aggregates—savings, depletion and degradationGross savings (% of GNI)Consumption of fixed capital (% of GNI)Education expenditure (% of GNI)Energy depletion (% of GNI)Mineral depletion (% of GNI)Net forest depletion (% of GNI)CO2 damage (% of GNI)Particulate emissions damage (% of GNI)Adjusted net savings (% of GNI)
Population (thousands) 309 Land area (1,000 sq. km) 0.3 GDP ($ billions) 1.5
Maldives
GNI per capita, World Bank Atlas method ($)Adjusted Net National Income per capita ($)Urban population (% of total)Urban population growth (average annual %, 1990-2009) AgricultureAgricultural land (% land area)Agricultural productivity, value added per worker (2000 $)Food production index (1999-2001=100)Population density, rural (people/ sq. km of arable land) Forests and biodiversityForest area (% land area)Deforestation (average annual %, 1990-2010)Nationally terrestrial protected area (% of land area)Threatened species, mammalsThreatened species, birdsThreatened species, fishThreatened species, higher plantsGEF benefits index for biodiversity (0-100, median is 1.5) EnergyGDP per unit of energy use (2005 PPP $/kg oil equivalent)Energy use per capita (kg oil equivalent)Energy from biomass products and waste (% of total)Electric power consumption per capita (kWh)Electricity generated using fossil fuel (% of total)Electricity generated by hydropower (% of total) Emissions and pollutionCO2 emissions per unit of GDP (kg/2005 PPP $)CO2 emissions per capita (metric tons)CO2 emissions growth (%, 1990–2007)Particulate matter (urban-pop.-weighted avg., μg/cu. m)Road sector energy use per capita (kg oil equivalent) Water and sanitationInternal freshwater resources per capita (cu. m)Freshwater withdrawal
Total (% of internal resources)Agriculture (% of total freshwater withdrawal)
Access to improved water source (% of total population)Rural (% of rural population)Urban (% of urban population)
Access to improved sanitation (% of total population)Rural (% of rural population)Urban (% of urban population)
Environment and healthAcute resp. infection prevalence (% of children under five)Diarrhea prevalence (% of children under five)Under-five mortality rate (per 1,000 live births) National accounting aggregates—savings, depletion and degradationGross savings (% of GNI)Consumption of fixed capital (% of GNI)Education expenditure (% of GNI)Energy depletion (% of GNI)Mineral depletion (% of GNI)Net forest depletion (% of GNI)CO2 damage (% of GNI)Particulate emissions damage (% of GNI)Adjusted net savings (% of GNI)
Population (millions) 13 Land area (1,000 sq. km) 1,220 GDP ($ billions) 9.0
Country data
Sub-Saharan Africa group
Low-income group
Mali
GNI per capita, World Bank Atlas method ($)Adjusted Net National Income per capita ($)Urban population (% of total)Urban population growth (average annual %, 1990-2009) AgricultureAgricultural land (% land area)Agricultural productivity, value added per worker (2000 $)Food production index (1999-2001=100)Population density, rural (people/ sq. km of arable land) Forests and biodiversityForest area (% land area)Deforestation (average annual %, 1990-2010)Nationally terrestrial protected area (% of land area)Threatened species, mammalsThreatened species, birdsThreatened species, fishThreatened species, higher plantsGEF benefits index for biodiversity (0-100, median is 1.5) EnergyGDP per unit of energy use (2005 PPP $/kg oil equivalent)Energy use per capita (kg oil equivalent)Energy from biomass products and waste (% of total)Electric power consumption per capita (kWh)Electricity generated using fossil fuel (% of total)Electricity generated by hydropower (% of total) Emissions and pollutionCO2 emissions per unit of GDP (kg/2005 PPP $)CO2 emissions per capita (metric tons)CO2 emissions growth (%, 1990–2007)Particulate matter (urban-pop.-weighted avg., μg/cu. m)Road sector energy use per capita (kg oil equivalent) Water and sanitationInternal freshwater resources per capita (cu. m)Freshwater withdrawal
Total (% of internal resources)Agriculture (% of total freshwater withdrawal)
Access to improved water source (% of total population)Rural (% of rural population)Urban (% of urban population)
Access to improved sanitation (% of total population)Rural (% of rural population)Urban (% of urban population)
Environment and healthAcute resp. infection prevalence (% of children under five)Diarrhea prevalence (% of children under five)Under-five mortality rate (per 1,000 live births) National accounting aggregates—savings, depletion and degradationGross savings (% of GNI)Consumption of fixed capital (% of GNI)Education expenditure (% of GNI)Energy depletion (% of GNI)Mineral depletion (% of GNI)Net forest depletion (% of GNI)CO2 damage (% of GNI)Particulate emissions damage (% of GNI)Adjusted net savings (% of GNI)
140 2011 The Little Green Data Book
18,360 37,990.. 31,467
94.5 77.31.0 1.0
31 3736,900 25,774
86 106278 331
.. 28.9
.. –0.117.2 13.4
33
143
0.0
11.4 6.61,988 5,131
0.0 3.94,806 9,518100.0 62.9
0.0 11.3
0.3 0.46.7 12.5
25.1 17.9.. 24
432 964
123 9,031
53.5 10.522 42
100 100100 98100 100100 99100 98100 100
..
..7 7
.. 16.1
.. 14.16.2 4.60.0 0.90.0 0.1
.. 0.00.3 0.2
.. 0.1
.. 5.2
Country data
High-income group
Population (thousands) 415 Land area (1,000 sq. km) 0.3 GDP ($ billions) 8.0
Malta
GNI per capita, World Bank Atlas method ($)Adjusted Net National Income per capita ($)Urban population (% of total)Urban population growth (average annual %, 1990-2009) AgricultureAgricultural land (% land area)Agricultural productivity, value added per worker (2000 $)Food production index (1999-2001=100)Population density, rural (people/ sq. km of arable land) Forests and biodiversityForest area (% land area)Deforestation (average annual %, 1990-2010)Nationally terrestrial protected area (% of land area)Threatened species, mammalsThreatened species, birdsThreatened species, fishThreatened species, higher plantsGEF benefits index for biodiversity (0-100, median is 1.5) EnergyGDP per unit of energy use (2005 PPP $/kg oil equivalent)Energy use per capita (kg oil equivalent)Energy from biomass products and waste (% of total)Electric power consumption per capita (kWh)Electricity generated using fossil fuel (% of total)Electricity generated by hydropower (% of total) Emissions and pollutionCO2 emissions per unit of GDP (kg/2005 PPP $)CO2 emissions per capita (metric tons)CO2 emissions growth (%, 1990–2007)Particulate matter (urban-pop.-weighted avg., μg/cu. m)Road sector energy use per capita (kg oil equivalent) Water and sanitationInternal freshwater resources per capita (cu. m)Freshwater withdrawal
Total (% of internal resources)Agriculture (% of total freshwater withdrawal)
Access to improved water source (% of total population)Rural (% of rural population)Urban (% of urban population)
Access to improved sanitation (% of total population)Rural (% of rural population)Urban (% of urban population)
Environment and healthAcute resp. infection prevalence (% of children under five)Diarrhea prevalence (% of children under five)Under-five mortality rate (per 1,000 live births) National accounting aggregates—savings, depletion and degradationGross savings (% of GNI)Consumption of fixed capital (% of GNI)Education expenditure (% of GNI)Energy depletion (% of GNI)Mineral depletion (% of GNI)Net forest depletion (% of GNI)CO2 damage (% of GNI)Particulate emissions damage (% of GNI)Adjusted net savings (% of GNI)
Population (thousands) 61 Land area (1,000 sq. km) 0.2 GDP ($ millions) 153
Marshall Islands
GNI per capita, World Bank Atlas method ($)Adjusted Net National Income per capita ($)Urban population (% of total)Urban population growth (average annual %, 1990-2009) AgricultureAgricultural land (% land area)Agricultural productivity, value added per worker (2000 $)Food production index (1999-2001=100)Population density, rural (people/ sq. km of arable land) Forests and biodiversityForest area (% land area)Deforestation (average annual %, 1990-2010)Nationally terrestrial protected area (% of land area)Threatened species, mammalsThreatened species, birdsThreatened species, fishThreatened species, higher plantsGEF benefits index for biodiversity (0-100, median is 1.5) EnergyGDP per unit of energy use (2005 PPP $/kg oil equivalent)Energy use per capita (kg oil equivalent)Energy from biomass products and waste (% of total)Electric power consumption per capita (kWh)Electricity generated using fossil fuel (% of total)Electricity generated by hydropower (% of total) Emissions and pollutionCO2 emissions per unit of GDP (kg/2005 PPP $)CO2 emissions per capita (metric tons)CO2 emissions growth (%, 1990–2007)Particulate matter (urban-pop.-weighted avg., μg/cu. m)Road sector energy use per capita (kg oil equivalent) Water and sanitationInternal freshwater resources per capita (cu. m)Freshwater withdrawal
Total (% of internal resources)Agriculture (% of total freshwater withdrawal)
Access to improved water source (% of total population)Rural (% of rural population)Urban (% of urban population)
Access to improved sanitation (% of total population)Rural (% of rural population)Urban (% of urban population)
Environment and healthAcute resp. infection prevalence (% of children under five)Diarrhea prevalence (% of children under five)Under-five mortality rate (per 1,000 live births) National accounting aggregates—savings, depletion and degradationGross savings (% of GNI)Consumption of fixed capital (% of GNI)Education expenditure (% of GNI)Energy depletion (% of GNI)Mineral depletion (% of GNI)Net forest depletion (% of GNI)CO2 damage (% of GNI)Particulate emissions damage (% of GNI)Adjusted net savings (% of GNI)
Population (millions) 3.3 Land area (1,000 sq. km) 1,030.7 GDP ($ billions) 3.0
Country data
Sub-Saharan Africa group
Low-income group
Mauritania
GNI per capita, World Bank Atlas method ($)Adjusted Net National Income per capita ($)Urban population (% of total)Urban population growth (average annual %, 1990-2009) AgricultureAgricultural land (% land area)Agricultural productivity, value added per worker (2000 $)Food production index (1999-2001=100)Population density, rural (people/ sq. km of arable land) Forests and biodiversityForest area (% land area)Deforestation (average annual %, 1990-2010)Nationally terrestrial protected area (% of land area)Threatened species, mammalsThreatened species, birdsThreatened species, fishThreatened species, higher plantsGEF benefits index for biodiversity (0-100, median is 1.5) EnergyGDP per unit of energy use (2005 PPP $/kg oil equivalent)Energy use per capita (kg oil equivalent)Energy from biomass products and waste (% of total)Electric power consumption per capita (kWh)Electricity generated using fossil fuel (% of total)Electricity generated by hydropower (% of total) Emissions and pollutionCO2 emissions per unit of GDP (kg/2005 PPP $)CO2 emissions per capita (metric tons)CO2 emissions growth (%, 1990–2007)Particulate matter (urban-pop.-weighted avg., μg/cu. m)Road sector energy use per capita (kg oil equivalent) Water and sanitationInternal freshwater resources per capita (cu. m)Freshwater withdrawal
Total (% of internal resources)Agriculture (% of total freshwater withdrawal)
Access to improved water source (% of total population)Rural (% of rural population)Urban (% of urban population)
Access to improved sanitation (% of total population)Rural (% of rural population)Urban (% of urban population)
Environment and healthAcute resp. infection prevalence (% of children under five)Diarrhea prevalence (% of children under five)Under-five mortality rate (per 1,000 live births) National accounting aggregates—savings, depletion and degradationGross savings (% of GNI)Consumption of fixed capital (% of GNI)Education expenditure (% of GNI)Energy depletion (% of GNI)Mineral depletion (% of GNI)Net forest depletion (% of GNI)CO2 damage (% of GNI)Particulate emissions damage (% of GNI)Adjusted net savings (% of GNI)
Population (millions) 1.3 Land area (1,000 sq. km) 2.0 GDP ($ billions) 8.6
Country data
Sub-Saharan Africa group
Upper middle-income group
Mauritius
GNI per capita, World Bank Atlas method ($)Adjusted Net National Income per capita ($)Urban population (% of total)Urban population growth (average annual %, 1990-2009) AgricultureAgricultural land (% land area)Agricultural productivity, value added per worker (2000 $)Food production index (1999-2001=100)Population density, rural (people/ sq. km of arable land) Forests and biodiversityForest area (% land area)Deforestation (average annual %, 1990-2010)Nationally terrestrial protected area (% of land area)Threatened species, mammalsThreatened species, birdsThreatened species, fishThreatened species, higher plantsGEF benefits index for biodiversity (0-100, median is 1.5) EnergyGDP per unit of energy use (2005 PPP $/kg oil equivalent)Energy use per capita (kg oil equivalent)Energy from biomass products and waste (% of total)Electric power consumption per capita (kWh)Electricity generated using fossil fuel (% of total)Electricity generated by hydropower (% of total) Emissions and pollutionCO2 emissions per unit of GDP (kg/2005 PPP $)CO2 emissions per capita (metric tons)CO2 emissions growth (%, 1990–2007)Particulate matter (urban-pop.-weighted avg., μg/cu. m)Road sector energy use per capita (kg oil equivalent) Water and sanitationInternal freshwater resources per capita (cu. m)Freshwater withdrawal
Total (% of internal resources)Agriculture (% of total freshwater withdrawal)
Access to improved water source (% of total population)Rural (% of rural population)Urban (% of urban population)
Access to improved sanitation (% of total population)Rural (% of rural population)Urban (% of urban population)
Environment and healthAcute resp. infection prevalence (% of children under five)Diarrhea prevalence (% of children under five)Under-five mortality rate (per 1,000 live births) National accounting aggregates—savings, depletion and degradationGross savings (% of GNI)Consumption of fixed capital (% of GNI)Education expenditure (% of GNI)Energy depletion (% of GNI)Mineral depletion (% of GNI)Net forest depletion (% of GNI)CO2 damage (% of GNI)Particulate emissions damage (% of GNI)Adjusted net savings (% of GNI)
144 2011 The Little Green Data Book
.. 1,125 7,502
.. 861 5,773
.. 36.9 74.9
.. 4.0 1.6
54 45 30.. 314 3,671.. 130 129.. 356 153
37.8 28.0 37.20.8 0.3 0.12.2 11.7 13.0
1330
0.3
.. 3.2 5.2
.. 678 2,177
.. 57.7 6.8
.. 531 3,001
.. 66.2 64.7
.. 17.2 26.4
.. 0.4 0.5
.. 0.8 5.3
.. 46.1 3.8
.. 49 31
.. 57 320
.. 4,826 18,143
.. 3.2 3.2
.. 87 65
.. 60 95
.. 47 86
.. 82 98
.. 31 84
.. 24 67
.. 43 90
..
..
.. 130 22
.. 15.5 19.9
.. 10.6 11.8
.. 3.6 4.1
.. 7.5 6.4
.. 1.2 1.0
.. 0.6 0.0
.. 0.6 0.6
.. 0.3 0.2
.. –1.8 3.9
Population (thousands) 197 Land area (1,000 sq. km) 0.4 GDP ($ millions) ..
Country data
Sub-Saharan Africa group
Upper middle-income group
Mayotte
GNI per capita, World Bank Atlas method ($)Adjusted Net National Income per capita ($)Urban population (% of total)Urban population growth (average annual %, 1990-2009) AgricultureAgricultural land (% land area)Agricultural productivity, value added per worker (2000 $)Food production index (1999-2001=100)Population density, rural (people/ sq. km of arable land) Forests and biodiversityForest area (% land area)Deforestation (average annual %, 1990-2010)Nationally terrestrial protected area (% of land area)Threatened species, mammalsThreatened species, birdsThreatened species, fishThreatened species, higher plantsGEF benefits index for biodiversity (0-100, median is 1.5) EnergyGDP per unit of energy use (2005 PPP $/kg oil equivalent)Energy use per capita (kg oil equivalent)Energy from biomass products and waste (% of total)Electric power consumption per capita (kWh)Electricity generated using fossil fuel (% of total)Electricity generated by hydropower (% of total) Emissions and pollutionCO2 emissions per unit of GDP (kg/2005 PPP $)CO2 emissions per capita (metric tons)CO2 emissions growth (%, 1990–2007)Particulate matter (urban-pop.-weighted avg., μg/cu. m)Road sector energy use per capita (kg oil equivalent) Water and sanitationInternal freshwater resources per capita (cu. m)Freshwater withdrawal
Total (% of internal resources)Agriculture (% of total freshwater withdrawal)
Access to improved water source (% of total population)Rural (% of rural population)Urban (% of urban population)
Access to improved sanitation (% of total population)Rural (% of rural population)Urban (% of urban population)
Environment and healthAcute resp. infection prevalence (% of children under five)Diarrhea prevalence (% of children under five)Under-five mortality rate (per 1,000 live births) National accounting aggregates—savings, depletion and degradationGross savings (% of GNI)Consumption of fixed capital (% of GNI)Education expenditure (% of GNI)Energy depletion (% of GNI)Mineral depletion (% of GNI)Net forest depletion (% of GNI)CO2 damage (% of GNI)Particulate emissions damage (% of GNI)Adjusted net savings (% of GNI)
Population (millions) 107 Land area (1,000 sq. km) 1,944 GDP ($ billions) 874.8
Mexico
GNI per capita, World Bank Atlas method ($)Adjusted Net National Income per capita ($)Urban population (% of total)Urban population growth (average annual %, 1990-2009) AgricultureAgricultural land (% land area)Agricultural productivity, value added per worker (2000 $)Food production index (1999-2001=100)Population density, rural (people/ sq. km of arable land) Forests and biodiversityForest area (% land area)Deforestation (average annual %, 1990-2010)Nationally terrestrial protected area (% of land area)Threatened species, mammalsThreatened species, birdsThreatened species, fishThreatened species, higher plantsGEF benefits index for biodiversity (0-100, median is 1.5) EnergyGDP per unit of energy use (2005 PPP $/kg oil equivalent)Energy use per capita (kg oil equivalent)Energy from biomass products and waste (% of total)Electric power consumption per capita (kWh)Electricity generated using fossil fuel (% of total)Electricity generated by hydropower (% of total) Emissions and pollutionCO2 emissions per unit of GDP (kg/2005 PPP $)CO2 emissions per capita (metric tons)CO2 emissions growth (%, 1990–2007)Particulate matter (urban-pop.-weighted avg., μg/cu. m)Road sector energy use per capita (kg oil equivalent) Water and sanitationInternal freshwater resources per capita (cu. m)Freshwater withdrawal
Total (% of internal resources)Agriculture (% of total freshwater withdrawal)
Access to improved water source (% of total population)Rural (% of rural population)Urban (% of urban population)
Access to improved sanitation (% of total population)Rural (% of rural population)Urban (% of urban population)
Environment and healthAcute resp. infection prevalence (% of children under five)Diarrhea prevalence (% of children under five)Under-five mortality rate (per 1,000 live births) National accounting aggregates—savings, depletion and degradationGross savings (% of GNI)Consumption of fixed capital (% of GNI)Education expenditure (% of GNI)Energy depletion (% of GNI)Mineral depletion (% of GNI)Net forest depletion (% of GNI)CO2 damage (% of GNI)Particulate emissions damage (% of GNI)Adjusted net savings (% of GNI)
Population (thousands) 111 Land area (1,000 sq. km) 0.7 GDP ($ millions) 274
Country data
East Asia & Pacific
group
Lower middle-income group
Micronesia, Fed. Sts.
GNI per capita, World Bank Atlas method ($)Adjusted Net National Income per capita ($)Urban population (% of total)Urban population growth (average annual %, 1990-2009) AgricultureAgricultural land (% land area)Agricultural productivity, value added per worker (2000 $)Food production index (1999-2001=100)Population density, rural (people/ sq. km of arable land) Forests and biodiversityForest area (% land area)Deforestation (average annual %, 1990-2010)Nationally terrestrial protected area (% of land area)Threatened species, mammalsThreatened species, birdsThreatened species, fishThreatened species, higher plantsGEF benefits index for biodiversity (0-100, median is 1.5) EnergyGDP per unit of energy use (2005 PPP $/kg oil equivalent)Energy use per capita (kg oil equivalent)Energy from biomass products and waste (% of total)Electric power consumption per capita (kWh)Electricity generated using fossil fuel (% of total)Electricity generated by hydropower (% of total) Emissions and pollutionCO2 emissions per unit of GDP (kg/2005 PPP $)CO2 emissions per capita (metric tons)CO2 emissions growth (%, 1990–2007)Particulate matter (urban-pop.-weighted avg., μg/cu. m)Road sector energy use per capita (kg oil equivalent) Water and sanitationInternal freshwater resources per capita (cu. m)Freshwater withdrawal
Total (% of internal resources)Agriculture (% of total freshwater withdrawal)
Access to improved water source (% of total population)Rural (% of rural population)Urban (% of urban population)
Access to improved sanitation (% of total population)Rural (% of rural population)Urban (% of urban population)
Environment and healthAcute resp. infection prevalence (% of children under five)Diarrhea prevalence (% of children under five)Under-five mortality rate (per 1,000 live births) National accounting aggregates—savings, depletion and degradationGross savings (% of GNI)Consumption of fixed capital (% of GNI)Education expenditure (% of GNI)Energy depletion (% of GNI)Mineral depletion (% of GNI)Net forest depletion (% of GNI)CO2 damage (% of GNI)Particulate emissions damage (% of GNI)Adjusted net savings (% of GNI)
Population (millions) 3.6 Land area (1,000 sq. km) 32.9 GDP ($ billions) 5.4
Moldova
GNI per capita, World Bank Atlas method ($)Adjusted Net National Income per capita ($)Urban population (% of total)Urban population growth (average annual %, 1990-2009) AgricultureAgricultural land (% land area)Agricultural productivity, value added per worker (2000 $)Food production index (1999-2001=100)Population density, rural (people/ sq. km of arable land) Forests and biodiversityForest area (% land area)Deforestation (average annual %, 1990-2010)Nationally terrestrial protected area (% of land area)Threatened species, mammalsThreatened species, birdsThreatened species, fishThreatened species, higher plantsGEF benefits index for biodiversity (0-100, median is 1.5) EnergyGDP per unit of energy use (2005 PPP $/kg oil equivalent)Energy use per capita (kg oil equivalent)Energy from biomass products and waste (% of total)Electric power consumption per capita (kWh)Electricity generated using fossil fuel (% of total)Electricity generated by hydropower (% of total) Emissions and pollutionCO2 emissions per unit of GDP (kg/2005 PPP $)CO2 emissions per capita (metric tons)CO2 emissions growth (%, 1990–2007)Particulate matter (urban-pop.-weighted avg., μg/cu. m)Road sector energy use per capita (kg oil equivalent) Water and sanitationInternal freshwater resources per capita (cu. m)Freshwater withdrawal
Total (% of internal resources)Agriculture (% of total freshwater withdrawal)
Access to improved water source (% of total population)Rural (% of rural population)Urban (% of urban population)
Access to improved sanitation (% of total population)Rural (% of rural population)Urban (% of urban population)
Environment and healthAcute resp. infection prevalence (% of children under five)Diarrhea prevalence (% of children under five)Under-five mortality rate (per 1,000 live births) National accounting aggregates—savings, depletion and degradationGross savings (% of GNI)Consumption of fixed capital (% of GNI)Education expenditure (% of GNI)Energy depletion (% of GNI)Mineral depletion (% of GNI)Net forest depletion (% of GNI)CO2 damage (% of GNI)Particulate emissions damage (% of GNI)Adjusted net savings (% of GNI)
148 2011 The Little Green Data Book
197,590 37,990.. 31,467
100.0 77.30.6 1.0
.. 37
.. 25,774
.. 106
.. 331
0.0 28.9.. –0.1
23.7 13.42090
0.0
.. 6.6
.. 5,131
.. 3.9
.. 9,518
.. 62.9
.. 11.3
.. 0.4
.. 12.5
.. 17.9
.. 24
.. 964
.. 9,031
.. 10.5
.. 42100 100
.. 98100 100100 99
.. 98100 100
..
..4 7
.. 16.1
.. 14.11.1 4.60.0 0.90.0 0.1
.. 0.00.0 0.2
.. 0.1
.. 5.2
Country data
High-income group
Population (thousands) 33 Land area (sq. km) 2 GDP ($ billions) 6.1
Monaco
GNI per capita, World Bank Atlas method ($)Adjusted Net National Income per capita ($)Urban population (% of total)Urban population growth (average annual %, 1990-2009) AgricultureAgricultural land (% land area)Agricultural productivity, value added per worker (2000 $)Food production index (1999-2001=100)Population density, rural (people/ sq. km of arable land) Forests and biodiversityForest area (% land area)Deforestation (average annual %, 1990-2010)Nationally terrestrial protected area (% of land area)Threatened species, mammalsThreatened species, birdsThreatened species, fishThreatened species, higher plantsGEF benefits index for biodiversity (0-100, median is 1.5) EnergyGDP per unit of energy use (2005 PPP $/kg oil equivalent)Energy use per capita (kg oil equivalent)Energy from biomass products and waste (% of total)Electric power consumption per capita (kWh)Electricity generated using fossil fuel (% of total)Electricity generated by hydropower (% of total) Emissions and pollutionCO2 emissions per unit of GDP (kg/2005 PPP $)CO2 emissions per capita (metric tons)CO2 emissions growth (%, 1990–2007)Particulate matter (urban-pop.-weighted avg., μg/cu. m)Road sector energy use per capita (kg oil equivalent) Water and sanitationInternal freshwater resources per capita (cu. m)Freshwater withdrawal
Total (% of internal resources)Agriculture (% of total freshwater withdrawal)
Access to improved water source (% of total population)Rural (% of rural population)Urban (% of urban population)
Access to improved sanitation (% of total population)Rural (% of rural population)Urban (% of urban population)
Environment and healthAcute resp. infection prevalence (% of children under five)Diarrhea prevalence (% of children under five)Under-five mortality rate (per 1,000 live births) National accounting aggregates—savings, depletion and degradationGross savings (% of GNI)Consumption of fixed capital (% of GNI)Education expenditure (% of GNI)Energy depletion (% of GNI)Mineral depletion (% of GNI)Net forest depletion (% of GNI)CO2 damage (% of GNI)Particulate emissions damage (% of GNI)Adjusted net savings (% of GNI)
Population (millions) 2.7 Land area (1,000 sq. km) 1,553.6 GDP ($ billions) 4.2
Country data
East Asia & Pacific
group
Lower middle-income group
Mongolia
GNI per capita, World Bank Atlas method ($)Adjusted Net National Income per capita ($)Urban population (% of total)Urban population growth (average annual %, 1990-2009) AgricultureAgricultural land (% land area)Agricultural productivity, value added per worker (2000 $)Food production index (1999-2001=100)Population density, rural (people/ sq. km of arable land) Forests and biodiversityForest area (% land area)Deforestation (average annual %, 1990-2010)Nationally terrestrial protected area (% of land area)Threatened species, mammalsThreatened species, birdsThreatened species, fishThreatened species, higher plantsGEF benefits index for biodiversity (0-100, median is 1.5) EnergyGDP per unit of energy use (2005 PPP $/kg oil equivalent)Energy use per capita (kg oil equivalent)Energy from biomass products and waste (% of total)Electric power consumption per capita (kWh)Electricity generated using fossil fuel (% of total)Electricity generated by hydropower (% of total) Emissions and pollutionCO2 emissions per unit of GDP (kg/2005 PPP $)CO2 emissions per capita (metric tons)CO2 emissions growth (%, 1990–2007)Particulate matter (urban-pop.-weighted avg., μg/cu. m)Road sector energy use per capita (kg oil equivalent) Water and sanitationInternal freshwater resources per capita (cu. m)Freshwater withdrawal
Total (% of internal resources)Agriculture (% of total freshwater withdrawal)
Access to improved water source (% of total population)Rural (% of rural population)Urban (% of urban population)
Access to improved sanitation (% of total population)Rural (% of rural population)Urban (% of urban population)
Environment and healthAcute resp. infection prevalence (% of children under five)Diarrhea prevalence (% of children under five)Under-five mortality rate (per 1,000 live births) National accounting aggregates—savings, depletion and degradationGross savings (% of GNI)Consumption of fixed capital (% of GNI)Education expenditure (% of GNI)Energy depletion (% of GNI)Mineral depletion (% of GNI)Net forest depletion (% of GNI)CO2 damage (% of GNI)Particulate emissions damage (% of GNI)Adjusted net savings (% of GNI)
150 2011 The Little Green Data Book
6,650 6,793 7,502.. 4,892 5,773
59.8 64.0 74.91.5 0.2 1.6
38 28 302,502 3,011 3,671
.. 126 129143 148 153
40.4 38.6 37.20.0 0.0 0.1
13.3 7.4 13.06
11240
0.0
.. 3.6 5.2
.. 3,030 2,177
.. 1.7 6.8
.. 4,052 3,001
.. 67.5 64.7
.. 16.4 26.4
.. 0.7 0.5
.. 7.2 5.3
.. –31.3 3.8
.. 24 31
.. 228 320
.. 12,913 18,143
.. 7.0 3.2
.. 63 6598 95 9596 89 86
100 98 9892 89 8486 80 6796 94 90
..
..9 21 22
.. 19.8 19.9
.. 11.7 11.8
.. 3.6 4.1
.. 8.7 6.4
.. 0.4 1.0
.. 0.0 0.0
.. 0.9 0.6
.. 0.2 0.2
.. 1.4 3.9
Country data
Europe & Central
Asia group
Upper middle-income group
Population (thousands) 624 Land area (1,000 sq. km) 13 GDP ($ billions) 4.1
Montenegro
GNI per capita, World Bank Atlas method ($)Adjusted Net National Income per capita ($)Urban population (% of total)Urban population growth (average annual %, 1990-2009) AgricultureAgricultural land (% land area)Agricultural productivity, value added per worker (2000 $)Food production index (1999-2001=100)Population density, rural (people/ sq. km of arable land) Forests and biodiversityForest area (% land area)Deforestation (average annual %, 1990-2010)Nationally terrestrial protected area (% of land area)Threatened species, mammalsThreatened species, birdsThreatened species, fishThreatened species, higher plantsGEF benefits index for biodiversity (0-100, median is 1.5) EnergyGDP per unit of energy use (2005 PPP $/kg oil equivalent)Energy use per capita (kg oil equivalent)Energy from biomass products and waste (% of total)Electric power consumption per capita (kWh)Electricity generated using fossil fuel (% of total)Electricity generated by hydropower (% of total) Emissions and pollutionCO2 emissions per unit of GDP (kg/2005 PPP $)CO2 emissions per capita (metric tons)CO2 emissions growth (%, 1990–2007)Particulate matter (urban-pop.-weighted avg., μg/cu. m)Road sector energy use per capita (kg oil equivalent) Water and sanitationInternal freshwater resources per capita (cu. m)Freshwater withdrawal
Total (% of internal resources)Agriculture (% of total freshwater withdrawal)
Access to improved water source (% of total population)Rural (% of rural population)Urban (% of urban population)
Access to improved sanitation (% of total population)Rural (% of rural population)Urban (% of urban population)
Environment and healthAcute resp. infection prevalence (% of children under five)Diarrhea prevalence (% of children under five)Under-five mortality rate (per 1,000 live births) National accounting aggregates—savings, depletion and degradationGross savings (% of GNI)Consumption of fixed capital (% of GNI)Education expenditure (% of GNI)Energy depletion (% of GNI)Mineral depletion (% of GNI)Net forest depletion (% of GNI)CO2 damage (% of GNI)Particulate emissions damage (% of GNI)Adjusted net savings (% of GNI)
Population (millions) 32 Land area (1,000 sq. km) 446 GDP ($ billions) 91.4
Morocco
GNI per capita, World Bank Atlas method ($)Adjusted Net National Income per capita ($)Urban population (% of total)Urban population growth (average annual %, 1990-2009) AgricultureAgricultural land (% land area)Agricultural productivity, value added per worker (2000 $)Food production index (1999-2001=100)Population density, rural (people/ sq. km of arable land) Forests and biodiversityForest area (% land area)Deforestation (average annual %, 1990-2010)Nationally terrestrial protected area (% of land area)Threatened species, mammalsThreatened species, birdsThreatened species, fishThreatened species, higher plantsGEF benefits index for biodiversity (0-100, median is 1.5) EnergyGDP per unit of energy use (2005 PPP $/kg oil equivalent)Energy use per capita (kg oil equivalent)Energy from biomass products and waste (% of total)Electric power consumption per capita (kWh)Electricity generated using fossil fuel (% of total)Electricity generated by hydropower (% of total) Emissions and pollutionCO2 emissions per unit of GDP (kg/2005 PPP $)CO2 emissions per capita (metric tons)CO2 emissions growth (%, 1990–2007)Particulate matter (urban-pop.-weighted avg., μg/cu. m)Road sector energy use per capita (kg oil equivalent) Water and sanitationInternal freshwater resources per capita (cu. m)Freshwater withdrawal
Total (% of internal resources)Agriculture (% of total freshwater withdrawal)
Access to improved water source (% of total population)Rural (% of rural population)Urban (% of urban population)
Access to improved sanitation (% of total population)Rural (% of rural population)Urban (% of urban population)
Environment and healthAcute resp. infection prevalence (% of children under five)Diarrhea prevalence (% of children under five)Under-five mortality rate (per 1,000 live births) National accounting aggregates—savings, depletion and degradationGross savings (% of GNI)Consumption of fixed capital (% of GNI)Education expenditure (% of GNI)Energy depletion (% of GNI)Mineral depletion (% of GNI)Net forest depletion (% of GNI)CO2 damage (% of GNI)Particulate emissions damage (% of GNI)Adjusted net savings (% of GNI)
Population (millions) 23 Land area (1,000 sq. km) 786 GDP ($ billions) 9.8
Country data
Sub-Saharan Africa group
Low-income group
Mozambique
GNI per capita, World Bank Atlas method ($)Adjusted Net National Income per capita ($)Urban population (% of total)Urban population growth (average annual %, 1990-2009) AgricultureAgricultural land (% land area)Agricultural productivity, value added per worker (2000 $)Food production index (1999-2001=100)Population density, rural (people/ sq. km of arable land) Forests and biodiversityForest area (% land area)Deforestation (average annual %, 1990-2010)Nationally terrestrial protected area (% of land area)Threatened species, mammalsThreatened species, birdsThreatened species, fishThreatened species, higher plantsGEF benefits index for biodiversity (0-100, median is 1.5) EnergyGDP per unit of energy use (2005 PPP $/kg oil equivalent)Energy use per capita (kg oil equivalent)Energy from biomass products and waste (% of total)Electric power consumption per capita (kWh)Electricity generated using fossil fuel (% of total)Electricity generated by hydropower (% of total) Emissions and pollutionCO2 emissions per unit of GDP (kg/2005 PPP $)CO2 emissions per capita (metric tons)CO2 emissions growth (%, 1990–2007)Particulate matter (urban-pop.-weighted avg., μg/cu. m)Road sector energy use per capita (kg oil equivalent) Water and sanitationInternal freshwater resources per capita (cu. m)Freshwater withdrawal
Total (% of internal resources)Agriculture (% of total freshwater withdrawal)
Access to improved water source (% of total population)Rural (% of rural population)Urban (% of urban population)
Access to improved sanitation (% of total population)Rural (% of rural population)Urban (% of urban population)
Environment and healthAcute resp. infection prevalence (% of children under five)Diarrhea prevalence (% of children under five)Under-five mortality rate (per 1,000 live births) National accounting aggregates—savings, depletion and degradationGross savings (% of GNI)Consumption of fixed capital (% of GNI)Education expenditure (% of GNI)Energy depletion (% of GNI)Mineral depletion (% of GNI)Net forest depletion (% of GNI)CO2 damage (% of GNI)Particulate emissions damage (% of GNI)Adjusted net savings (% of GNI)
Population (millions) 50 Land area (1,000 sq. km) 654 GDP ($ billions) ..
Myanmar
GNI per capita, World Bank Atlas method ($)Adjusted Net National Income per capita ($)Urban population (% of total)Urban population growth (average annual %, 1990-2009) AgricultureAgricultural land (% land area)Agricultural productivity, value added per worker (2000 $)Food production index (1999-2001=100)Population density, rural (people/ sq. km of arable land) Forests and biodiversityForest area (% land area)Deforestation (average annual %, 1990-2010)Nationally terrestrial protected area (% of land area)Threatened species, mammalsThreatened species, birdsThreatened species, fishThreatened species, higher plantsGEF benefits index for biodiversity (0-100, median is 1.5) EnergyGDP per unit of energy use (2005 PPP $/kg oil equivalent)Energy use per capita (kg oil equivalent)Energy from biomass products and waste (% of total)Electric power consumption per capita (kWh)Electricity generated using fossil fuel (% of total)Electricity generated by hydropower (% of total) Emissions and pollutionCO2 emissions per unit of GDP (kg/2005 PPP $)CO2 emissions per capita (metric tons)CO2 emissions growth (%, 1990–2007)Particulate matter (urban-pop.-weighted avg., μg/cu. m)Road sector energy use per capita (kg oil equivalent) Water and sanitationInternal freshwater resources per capita (cu. m)Freshwater withdrawal
Total (% of internal resources)Agriculture (% of total freshwater withdrawal)
Access to improved water source (% of total population)Rural (% of rural population)Urban (% of urban population)
Access to improved sanitation (% of total population)Rural (% of rural population)Urban (% of urban population)
Environment and healthAcute resp. infection prevalence (% of children under five)Diarrhea prevalence (% of children under five)Under-five mortality rate (per 1,000 live births) National accounting aggregates—savings, depletion and degradationGross savings (% of GNI)Consumption of fixed capital (% of GNI)Education expenditure (% of GNI)Energy depletion (% of GNI)Mineral depletion (% of GNI)Net forest depletion (% of GNI)CO2 damage (% of GNI)Particulate emissions damage (% of GNI)Adjusted net savings (% of GNI)
Population (millions) 2.2 Land area (1,000 sq. km) 823.3 GDP ($ billions) 9.3
Namibia
GNI per capita, World Bank Atlas method ($)Adjusted Net National Income per capita ($)Urban population (% of total)Urban population growth (average annual %, 1990-2009) AgricultureAgricultural land (% land area)Agricultural productivity, value added per worker (2000 $)Food production index (1999-2001=100)Population density, rural (people/ sq. km of arable land) Forests and biodiversityForest area (% land area)Deforestation (average annual %, 1990-2010)Nationally terrestrial protected area (% of land area)Threatened species, mammalsThreatened species, birdsThreatened species, fishThreatened species, higher plantsGEF benefits index for biodiversity (0-100, median is 1.5) EnergyGDP per unit of energy use (2005 PPP $/kg oil equivalent)Energy use per capita (kg oil equivalent)Energy from biomass products and waste (% of total)Electric power consumption per capita (kWh)Electricity generated using fossil fuel (% of total)Electricity generated by hydropower (% of total) Emissions and pollutionCO2 emissions per unit of GDP (kg/2005 PPP $)CO2 emissions per capita (metric tons)CO2 emissions growth (%, 1990–2007)Particulate matter (urban-pop.-weighted avg., μg/cu. m)Road sector energy use per capita (kg oil equivalent) Water and sanitationInternal freshwater resources per capita (cu. m)Freshwater withdrawal
Total (% of internal resources)Agriculture (% of total freshwater withdrawal)
Access to improved water source (% of total population)Rural (% of rural population)Urban (% of urban population)
Access to improved sanitation (% of total population)Rural (% of rural population)Urban (% of urban population)
Environment and healthAcute resp. infection prevalence (% of children under five)Diarrhea prevalence (% of children under five)Under-five mortality rate (per 1,000 live births) National accounting aggregates—savings, depletion and degradationGross savings (% of GNI)Consumption of fixed capital (% of GNI)Education expenditure (% of GNI)Energy depletion (% of GNI)Mineral depletion (% of GNI)Net forest depletion (% of GNI)CO2 damage (% of GNI)Particulate emissions damage (% of GNI)Adjusted net savings (% of GNI)
Population (millions) 29 Land area (1,000 sq. km) 143 GDP ($ billions) 12.5
Nepal
GNI per capita, World Bank Atlas method ($)Adjusted Net National Income per capita ($)Urban population (% of total)Urban population growth (average annual %, 1990-2009) AgricultureAgricultural land (% land area)Agricultural productivity, value added per worker (2000 $)Food production index (1999-2001=100)Population density, rural (people/ sq. km of arable land) Forests and biodiversityForest area (% land area)Deforestation (average annual %, 1990-2010)Nationally terrestrial protected area (% of land area)Threatened species, mammalsThreatened species, birdsThreatened species, fishThreatened species, higher plantsGEF benefits index for biodiversity (0-100, median is 1.5) EnergyGDP per unit of energy use (2005 PPP $/kg oil equivalent)Energy use per capita (kg oil equivalent)Energy from biomass products and waste (% of total)Electric power consumption per capita (kWh)Electricity generated using fossil fuel (% of total)Electricity generated by hydropower (% of total) Emissions and pollutionCO2 emissions per unit of GDP (kg/2005 PPP $)CO2 emissions per capita (metric tons)CO2 emissions growth (%, 1990–2007)Particulate matter (urban-pop.-weighted avg., μg/cu. m)Road sector energy use per capita (kg oil equivalent) Water and sanitationInternal freshwater resources per capita (cu. m)Freshwater withdrawal
Total (% of internal resources)Agriculture (% of total freshwater withdrawal)
Access to improved water source (% of total population)Rural (% of rural population)Urban (% of urban population)
Access to improved sanitation (% of total population)Rural (% of rural population)Urban (% of urban population)
Environment and healthAcute resp. infection prevalence (% of children under five)Diarrhea prevalence (% of children under five)Under-five mortality rate (per 1,000 live births) National accounting aggregates—savings, depletion and degradationGross savings (% of GNI)Consumption of fixed capital (% of GNI)Education expenditure (% of GNI)Energy depletion (% of GNI)Mineral depletion (% of GNI)Net forest depletion (% of GNI)CO2 damage (% of GNI)Particulate emissions damage (% of GNI)Adjusted net savings (% of GNI)
156 2011 The Little Green Data Book
48,460 37,99039,606 31,467
82.4 77.31.5 1.0
57 3743,572 25,774
94 106280 331
10.8 28.9–0.2 –0.112.4 13.4
42
120
0.2
7.9 6.64,845 5,131
3.9 3.97,226 9,51885.7 62.9
0.1 11.3
0.3 0.410.6 12.55.6 17.931 24
708 964
671 9,031
105.1 10.523 42
100 100100 98100 100100 99100 98100 100
..
..4 7
22.7 16.114.6 14.1
4.7 4.60.8 0.90.0 0.10.0 0.00.2 0.20.2 0.1
11.6 5.2
Country data
High-income group
Population (millions) 17 Land area (1,000 sq. km) 34 GDP ($ billions) 792.1
Netherlands
GNI per capita, World Bank Atlas method ($)Adjusted Net National Income per capita ($)Urban population (% of total)Urban population growth (average annual %, 1990-2009) AgricultureAgricultural land (% land area)Agricultural productivity, value added per worker (2000 $)Food production index (1999-2001=100)Population density, rural (people/ sq. km of arable land) Forests and biodiversityForest area (% land area)Deforestation (average annual %, 1990-2010)Nationally terrestrial protected area (% of land area)Threatened species, mammalsThreatened species, birdsThreatened species, fishThreatened species, higher plantsGEF benefits index for biodiversity (0-100, median is 1.5) EnergyGDP per unit of energy use (2005 PPP $/kg oil equivalent)Energy use per capita (kg oil equivalent)Energy from biomass products and waste (% of total)Electric power consumption per capita (kWh)Electricity generated using fossil fuel (% of total)Electricity generated by hydropower (% of total) Emissions and pollutionCO2 emissions per unit of GDP (kg/2005 PPP $)CO2 emissions per capita (metric tons)CO2 emissions growth (%, 1990–2007)Particulate matter (urban-pop.-weighted avg., μg/cu. m)Road sector energy use per capita (kg oil equivalent) Water and sanitationInternal freshwater resources per capita (cu. m)Freshwater withdrawal
Total (% of internal resources)Agriculture (% of total freshwater withdrawal)
Access to improved water source (% of total population)Rural (% of rural population)Urban (% of urban population)
Access to improved sanitation (% of total population)Rural (% of rural population)Urban (% of urban population)
Environment and healthAcute resp. infection prevalence (% of children under five)Diarrhea prevalence (% of children under five)Under-five mortality rate (per 1,000 live births) National accounting aggregates—savings, depletion and degradationGross savings (% of GNI)Consumption of fixed capital (% of GNI)Education expenditure (% of GNI)Energy depletion (% of GNI)Mineral depletion (% of GNI)Net forest depletion (% of GNI)CO2 damage (% of GNI)Particulate emissions damage (% of GNI)Adjusted net savings (% of GNI)
157The Little Green Data Book 2011
.. 37,990
.. 31,46792.9 77.3
0.6 1.0
10 37.. 25,774
121 106179 331
1.3 28.90.0 –0.1
15.1 13.431
153
0.2
.. 6.611,078 5,131
0.0 3.95,342 9,518100.0 62.9
0.0 11.3
.. 0.432.4 12.5
0.4 17.923 24
2,084 964
.. 9,031
.. 10.5
.. 42
.. 100
.. 98
.. 100
.. 99
.. 98
.. 100
..
..
.. 7
.. 16.1
.. 14.1
.. 4.6
.. 0.9
.. 0.1
.. 0.0
.. 0.2
.. 0.1
.. 5.2
Population (thousands) 196 Land area (1,000 sq. km) 0.8 GDP ($ millions) ..
Country data
High-income group
Netherlands Antilles
GNI per capita, World Bank Atlas method ($)Adjusted Net National Income per capita ($)Urban population (% of total)Urban population growth (average annual %, 1990-2009) AgricultureAgricultural land (% land area)Agricultural productivity, value added per worker (2000 $)Food production index (1999-2001=100)Population density, rural (people/ sq. km of arable land) Forests and biodiversityForest area (% land area)Deforestation (average annual %, 1990-2010)Nationally terrestrial protected area (% of land area)Threatened species, mammalsThreatened species, birdsThreatened species, fishThreatened species, higher plantsGEF benefits index for biodiversity (0-100, median is 1.5) EnergyGDP per unit of energy use (2005 PPP $/kg oil equivalent)Energy use per capita (kg oil equivalent)Energy from biomass products and waste (% of total)Electric power consumption per capita (kWh)Electricity generated using fossil fuel (% of total)Electricity generated by hydropower (% of total) Emissions and pollutionCO2 emissions per unit of GDP (kg/2005 PPP $)CO2 emissions per capita (metric tons)CO2 emissions growth (%, 1990–2007)Particulate matter (urban-pop.-weighted avg., μg/cu. m)Road sector energy use per capita (kg oil equivalent) Water and sanitationInternal freshwater resources per capita (cu. m)Freshwater withdrawal
Total (% of internal resources)Agriculture (% of total freshwater withdrawal)
Access to improved water source (% of total population)Rural (% of rural population)Urban (% of urban population)
Access to improved sanitation (% of total population)Rural (% of rural population)Urban (% of urban population)
Environment and healthAcute resp. infection prevalence (% of children under five)Diarrhea prevalence (% of children under five)Under-five mortality rate (per 1,000 live births) National accounting aggregates—savings, depletion and degradationGross savings (% of GNI)Consumption of fixed capital (% of GNI)Education expenditure (% of GNI)Energy depletion (% of GNI)Mineral depletion (% of GNI)Net forest depletion (% of GNI)CO2 damage (% of GNI)Particulate emissions damage (% of GNI)Adjusted net savings (% of GNI)
158 2011 The Little Green Data Book
.. 37,990
.. 31,46765.1 77.3
2.6 1.0
14 37.. 25,774
103 1061,086 331
45.9 28.90.0 –0.15.5 13.4
91524
2578.5
.. 6.6
.. 5,131
.. 3.9
.. 9,518
.. 62.9
.. 11.3
.. 0.411.7 12.575.4 17.9
64 24.. 964
.. 9,031
.. 10.5
.. 42
.. 100
.. 98
.. 100
.. 99
.. 98
.. 100
..
..
.. 7
.. 16.1
.. 14.1
.. 4.6
.. 0.9
.. 0.1
.. 0.0
.. 0.2
.. 0.1
.. 5.2
Population (thousands) 250 Land area (1,000 sq. km) 18 GDP ($ billions) ..
Country data
High-income group
New Caledonia
GNI per capita, World Bank Atlas method ($)Adjusted Net National Income per capita ($)Urban population (% of total)Urban population growth (average annual %, 1990-2009) AgricultureAgricultural land (% land area)Agricultural productivity, value added per worker (2000 $)Food production index (1999-2001=100)Population density, rural (people/ sq. km of arable land) Forests and biodiversityForest area (% land area)Deforestation (average annual %, 1990-2010)Nationally terrestrial protected area (% of land area)Threatened species, mammalsThreatened species, birdsThreatened species, fishThreatened species, higher plantsGEF benefits index for biodiversity (0-100, median is 1.5) EnergyGDP per unit of energy use (2005 PPP $/kg oil equivalent)Energy use per capita (kg oil equivalent)Energy from biomass products and waste (% of total)Electric power consumption per capita (kWh)Electricity generated using fossil fuel (% of total)Electricity generated by hydropower (% of total) Emissions and pollutionCO2 emissions per unit of GDP (kg/2005 PPP $)CO2 emissions per capita (metric tons)CO2 emissions growth (%, 1990–2007)Particulate matter (urban-pop.-weighted avg., μg/cu. m)Road sector energy use per capita (kg oil equivalent) Water and sanitationInternal freshwater resources per capita (cu. m)Freshwater withdrawal
Total (% of internal resources)Agriculture (% of total freshwater withdrawal)
Access to improved water source (% of total population)Rural (% of rural population)Urban (% of urban population)
Access to improved sanitation (% of total population)Rural (% of rural population)Urban (% of urban population)
Environment and healthAcute resp. infection prevalence (% of children under five)Diarrhea prevalence (% of children under five)Under-five mortality rate (per 1,000 live births) National accounting aggregates—savings, depletion and degradationGross savings (% of GNI)Consumption of fixed capital (% of GNI)Education expenditure (% of GNI)Energy depletion (% of GNI)Mineral depletion (% of GNI)Net forest depletion (% of GNI)CO2 damage (% of GNI)Particulate emissions damage (% of GNI)Adjusted net savings (% of GNI)
159The Little Green Data Book 2011
Population (millions) 4.3 Land area (1,000 sq. km) 263.3 GDP ($ billions) 126.7
GNI per capita, World Bank Atlas method ($)Adjusted Net National Income per capita ($)Urban population (% of total)Urban population growth (average annual %, 1990-2009) AgricultureAgricultural land (% land area)Agricultural productivity, value added per worker (2000 $)Food production index (1999-2001=100)Population density, rural (people/ sq. km of arable land) Forests and biodiversityForest area (% land area)Deforestation (average annual %, 1990-2010)Nationally terrestrial protected area (% of land area)Threatened species, mammalsThreatened species, birdsThreatened species, fishThreatened species, higher plantsGEF benefits index for biodiversity (0-100, median is 1.5) EnergyGDP per unit of energy use (2005 PPP $/kg oil equivalent)Energy use per capita (kg oil equivalent)Energy from biomass products and waste (% of total)Electric power consumption per capita (kWh)Electricity generated using fossil fuel (% of total)Electricity generated by hydropower (% of total) Emissions and pollutionCO2 emissions per unit of GDP (kg/2005 PPP $)CO2 emissions per capita (metric tons)CO2 emissions growth (%, 1990–2007)Particulate matter (urban-pop.-weighted avg., μg/cu. m)Road sector energy use per capita (kg oil equivalent) Water and sanitationInternal freshwater resources per capita (cu. m)Freshwater withdrawal
Total (% of internal resources)Agriculture (% of total freshwater withdrawal)
Access to improved water source (% of total population)Rural (% of rural population)Urban (% of urban population)
Access to improved sanitation (% of total population)Rural (% of rural population)Urban (% of urban population)
Environment and healthAcute resp. infection prevalence (% of children under five)Diarrhea prevalence (% of children under five)Under-five mortality rate (per 1,000 live births) National accounting aggregates—savings, depletion and degradationGross savings (% of GNI)Consumption of fixed capital (% of GNI)Education expenditure (% of GNI)Energy depletion (% of GNI)Mineral depletion (% of GNI)Net forest depletion (% of GNI)CO2 damage (% of GNI)Particulate emissions damage (% of GNI)Adjusted net savings (% of GNI)
Population (millions) 5.7 Land area (1,000 sq. km) 120.3 GDP ($ billions) 6.1
Nicaragua
GNI per capita, World Bank Atlas method ($)Adjusted Net National Income per capita ($)Urban population (% of total)Urban population growth (average annual %, 1990-2009) AgricultureAgricultural land (% land area)Agricultural productivity, value added per worker (2000 $)Food production index (1999-2001=100)Population density, rural (people/ sq. km of arable land) Forests and biodiversityForest area (% land area)Deforestation (average annual %, 1990-2010)Nationally terrestrial protected area (% of land area)Threatened species, mammalsThreatened species, birdsThreatened species, fishThreatened species, higher plantsGEF benefits index for biodiversity (0-100, median is 1.5) EnergyGDP per unit of energy use (2005 PPP $/kg oil equivalent)Energy use per capita (kg oil equivalent)Energy from biomass products and waste (% of total)Electric power consumption per capita (kWh)Electricity generated using fossil fuel (% of total)Electricity generated by hydropower (% of total) Emissions and pollutionCO2 emissions per unit of GDP (kg/2005 PPP $)CO2 emissions per capita (metric tons)CO2 emissions growth (%, 1990–2007)Particulate matter (urban-pop.-weighted avg., μg/cu. m)Road sector energy use per capita (kg oil equivalent) Water and sanitationInternal freshwater resources per capita (cu. m)Freshwater withdrawal
Total (% of internal resources)Agriculture (% of total freshwater withdrawal)
Access to improved water source (% of total population)Rural (% of rural population)Urban (% of urban population)
Access to improved sanitation (% of total population)Rural (% of rural population)Urban (% of urban population)
Environment and healthAcute resp. infection prevalence (% of children under five)Diarrhea prevalence (% of children under five)Under-five mortality rate (per 1,000 live births) National accounting aggregates—savings, depletion and degradationGross savings (% of GNI)Consumption of fixed capital (% of GNI)Education expenditure (% of GNI)Energy depletion (% of GNI)Mineral depletion (% of GNI)Net forest depletion (% of GNI)CO2 damage (% of GNI)Particulate emissions damage (% of GNI)Adjusted net savings (% of GNI)
Population (millions) 15 Land area (1,000 sq. km) 1,267 GDP ($ billions) 5.4
Niger
GNI per capita, World Bank Atlas method ($)Adjusted Net National Income per capita ($)Urban population (% of total)Urban population growth (average annual %, 1990-2009) AgricultureAgricultural land (% land area)Agricultural productivity, value added per worker (2000 $)Food production index (1999-2001=100)Population density, rural (people/ sq. km of arable land) Forests and biodiversityForest area (% land area)Deforestation (average annual %, 1990-2010)Nationally terrestrial protected area (% of land area)Threatened species, mammalsThreatened species, birdsThreatened species, fishThreatened species, higher plantsGEF benefits index for biodiversity (0-100, median is 1.5) EnergyGDP per unit of energy use (2005 PPP $/kg oil equivalent)Energy use per capita (kg oil equivalent)Energy from biomass products and waste (% of total)Electric power consumption per capita (kWh)Electricity generated using fossil fuel (% of total)Electricity generated by hydropower (% of total) Emissions and pollutionCO2 emissions per unit of GDP (kg/2005 PPP $)CO2 emissions per capita (metric tons)CO2 emissions growth (%, 1990–2007)Particulate matter (urban-pop.-weighted avg., μg/cu. m)Road sector energy use per capita (kg oil equivalent) Water and sanitationInternal freshwater resources per capita (cu. m)Freshwater withdrawal
Total (% of internal resources)Agriculture (% of total freshwater withdrawal)
Access to improved water source (% of total population)Rural (% of rural population)Urban (% of urban population)
Access to improved sanitation (% of total population)Rural (% of rural population)Urban (% of urban population)
Environment and healthAcute resp. infection prevalence (% of children under five)Diarrhea prevalence (% of children under five)Under-five mortality rate (per 1,000 live births) National accounting aggregates—savings, depletion and degradationGross savings (% of GNI)Consumption of fixed capital (% of GNI)Education expenditure (% of GNI)Energy depletion (% of GNI)Mineral depletion (% of GNI)Net forest depletion (% of GNI)CO2 damage (% of GNI)Particulate emissions damage (% of GNI)Adjusted net savings (% of GNI)
Population (millions) 155 Land area (1,000 sq. km) 911 GDP ($ billions) 173.0
Nigeria
GNI per capita, World Bank Atlas method ($)Adjusted Net National Income per capita ($)Urban population (% of total)Urban population growth (average annual %, 1990-2009) AgricultureAgricultural land (% land area)Agricultural productivity, value added per worker (2000 $)Food production index (1999-2001=100)Population density, rural (people/ sq. km of arable land) Forests and biodiversityForest area (% land area)Deforestation (average annual %, 1990-2010)Nationally terrestrial protected area (% of land area)Threatened species, mammalsThreatened species, birdsThreatened species, fishThreatened species, higher plantsGEF benefits index for biodiversity (0-100, median is 1.5) EnergyGDP per unit of energy use (2005 PPP $/kg oil equivalent)Energy use per capita (kg oil equivalent)Energy from biomass products and waste (% of total)Electric power consumption per capita (kWh)Electricity generated using fossil fuel (% of total)Electricity generated by hydropower (% of total) Emissions and pollutionCO2 emissions per unit of GDP (kg/2005 PPP $)CO2 emissions per capita (metric tons)CO2 emissions growth (%, 1990–2007)Particulate matter (urban-pop.-weighted avg., μg/cu. m)Road sector energy use per capita (kg oil equivalent) Water and sanitationInternal freshwater resources per capita (cu. m)Freshwater withdrawal
Total (% of internal resources)Agriculture (% of total freshwater withdrawal)
Access to improved water source (% of total population)Rural (% of rural population)Urban (% of urban population)
Access to improved sanitation (% of total population)Rural (% of rural population)Urban (% of urban population)
Environment and healthAcute resp. infection prevalence (% of children under five)Diarrhea prevalence (% of children under five)Under-five mortality rate (per 1,000 live births) National accounting aggregates—savings, depletion and degradationGross savings (% of GNI)Consumption of fixed capital (% of GNI)Education expenditure (% of GNI)Energy depletion (% of GNI)Mineral depletion (% of GNI)Net forest depletion (% of GNI)CO2 damage (% of GNI)Particulate emissions damage (% of GNI)Adjusted net savings (% of GNI)
163The Little Green Data Book 2011
.. 37,990
.. 31,46791.2 77.3
3.7 1.0
7 37.. 25,774.. 106
760 331
65.2 28.90.4 –0.11.1 13.4
51585
2.2
.. 6.6
.. 5,131
.. 3.9
.. 9,518
.. 62.9
.. 11.3
.. 0.4
.. 12.5
.. 17.9
.. 24
.. 964
.. 9,031
.. 10.5
.. 4298 10097 9898 10094 9996 9894 100
..
..
.. 7
.. 16.1
.. 14.1
.. 4.6
.. 0.9
.. 0.1
.. 0.0
.. 0.2
.. 0.1
.. 5.2
Population (thousands) 87 Land area (1,000 sq. km) 0.5 GDP ($ millions) ..
Country data
High-income group
Northern Mariana Islands
GNI per capita, World Bank Atlas method ($)Adjusted Net National Income per capita ($)Urban population (% of total)Urban population growth (average annual %, 1990-2009) AgricultureAgricultural land (% land area)Agricultural productivity, value added per worker (2000 $)Food production index (1999-2001=100)Population density, rural (people/ sq. km of arable land) Forests and biodiversityForest area (% land area)Deforestation (average annual %, 1990-2010)Nationally terrestrial protected area (% of land area)Threatened species, mammalsThreatened species, birdsThreatened species, fishThreatened species, higher plantsGEF benefits index for biodiversity (0-100, median is 1.5) EnergyGDP per unit of energy use (2005 PPP $/kg oil equivalent)Energy use per capita (kg oil equivalent)Energy from biomass products and waste (% of total)Electric power consumption per capita (kWh)Electricity generated using fossil fuel (% of total)Electricity generated by hydropower (% of total) Emissions and pollutionCO2 emissions per unit of GDP (kg/2005 PPP $)CO2 emissions per capita (metric tons)CO2 emissions growth (%, 1990–2007)Particulate matter (urban-pop.-weighted avg., μg/cu. m)Road sector energy use per capita (kg oil equivalent) Water and sanitationInternal freshwater resources per capita (cu. m)Freshwater withdrawal
Total (% of internal resources)Agriculture (% of total freshwater withdrawal)
Access to improved water source (% of total population)Rural (% of rural population)Urban (% of urban population)
Access to improved sanitation (% of total population)Rural (% of rural population)Urban (% of urban population)
Environment and healthAcute resp. infection prevalence (% of children under five)Diarrhea prevalence (% of children under five)Under-five mortality rate (per 1,000 live births) National accounting aggregates—savings, depletion and degradationGross savings (% of GNI)Consumption of fixed capital (% of GNI)Education expenditure (% of GNI)Energy depletion (% of GNI)Mineral depletion (% of GNI)Net forest depletion (% of GNI)CO2 damage (% of GNI)Particulate emissions damage (% of GNI)Adjusted net savings (% of GNI)
164 2011 The Little Green Data Book
84,640 37,99057,830 31,467
77.5 77.31.1 1.0
3 3741,932 25,774
95 106127 331
32.9 28.9–0.3 –0.114.4 13.4
72
182
1.3
7.9 6.66,222 5,131
4.6 3.924,867 9,518
0.4 62.998.5 11.3
0.2 0.49.1 12.5
36.5 17.916 24
733 964
81,119 9,031
.. 10.513 42
100 100100 98100 100100 99100 98100 100
..
..3 7
32.6 16.115.2 14.16.2 4.6
10.6 0.90.0 0.10.0 0.00.1 0.20.0 0.1
12.8 5.2
Country data
High-income group
Population (millions) 4.8 Land area (1,000 sq. km) 305.5 GDP ($ billions) 381.8
Norway
GNI per capita, World Bank Atlas method ($)Adjusted Net National Income per capita ($)Urban population (% of total)Urban population growth (average annual %, 1990-2009) AgricultureAgricultural land (% land area)Agricultural productivity, value added per worker (2000 $)Food production index (1999-2001=100)Population density, rural (people/ sq. km of arable land) Forests and biodiversityForest area (% land area)Deforestation (average annual %, 1990-2010)Nationally terrestrial protected area (% of land area)Threatened species, mammalsThreatened species, birdsThreatened species, fishThreatened species, higher plantsGEF benefits index for biodiversity (0-100, median is 1.5) EnergyGDP per unit of energy use (2005 PPP $/kg oil equivalent)Energy use per capita (kg oil equivalent)Energy from biomass products and waste (% of total)Electric power consumption per capita (kWh)Electricity generated using fossil fuel (% of total)Electricity generated by hydropower (% of total) Emissions and pollutionCO2 emissions per unit of GDP (kg/2005 PPP $)CO2 emissions per capita (metric tons)CO2 emissions growth (%, 1990–2007)Particulate matter (urban-pop.-weighted avg., μg/cu. m)Road sector energy use per capita (kg oil equivalent) Water and sanitationInternal freshwater resources per capita (cu. m)Freshwater withdrawal
Total (% of internal resources)Agriculture (% of total freshwater withdrawal)
Access to improved water source (% of total population)Rural (% of rural population)Urban (% of urban population)
Access to improved sanitation (% of total population)Rural (% of rural population)Urban (% of urban population)
Environment and healthAcute resp. infection prevalence (% of children under five)Diarrhea prevalence (% of children under five)Under-five mortality rate (per 1,000 live births) National accounting aggregates—savings, depletion and degradationGross savings (% of GNI)Consumption of fixed capital (% of GNI)Education expenditure (% of GNI)Energy depletion (% of GNI)Mineral depletion (% of GNI)Net forest depletion (% of GNI)CO2 damage (% of GNI)Particulate emissions damage (% of GNI)Adjusted net savings (% of GNI)
165The Little Green Data Book 2011
17,890 37,99010,154 31,467
71.7 77.32.7 1.0
6 371,380 25,774
102 1061,437 331
0.0 28.90.0 –0.1
10.7 13.49
10246
3.7
4.0 6.65,903 5,131
0.0 3.94,894 9,518100.0 62.9
0.0 11.3
0.6 0.413.7 12.5
260.5 17.994 24
665 964
514 9,031
94.7 10.588 4288 10077 9892 10087 9961 9897 100
6.26.712 7
.. 16.1
.. 14.13.7 4.6
.. 0.9
.. 0.10.0 0.0
.. 0.20.0 0.1
.. 5.2
Country data
High-income group
Population (millions) 2.8 Land area (1,000 sq. km) 309.5 GDP ($ billions) 46.1
Oman
GNI per capita, World Bank Atlas method ($)Adjusted Net National Income per capita ($)Urban population (% of total)Urban population growth (average annual %, 1990-2009) AgricultureAgricultural land (% land area)Agricultural productivity, value added per worker (2000 $)Food production index (1999-2001=100)Population density, rural (people/ sq. km of arable land) Forests and biodiversityForest area (% land area)Deforestation (average annual %, 1990-2010)Nationally terrestrial protected area (% of land area)Threatened species, mammalsThreatened species, birdsThreatened species, fishThreatened species, higher plantsGEF benefits index for biodiversity (0-100, median is 1.5) EnergyGDP per unit of energy use (2005 PPP $/kg oil equivalent)Energy use per capita (kg oil equivalent)Energy from biomass products and waste (% of total)Electric power consumption per capita (kWh)Electricity generated using fossil fuel (% of total)Electricity generated by hydropower (% of total) Emissions and pollutionCO2 emissions per unit of GDP (kg/2005 PPP $)CO2 emissions per capita (metric tons)CO2 emissions growth (%, 1990–2007)Particulate matter (urban-pop.-weighted avg., μg/cu. m)Road sector energy use per capita (kg oil equivalent) Water and sanitationInternal freshwater resources per capita (cu. m)Freshwater withdrawal
Total (% of internal resources)Agriculture (% of total freshwater withdrawal)
Access to improved water source (% of total population)Rural (% of rural population)Urban (% of urban population)
Access to improved sanitation (% of total population)Rural (% of rural population)Urban (% of urban population)
Environment and healthAcute resp. infection prevalence (% of children under five)Diarrhea prevalence (% of children under five)Under-five mortality rate (per 1,000 live births) National accounting aggregates—savings, depletion and degradationGross savings (% of GNI)Consumption of fixed capital (% of GNI)Education expenditure (% of GNI)Energy depletion (% of GNI)Mineral depletion (% of GNI)Net forest depletion (% of GNI)CO2 damage (% of GNI)Particulate emissions damage (% of GNI)Adjusted net savings (% of GNI)
Population (millions) 170 Land area (1,000 sq. km) 771 GDP ($ billions) 162.0
Pakistan
GNI per capita, World Bank Atlas method ($)Adjusted Net National Income per capita ($)Urban population (% of total)Urban population growth (average annual %, 1990-2009) AgricultureAgricultural land (% land area)Agricultural productivity, value added per worker (2000 $)Food production index (1999-2001=100)Population density, rural (people/ sq. km of arable land) Forests and biodiversityForest area (% land area)Deforestation (average annual %, 1990-2010)Nationally terrestrial protected area (% of land area)Threatened species, mammalsThreatened species, birdsThreatened species, fishThreatened species, higher plantsGEF benefits index for biodiversity (0-100, median is 1.5) EnergyGDP per unit of energy use (2005 PPP $/kg oil equivalent)Energy use per capita (kg oil equivalent)Energy from biomass products and waste (% of total)Electric power consumption per capita (kWh)Electricity generated using fossil fuel (% of total)Electricity generated by hydropower (% of total) Emissions and pollutionCO2 emissions per unit of GDP (kg/2005 PPP $)CO2 emissions per capita (metric tons)CO2 emissions growth (%, 1990–2007)Particulate matter (urban-pop.-weighted avg., μg/cu. m)Road sector energy use per capita (kg oil equivalent) Water and sanitationInternal freshwater resources per capita (cu. m)Freshwater withdrawal
Total (% of internal resources)Agriculture (% of total freshwater withdrawal)
Access to improved water source (% of total population)Rural (% of rural population)Urban (% of urban population)
Access to improved sanitation (% of total population)Rural (% of rural population)Urban (% of urban population)
Environment and healthAcute resp. infection prevalence (% of children under five)Diarrhea prevalence (% of children under five)Under-five mortality rate (per 1,000 live births) National accounting aggregates—savings, depletion and degradationGross savings (% of GNI)Consumption of fixed capital (% of GNI)Education expenditure (% of GNI)Energy depletion (% of GNI)Mineral depletion (% of GNI)Net forest depletion (% of GNI)CO2 damage (% of GNI)Particulate emissions damage (% of GNI)Adjusted net savings (% of GNI)
Population (thousands) 20 Land area (1,000 sq. km) 0.5 GDP ($ millions) 165
Palau
GNI per capita, World Bank Atlas method ($)Adjusted Net National Income per capita ($)Urban population (% of total)Urban population growth (average annual %, 1990-2009) AgricultureAgricultural land (% land area)Agricultural productivity, value added per worker (2000 $)Food production index (1999-2001=100)Population density, rural (people/ sq. km of arable land) Forests and biodiversityForest area (% land area)Deforestation (average annual %, 1990-2010)Nationally terrestrial protected area (% of land area)Threatened species, mammalsThreatened species, birdsThreatened species, fishThreatened species, higher plantsGEF benefits index for biodiversity (0-100, median is 1.5) EnergyGDP per unit of energy use (2005 PPP $/kg oil equivalent)Energy use per capita (kg oil equivalent)Energy from biomass products and waste (% of total)Electric power consumption per capita (kWh)Electricity generated using fossil fuel (% of total)Electricity generated by hydropower (% of total) Emissions and pollutionCO2 emissions per unit of GDP (kg/2005 PPP $)CO2 emissions per capita (metric tons)CO2 emissions growth (%, 1990–2007)Particulate matter (urban-pop.-weighted avg., μg/cu. m)Road sector energy use per capita (kg oil equivalent) Water and sanitationInternal freshwater resources per capita (cu. m)Freshwater withdrawal
Total (% of internal resources)Agriculture (% of total freshwater withdrawal)
Access to improved water source (% of total population)Rural (% of rural population)Urban (% of urban population)
Access to improved sanitation (% of total population)Rural (% of rural population)Urban (% of urban population)
Environment and healthAcute resp. infection prevalence (% of children under five)Diarrhea prevalence (% of children under five)Under-five mortality rate (per 1,000 live births) National accounting aggregates—savings, depletion and degradationGross savings (% of GNI)Consumption of fixed capital (% of GNI)Education expenditure (% of GNI)Energy depletion (% of GNI)Mineral depletion (% of GNI)Net forest depletion (% of GNI)CO2 damage (% of GNI)Particulate emissions damage (% of GNI)Adjusted net savings (% of GNI)
Population (millions) 3.5 Land area (1,000 sq. km) 74.3 GDP ($ billions) 24.7
Panama
GNI per capita, World Bank Atlas method ($)Adjusted Net National Income per capita ($)Urban population (% of total)Urban population growth (average annual %, 1990-2009) AgricultureAgricultural land (% land area)Agricultural productivity, value added per worker (2000 $)Food production index (1999-2001=100)Population density, rural (people/ sq. km of arable land) Forests and biodiversityForest area (% land area)Deforestation (average annual %, 1990-2010)Nationally terrestrial protected area (% of land area)Threatened species, mammalsThreatened species, birdsThreatened species, fishThreatened species, higher plantsGEF benefits index for biodiversity (0-100, median is 1.5) EnergyGDP per unit of energy use (2005 PPP $/kg oil equivalent)Energy use per capita (kg oil equivalent)Energy from biomass products and waste (% of total)Electric power consumption per capita (kWh)Electricity generated using fossil fuel (% of total)Electricity generated by hydropower (% of total) Emissions and pollutionCO2 emissions per unit of GDP (kg/2005 PPP $)CO2 emissions per capita (metric tons)CO2 emissions growth (%, 1990–2007)Particulate matter (urban-pop.-weighted avg., μg/cu. m)Road sector energy use per capita (kg oil equivalent) Water and sanitationInternal freshwater resources per capita (cu. m)Freshwater withdrawal
Total (% of internal resources)Agriculture (% of total freshwater withdrawal)
Access to improved water source (% of total population)Rural (% of rural population)Urban (% of urban population)
Access to improved sanitation (% of total population)Rural (% of rural population)Urban (% of urban population)
Environment and healthAcute resp. infection prevalence (% of children under five)Diarrhea prevalence (% of children under five)Under-five mortality rate (per 1,000 live births) National accounting aggregates—savings, depletion and degradationGross savings (% of GNI)Consumption of fixed capital (% of GNI)Education expenditure (% of GNI)Energy depletion (% of GNI)Mineral depletion (% of GNI)Net forest depletion (% of GNI)CO2 damage (% of GNI)Particulate emissions damage (% of GNI)Adjusted net savings (% of GNI)
169The Little Green Data Book 2011
1,180 3,163 2,321831 2,807 2,02812.5 45.0 40.9
1.6 3.4 3.0
2 48 50663 550 588119 135 131
2,130 657 591
63.4 29.6 25.90.3 –0.2 0.03.1 14.9 11.5393741
14325.4
.. 3.8 4.0
.. 1,380 1,019
.. 12.4 16.9
.. 1,972 1,318
.. 80.3 78.2
.. 16.4 16.8
0.3 0.8 0.70.5 4.0 2.8
57.2 148.9 117.718 61 63
.. 97 78
124,716 4,582 2,936
0.0 10.2 17.90 74 81
40 88 8633 81 8187 96 9445 59 5041 54 4171 64 63
13.016.5
68 26 57
19.7 46.5 39.98.6 10.3 9.9
.. 2.1 2.40.0 3.3 4.0
19.9 0.3 0.40.0 0.0 0.20.5 1.0 1.00.0 0.7 0.7
.. 33.1 26.2
Country data
East Asia & Pacific
group
Lower middle-income group
Population (millions) 6.7 Land area (1,000 sq. km) 452.9 GDP ($ billions) 7.9
Papua New Guinea
GNI per capita, World Bank Atlas method ($)Adjusted Net National Income per capita ($)Urban population (% of total)Urban population growth (average annual %, 1990-2009) AgricultureAgricultural land (% land area)Agricultural productivity, value added per worker (2000 $)Food production index (1999-2001=100)Population density, rural (people/ sq. km of arable land) Forests and biodiversityForest area (% land area)Deforestation (average annual %, 1990-2010)Nationally terrestrial protected area (% of land area)Threatened species, mammalsThreatened species, birdsThreatened species, fishThreatened species, higher plantsGEF benefits index for biodiversity (0-100, median is 1.5) EnergyGDP per unit of energy use (2005 PPP $/kg oil equivalent)Energy use per capita (kg oil equivalent)Energy from biomass products and waste (% of total)Electric power consumption per capita (kWh)Electricity generated using fossil fuel (% of total)Electricity generated by hydropower (% of total) Emissions and pollutionCO2 emissions per unit of GDP (kg/2005 PPP $)CO2 emissions per capita (metric tons)CO2 emissions growth (%, 1990–2007)Particulate matter (urban-pop.-weighted avg., μg/cu. m)Road sector energy use per capita (kg oil equivalent) Water and sanitationInternal freshwater resources per capita (cu. m)Freshwater withdrawal
Total (% of internal resources)Agriculture (% of total freshwater withdrawal)
Access to improved water source (% of total population)Rural (% of rural population)Urban (% of urban population)
Access to improved sanitation (% of total population)Rural (% of rural population)Urban (% of urban population)
Environment and healthAcute resp. infection prevalence (% of children under five)Diarrhea prevalence (% of children under five)Under-five mortality rate (per 1,000 live births) National accounting aggregates—savings, depletion and degradationGross savings (% of GNI)Consumption of fixed capital (% of GNI)Education expenditure (% of GNI)Energy depletion (% of GNI)Mineral depletion (% of GNI)Net forest depletion (% of GNI)CO2 damage (% of GNI)Particulate emissions damage (% of GNI)Adjusted net savings (% of GNI)
Population (millions) 6.3 Land area (1,000 sq. km) 397.3 GDP ($ billions) 14.2
Paraguay
GNI per capita, World Bank Atlas method ($)Adjusted Net National Income per capita ($)Urban population (% of total)Urban population growth (average annual %, 1990-2009) AgricultureAgricultural land (% land area)Agricultural productivity, value added per worker (2000 $)Food production index (1999-2001=100)Population density, rural (people/ sq. km of arable land) Forests and biodiversityForest area (% land area)Deforestation (average annual %, 1990-2010)Nationally terrestrial protected area (% of land area)Threatened species, mammalsThreatened species, birdsThreatened species, fishThreatened species, higher plantsGEF benefits index for biodiversity (0-100, median is 1.5) EnergyGDP per unit of energy use (2005 PPP $/kg oil equivalent)Energy use per capita (kg oil equivalent)Energy from biomass products and waste (% of total)Electric power consumption per capita (kWh)Electricity generated using fossil fuel (% of total)Electricity generated by hydropower (% of total) Emissions and pollutionCO2 emissions per unit of GDP (kg/2005 PPP $)CO2 emissions per capita (metric tons)CO2 emissions growth (%, 1990–2007)Particulate matter (urban-pop.-weighted avg., μg/cu. m)Road sector energy use per capita (kg oil equivalent) Water and sanitationInternal freshwater resources per capita (cu. m)Freshwater withdrawal
Total (% of internal resources)Agriculture (% of total freshwater withdrawal)
Access to improved water source (% of total population)Rural (% of rural population)Urban (% of urban population)
Access to improved sanitation (% of total population)Rural (% of rural population)Urban (% of urban population)
Environment and healthAcute resp. infection prevalence (% of children under five)Diarrhea prevalence (% of children under five)Under-five mortality rate (per 1,000 live births) National accounting aggregates—savings, depletion and degradationGross savings (% of GNI)Consumption of fixed capital (% of GNI)Education expenditure (% of GNI)Energy depletion (% of GNI)Mineral depletion (% of GNI)Net forest depletion (% of GNI)CO2 damage (% of GNI)Particulate emissions damage (% of GNI)Adjusted net savings (% of GNI)
Population (millions) 29 Land area (1,000 sq. km) 1,280 GDP ($ billions) 130.3
Peru
GNI per capita, World Bank Atlas method ($)Adjusted Net National Income per capita ($)Urban population (% of total)Urban population growth (average annual %, 1990-2009) AgricultureAgricultural land (% land area)Agricultural productivity, value added per worker (2000 $)Food production index (1999-2001=100)Population density, rural (people/ sq. km of arable land) Forests and biodiversityForest area (% land area)Deforestation (average annual %, 1990-2010)Nationally terrestrial protected area (% of land area)Threatened species, mammalsThreatened species, birdsThreatened species, fishThreatened species, higher plantsGEF benefits index for biodiversity (0-100, median is 1.5) EnergyGDP per unit of energy use (2005 PPP $/kg oil equivalent)Energy use per capita (kg oil equivalent)Energy from biomass products and waste (% of total)Electric power consumption per capita (kWh)Electricity generated using fossil fuel (% of total)Electricity generated by hydropower (% of total) Emissions and pollutionCO2 emissions per unit of GDP (kg/2005 PPP $)CO2 emissions per capita (metric tons)CO2 emissions growth (%, 1990–2007)Particulate matter (urban-pop.-weighted avg., μg/cu. m)Road sector energy use per capita (kg oil equivalent) Water and sanitationInternal freshwater resources per capita (cu. m)Freshwater withdrawal
Total (% of internal resources)Agriculture (% of total freshwater withdrawal)
Access to improved water source (% of total population)Rural (% of rural population)Urban (% of urban population)
Access to improved sanitation (% of total population)Rural (% of rural population)Urban (% of urban population)
Environment and healthAcute resp. infection prevalence (% of children under five)Diarrhea prevalence (% of children under five)Under-five mortality rate (per 1,000 live births) National accounting aggregates—savings, depletion and degradationGross savings (% of GNI)Consumption of fixed capital (% of GNI)Education expenditure (% of GNI)Energy depletion (% of GNI)Mineral depletion (% of GNI)Net forest depletion (% of GNI)CO2 damage (% of GNI)Particulate emissions damage (% of GNI)Adjusted net savings (% of GNI)
Population (millions) 92 Land area (1,000 sq. km) 298 GDP ($ billions) 161.2
Country data
East Asia & Pacific
group
Lower middle-income group
Philippines
GNI per capita, World Bank Atlas method ($)Adjusted Net National Income per capita ($)Urban population (% of total)Urban population growth (average annual %, 1990-2009) AgricultureAgricultural land (% land area)Agricultural productivity, value added per worker (2000 $)Food production index (1999-2001=100)Population density, rural (people/ sq. km of arable land) Forests and biodiversityForest area (% land area)Deforestation (average annual %, 1990-2010)Nationally terrestrial protected area (% of land area)Threatened species, mammalsThreatened species, birdsThreatened species, fishThreatened species, higher plantsGEF benefits index for biodiversity (0-100, median is 1.5) EnergyGDP per unit of energy use (2005 PPP $/kg oil equivalent)Energy use per capita (kg oil equivalent)Energy from biomass products and waste (% of total)Electric power consumption per capita (kWh)Electricity generated using fossil fuel (% of total)Electricity generated by hydropower (% of total) Emissions and pollutionCO2 emissions per unit of GDP (kg/2005 PPP $)CO2 emissions per capita (metric tons)CO2 emissions growth (%, 1990–2007)Particulate matter (urban-pop.-weighted avg., μg/cu. m)Road sector energy use per capita (kg oil equivalent) Water and sanitationInternal freshwater resources per capita (cu. m)Freshwater withdrawal
Total (% of internal resources)Agriculture (% of total freshwater withdrawal)
Access to improved water source (% of total population)Rural (% of rural population)Urban (% of urban population)
Access to improved sanitation (% of total population)Rural (% of rural population)Urban (% of urban population)
Environment and healthAcute resp. infection prevalence (% of children under five)Diarrhea prevalence (% of children under five)Under-five mortality rate (per 1,000 live births) National accounting aggregates—savings, depletion and degradationGross savings (% of GNI)Consumption of fixed capital (% of GNI)Education expenditure (% of GNI)Energy depletion (% of GNI)Mineral depletion (% of GNI)Net forest depletion (% of GNI)CO2 damage (% of GNI)Particulate emissions damage (% of GNI)Adjusted net savings (% of GNI)
Population (millions) 38 Land area (1,000 sq. km) 304 GDP ($ billions) 430.1
Poland
GNI per capita, World Bank Atlas method ($)Adjusted Net National Income per capita ($)Urban population (% of total)Urban population growth (average annual %, 1990-2009) AgricultureAgricultural land (% land area)Agricultural productivity, value added per worker (2000 $)Food production index (1999-2001=100)Population density, rural (people/ sq. km of arable land) Forests and biodiversityForest area (% land area)Deforestation (average annual %, 1990-2010)Nationally terrestrial protected area (% of land area)Threatened species, mammalsThreatened species, birdsThreatened species, fishThreatened species, higher plantsGEF benefits index for biodiversity (0-100, median is 1.5) EnergyGDP per unit of energy use (2005 PPP $/kg oil equivalent)Energy use per capita (kg oil equivalent)Energy from biomass products and waste (% of total)Electric power consumption per capita (kWh)Electricity generated using fossil fuel (% of total)Electricity generated by hydropower (% of total) Emissions and pollutionCO2 emissions per unit of GDP (kg/2005 PPP $)CO2 emissions per capita (metric tons)CO2 emissions growth (%, 1990–2007)Particulate matter (urban-pop.-weighted avg., μg/cu. m)Road sector energy use per capita (kg oil equivalent) Water and sanitationInternal freshwater resources per capita (cu. m)Freshwater withdrawal
Total (% of internal resources)Agriculture (% of total freshwater withdrawal)
Access to improved water source (% of total population)Rural (% of rural population)Urban (% of urban population)
Access to improved sanitation (% of total population)Rural (% of rural population)Urban (% of urban population)
Environment and healthAcute resp. infection prevalence (% of children under five)Diarrhea prevalence (% of children under five)Under-five mortality rate (per 1,000 live births) National accounting aggregates—savings, depletion and degradationGross savings (% of GNI)Consumption of fixed capital (% of GNI)Education expenditure (% of GNI)Energy depletion (% of GNI)Mineral depletion (% of GNI)Net forest depletion (% of GNI)CO2 damage (% of GNI)Particulate emissions damage (% of GNI)Adjusted net savings (% of GNI)
Population (millions) 11 Land area (1,000 sq. km) 91 GDP ($ billions) 232.9
Portugal
GNI per capita, World Bank Atlas method ($)Adjusted Net National Income per capita ($)Urban population (% of total)Urban population growth (average annual %, 1990-2009) AgricultureAgricultural land (% land area)Agricultural productivity, value added per worker (2000 $)Food production index (1999-2001=100)Population density, rural (people/ sq. km of arable land) Forests and biodiversityForest area (% land area)Deforestation (average annual %, 1990-2010)Nationally terrestrial protected area (% of land area)Threatened species, mammalsThreatened species, birdsThreatened species, fishThreatened species, higher plantsGEF benefits index for biodiversity (0-100, median is 1.5) EnergyGDP per unit of energy use (2005 PPP $/kg oil equivalent)Energy use per capita (kg oil equivalent)Energy from biomass products and waste (% of total)Electric power consumption per capita (kWh)Electricity generated using fossil fuel (% of total)Electricity generated by hydropower (% of total) Emissions and pollutionCO2 emissions per unit of GDP (kg/2005 PPP $)CO2 emissions per capita (metric tons)CO2 emissions growth (%, 1990–2007)Particulate matter (urban-pop.-weighted avg., μg/cu. m)Road sector energy use per capita (kg oil equivalent) Water and sanitationInternal freshwater resources per capita (cu. m)Freshwater withdrawal
Total (% of internal resources)Agriculture (% of total freshwater withdrawal)
Access to improved water source (% of total population)Rural (% of rural population)Urban (% of urban population)
Access to improved sanitation (% of total population)Rural (% of rural population)Urban (% of urban population)
Environment and healthAcute resp. infection prevalence (% of children under five)Diarrhea prevalence (% of children under five)Under-five mortality rate (per 1,000 live births) National accounting aggregates—savings, depletion and degradationGross savings (% of GNI)Consumption of fixed capital (% of GNI)Education expenditure (% of GNI)Energy depletion (% of GNI)Mineral depletion (% of GNI)Net forest depletion (% of GNI)CO2 damage (% of GNI)Particulate emissions damage (% of GNI)Adjusted net savings (% of GNI)
175The Little Green Data Book 2011
.. 37,990
.. 31,46798.6 77.3
2.3 1.0
21 37.. 25,774
94 106111 331
62.2 28.9–2.2 –0.110.1 13.4
38
15534.0
.. 6.6
.. 5,131
.. 3.9
.. 9,518
.. 62.9
.. 11.3
.. 0.4
.. 12.5
.. 17.921 24
.. 964
1,801 9,031
14.0 10.57 42.. 100.. 98.. 100.. 99.. 98.. 100
..
..
.. 7
.. 16.1
.. 14.1
.. 4.6
.. 0.9
.. 0.1
.. 0.0
.. 0.2
.. 0.1
.. 5.2
Population (millions) 4.0 Land area (1,000 sq. km) 8.9 GDP ($ billions) ..
Country data
High-income group
Puerto Rico
GNI per capita, World Bank Atlas method ($)Adjusted Net National Income per capita ($)Urban population (% of total)Urban population growth (average annual %, 1990-2009) AgricultureAgricultural land (% land area)Agricultural productivity, value added per worker (2000 $)Food production index (1999-2001=100)Population density, rural (people/ sq. km of arable land) Forests and biodiversityForest area (% land area)Deforestation (average annual %, 1990-2010)Nationally terrestrial protected area (% of land area)Threatened species, mammalsThreatened species, birdsThreatened species, fishThreatened species, higher plantsGEF benefits index for biodiversity (0-100, median is 1.5) EnergyGDP per unit of energy use (2005 PPP $/kg oil equivalent)Energy use per capita (kg oil equivalent)Energy from biomass products and waste (% of total)Electric power consumption per capita (kWh)Electricity generated using fossil fuel (% of total)Electricity generated by hydropower (% of total) Emissions and pollutionCO2 emissions per unit of GDP (kg/2005 PPP $)CO2 emissions per capita (metric tons)CO2 emissions growth (%, 1990–2007)Particulate matter (urban-pop.-weighted avg., μg/cu. m)Road sector energy use per capita (kg oil equivalent) Water and sanitationInternal freshwater resources per capita (cu. m)Freshwater withdrawal
Total (% of internal resources)Agriculture (% of total freshwater withdrawal)
Access to improved water source (% of total population)Rural (% of rural population)Urban (% of urban population)
Access to improved sanitation (% of total population)Rural (% of rural population)Urban (% of urban population)
Environment and healthAcute resp. infection prevalence (% of children under five)Diarrhea prevalence (% of children under five)Under-five mortality rate (per 1,000 live births) National accounting aggregates—savings, depletion and degradationGross savings (% of GNI)Consumption of fixed capital (% of GNI)Education expenditure (% of GNI)Energy depletion (% of GNI)Mineral depletion (% of GNI)Net forest depletion (% of GNI)CO2 damage (% of GNI)Particulate emissions damage (% of GNI)Adjusted net savings (% of GNI)
176 2011 The Little Green Data Book
.. 37,990
.. 31,46795.7 77.36.0 1.0
6 37.. 25,774
77 106430 331
0.0 28.90.0 –0.10.7 13.4
25
110
0.1
4.5 6.618,830 5,131
0.0 3.915,682 9,518
100.0 62.90.0 11.3
0.7 0.455.4 12.5
435.5 17.935 24
2,245 964
49 9,031
471.4 10.559 42
100 100100 98100 100100 99100 98100 100
7.88.811 7
.. 16.1
.. 14.1
.. 4.6
.. 0.9
.. 0.1
.. 0.0
.. 0.2
.. 0.1
.. 5.2
Country data
High-income group
Population (millions) 1.4 Land area (1,000 sq. km) 11.6 GDP ($ billions) 98.3
Qatar
GNI per capita, World Bank Atlas method ($)Adjusted Net National Income per capita ($)Urban population (% of total)Urban population growth (average annual %, 1990-2009) AgricultureAgricultural land (% land area)Agricultural productivity, value added per worker (2000 $)Food production index (1999-2001=100)Population density, rural (people/ sq. km of arable land) Forests and biodiversityForest area (% land area)Deforestation (average annual %, 1990-2010)Nationally terrestrial protected area (% of land area)Threatened species, mammalsThreatened species, birdsThreatened species, fishThreatened species, higher plantsGEF benefits index for biodiversity (0-100, median is 1.5) EnergyGDP per unit of energy use (2005 PPP $/kg oil equivalent)Energy use per capita (kg oil equivalent)Energy from biomass products and waste (% of total)Electric power consumption per capita (kWh)Electricity generated using fossil fuel (% of total)Electricity generated by hydropower (% of total) Emissions and pollutionCO2 emissions per unit of GDP (kg/2005 PPP $)CO2 emissions per capita (metric tons)CO2 emissions growth (%, 1990–2007)Particulate matter (urban-pop.-weighted avg., μg/cu. m)Road sector energy use per capita (kg oil equivalent) Water and sanitationInternal freshwater resources per capita (cu. m)Freshwater withdrawal
Total (% of internal resources)Agriculture (% of total freshwater withdrawal)
Access to improved water source (% of total population)Rural (% of rural population)Urban (% of urban population)
Access to improved sanitation (% of total population)Rural (% of rural population)Urban (% of urban population)
Environment and healthAcute resp. infection prevalence (% of children under five)Diarrhea prevalence (% of children under five)Under-five mortality rate (per 1,000 live births) National accounting aggregates—savings, depletion and degradationGross savings (% of GNI)Consumption of fixed capital (% of GNI)Education expenditure (% of GNI)Energy depletion (% of GNI)Mineral depletion (% of GNI)Net forest depletion (% of GNI)CO2 damage (% of GNI)Particulate emissions damage (% of GNI)Adjusted net savings (% of GNI)
Population (millions) 21 Land area (1,000 sq. km) 230 GDP ($ billions) 161.1
Country data
Europe & Central
Asia group
Upper middle-income group
Romania
GNI per capita, World Bank Atlas method ($)Adjusted Net National Income per capita ($)Urban population (% of total)Urban population growth (average annual %, 1990-2009) AgricultureAgricultural land (% land area)Agricultural productivity, value added per worker (2000 $)Food production index (1999-2001=100)Population density, rural (people/ sq. km of arable land) Forests and biodiversityForest area (% land area)Deforestation (average annual %, 1990-2010)Nationally terrestrial protected area (% of land area)Threatened species, mammalsThreatened species, birdsThreatened species, fishThreatened species, higher plantsGEF benefits index for biodiversity (0-100, median is 1.5) EnergyGDP per unit of energy use (2005 PPP $/kg oil equivalent)Energy use per capita (kg oil equivalent)Energy from biomass products and waste (% of total)Electric power consumption per capita (kWh)Electricity generated using fossil fuel (% of total)Electricity generated by hydropower (% of total) Emissions and pollutionCO2 emissions per unit of GDP (kg/2005 PPP $)CO2 emissions per capita (metric tons)CO2 emissions growth (%, 1990–2007)Particulate matter (urban-pop.-weighted avg., μg/cu. m)Road sector energy use per capita (kg oil equivalent) Water and sanitationInternal freshwater resources per capita (cu. m)Freshwater withdrawal
Total (% of internal resources)Agriculture (% of total freshwater withdrawal)
Access to improved water source (% of total population)Rural (% of rural population)Urban (% of urban population)
Access to improved sanitation (% of total population)Rural (% of rural population)Urban (% of urban population)
Environment and healthAcute resp. infection prevalence (% of children under five)Diarrhea prevalence (% of children under five)Under-five mortality rate (per 1,000 live births) National accounting aggregates—savings, depletion and degradationGross savings (% of GNI)Consumption of fixed capital (% of GNI)Education expenditure (% of GNI)Energy depletion (% of GNI)Mineral depletion (% of GNI)Net forest depletion (% of GNI)CO2 damage (% of GNI)Particulate emissions damage (% of GNI)Adjusted net savings (% of GNI)
Population (millions) 142 Land area (1,000 sq. km) 16,377 GDP ($ billions) 1,231.9
Russian Federation
GNI per capita, World Bank Atlas method ($)Adjusted Net National Income per capita ($)Urban population (% of total)Urban population growth (average annual %, 1990-2009) AgricultureAgricultural land (% land area)Agricultural productivity, value added per worker (2000 $)Food production index (1999-2001=100)Population density, rural (people/ sq. km of arable land) Forests and biodiversityForest area (% land area)Deforestation (average annual %, 1990-2010)Nationally terrestrial protected area (% of land area)Threatened species, mammalsThreatened species, birdsThreatened species, fishThreatened species, higher plantsGEF benefits index for biodiversity (0-100, median is 1.5) EnergyGDP per unit of energy use (2005 PPP $/kg oil equivalent)Energy use per capita (kg oil equivalent)Energy from biomass products and waste (% of total)Electric power consumption per capita (kWh)Electricity generated using fossil fuel (% of total)Electricity generated by hydropower (% of total) Emissions and pollutionCO2 emissions per unit of GDP (kg/2005 PPP $)CO2 emissions per capita (metric tons)CO2 emissions growth (%, 1990–2007)Particulate matter (urban-pop.-weighted avg., μg/cu. m)Road sector energy use per capita (kg oil equivalent) Water and sanitationInternal freshwater resources per capita (cu. m)Freshwater withdrawal
Total (% of internal resources)Agriculture (% of total freshwater withdrawal)
Access to improved water source (% of total population)Rural (% of rural population)Urban (% of urban population)
Access to improved sanitation (% of total population)Rural (% of rural population)Urban (% of urban population)
Environment and healthAcute resp. infection prevalence (% of children under five)Diarrhea prevalence (% of children under five)Under-five mortality rate (per 1,000 live births) National accounting aggregates—savings, depletion and degradationGross savings (% of GNI)Consumption of fixed capital (% of GNI)Education expenditure (% of GNI)Energy depletion (% of GNI)Mineral depletion (% of GNI)Net forest depletion (% of GNI)CO2 damage (% of GNI)Particulate emissions damage (% of GNI)Adjusted net savings (% of GNI)
Population (millions) 10.0 Land area (1,000 sq. km) 24.7 GDP ($ billions) 5.2
Country data
Sub-Saharan Africa group
Low-income group
Rwanda
GNI per capita, World Bank Atlas method ($)Adjusted Net National Income per capita ($)Urban population (% of total)Urban population growth (average annual %, 1990-2009) AgricultureAgricultural land (% land area)Agricultural productivity, value added per worker (2000 $)Food production index (1999-2001=100)Population density, rural (people/ sq. km of arable land) Forests and biodiversityForest area (% land area)Deforestation (average annual %, 1990-2010)Nationally terrestrial protected area (% of land area)Threatened species, mammalsThreatened species, birdsThreatened species, fishThreatened species, higher plantsGEF benefits index for biodiversity (0-100, median is 1.5) EnergyGDP per unit of energy use (2005 PPP $/kg oil equivalent)Energy use per capita (kg oil equivalent)Energy from biomass products and waste (% of total)Electric power consumption per capita (kWh)Electricity generated using fossil fuel (% of total)Electricity generated by hydropower (% of total) Emissions and pollutionCO2 emissions per unit of GDP (kg/2005 PPP $)CO2 emissions per capita (metric tons)CO2 emissions growth (%, 1990–2007)Particulate matter (urban-pop.-weighted avg., μg/cu. m)Road sector energy use per capita (kg oil equivalent) Water and sanitationInternal freshwater resources per capita (cu. m)Freshwater withdrawal
Total (% of internal resources)Agriculture (% of total freshwater withdrawal)
Access to improved water source (% of total population)Rural (% of rural population)Urban (% of urban population)
Access to improved sanitation (% of total population)Rural (% of rural population)Urban (% of urban population)
Environment and healthAcute resp. infection prevalence (% of children under five)Diarrhea prevalence (% of children under five)Under-five mortality rate (per 1,000 live births) National accounting aggregates—savings, depletion and degradationGross savings (% of GNI)Consumption of fixed capital (% of GNI)Education expenditure (% of GNI)Energy depletion (% of GNI)Mineral depletion (% of GNI)Net forest depletion (% of GNI)CO2 damage (% of GNI)Particulate emissions damage (% of GNI)Adjusted net savings (% of GNI)
Population (thousands) 179 Land area (1,000 sq. km) 3 GDP ($ millions) 496
Samoa
GNI per capita, World Bank Atlas method ($)Adjusted Net National Income per capita ($)Urban population (% of total)Urban population growth (average annual %, 1990-2009) AgricultureAgricultural land (% land area)Agricultural productivity, value added per worker (2000 $)Food production index (1999-2001=100)Population density, rural (people/ sq. km of arable land) Forests and biodiversityForest area (% land area)Deforestation (average annual %, 1990-2010)Nationally terrestrial protected area (% of land area)Threatened species, mammalsThreatened species, birdsThreatened species, fishThreatened species, higher plantsGEF benefits index for biodiversity (0-100, median is 1.5) EnergyGDP per unit of energy use (2005 PPP $/kg oil equivalent)Energy use per capita (kg oil equivalent)Energy from biomass products and waste (% of total)Electric power consumption per capita (kWh)Electricity generated using fossil fuel (% of total)Electricity generated by hydropower (% of total) Emissions and pollutionCO2 emissions per unit of GDP (kg/2005 PPP $)CO2 emissions per capita (metric tons)CO2 emissions growth (%, 1990–2007)Particulate matter (urban-pop.-weighted avg., μg/cu. m)Road sector energy use per capita (kg oil equivalent) Water and sanitationInternal freshwater resources per capita (cu. m)Freshwater withdrawal
Total (% of internal resources)Agriculture (% of total freshwater withdrawal)
Access to improved water source (% of total population)Rural (% of rural population)Urban (% of urban population)
Access to improved sanitation (% of total population)Rural (% of rural population)Urban (% of urban population)
Environment and healthAcute resp. infection prevalence (% of children under five)Diarrhea prevalence (% of children under five)Under-five mortality rate (per 1,000 live births) National accounting aggregates—savings, depletion and degradationGross savings (% of GNI)Consumption of fixed capital (% of GNI)Education expenditure (% of GNI)Energy depletion (% of GNI)Mineral depletion (% of GNI)Net forest depletion (% of GNI)CO2 damage (% of GNI)Particulate emissions damage (% of GNI)Adjusted net savings (% of GNI)
181The Little Green Data Book 2011
50,670 37,990.. 31,467
94.3 77.3.. 1.0
17 37.. 25,774.. 106
179 331
0.0 28.90.0 –0.1
.. 13.40000
0.0
.. 6.6
.. 5,131
.. 3.9
.. 9,518
.. 62.9
.. 11.3
.. 0.4
.. 12.5
.. 17.98 24.. 964
.. 9,031
.. 10.5
.. 42
.. 100
.. 98
.. 100
.. 99
.. 98
.. 100
..
..2 7
.. 16.1
.. 14.1
.. 4.6
.. 0.9
.. 0.1
.. 0.0
.. 0.2
.. 0.1
.. 5.2
Country data
High-income group
Population (thousands) 31 Land area (sq. km) 60 GDP ($ billions) 1.9
San Marino
GNI per capita, World Bank Atlas method ($)Adjusted Net National Income per capita ($)Urban population (% of total)Urban population growth (average annual %, 1990-2009) AgricultureAgricultural land (% land area)Agricultural productivity, value added per worker (2000 $)Food production index (1999-2001=100)Population density, rural (people/ sq. km of arable land) Forests and biodiversityForest area (% land area)Deforestation (average annual %, 1990-2010)Nationally terrestrial protected area (% of land area)Threatened species, mammalsThreatened species, birdsThreatened species, fishThreatened species, higher plantsGEF benefits index for biodiversity (0-100, median is 1.5) EnergyGDP per unit of energy use (2005 PPP $/kg oil equivalent)Energy use per capita (kg oil equivalent)Energy from biomass products and waste (% of total)Electric power consumption per capita (kWh)Electricity generated using fossil fuel (% of total)Electricity generated by hydropower (% of total) Emissions and pollutionCO2 emissions per unit of GDP (kg/2005 PPP $)CO2 emissions per capita (metric tons)CO2 emissions growth (%, 1990–2007)Particulate matter (urban-pop.-weighted avg., μg/cu. m)Road sector energy use per capita (kg oil equivalent) Water and sanitationInternal freshwater resources per capita (cu. m)Freshwater withdrawal
Total (% of internal resources)Agriculture (% of total freshwater withdrawal)
Access to improved water source (% of total population)Rural (% of rural population)Urban (% of urban population)
Access to improved sanitation (% of total population)Rural (% of rural population)Urban (% of urban population)
Environment and healthAcute resp. infection prevalence (% of children under five)Diarrhea prevalence (% of children under five)Under-five mortality rate (per 1,000 live births) National accounting aggregates—savings, depletion and degradationGross savings (% of GNI)Consumption of fixed capital (% of GNI)Education expenditure (% of GNI)Energy depletion (% of GNI)Mineral depletion (% of GNI)Net forest depletion (% of GNI)CO2 damage (% of GNI)Particulate emissions damage (% of GNI)Adjusted net savings (% of GNI)
Population (thousands) 163 Land area (1,000 sq. km) 1.0 GDP ($ millions) 191
São Tomé and Príncipe
GNI per capita, World Bank Atlas method ($)Adjusted Net National Income per capita ($)Urban population (% of total)Urban population growth (average annual %, 1990-2009) AgricultureAgricultural land (% land area)Agricultural productivity, value added per worker (2000 $)Food production index (1999-2001=100)Population density, rural (people/ sq. km of arable land) Forests and biodiversityForest area (% land area)Deforestation (average annual %, 1990-2010)Nationally terrestrial protected area (% of land area)Threatened species, mammalsThreatened species, birdsThreatened species, fishThreatened species, higher plantsGEF benefits index for biodiversity (0-100, median is 1.5) EnergyGDP per unit of energy use (2005 PPP $/kg oil equivalent)Energy use per capita (kg oil equivalent)Energy from biomass products and waste (% of total)Electric power consumption per capita (kWh)Electricity generated using fossil fuel (% of total)Electricity generated by hydropower (% of total) Emissions and pollutionCO2 emissions per unit of GDP (kg/2005 PPP $)CO2 emissions per capita (metric tons)CO2 emissions growth (%, 1990–2007)Particulate matter (urban-pop.-weighted avg., μg/cu. m)Road sector energy use per capita (kg oil equivalent) Water and sanitationInternal freshwater resources per capita (cu. m)Freshwater withdrawal
Total (% of internal resources)Agriculture (% of total freshwater withdrawal)
Access to improved water source (% of total population)Rural (% of rural population)Urban (% of urban population)
Access to improved sanitation (% of total population)Rural (% of rural population)Urban (% of urban population)
Environment and healthAcute resp. infection prevalence (% of children under five)Diarrhea prevalence (% of children under five)Under-five mortality rate (per 1,000 live births) National accounting aggregates—savings, depletion and degradationGross savings (% of GNI)Consumption of fixed capital (% of GNI)Education expenditure (% of GNI)Energy depletion (% of GNI)Mineral depletion (% of GNI)Net forest depletion (% of GNI)CO2 damage (% of GNI)Particulate emissions damage (% of GNI)Adjusted net savings (% of GNI)
183The Little Green Data Book 2011
17,210 37,9908,679 31,46782.3 77.3
2.7 1.0
87 3719,352 25,774
124 106126 331
0.5 28.90.0 –0.1
31.3 13.49
1422
33.2
3.3 6.66,514 5,131
0.0 3.97,527 9,518100.0 62.9
0.0 11.3
0.8 0.416.6 12.587.1 17.9104 24
1,279 964
99 9,031
943.3 10.588 4296 100
.. 9897 10099 99
.. 98100 100
8.89.121 7
31.5 16.112.1 14.1
7.2 4.628.9 0.9
0.0 0.10.0 0.00.8 0.20.7 0.1
–3.9 5.2
Country data
High-income group
Population (millions) 25 Land area (1,000 sq. km) 2,000 GDP ($ billions) 375.8
Saudi Arabia
GNI per capita, World Bank Atlas method ($)Adjusted Net National Income per capita ($)Urban population (% of total)Urban population growth (average annual %, 1990-2009) AgricultureAgricultural land (% land area)Agricultural productivity, value added per worker (2000 $)Food production index (1999-2001=100)Population density, rural (people/ sq. km of arable land) Forests and biodiversityForest area (% land area)Deforestation (average annual %, 1990-2010)Nationally terrestrial protected area (% of land area)Threatened species, mammalsThreatened species, birdsThreatened species, fishThreatened species, higher plantsGEF benefits index for biodiversity (0-100, median is 1.5) EnergyGDP per unit of energy use (2005 PPP $/kg oil equivalent)Energy use per capita (kg oil equivalent)Energy from biomass products and waste (% of total)Electric power consumption per capita (kWh)Electricity generated using fossil fuel (% of total)Electricity generated by hydropower (% of total) Emissions and pollutionCO2 emissions per unit of GDP (kg/2005 PPP $)CO2 emissions per capita (metric tons)CO2 emissions growth (%, 1990–2007)Particulate matter (urban-pop.-weighted avg., μg/cu. m)Road sector energy use per capita (kg oil equivalent) Water and sanitationInternal freshwater resources per capita (cu. m)Freshwater withdrawal
Total (% of internal resources)Agriculture (% of total freshwater withdrawal)
Access to improved water source (% of total population)Rural (% of rural population)Urban (% of urban population)
Access to improved sanitation (% of total population)Rural (% of rural population)Urban (% of urban population)
Environment and healthAcute resp. infection prevalence (% of children under five)Diarrhea prevalence (% of children under five)Under-five mortality rate (per 1,000 live births) National accounting aggregates—savings, depletion and degradationGross savings (% of GNI)Consumption of fixed capital (% of GNI)Education expenditure (% of GNI)Energy depletion (% of GNI)Mineral depletion (% of GNI)Net forest depletion (% of GNI)CO2 damage (% of GNI)Particulate emissions damage (% of GNI)Adjusted net savings (% of GNI)
184 2011 The Little Green Data Book
Population (millions) 13 Land area (1,000 sq. km) 193 GDP ($ billions) 12.8
GNI per capita, World Bank Atlas method ($)Adjusted Net National Income per capita ($)Urban population (% of total)Urban population growth (average annual %, 1990-2009) AgricultureAgricultural land (% land area)Agricultural productivity, value added per worker (2000 $)Food production index (1999-2001=100)Population density, rural (people/ sq. km of arable land) Forests and biodiversityForest area (% land area)Deforestation (average annual %, 1990-2010)Nationally terrestrial protected area (% of land area)Threatened species, mammalsThreatened species, birdsThreatened species, fishThreatened species, higher plantsGEF benefits index for biodiversity (0-100, median is 1.5) EnergyGDP per unit of energy use (2005 PPP $/kg oil equivalent)Energy use per capita (kg oil equivalent)Energy from biomass products and waste (% of total)Electric power consumption per capita (kWh)Electricity generated using fossil fuel (% of total)Electricity generated by hydropower (% of total) Emissions and pollutionCO2 emissions per unit of GDP (kg/2005 PPP $)CO2 emissions per capita (metric tons)CO2 emissions growth (%, 1990–2007)Particulate matter (urban-pop.-weighted avg., μg/cu. m)Road sector energy use per capita (kg oil equivalent) Water and sanitationInternal freshwater resources per capita (cu. m)Freshwater withdrawal
Total (% of internal resources)Agriculture (% of total freshwater withdrawal)
Access to improved water source (% of total population)Rural (% of rural population)Urban (% of urban population)
Access to improved sanitation (% of total population)Rural (% of rural population)Urban (% of urban population)
Environment and healthAcute resp. infection prevalence (% of children under five)Diarrhea prevalence (% of children under five)Under-five mortality rate (per 1,000 live births) National accounting aggregates—savings, depletion and degradationGross savings (% of GNI)Consumption of fixed capital (% of GNI)Education expenditure (% of GNI)Energy depletion (% of GNI)Mineral depletion (% of GNI)Net forest depletion (% of GNI)CO2 damage (% of GNI)Particulate emissions damage (% of GNI)Adjusted net savings (% of GNI)
Population (millions) 7.3 Land area (1,000 sq. km) 88.4 GDP ($ billions) 43.0
Serbia
GNI per capita, World Bank Atlas method ($)Adjusted Net National Income per capita ($)Urban population (% of total)Urban population growth (average annual %, 1990-2009) AgricultureAgricultural land (% land area)Agricultural productivity, value added per worker (2000 $)Food production index (1999-2001=100)Population density, rural (people/ sq. km of arable land) Forests and biodiversityForest area (% land area)Deforestation (average annual %, 1990-2010)Nationally terrestrial protected area (% of land area)Threatened species, mammalsThreatened species, birdsThreatened species, fishThreatened species, higher plantsGEF benefits index for biodiversity (0-100, median is 1.5) EnergyGDP per unit of energy use (2005 PPP $/kg oil equivalent)Energy use per capita (kg oil equivalent)Energy from biomass products and waste (% of total)Electric power consumption per capita (kWh)Electricity generated using fossil fuel (% of total)Electricity generated by hydropower (% of total) Emissions and pollutionCO2 emissions per unit of GDP (kg/2005 PPP $)CO2 emissions per capita (metric tons)CO2 emissions growth (%, 1990–2007)Particulate matter (urban-pop.-weighted avg., μg/cu. m)Road sector energy use per capita (kg oil equivalent) Water and sanitationInternal freshwater resources per capita (cu. m)Freshwater withdrawal
Total (% of internal resources)Agriculture (% of total freshwater withdrawal)
Access to improved water source (% of total population)Rural (% of rural population)Urban (% of urban population)
Access to improved sanitation (% of total population)Rural (% of rural population)Urban (% of urban population)
Environment and healthAcute resp. infection prevalence (% of children under five)Diarrhea prevalence (% of children under five)Under-five mortality rate (per 1,000 live births) National accounting aggregates—savings, depletion and degradationGross savings (% of GNI)Consumption of fixed capital (% of GNI)Education expenditure (% of GNI)Energy depletion (% of GNI)Mineral depletion (% of GNI)Net forest depletion (% of GNI)CO2 damage (% of GNI)Particulate emissions damage (% of GNI)Adjusted net savings (% of GNI)
186 2011 The Little Green Data Book
Population (thousands) 88 Land area (1,000 sq. km) 0.5 GDP ($ millions) 764
GNI per capita, World Bank Atlas method ($)Adjusted Net National Income per capita ($)Urban population (% of total)Urban population growth (average annual %, 1990-2009) AgricultureAgricultural land (% land area)Agricultural productivity, value added per worker (2000 $)Food production index (1999-2001=100)Population density, rural (people/ sq. km of arable land) Forests and biodiversityForest area (% land area)Deforestation (average annual %, 1990-2010)Nationally terrestrial protected area (% of land area)Threatened species, mammalsThreatened species, birdsThreatened species, fishThreatened species, higher plantsGEF benefits index for biodiversity (0-100, median is 1.5) EnergyGDP per unit of energy use (2005 PPP $/kg oil equivalent)Energy use per capita (kg oil equivalent)Energy from biomass products and waste (% of total)Electric power consumption per capita (kWh)Electricity generated using fossil fuel (% of total)Electricity generated by hydropower (% of total) Emissions and pollutionCO2 emissions per unit of GDP (kg/2005 PPP $)CO2 emissions per capita (metric tons)CO2 emissions growth (%, 1990–2007)Particulate matter (urban-pop.-weighted avg., μg/cu. m)Road sector energy use per capita (kg oil equivalent) Water and sanitationInternal freshwater resources per capita (cu. m)Freshwater withdrawal
Total (% of internal resources)Agriculture (% of total freshwater withdrawal)
Access to improved water source (% of total population)Rural (% of rural population)Urban (% of urban population)
Access to improved sanitation (% of total population)Rural (% of rural population)Urban (% of urban population)
Environment and healthAcute resp. infection prevalence (% of children under five)Diarrhea prevalence (% of children under five)Under-five mortality rate (per 1,000 live births) National accounting aggregates—savings, depletion and degradationGross savings (% of GNI)Consumption of fixed capital (% of GNI)Education expenditure (% of GNI)Energy depletion (% of GNI)Mineral depletion (% of GNI)Net forest depletion (% of GNI)CO2 damage (% of GNI)Particulate emissions damage (% of GNI)Adjusted net savings (% of GNI)
Population (millions) 5.7 Land area (1,000 sq. km) 71.6 GDP ($ billions) 1.9
Sierra Leone
GNI per capita, World Bank Atlas method ($)Adjusted Net National Income per capita ($)Urban population (% of total)Urban population growth (average annual %, 1990-2009) AgricultureAgricultural land (% land area)Agricultural productivity, value added per worker (2000 $)Food production index (1999-2001=100)Population density, rural (people/ sq. km of arable land) Forests and biodiversityForest area (% land area)Deforestation (average annual %, 1990-2010)Nationally terrestrial protected area (% of land area)Threatened species, mammalsThreatened species, birdsThreatened species, fishThreatened species, higher plantsGEF benefits index for biodiversity (0-100, median is 1.5) EnergyGDP per unit of energy use (2005 PPP $/kg oil equivalent)Energy use per capita (kg oil equivalent)Energy from biomass products and waste (% of total)Electric power consumption per capita (kWh)Electricity generated using fossil fuel (% of total)Electricity generated by hydropower (% of total) Emissions and pollutionCO2 emissions per unit of GDP (kg/2005 PPP $)CO2 emissions per capita (metric tons)CO2 emissions growth (%, 1990–2007)Particulate matter (urban-pop.-weighted avg., μg/cu. m)Road sector energy use per capita (kg oil equivalent) Water and sanitationInternal freshwater resources per capita (cu. m)Freshwater withdrawal
Total (% of internal resources)Agriculture (% of total freshwater withdrawal)
Access to improved water source (% of total population)Rural (% of rural population)Urban (% of urban population)
Access to improved sanitation (% of total population)Rural (% of rural population)Urban (% of urban population)
Environment and healthAcute resp. infection prevalence (% of children under five)Diarrhea prevalence (% of children under five)Under-five mortality rate (per 1,000 live births) National accounting aggregates—savings, depletion and degradationGross savings (% of GNI)Consumption of fixed capital (% of GNI)Education expenditure (% of GNI)Energy depletion (% of GNI)Mineral depletion (% of GNI)Net forest depletion (% of GNI)CO2 damage (% of GNI)Particulate emissions damage (% of GNI)Adjusted net savings (% of GNI)
188 2011 The Little Green Data Book
Population (millions) 5.0 Land area (1,000 sq. km) 0.7 GDP ($ billions) 182.2
GNI per capita, World Bank Atlas method ($)Adjusted Net National Income per capita ($)Urban population (% of total)Urban population growth (average annual %, 1990-2009) AgricultureAgricultural land (% land area)Agricultural productivity, value added per worker (2000 $)Food production index (1999-2001=100)Population density, rural (people/ sq. km of arable land) Forests and biodiversityForest area (% land area)Deforestation (average annual %, 1990-2010)Nationally terrestrial protected area (% of land area)Threatened species, mammalsThreatened species, birdsThreatened species, fishThreatened species, higher plantsGEF benefits index for biodiversity (0-100, median is 1.5) EnergyGDP per unit of energy use (2005 PPP $/kg oil equivalent)Energy use per capita (kg oil equivalent)Energy from biomass products and waste (% of total)Electric power consumption per capita (kWh)Electricity generated using fossil fuel (% of total)Electricity generated by hydropower (% of total) Emissions and pollutionCO2 emissions per unit of GDP (kg/2005 PPP $)CO2 emissions per capita (metric tons)CO2 emissions growth (%, 1990–2007)Particulate matter (urban-pop.-weighted avg., μg/cu. m)Road sector energy use per capita (kg oil equivalent) Water and sanitationInternal freshwater resources per capita (cu. m)Freshwater withdrawal
Total (% of internal resources)Agriculture (% of total freshwater withdrawal)
Access to improved water source (% of total population)Rural (% of rural population)Urban (% of urban population)
Access to improved sanitation (% of total population)Rural (% of rural population)Urban (% of urban population)
Environment and healthAcute resp. infection prevalence (% of children under five)Diarrhea prevalence (% of children under five)Under-five mortality rate (per 1,000 live births) National accounting aggregates—savings, depletion and degradationGross savings (% of GNI)Consumption of fixed capital (% of GNI)Education expenditure (% of GNI)Energy depletion (% of GNI)Mineral depletion (% of GNI)Net forest depletion (% of GNI)CO2 damage (% of GNI)Particulate emissions damage (% of GNI)Adjusted net savings (% of GNI)
189The Little Green Data Book 2011
16,130 37,99013,541 31,467
56.7 77.30.1 1.0
40 378,919 25,774
97 106170 331
40.2 28.90.0 –0.1
23.5 13.43752
0.1
6.1 6.63,385 5,131
3.7 3.95,268 9,518
25.9 62.914.0 11.3
0.4 0.46.8 12.5
.. 17.913 24
379 964
2,334 9,031
.. 10.5
.. 42100 100100 98100 100100 9999 98
100 100
..
..7 7
29.9 16.113.0 14.1
3.6 4.60.0 0.90.0 0.10.3 0.00.4 0.20.0 0.1
19.8 5.2
Country data
High-income group
Population (millions) 5.4 Land area (1,000 sq. km) 48.1 GDP ($ billions) 87.6
Slovak Republic
GNI per capita, World Bank Atlas method ($)Adjusted Net National Income per capita ($)Urban population (% of total)Urban population growth (average annual %, 1990-2009) AgricultureAgricultural land (% land area)Agricultural productivity, value added per worker (2000 $)Food production index (1999-2001=100)Population density, rural (people/ sq. km of arable land) Forests and biodiversityForest area (% land area)Deforestation (average annual %, 1990-2010)Nationally terrestrial protected area (% of land area)Threatened species, mammalsThreatened species, birdsThreatened species, fishThreatened species, higher plantsGEF benefits index for biodiversity (0-100, median is 1.5) EnergyGDP per unit of energy use (2005 PPP $/kg oil equivalent)Energy use per capita (kg oil equivalent)Energy from biomass products and waste (% of total)Electric power consumption per capita (kWh)Electricity generated using fossil fuel (% of total)Electricity generated by hydropower (% of total) Emissions and pollutionCO2 emissions per unit of GDP (kg/2005 PPP $)CO2 emissions per capita (metric tons)CO2 emissions growth (%, 1990–2007)Particulate matter (urban-pop.-weighted avg., μg/cu. m)Road sector energy use per capita (kg oil equivalent) Water and sanitationInternal freshwater resources per capita (cu. m)Freshwater withdrawal
Total (% of internal resources)Agriculture (% of total freshwater withdrawal)
Access to improved water source (% of total population)Rural (% of rural population)Urban (% of urban population)
Access to improved sanitation (% of total population)Rural (% of rural population)Urban (% of urban population)
Environment and healthAcute resp. infection prevalence (% of children under five)Diarrhea prevalence (% of children under five)Under-five mortality rate (per 1,000 live births) National accounting aggregates—savings, depletion and degradationGross savings (% of GNI)Consumption of fixed capital (% of GNI)Education expenditure (% of GNI)Energy depletion (% of GNI)Mineral depletion (% of GNI)Net forest depletion (% of GNI)CO2 damage (% of GNI)Particulate emissions damage (% of GNI)Adjusted net savings (% of GNI)
190 2011 The Little Green Data Book
Population (millions) 2.0 Land area (1,000 sq. km) 20.1 GDP ($ billions) 48.5
Country data
High-income group
23,520 37,99019,965 31,467
48.3 77.3–0.1 1.0
25 3762,901 25,774
97 106574 331
62.2 28.9–0.2 –0.112.1 13.4
44
260
0.2
7.1 6.63,827 5,131
6.7 3.96,920 9,518
35.5 62.924.5 11.3
0.3 0.47.5 12.5
.. 17.929 24
985 964
9,251 9,031
.. 10.5
.. 4299 10099 98
100 100100 99100 98100 100
..
..3 7
22.7 16.113.5 14.1
4.9 4.60.1 0.90.0 0.10.1 0.00.3 0.20.1 0.1
13.6 5.2
Slovenia
GNI per capita, World Bank Atlas method ($)Adjusted Net National Income per capita ($)Urban population (% of total)Urban population growth (average annual %, 1990-2009) AgricultureAgricultural land (% land area)Agricultural productivity, value added per worker (2000 $)Food production index (1999-2001=100)Population density, rural (people/ sq. km of arable land) Forests and biodiversityForest area (% land area)Deforestation (average annual %, 1990-2010)Nationally terrestrial protected area (% of land area)Threatened species, mammalsThreatened species, birdsThreatened species, fishThreatened species, higher plantsGEF benefits index for biodiversity (0-100, median is 1.5) EnergyGDP per unit of energy use (2005 PPP $/kg oil equivalent)Energy use per capita (kg oil equivalent)Energy from biomass products and waste (% of total)Electric power consumption per capita (kWh)Electricity generated using fossil fuel (% of total)Electricity generated by hydropower (% of total) Emissions and pollutionCO2 emissions per unit of GDP (kg/2005 PPP $)CO2 emissions per capita (metric tons)CO2 emissions growth (%, 1990–2007)Particulate matter (urban-pop.-weighted avg., μg/cu. m)Road sector energy use per capita (kg oil equivalent) Water and sanitationInternal freshwater resources per capita (cu. m)Freshwater withdrawal
Total (% of internal resources)Agriculture (% of total freshwater withdrawal)
Access to improved water source (% of total population)Rural (% of rural population)Urban (% of urban population)
Access to improved sanitation (% of total population)Rural (% of rural population)Urban (% of urban population)
Environment and healthAcute resp. infection prevalence (% of children under five)Diarrhea prevalence (% of children under five)Under-five mortality rate (per 1,000 live births) National accounting aggregates—savings, depletion and degradationGross savings (% of GNI)Consumption of fixed capital (% of GNI)Education expenditure (% of GNI)Energy depletion (% of GNI)Mineral depletion (% of GNI)Net forest depletion (% of GNI)CO2 damage (% of GNI)Particulate emissions damage (% of GNI)Adjusted net savings (% of GNI)
Population (thousands) 523 Land area (1,000 sq. km) 28 GDP ($ millions) 657
Solomon Islands
GNI per capita, World Bank Atlas method ($)Adjusted Net National Income per capita ($)Urban population (% of total)Urban population growth (average annual %, 1990-2009) AgricultureAgricultural land (% land area)Agricultural productivity, value added per worker (2000 $)Food production index (1999-2001=100)Population density, rural (people/ sq. km of arable land) Forests and biodiversityForest area (% land area)Deforestation (average annual %, 1990-2010)Nationally terrestrial protected area (% of land area)Threatened species, mammalsThreatened species, birdsThreatened species, fishThreatened species, higher plantsGEF benefits index for biodiversity (0-100, median is 1.5) EnergyGDP per unit of energy use (2005 PPP $/kg oil equivalent)Energy use per capita (kg oil equivalent)Energy from biomass products and waste (% of total)Electric power consumption per capita (kWh)Electricity generated using fossil fuel (% of total)Electricity generated by hydropower (% of total) Emissions and pollutionCO2 emissions per unit of GDP (kg/2005 PPP $)CO2 emissions per capita (metric tons)CO2 emissions growth (%, 1990–2007)Particulate matter (urban-pop.-weighted avg., μg/cu. m)Road sector energy use per capita (kg oil equivalent) Water and sanitationInternal freshwater resources per capita (cu. m)Freshwater withdrawal
Total (% of internal resources)Agriculture (% of total freshwater withdrawal)
Access to improved water source (% of total population)Rural (% of rural population)Urban (% of urban population)
Access to improved sanitation (% of total population)Rural (% of rural population)Urban (% of urban population)
Environment and healthAcute resp. infection prevalence (% of children under five)Diarrhea prevalence (% of children under five)Under-five mortality rate (per 1,000 live births) National accounting aggregates—savings, depletion and degradationGross savings (% of GNI)Consumption of fixed capital (% of GNI)Education expenditure (% of GNI)Energy depletion (% of GNI)Mineral depletion (% of GNI)Net forest depletion (% of GNI)CO2 damage (% of GNI)Particulate emissions damage (% of GNI)Adjusted net savings (% of GNI)
192 2011 The Little Green Data Book
Population (millions) 9.1 Land area (1,000 sq. km) 627.3 GDP ($ millions) ..
Country data
Sub-Saharan Africa group
Low-income group
.. 1,125 523
.. 861 2937.0 36.9 3.52.9 4.0 2.2
70 45 38.. 314 318
104 130 125567 356 666
10.8 28.0 24.70.7 0.3 0.70.6 11.7 11.915112621
6.1
.. 3.2 3.2
.. 678 423
.. 57.7 49.3
.. 531 324
.. 66.2 41.6
.. 17.2 41.9
.. 0.4 0.40.07 0.85 0.51
3,180.0 46.1 –6.031 49 65
.. 57 37
687 4,826 5,004
55.0 3.2 9.499 87 8830 60 67
9 47 6067 82 8623 31 38
6 24 3352 43 52
..23.4180 130 118
.. 15.5 25.9
.. 10.6 7.9
.. 3.6 3.4
.. 7.5 7.8
.. 1.2 1.0
.. 0.6 1.0
.. 0.6 0.7
.. 0.3 0.3
.. –1.8 10.7
Somalia
GNI per capita, World Bank Atlas method ($)Adjusted Net National Income per capita ($)Urban population (% of total)Urban population growth (average annual %, 1990-2009) AgricultureAgricultural land (% land area)Agricultural productivity, value added per worker (2000 $)Food production index (1999-2001=100)Population density, rural (people/ sq. km of arable land) Forests and biodiversityForest area (% land area)Deforestation (average annual %, 1990-2010)Nationally terrestrial protected area (% of land area)Threatened species, mammalsThreatened species, birdsThreatened species, fishThreatened species, higher plantsGEF benefits index for biodiversity (0-100, median is 1.5) EnergyGDP per unit of energy use (2005 PPP $/kg oil equivalent)Energy use per capita (kg oil equivalent)Energy from biomass products and waste (% of total)Electric power consumption per capita (kWh)Electricity generated using fossil fuel (% of total)Electricity generated by hydropower (% of total) Emissions and pollutionCO2 emissions per unit of GDP (kg/2005 PPP $)CO2 emissions per capita (metric tons)CO2 emissions growth (%, 1990–2007)Particulate matter (urban-pop.-weighted avg., μg/cu. m)Road sector energy use per capita (kg oil equivalent) Water and sanitationInternal freshwater resources per capita (cu. m)Freshwater withdrawal
Total (% of internal resources)Agriculture (% of total freshwater withdrawal)
Access to improved water source (% of total population)Rural (% of rural population)Urban (% of urban population)
Access to improved sanitation (% of total population)Rural (% of rural population)Urban (% of urban population)
Environment and healthAcute resp. infection prevalence (% of children under five)Diarrhea prevalence (% of children under five)Under-five mortality rate (per 1,000 live births) National accounting aggregates—savings, depletion and degradationGross savings (% of GNI)Consumption of fixed capital (% of GNI)Education expenditure (% of GNI)Energy depletion (% of GNI)Mineral depletion (% of GNI)Net forest depletion (% of GNI)CO2 damage (% of GNI)Particulate emissions damage (% of GNI)Adjusted net savings (% of GNI)
Population (millions) 49 Land area (1,000 sq. km) 1,214 GDP ($ billions) 285.4
South Africa
GNI per capita, World Bank Atlas method ($)Adjusted Net National Income per capita ($)Urban population (% of total)Urban population growth (average annual %, 1990-2009) AgricultureAgricultural land (% land area)Agricultural productivity, value added per worker (2000 $)Food production index (1999-2001=100)Population density, rural (people/ sq. km of arable land) Forests and biodiversityForest area (% land area)Deforestation (average annual %, 1990-2010)Nationally terrestrial protected area (% of land area)Threatened species, mammalsThreatened species, birdsThreatened species, fishThreatened species, higher plantsGEF benefits index for biodiversity (0-100, median is 1.5) EnergyGDP per unit of energy use (2005 PPP $/kg oil equivalent)Energy use per capita (kg oil equivalent)Energy from biomass products and waste (% of total)Electric power consumption per capita (kWh)Electricity generated using fossil fuel (% of total)Electricity generated by hydropower (% of total) Emissions and pollutionCO2 emissions per unit of GDP (kg/2005 PPP $)CO2 emissions per capita (metric tons)CO2 emissions growth (%, 1990–2007)Particulate matter (urban-pop.-weighted avg., μg/cu. m)Road sector energy use per capita (kg oil equivalent) Water and sanitationInternal freshwater resources per capita (cu. m)Freshwater withdrawal
Total (% of internal resources)Agriculture (% of total freshwater withdrawal)
Access to improved water source (% of total population)Rural (% of rural population)Urban (% of urban population)
Access to improved sanitation (% of total population)Rural (% of rural population)Urban (% of urban population)
Environment and healthAcute resp. infection prevalence (% of children under five)Diarrhea prevalence (% of children under five)Under-five mortality rate (per 1,000 live births) National accounting aggregates—savings, depletion and degradationGross savings (% of GNI)Consumption of fixed capital (% of GNI)Education expenditure (% of GNI)Energy depletion (% of GNI)Mineral depletion (% of GNI)Net forest depletion (% of GNI)CO2 damage (% of GNI)Particulate emissions damage (% of GNI)Adjusted net savings (% of GNI)
194 2011 The Little Green Data Book
32,120 37,99026,787 31,467
77.3 77.31.0 1.0
56 3720,824 25,774
97 10683 331
36.4 28.9–0.9 –0.18.6 13.416156255
6.8
9.3 6.63,047 5,131
4.2 3.96,315 9,51860.9 62.9
7.6 11.3
0.3 0.48.0 12.5
57.9 17.928 24
703 964
2,478 9,031
33.4 10.565 42
100 100100 98100 100100 99100 98100 100
..
..4 7
19.9 16.113.9 14.1
4.0 4.60.0 0.90.0 0.10.0 0.00.2 0.20.2 0.19.7 5.2
Country data
High-income group
Population (millions) 46 Land area (1,000 sq. km) 499 GDP ($ billions) 1,460.3
Spain
GNI per capita, World Bank Atlas method ($)Adjusted Net National Income per capita ($)Urban population (% of total)Urban population growth (average annual %, 1990-2009) AgricultureAgricultural land (% land area)Agricultural productivity, value added per worker (2000 $)Food production index (1999-2001=100)Population density, rural (people/ sq. km of arable land) Forests and biodiversityForest area (% land area)Deforestation (average annual %, 1990-2010)Nationally terrestrial protected area (% of land area)Threatened species, mammalsThreatened species, birdsThreatened species, fishThreatened species, higher plantsGEF benefits index for biodiversity (0-100, median is 1.5) EnergyGDP per unit of energy use (2005 PPP $/kg oil equivalent)Energy use per capita (kg oil equivalent)Energy from biomass products and waste (% of total)Electric power consumption per capita (kWh)Electricity generated using fossil fuel (% of total)Electricity generated by hydropower (% of total) Emissions and pollutionCO2 emissions per unit of GDP (kg/2005 PPP $)CO2 emissions per capita (metric tons)CO2 emissions growth (%, 1990–2007)Particulate matter (urban-pop.-weighted avg., μg/cu. m)Road sector energy use per capita (kg oil equivalent) Water and sanitationInternal freshwater resources per capita (cu. m)Freshwater withdrawal
Total (% of internal resources)Agriculture (% of total freshwater withdrawal)
Access to improved water source (% of total population)Rural (% of rural population)Urban (% of urban population)
Access to improved sanitation (% of total population)Rural (% of rural population)Urban (% of urban population)
Environment and healthAcute resp. infection prevalence (% of children under five)Diarrhea prevalence (% of children under five)Under-five mortality rate (per 1,000 live births) National accounting aggregates—savings, depletion and degradationGross savings (% of GNI)Consumption of fixed capital (% of GNI)Education expenditure (% of GNI)Energy depletion (% of GNI)Mineral depletion (% of GNI)Net forest depletion (% of GNI)CO2 damage (% of GNI)Particulate emissions damage (% of GNI)Adjusted net savings (% of GNI)
Population (millions) 20 Land area (1,000 sq. km) 63 GDP ($ billions) 42.0
Sri Lanka
GNI per capita, World Bank Atlas method ($)Adjusted Net National Income per capita ($)Urban population (% of total)Urban population growth (average annual %, 1990-2009) AgricultureAgricultural land (% land area)Agricultural productivity, value added per worker (2000 $)Food production index (1999-2001=100)Population density, rural (people/ sq. km of arable land) Forests and biodiversityForest area (% land area)Deforestation (average annual %, 1990-2010)Nationally terrestrial protected area (% of land area)Threatened species, mammalsThreatened species, birdsThreatened species, fishThreatened species, higher plantsGEF benefits index for biodiversity (0-100, median is 1.5) EnergyGDP per unit of energy use (2005 PPP $/kg oil equivalent)Energy use per capita (kg oil equivalent)Energy from biomass products and waste (% of total)Electric power consumption per capita (kWh)Electricity generated using fossil fuel (% of total)Electricity generated by hydropower (% of total) Emissions and pollutionCO2 emissions per unit of GDP (kg/2005 PPP $)CO2 emissions per capita (metric tons)CO2 emissions growth (%, 1990–2007)Particulate matter (urban-pop.-weighted avg., μg/cu. m)Road sector energy use per capita (kg oil equivalent) Water and sanitationInternal freshwater resources per capita (cu. m)Freshwater withdrawal
Total (% of internal resources)Agriculture (% of total freshwater withdrawal)
Access to improved water source (% of total population)Rural (% of rural population)Urban (% of urban population)
Access to improved sanitation (% of total population)Rural (% of rural population)Urban (% of urban population)
Environment and healthAcute resp. infection prevalence (% of children under five)Diarrhea prevalence (% of children under five)Under-five mortality rate (per 1,000 live births) National accounting aggregates—savings, depletion and degradationGross savings (% of GNI)Consumption of fixed capital (% of GNI)Education expenditure (% of GNI)Energy depletion (% of GNI)Mineral depletion (% of GNI)Net forest depletion (% of GNI)CO2 damage (% of GNI)Particulate emissions damage (% of GNI)Adjusted net savings (% of GNI)
196 2011 The Little Green Data Book
Population (thousands) 50 Land area (1,000 sq. km) 0.3 GDP ($ millions) 545
GNI per capita, World Bank Atlas method ($)Adjusted Net National Income per capita ($)Urban population (% of total)Urban population growth (average annual %, 1990-2009) AgricultureAgricultural land (% land area)Agricultural productivity, value added per worker (2000 $)Food production index (1999-2001=100)Population density, rural (people/ sq. km of arable land) Forests and biodiversityForest area (% land area)Deforestation (average annual %, 1990-2010)Nationally terrestrial protected area (% of land area)Threatened species, mammalsThreatened species, birdsThreatened species, fishThreatened species, higher plantsGEF benefits index for biodiversity (0-100, median is 1.5) EnergyGDP per unit of energy use (2005 PPP $/kg oil equivalent)Energy use per capita (kg oil equivalent)Energy from biomass products and waste (% of total)Electric power consumption per capita (kWh)Electricity generated using fossil fuel (% of total)Electricity generated by hydropower (% of total) Emissions and pollutionCO2 emissions per unit of GDP (kg/2005 PPP $)CO2 emissions per capita (metric tons)CO2 emissions growth (%, 1990–2007)Particulate matter (urban-pop.-weighted avg., μg/cu. m)Road sector energy use per capita (kg oil equivalent) Water and sanitationInternal freshwater resources per capita (cu. m)Freshwater withdrawal
Total (% of internal resources)Agriculture (% of total freshwater withdrawal)
Access to improved water source (% of total population)Rural (% of rural population)Urban (% of urban population)
Access to improved sanitation (% of total population)Rural (% of rural population)Urban (% of urban population)
Environment and healthAcute resp. infection prevalence (% of children under five)Diarrhea prevalence (% of children under five)Under-five mortality rate (per 1,000 live births) National accounting aggregates—savings, depletion and degradationGross savings (% of GNI)Consumption of fixed capital (% of GNI)Education expenditure (% of GNI)Energy depletion (% of GNI)Mineral depletion (% of GNI)Net forest depletion (% of GNI)CO2 damage (% of GNI)Particulate emissions damage (% of GNI)Adjusted net savings (% of GNI)
Population (thousands) 172 Land area (1,000 sq. km) 0.6 GDP ($ millions) 946
St. Lucia
GNI per capita, World Bank Atlas method ($)Adjusted Net National Income per capita ($)Urban population (% of total)Urban population growth (average annual %, 1990-2009) AgricultureAgricultural land (% land area)Agricultural productivity, value added per worker (2000 $)Food production index (1999-2001=100)Population density, rural (people/ sq. km of arable land) Forests and biodiversityForest area (% land area)Deforestation (average annual %, 1990-2010)Nationally terrestrial protected area (% of land area)Threatened species, mammalsThreatened species, birdsThreatened species, fishThreatened species, higher plantsGEF benefits index for biodiversity (0-100, median is 1.5) EnergyGDP per unit of energy use (2005 PPP $/kg oil equivalent)Energy use per capita (kg oil equivalent)Energy from biomass products and waste (% of total)Electric power consumption per capita (kWh)Electricity generated using fossil fuel (% of total)Electricity generated by hydropower (% of total) Emissions and pollutionCO2 emissions per unit of GDP (kg/2005 PPP $)CO2 emissions per capita (metric tons)CO2 emissions growth (%, 1990–2007)Particulate matter (urban-pop.-weighted avg., μg/cu. m)Road sector energy use per capita (kg oil equivalent) Water and sanitationInternal freshwater resources per capita (cu. m)Freshwater withdrawal
Total (% of internal resources)Agriculture (% of total freshwater withdrawal)
Access to improved water source (% of total population)Rural (% of rural population)Urban (% of urban population)
Access to improved sanitation (% of total population)Rural (% of rural population)Urban (% of urban population)
Environment and healthAcute resp. infection prevalence (% of children under five)Diarrhea prevalence (% of children under five)Under-five mortality rate (per 1,000 live births) National accounting aggregates—savings, depletion and degradationGross savings (% of GNI)Consumption of fixed capital (% of GNI)Education expenditure (% of GNI)Energy depletion (% of GNI)Mineral depletion (% of GNI)Net forest depletion (% of GNI)CO2 damage (% of GNI)Particulate emissions damage (% of GNI)Adjusted net savings (% of GNI)
198 2011 The Little Green Data Book
Population (thousands) 109 Land area (1,000 sq. km) 0.4 GDP ($ millions) 583
GNI per capita, World Bank Atlas method ($)Adjusted Net National Income per capita ($)Urban population (% of total)Urban population growth (average annual %, 1990-2009) AgricultureAgricultural land (% land area)Agricultural productivity, value added per worker (2000 $)Food production index (1999-2001=100)Population density, rural (people/ sq. km of arable land) Forests and biodiversityForest area (% land area)Deforestation (average annual %, 1990-2010)Nationally terrestrial protected area (% of land area)Threatened species, mammalsThreatened species, birdsThreatened species, fishThreatened species, higher plantsGEF benefits index for biodiversity (0-100, median is 1.5) EnergyGDP per unit of energy use (2005 PPP $/kg oil equivalent)Energy use per capita (kg oil equivalent)Energy from biomass products and waste (% of total)Electric power consumption per capita (kWh)Electricity generated using fossil fuel (% of total)Electricity generated by hydropower (% of total) Emissions and pollutionCO2 emissions per unit of GDP (kg/2005 PPP $)CO2 emissions per capita (metric tons)CO2 emissions growth (%, 1990–2007)Particulate matter (urban-pop.-weighted avg., μg/cu. m)Road sector energy use per capita (kg oil equivalent) Water and sanitationInternal freshwater resources per capita (cu. m)Freshwater withdrawal
Total (% of internal resources)Agriculture (% of total freshwater withdrawal)
Access to improved water source (% of total population)Rural (% of rural population)Urban (% of urban population)
Access to improved sanitation (% of total population)Rural (% of rural population)Urban (% of urban population)
Environment and healthAcute resp. infection prevalence (% of children under five)Diarrhea prevalence (% of children under five)Under-five mortality rate (per 1,000 live births) National accounting aggregates—savings, depletion and degradationGross savings (% of GNI)Consumption of fixed capital (% of GNI)Education expenditure (% of GNI)Energy depletion (% of GNI)Mineral depletion (% of GNI)Net forest depletion (% of GNI)CO2 damage (% of GNI)Particulate emissions damage (% of GNI)Adjusted net savings (% of GNI)
Population (millions) 42 Land area (1,000 sq. km) 2,376 GDP ($ billions) 54.7
Sudan
GNI per capita, World Bank Atlas method ($)Adjusted Net National Income per capita ($)Urban population (% of total)Urban population growth (average annual %, 1990-2009) AgricultureAgricultural land (% land area)Agricultural productivity, value added per worker (2000 $)Food production index (1999-2001=100)Population density, rural (people/ sq. km of arable land) Forests and biodiversityForest area (% land area)Deforestation (average annual %, 1990-2010)Nationally terrestrial protected area (% of land area)Threatened species, mammalsThreatened species, birdsThreatened species, fishThreatened species, higher plantsGEF benefits index for biodiversity (0-100, median is 1.5) EnergyGDP per unit of energy use (2005 PPP $/kg oil equivalent)Energy use per capita (kg oil equivalent)Energy from biomass products and waste (% of total)Electric power consumption per capita (kWh)Electricity generated using fossil fuel (% of total)Electricity generated by hydropower (% of total) Emissions and pollutionCO2 emissions per unit of GDP (kg/2005 PPP $)CO2 emissions per capita (metric tons)CO2 emissions growth (%, 1990–2007)Particulate matter (urban-pop.-weighted avg., μg/cu. m)Road sector energy use per capita (kg oil equivalent) Water and sanitationInternal freshwater resources per capita (cu. m)Freshwater withdrawal
Total (% of internal resources)Agriculture (% of total freshwater withdrawal)
Access to improved water source (% of total population)Rural (% of rural population)Urban (% of urban population)
Access to improved sanitation (% of total population)Rural (% of rural population)Urban (% of urban population)
Environment and healthAcute resp. infection prevalence (% of children under five)Diarrhea prevalence (% of children under five)Under-five mortality rate (per 1,000 live births) National accounting aggregates—savings, depletion and degradationGross savings (% of GNI)Consumption of fixed capital (% of GNI)Education expenditure (% of GNI)Energy depletion (% of GNI)Mineral depletion (% of GNI)Net forest depletion (% of GNI)CO2 damage (% of GNI)Particulate emissions damage (% of GNI)Adjusted net savings (% of GNI)
200 2011 The Little Green Data Book
Population (thousands) 520 Land area (1,000 sq. km) 156 GDP ($ billions) 3.0
GNI per capita, World Bank Atlas method ($)Adjusted Net National Income per capita ($)Urban population (% of total)Urban population growth (average annual %, 1990-2009) AgricultureAgricultural land (% land area)Agricultural productivity, value added per worker (2000 $)Food production index (1999-2001=100)Population density, rural (people/ sq. km of arable land) Forests and biodiversityForest area (% land area)Deforestation (average annual %, 1990-2010)Nationally terrestrial protected area (% of land area)Threatened species, mammalsThreatened species, birdsThreatened species, fishThreatened species, higher plantsGEF benefits index for biodiversity (0-100, median is 1.5) EnergyGDP per unit of energy use (2005 PPP $/kg oil equivalent)Energy use per capita (kg oil equivalent)Energy from biomass products and waste (% of total)Electric power consumption per capita (kWh)Electricity generated using fossil fuel (% of total)Electricity generated by hydropower (% of total) Emissions and pollutionCO2 emissions per unit of GDP (kg/2005 PPP $)CO2 emissions per capita (metric tons)CO2 emissions growth (%, 1990–2007)Particulate matter (urban-pop.-weighted avg., μg/cu. m)Road sector energy use per capita (kg oil equivalent) Water and sanitationInternal freshwater resources per capita (cu. m)Freshwater withdrawal
Total (% of internal resources)Agriculture (% of total freshwater withdrawal)
Access to improved water source (% of total population)Rural (% of rural population)Urban (% of urban population)
Access to improved sanitation (% of total population)Rural (% of rural population)Urban (% of urban population)
Environment and healthAcute resp. infection prevalence (% of children under five)Diarrhea prevalence (% of children under five)Under-five mortality rate (per 1,000 live births) National accounting aggregates—savings, depletion and degradationGross savings (% of GNI)Consumption of fixed capital (% of GNI)Education expenditure (% of GNI)Energy depletion (% of GNI)Mineral depletion (% of GNI)Net forest depletion (% of GNI)CO2 damage (% of GNI)Particulate emissions damage (% of GNI)Adjusted net savings (% of GNI)
Population (millions) 1.2 Land area (1,000 sq. km) 17.2 GDP ($ billions) 3.0
Swaziland
GNI per capita, World Bank Atlas method ($)Adjusted Net National Income per capita ($)Urban population (% of total)Urban population growth (average annual %, 1990-2009) AgricultureAgricultural land (% land area)Agricultural productivity, value added per worker (2000 $)Food production index (1999-2001=100)Population density, rural (people/ sq. km of arable land) Forests and biodiversityForest area (% land area)Deforestation (average annual %, 1990-2010)Nationally terrestrial protected area (% of land area)Threatened species, mammalsThreatened species, birdsThreatened species, fishThreatened species, higher plantsGEF benefits index for biodiversity (0-100, median is 1.5) EnergyGDP per unit of energy use (2005 PPP $/kg oil equivalent)Energy use per capita (kg oil equivalent)Energy from biomass products and waste (% of total)Electric power consumption per capita (kWh)Electricity generated using fossil fuel (% of total)Electricity generated by hydropower (% of total) Emissions and pollutionCO2 emissions per unit of GDP (kg/2005 PPP $)CO2 emissions per capita (metric tons)CO2 emissions growth (%, 1990–2007)Particulate matter (urban-pop.-weighted avg., μg/cu. m)Road sector energy use per capita (kg oil equivalent) Water and sanitationInternal freshwater resources per capita (cu. m)Freshwater withdrawal
Total (% of internal resources)Agriculture (% of total freshwater withdrawal)
Access to improved water source (% of total population)Rural (% of rural population)Urban (% of urban population)
Access to improved sanitation (% of total population)Rural (% of rural population)Urban (% of urban population)
Environment and healthAcute resp. infection prevalence (% of children under five)Diarrhea prevalence (% of children under five)Under-five mortality rate (per 1,000 live births) National accounting aggregates—savings, depletion and degradationGross savings (% of GNI)Consumption of fixed capital (% of GNI)Education expenditure (% of GNI)Energy depletion (% of GNI)Mineral depletion (% of GNI)Net forest depletion (% of GNI)CO2 damage (% of GNI)Particulate emissions damage (% of GNI)Adjusted net savings (% of GNI)
202 2011 The Little Green Data Book
Population (millions) 9.3 Land area (1,000 sq. km) 410.3 GDP ($ billions) 406.1
Country data
High-income group
48,840 37,99038,426 31,467
84.6 77.30.5 1.0
8 3749,548 25,774
100 10654 331
68.7 28.9–0.1 –0.111.3 13.4
13
113
0.3
6.4 6.65,379 5,131
20.0 3.914,869 9,518
2.1 62.946.1 11.3
0.2 0.45.4 12.5
–4.8 17.911 24
844 964
18,692 9,031
1.6 10.59 42
100 100100 98100 100100 99100 98100 100
..
..3 7
23.6 16.113.3 14.1
6.1 4.60.0 0.90.2 0.10.0 0.00.1 0.20.0 0.1
16.0 5.2
Sweden
GNI per capita, World Bank Atlas method ($)Adjusted Net National Income per capita ($)Urban population (% of total)Urban population growth (average annual %, 1990-2009) AgricultureAgricultural land (% land area)Agricultural productivity, value added per worker (2000 $)Food production index (1999-2001=100)Population density, rural (people/ sq. km of arable land) Forests and biodiversityForest area (% land area)Deforestation (average annual %, 1990-2010)Nationally terrestrial protected area (% of land area)Threatened species, mammalsThreatened species, birdsThreatened species, fishThreatened species, higher plantsGEF benefits index for biodiversity (0-100, median is 1.5) EnergyGDP per unit of energy use (2005 PPP $/kg oil equivalent)Energy use per capita (kg oil equivalent)Energy from biomass products and waste (% of total)Electric power consumption per capita (kWh)Electricity generated using fossil fuel (% of total)Electricity generated by hydropower (% of total) Emissions and pollutionCO2 emissions per unit of GDP (kg/2005 PPP $)CO2 emissions per capita (metric tons)CO2 emissions growth (%, 1990–2007)Particulate matter (urban-pop.-weighted avg., μg/cu. m)Road sector energy use per capita (kg oil equivalent) Water and sanitationInternal freshwater resources per capita (cu. m)Freshwater withdrawal
Total (% of internal resources)Agriculture (% of total freshwater withdrawal)
Access to improved water source (% of total population)Rural (% of rural population)Urban (% of urban population)
Access to improved sanitation (% of total population)Rural (% of rural population)Urban (% of urban population)
Environment and healthAcute resp. infection prevalence (% of children under five)Diarrhea prevalence (% of children under five)Under-five mortality rate (per 1,000 live births) National accounting aggregates—savings, depletion and degradationGross savings (% of GNI)Consumption of fixed capital (% of GNI)Education expenditure (% of GNI)Energy depletion (% of GNI)Mineral depletion (% of GNI)Net forest depletion (% of GNI)CO2 damage (% of GNI)Particulate emissions damage (% of GNI)Adjusted net savings (% of GNI)
Population (millions) 7.7 Land area (1,000 sq. km) 40 GDP ($ billions) 491.9
Switzerland
GNI per capita, World Bank Atlas method ($)Adjusted Net National Income per capita ($)Urban population (% of total)Urban population growth (average annual %, 1990-2009) AgricultureAgricultural land (% land area)Agricultural productivity, value added per worker (2000 $)Food production index (1999-2001=100)Population density, rural (people/ sq. km of arable land) Forests and biodiversityForest area (% land area)Deforestation (average annual %, 1990-2010)Nationally terrestrial protected area (% of land area)Threatened species, mammalsThreatened species, birdsThreatened species, fishThreatened species, higher plantsGEF benefits index for biodiversity (0-100, median is 1.5) EnergyGDP per unit of energy use (2005 PPP $/kg oil equivalent)Energy use per capita (kg oil equivalent)Energy from biomass products and waste (% of total)Electric power consumption per capita (kWh)Electricity generated using fossil fuel (% of total)Electricity generated by hydropower (% of total) Emissions and pollutionCO2 emissions per unit of GDP (kg/2005 PPP $)CO2 emissions per capita (metric tons)CO2 emissions growth (%, 1990–2007)Particulate matter (urban-pop.-weighted avg., μg/cu. m)Road sector energy use per capita (kg oil equivalent) Water and sanitationInternal freshwater resources per capita (cu. m)Freshwater withdrawal
Total (% of internal resources)Agriculture (% of total freshwater withdrawal)
Access to improved water source (% of total population)Rural (% of rural population)Urban (% of urban population)
Access to improved sanitation (% of total population)Rural (% of rural population)Urban (% of urban population)
Environment and healthAcute resp. infection prevalence (% of children under five)Diarrhea prevalence (% of children under five)Under-five mortality rate (per 1,000 live births) National accounting aggregates—savings, depletion and degradationGross savings (% of GNI)Consumption of fixed capital (% of GNI)Education expenditure (% of GNI)Energy depletion (% of GNI)Mineral depletion (% of GNI)Net forest depletion (% of GNI)CO2 damage (% of GNI)Particulate emissions damage (% of GNI)Adjusted net savings (% of GNI)
204 2011 The Little Green Data Book
Population (millions) 21 Land area (1,000 sq. km) 184 GDP ($ billions) 52.2
GNI per capita, World Bank Atlas method ($)Adjusted Net National Income per capita ($)Urban population (% of total)Urban population growth (average annual %, 1990-2009) AgricultureAgricultural land (% land area)Agricultural productivity, value added per worker (2000 $)Food production index (1999-2001=100)Population density, rural (people/ sq. km of arable land) Forests and biodiversityForest area (% land area)Deforestation (average annual %, 1990-2010)Nationally terrestrial protected area (% of land area)Threatened species, mammalsThreatened species, birdsThreatened species, fishThreatened species, higher plantsGEF benefits index for biodiversity (0-100, median is 1.5) EnergyGDP per unit of energy use (2005 PPP $/kg oil equivalent)Energy use per capita (kg oil equivalent)Energy from biomass products and waste (% of total)Electric power consumption per capita (kWh)Electricity generated using fossil fuel (% of total)Electricity generated by hydropower (% of total) Emissions and pollutionCO2 emissions per unit of GDP (kg/2005 PPP $)CO2 emissions per capita (metric tons)CO2 emissions growth (%, 1990–2007)Particulate matter (urban-pop.-weighted avg., μg/cu. m)Road sector energy use per capita (kg oil equivalent) Water and sanitationInternal freshwater resources per capita (cu. m)Freshwater withdrawal
Total (% of internal resources)Agriculture (% of total freshwater withdrawal)
Access to improved water source (% of total population)Rural (% of rural population)Urban (% of urban population)
Access to improved sanitation (% of total population)Rural (% of rural population)Urban (% of urban population)
Environment and healthAcute resp. infection prevalence (% of children under five)Diarrhea prevalence (% of children under five)Under-five mortality rate (per 1,000 live births) National accounting aggregates—savings, depletion and degradationGross savings (% of GNI)Consumption of fixed capital (% of GNI)Education expenditure (% of GNI)Energy depletion (% of GNI)Mineral depletion (% of GNI)Net forest depletion (% of GNI)CO2 damage (% of GNI)Particulate emissions damage (% of GNI)Adjusted net savings (% of GNI)
Population (millions) 7.0 Land area (1,000 sq. km) 140.0 GDP ($ billions) 5.0
Tajikistan
GNI per capita, World Bank Atlas method ($)Adjusted Net National Income per capita ($)Urban population (% of total)Urban population growth (average annual %, 1990-2009) AgricultureAgricultural land (% land area)Agricultural productivity, value added per worker (2000 $)Food production index (1999-2001=100)Population density, rural (people/ sq. km of arable land) Forests and biodiversityForest area (% land area)Deforestation (average annual %, 1990-2010)Nationally terrestrial protected area (% of land area)Threatened species, mammalsThreatened species, birdsThreatened species, fishThreatened species, higher plantsGEF benefits index for biodiversity (0-100, median is 1.5) EnergyGDP per unit of energy use (2005 PPP $/kg oil equivalent)Energy use per capita (kg oil equivalent)Energy from biomass products and waste (% of total)Electric power consumption per capita (kWh)Electricity generated using fossil fuel (% of total)Electricity generated by hydropower (% of total) Emissions and pollutionCO2 emissions per unit of GDP (kg/2005 PPP $)CO2 emissions per capita (metric tons)CO2 emissions growth (%, 1990–2007)Particulate matter (urban-pop.-weighted avg., μg/cu. m)Road sector energy use per capita (kg oil equivalent) Water and sanitationInternal freshwater resources per capita (cu. m)Freshwater withdrawal
Total (% of internal resources)Agriculture (% of total freshwater withdrawal)
Access to improved water source (% of total population)Rural (% of rural population)Urban (% of urban population)
Access to improved sanitation (% of total population)Rural (% of rural population)Urban (% of urban population)
Environment and healthAcute resp. infection prevalence (% of children under five)Diarrhea prevalence (% of children under five)Under-five mortality rate (per 1,000 live births) National accounting aggregates—savings, depletion and degradationGross savings (% of GNI)Consumption of fixed capital (% of GNI)Education expenditure (% of GNI)Energy depletion (% of GNI)Mineral depletion (% of GNI)Net forest depletion (% of GNI)CO2 damage (% of GNI)Particulate emissions damage (% of GNI)Adjusted net savings (% of GNI)
206 2011 The Little Green Data Book
Population (millions) 44 Land area (1,000 sq. km) 886 GDP ($ billions) 21.4
GNI per capita, World Bank Atlas method ($)Adjusted Net National Income per capita ($)Urban population (% of total)Urban population growth (average annual %, 1990-2009) AgricultureAgricultural land (% land area)Agricultural productivity, value added per worker (2000 $)Food production index (1999-2001=100)Population density, rural (people/ sq. km of arable land) Forests and biodiversityForest area (% land area)Deforestation (average annual %, 1990-2010)Nationally terrestrial protected area (% of land area)Threatened species, mammalsThreatened species, birdsThreatened species, fishThreatened species, higher plantsGEF benefits index for biodiversity (0-100, median is 1.5) EnergyGDP per unit of energy use (2005 PPP $/kg oil equivalent)Energy use per capita (kg oil equivalent)Energy from biomass products and waste (% of total)Electric power consumption per capita (kWh)Electricity generated using fossil fuel (% of total)Electricity generated by hydropower (% of total) Emissions and pollutionCO2 emissions per unit of GDP (kg/2005 PPP $)CO2 emissions per capita (metric tons)CO2 emissions growth (%, 1990–2007)Particulate matter (urban-pop.-weighted avg., μg/cu. m)Road sector energy use per capita (kg oil equivalent) Water and sanitationInternal freshwater resources per capita (cu. m)Freshwater withdrawal
Total (% of internal resources)Agriculture (% of total freshwater withdrawal)
Access to improved water source (% of total population)Rural (% of rural population)Urban (% of urban population)
Access to improved sanitation (% of total population)Rural (% of rural population)Urban (% of urban population)
Environment and healthAcute resp. infection prevalence (% of children under five)Diarrhea prevalence (% of children under five)Under-five mortality rate (per 1,000 live births) National accounting aggregates—savings, depletion and degradationGross savings (% of GNI)Consumption of fixed capital (% of GNI)Education expenditure (% of GNI)Energy depletion (% of GNI)Mineral depletion (% of GNI)Net forest depletion (% of GNI)CO2 damage (% of GNI)Particulate emissions damage (% of GNI)Adjusted net savings (% of GNI)
Population (millions) 68 Land area (1,000 sq. km) 511 GDP ($ billions) 263.8
Thailand
GNI per capita, World Bank Atlas method ($)Adjusted Net National Income per capita ($)Urban population (% of total)Urban population growth (average annual %, 1990-2009) AgricultureAgricultural land (% land area)Agricultural productivity, value added per worker (2000 $)Food production index (1999-2001=100)Population density, rural (people/ sq. km of arable land) Forests and biodiversityForest area (% land area)Deforestation (average annual %, 1990-2010)Nationally terrestrial protected area (% of land area)Threatened species, mammalsThreatened species, birdsThreatened species, fishThreatened species, higher plantsGEF benefits index for biodiversity (0-100, median is 1.5) EnergyGDP per unit of energy use (2005 PPP $/kg oil equivalent)Energy use per capita (kg oil equivalent)Energy from biomass products and waste (% of total)Electric power consumption per capita (kWh)Electricity generated using fossil fuel (% of total)Electricity generated by hydropower (% of total) Emissions and pollutionCO2 emissions per unit of GDP (kg/2005 PPP $)CO2 emissions per capita (metric tons)CO2 emissions growth (%, 1990–2007)Particulate matter (urban-pop.-weighted avg., μg/cu. m)Road sector energy use per capita (kg oil equivalent) Water and sanitationInternal freshwater resources per capita (cu. m)Freshwater withdrawal
Total (% of internal resources)Agriculture (% of total freshwater withdrawal)
Access to improved water source (% of total population)Rural (% of rural population)Urban (% of urban population)
Access to improved sanitation (% of total population)Rural (% of rural population)Urban (% of urban population)
Environment and healthAcute resp. infection prevalence (% of children under five)Diarrhea prevalence (% of children under five)Under-five mortality rate (per 1,000 live births) National accounting aggregates—savings, depletion and degradationGross savings (% of GNI)Consumption of fixed capital (% of GNI)Education expenditure (% of GNI)Energy depletion (% of GNI)Mineral depletion (% of GNI)Net forest depletion (% of GNI)CO2 damage (% of GNI)Particulate emissions damage (% of GNI)Adjusted net savings (% of GNI)
208 2011 The Little Green Data Book
Population (millions) 1.1 Land area (1,000 sq. km) 14.9 GDP ($ millions) 558
GNI per capita, World Bank Atlas method ($)Adjusted Net National Income per capita ($)Urban population (% of total)Urban population growth (average annual %, 1990-2009) AgricultureAgricultural land (% land area)Agricultural productivity, value added per worker (2000 $)Food production index (1999-2001=100)Population density, rural (people/ sq. km of arable land) Forests and biodiversityForest area (% land area)Deforestation (average annual %, 1990-2010)Nationally terrestrial protected area (% of land area)Threatened species, mammalsThreatened species, birdsThreatened species, fishThreatened species, higher plantsGEF benefits index for biodiversity (0-100, median is 1.5) EnergyGDP per unit of energy use (2005 PPP $/kg oil equivalent)Energy use per capita (kg oil equivalent)Energy from biomass products and waste (% of total)Electric power consumption per capita (kWh)Electricity generated using fossil fuel (% of total)Electricity generated by hydropower (% of total) Emissions and pollutionCO2 emissions per unit of GDP (kg/2005 PPP $)CO2 emissions per capita (metric tons)CO2 emissions growth (%, 1990–2007)Particulate matter (urban-pop.-weighted avg., μg/cu. m)Road sector energy use per capita (kg oil equivalent) Water and sanitationInternal freshwater resources per capita (cu. m)Freshwater withdrawal
Total (% of internal resources)Agriculture (% of total freshwater withdrawal)
Access to improved water source (% of total population)Rural (% of rural population)Urban (% of urban population)
Access to improved sanitation (% of total population)Rural (% of rural population)Urban (% of urban population)
Environment and healthAcute resp. infection prevalence (% of children under five)Diarrhea prevalence (% of children under five)Under-five mortality rate (per 1,000 live births) National accounting aggregates—savings, depletion and degradationGross savings (% of GNI)Consumption of fixed capital (% of GNI)Education expenditure (% of GNI)Energy depletion (% of GNI)Mineral depletion (% of GNI)Net forest depletion (% of GNI)CO2 damage (% of GNI)Particulate emissions damage (% of GNI)Adjusted net savings (% of GNI)
Population (millions) 6.6 Land area (1,000 sq. km) 54.4 GDP ($ billions) 2.9
Togo
GNI per capita, World Bank Atlas method ($)Adjusted Net National Income per capita ($)Urban population (% of total)Urban population growth (average annual %, 1990-2009) AgricultureAgricultural land (% land area)Agricultural productivity, value added per worker (2000 $)Food production index (1999-2001=100)Population density, rural (people/ sq. km of arable land) Forests and biodiversityForest area (% land area)Deforestation (average annual %, 1990-2010)Nationally terrestrial protected area (% of land area)Threatened species, mammalsThreatened species, birdsThreatened species, fishThreatened species, higher plantsGEF benefits index for biodiversity (0-100, median is 1.5) EnergyGDP per unit of energy use (2005 PPP $/kg oil equivalent)Energy use per capita (kg oil equivalent)Energy from biomass products and waste (% of total)Electric power consumption per capita (kWh)Electricity generated using fossil fuel (% of total)Electricity generated by hydropower (% of total) Emissions and pollutionCO2 emissions per unit of GDP (kg/2005 PPP $)CO2 emissions per capita (metric tons)CO2 emissions growth (%, 1990–2007)Particulate matter (urban-pop.-weighted avg., μg/cu. m)Road sector energy use per capita (kg oil equivalent) Water and sanitationInternal freshwater resources per capita (cu. m)Freshwater withdrawal
Total (% of internal resources)Agriculture (% of total freshwater withdrawal)
Access to improved water source (% of total population)Rural (% of rural population)Urban (% of urban population)
Access to improved sanitation (% of total population)Rural (% of rural population)Urban (% of urban population)
Environment and healthAcute resp. infection prevalence (% of children under five)Diarrhea prevalence (% of children under five)Under-five mortality rate (per 1,000 live births) National accounting aggregates—savings, depletion and degradationGross savings (% of GNI)Consumption of fixed capital (% of GNI)Education expenditure (% of GNI)Energy depletion (% of GNI)Mineral depletion (% of GNI)Net forest depletion (% of GNI)CO2 damage (% of GNI)Particulate emissions damage (% of GNI)Adjusted net savings (% of GNI)
210 2011 The Little Green Data Book
Population (thousands) 104 Land area (1,000 sq. km) 0.7 GDP ($ millions) 311
GNI per capita, World Bank Atlas method ($)Adjusted Net National Income per capita ($)Urban population (% of total)Urban population growth (average annual %, 1990-2009) AgricultureAgricultural land (% land area)Agricultural productivity, value added per worker (2000 $)Food production index (1999-2001=100)Population density, rural (people/ sq. km of arable land) Forests and biodiversityForest area (% land area)Deforestation (average annual %, 1990-2010)Nationally terrestrial protected area (% of land area)Threatened species, mammalsThreatened species, birdsThreatened species, fishThreatened species, higher plantsGEF benefits index for biodiversity (0-100, median is 1.5) EnergyGDP per unit of energy use (2005 PPP $/kg oil equivalent)Energy use per capita (kg oil equivalent)Energy from biomass products and waste (% of total)Electric power consumption per capita (kWh)Electricity generated using fossil fuel (% of total)Electricity generated by hydropower (% of total) Emissions and pollutionCO2 emissions per unit of GDP (kg/2005 PPP $)CO2 emissions per capita (metric tons)CO2 emissions growth (%, 1990–2007)Particulate matter (urban-pop.-weighted avg., μg/cu. m)Road sector energy use per capita (kg oil equivalent) Water and sanitationInternal freshwater resources per capita (cu. m)Freshwater withdrawal
Total (% of internal resources)Agriculture (% of total freshwater withdrawal)
Access to improved water source (% of total population)Rural (% of rural population)Urban (% of urban population)
Access to improved sanitation (% of total population)Rural (% of rural population)Urban (% of urban population)
Environment and healthAcute resp. infection prevalence (% of children under five)Diarrhea prevalence (% of children under five)Under-five mortality rate (per 1,000 live births) National accounting aggregates—savings, depletion and degradationGross savings (% of GNI)Consumption of fixed capital (% of GNI)Education expenditure (% of GNI)Energy depletion (% of GNI)Mineral depletion (% of GNI)Net forest depletion (% of GNI)CO2 damage (% of GNI)Particulate emissions damage (% of GNI)Adjusted net savings (% of GNI)
211The Little Green Data Book 2011
16,700 37,9909,114 31,46713.6 77.3
3.0 1.0
11 371,553 25,774
125 1064,628 331
44.1 28.90.2 –0.1
31.2 13.422
191
2.2
1.7 6.614,557 5,131
0.1 3.95,789 9,51899.9 62.9
0.0 11.3
1.2 0.427.9 12.5
118.4 17.9105 24587 964
2,891 9,031
6.0 10.59 42
94 10093 9898 10092 9992 9892 100
3.0..
35 7
.. 16.112.9 14.1
4.0 4.628.2 0.9
0.0 0.10.0 0.01.4 0.20.2 0.1
.. 5.2
Country data
High-income group
Population (millions) 1.3 Land area (1,000 sq. km) 5.1 GDP ($ billions) 21.2
Trinidad and Tobago
GNI per capita, World Bank Atlas method ($)Adjusted Net National Income per capita ($)Urban population (% of total)Urban population growth (average annual %, 1990-2009) AgricultureAgricultural land (% land area)Agricultural productivity, value added per worker (2000 $)Food production index (1999-2001=100)Population density, rural (people/ sq. km of arable land) Forests and biodiversityForest area (% land area)Deforestation (average annual %, 1990-2010)Nationally terrestrial protected area (% of land area)Threatened species, mammalsThreatened species, birdsThreatened species, fishThreatened species, higher plantsGEF benefits index for biodiversity (0-100, median is 1.5) EnergyGDP per unit of energy use (2005 PPP $/kg oil equivalent)Energy use per capita (kg oil equivalent)Energy from biomass products and waste (% of total)Electric power consumption per capita (kWh)Electricity generated using fossil fuel (% of total)Electricity generated by hydropower (% of total) Emissions and pollutionCO2 emissions per unit of GDP (kg/2005 PPP $)CO2 emissions per capita (metric tons)CO2 emissions growth (%, 1990–2007)Particulate matter (urban-pop.-weighted avg., μg/cu. m)Road sector energy use per capita (kg oil equivalent) Water and sanitationInternal freshwater resources per capita (cu. m)Freshwater withdrawal
Total (% of internal resources)Agriculture (% of total freshwater withdrawal)
Access to improved water source (% of total population)Rural (% of rural population)Urban (% of urban population)
Access to improved sanitation (% of total population)Rural (% of rural population)Urban (% of urban population)
Environment and healthAcute resp. infection prevalence (% of children under five)Diarrhea prevalence (% of children under five)Under-five mortality rate (per 1,000 live births) National accounting aggregates—savings, depletion and degradationGross savings (% of GNI)Consumption of fixed capital (% of GNI)Education expenditure (% of GNI)Energy depletion (% of GNI)Mineral depletion (% of GNI)Net forest depletion (% of GNI)CO2 damage (% of GNI)Particulate emissions damage (% of GNI)Adjusted net savings (% of GNI)
212 2011 The Little Green Data Book
Population (millions) 10 Land area (1,000 sq. km) 155 GDP ($ billions) 39.6
GNI per capita, World Bank Atlas method ($)Adjusted Net National Income per capita ($)Urban population (% of total)Urban population growth (average annual %, 1990-2009) AgricultureAgricultural land (% land area)Agricultural productivity, value added per worker (2000 $)Food production index (1999-2001=100)Population density, rural (people/ sq. km of arable land) Forests and biodiversityForest area (% land area)Deforestation (average annual %, 1990-2010)Nationally terrestrial protected area (% of land area)Threatened species, mammalsThreatened species, birdsThreatened species, fishThreatened species, higher plantsGEF benefits index for biodiversity (0-100, median is 1.5) EnergyGDP per unit of energy use (2005 PPP $/kg oil equivalent)Energy use per capita (kg oil equivalent)Energy from biomass products and waste (% of total)Electric power consumption per capita (kWh)Electricity generated using fossil fuel (% of total)Electricity generated by hydropower (% of total) Emissions and pollutionCO2 emissions per unit of GDP (kg/2005 PPP $)CO2 emissions per capita (metric tons)CO2 emissions growth (%, 1990–2007)Particulate matter (urban-pop.-weighted avg., μg/cu. m)Road sector energy use per capita (kg oil equivalent) Water and sanitationInternal freshwater resources per capita (cu. m)Freshwater withdrawal
Total (% of internal resources)Agriculture (% of total freshwater withdrawal)
Access to improved water source (% of total population)Rural (% of rural population)Urban (% of urban population)
Access to improved sanitation (% of total population)Rural (% of rural population)Urban (% of urban population)
Environment and healthAcute resp. infection prevalence (% of children under five)Diarrhea prevalence (% of children under five)Under-five mortality rate (per 1,000 live births) National accounting aggregates—savings, depletion and degradationGross savings (% of GNI)Consumption of fixed capital (% of GNI)Education expenditure (% of GNI)Energy depletion (% of GNI)Mineral depletion (% of GNI)Net forest depletion (% of GNI)CO2 damage (% of GNI)Particulate emissions damage (% of GNI)Adjusted net savings (% of GNI)
Population (millions) 75 Land area (1,000 sq. km) 770 GDP ($ billions) 614.6
Turkey
GNI per capita, World Bank Atlas method ($)Adjusted Net National Income per capita ($)Urban population (% of total)Urban population growth (average annual %, 1990-2009) AgricultureAgricultural land (% land area)Agricultural productivity, value added per worker (2000 $)Food production index (1999-2001=100)Population density, rural (people/ sq. km of arable land) Forests and biodiversityForest area (% land area)Deforestation (average annual %, 1990-2010)Nationally terrestrial protected area (% of land area)Threatened species, mammalsThreatened species, birdsThreatened species, fishThreatened species, higher plantsGEF benefits index for biodiversity (0-100, median is 1.5) EnergyGDP per unit of energy use (2005 PPP $/kg oil equivalent)Energy use per capita (kg oil equivalent)Energy from biomass products and waste (% of total)Electric power consumption per capita (kWh)Electricity generated using fossil fuel (% of total)Electricity generated by hydropower (% of total) Emissions and pollutionCO2 emissions per unit of GDP (kg/2005 PPP $)CO2 emissions per capita (metric tons)CO2 emissions growth (%, 1990–2007)Particulate matter (urban-pop.-weighted avg., μg/cu. m)Road sector energy use per capita (kg oil equivalent) Water and sanitationInternal freshwater resources per capita (cu. m)Freshwater withdrawal
Total (% of internal resources)Agriculture (% of total freshwater withdrawal)
Access to improved water source (% of total population)Rural (% of rural population)Urban (% of urban population)
Access to improved sanitation (% of total population)Rural (% of rural population)Urban (% of urban population)
Environment and healthAcute resp. infection prevalence (% of children under five)Diarrhea prevalence (% of children under five)Under-five mortality rate (per 1,000 live births) National accounting aggregates—savings, depletion and degradationGross savings (% of GNI)Consumption of fixed capital (% of GNI)Education expenditure (% of GNI)Energy depletion (% of GNI)Mineral depletion (% of GNI)Net forest depletion (% of GNI)CO2 damage (% of GNI)Particulate emissions damage (% of GNI)Adjusted net savings (% of GNI)
214 2011 The Little Green Data Book
Population (millions) 5.1 Land area (1,000 sq. km) 469.9 GDP ($ billions) 19.9
GNI per capita, World Bank Atlas method ($)Adjusted Net National Income per capita ($)Urban population (% of total)Urban population growth (average annual %, 1990-2009) AgricultureAgricultural land (% land area)Agricultural productivity, value added per worker (2000 $)Food production index (1999-2001=100)Population density, rural (people/ sq. km of arable land) Forests and biodiversityForest area (% land area)Deforestation (average annual %, 1990-2010)Nationally terrestrial protected area (% of land area)Threatened species, mammalsThreatened species, birdsThreatened species, fishThreatened species, higher plantsGEF benefits index for biodiversity (0-100, median is 1.5) EnergyGDP per unit of energy use (2005 PPP $/kg oil equivalent)Energy use per capita (kg oil equivalent)Energy from biomass products and waste (% of total)Electric power consumption per capita (kWh)Electricity generated using fossil fuel (% of total)Electricity generated by hydropower (% of total) Emissions and pollutionCO2 emissions per unit of GDP (kg/2005 PPP $)CO2 emissions per capita (metric tons)CO2 emissions growth (%, 1990–2007)Particulate matter (urban-pop.-weighted avg., μg/cu. m)Road sector energy use per capita (kg oil equivalent) Water and sanitationInternal freshwater resources per capita (cu. m)Freshwater withdrawal
Total (% of internal resources)Agriculture (% of total freshwater withdrawal)
Access to improved water source (% of total population)Rural (% of rural population)Urban (% of urban population)
Access to improved sanitation (% of total population)Rural (% of rural population)Urban (% of urban population)
Environment and healthAcute resp. infection prevalence (% of children under five)Diarrhea prevalence (% of children under five)Under-five mortality rate (per 1,000 live births) National accounting aggregates—savings, depletion and degradationGross savings (% of GNI)Consumption of fixed capital (% of GNI)Education expenditure (% of GNI)Energy depletion (% of GNI)Mineral depletion (% of GNI)Net forest depletion (% of GNI)CO2 damage (% of GNI)Particulate emissions damage (% of GNI)Adjusted net savings (% of GNI)
215The Little Green Data Book 2011
Population (thousands) 33 Land area (1,000 sq. km) 1.0 GDP ($ millions) ..
Country data
High-income group
.. 37,990
.. 31,46793.3 77.3
6.7 1.0
1 37.. 25,774.. 106
271 331
35.8 28.90.0 –0.1
42.9 13.422
142..
.. 6.6
.. 5,131
.. 3.9
.. 9,518
.. 62.9
.. 11.3
.. 0.44.9 12.5
22.2 17.9.. 24.. 964
.. 9,031
.. 10.5
.. 42100 100100 98100 100
96 9994 9898 100
..
..
.. 7
.. 16.1
.. 14.1
.. 4.6
.. 0.9
.. 0.1
.. 0.0
.. 0.2
.. 0.1
.. 5.2
Turks and Caicos Islands
GNI per capita, World Bank Atlas method ($)Adjusted Net National Income per capita ($)Urban population (% of total)Urban population growth (average annual %, 1990-2009) AgricultureAgricultural land (% land area)Agricultural productivity, value added per worker (2000 $)Food production index (1999-2001=100)Population density, rural (people/ sq. km of arable land) Forests and biodiversityForest area (% land area)Deforestation (average annual %, 1990-2010)Nationally terrestrial protected area (% of land area)Threatened species, mammalsThreatened species, birdsThreatened species, fishThreatened species, higher plantsGEF benefits index for biodiversity (0-100, median is 1.5) EnergyGDP per unit of energy use (2005 PPP $/kg oil equivalent)Energy use per capita (kg oil equivalent)Energy from biomass products and waste (% of total)Electric power consumption per capita (kWh)Electricity generated using fossil fuel (% of total)Electricity generated by hydropower (% of total) Emissions and pollutionCO2 emissions per unit of GDP (kg/2005 PPP $)CO2 emissions per capita (metric tons)CO2 emissions growth (%, 1990–2007)Particulate matter (urban-pop.-weighted avg., μg/cu. m)Road sector energy use per capita (kg oil equivalent) Water and sanitationInternal freshwater resources per capita (cu. m)Freshwater withdrawal
Total (% of internal resources)Agriculture (% of total freshwater withdrawal)
Access to improved water source (% of total population)Rural (% of rural population)Urban (% of urban population)
Access to improved sanitation (% of total population)Rural (% of rural population)Urban (% of urban population)
Environment and healthAcute resp. infection prevalence (% of children under five)Diarrhea prevalence (% of children under five)Under-five mortality rate (per 1,000 live births) National accounting aggregates—savings, depletion and degradationGross savings (% of GNI)Consumption of fixed capital (% of GNI)Education expenditure (% of GNI)Energy depletion (% of GNI)Mineral depletion (% of GNI)Net forest depletion (% of GNI)CO2 damage (% of GNI)Particulate emissions damage (% of GNI)Adjusted net savings (% of GNI)
216 2011 The Little Green Data Book
Population (thousands) 10 Land area (sq. km) 30 GDP ($ millions) ..
GNI per capita, World Bank Atlas method ($)Adjusted Net National Income per capita ($)Urban population (% of total)Urban population growth (average annual %, 1990-2009) AgricultureAgricultural land (% land area)Agricultural productivity, value added per worker (2000 $)Food production index (1999-2001=100)Population density, rural (people/ sq. km of arable land) Forests and biodiversityForest area (% land area)Deforestation (average annual %, 1990-2010)Nationally terrestrial protected area (% of land area)Threatened species, mammalsThreatened species, birdsThreatened species, fishThreatened species, higher plantsGEF benefits index for biodiversity (0-100, median is 1.5) EnergyGDP per unit of energy use (2005 PPP $/kg oil equivalent)Energy use per capita (kg oil equivalent)Energy from biomass products and waste (% of total)Electric power consumption per capita (kWh)Electricity generated using fossil fuel (% of total)Electricity generated by hydropower (% of total) Emissions and pollutionCO2 emissions per unit of GDP (kg/2005 PPP $)CO2 emissions per capita (metric tons)CO2 emissions growth (%, 1990–2007)Particulate matter (urban-pop.-weighted avg., μg/cu. m)Road sector energy use per capita (kg oil equivalent) Water and sanitationInternal freshwater resources per capita (cu. m)Freshwater withdrawal
Total (% of internal resources)Agriculture (% of total freshwater withdrawal)
Access to improved water source (% of total population)Rural (% of rural population)Urban (% of urban population)
Access to improved sanitation (% of total population)Rural (% of rural population)Urban (% of urban population)
Environment and healthAcute resp. infection prevalence (% of children under five)Diarrhea prevalence (% of children under five)Under-five mortality rate (per 1,000 live births) National accounting aggregates—savings, depletion and degradationGross savings (% of GNI)Consumption of fixed capital (% of GNI)Education expenditure (% of GNI)Energy depletion (% of GNI)Mineral depletion (% of GNI)Net forest depletion (% of GNI)CO2 damage (% of GNI)Particulate emissions damage (% of GNI)Adjusted net savings (% of GNI)
Population (millions) 33 Land area (1,000 sq. km) 197 GDP ($ billions) 16.0
Uganda
GNI per capita, World Bank Atlas method ($)Adjusted Net National Income per capita ($)Urban population (% of total)Urban population growth (average annual %, 1990-2009) AgricultureAgricultural land (% land area)Agricultural productivity, value added per worker (2000 $)Food production index (1999-2001=100)Population density, rural (people/ sq. km of arable land) Forests and biodiversityForest area (% land area)Deforestation (average annual %, 1990-2010)Nationally terrestrial protected area (% of land area)Threatened species, mammalsThreatened species, birdsThreatened species, fishThreatened species, higher plantsGEF benefits index for biodiversity (0-100, median is 1.5) EnergyGDP per unit of energy use (2005 PPP $/kg oil equivalent)Energy use per capita (kg oil equivalent)Energy from biomass products and waste (% of total)Electric power consumption per capita (kWh)Electricity generated using fossil fuel (% of total)Electricity generated by hydropower (% of total) Emissions and pollutionCO2 emissions per unit of GDP (kg/2005 PPP $)CO2 emissions per capita (metric tons)CO2 emissions growth (%, 1990–2007)Particulate matter (urban-pop.-weighted avg., μg/cu. m)Road sector energy use per capita (kg oil equivalent) Water and sanitationInternal freshwater resources per capita (cu. m)Freshwater withdrawal
Total (% of internal resources)Agriculture (% of total freshwater withdrawal)
Access to improved water source (% of total population)Rural (% of rural population)Urban (% of urban population)
Access to improved sanitation (% of total population)Rural (% of rural population)Urban (% of urban population)
Environment and healthAcute resp. infection prevalence (% of children under five)Diarrhea prevalence (% of children under five)Under-five mortality rate (per 1,000 live births) National accounting aggregates—savings, depletion and degradationGross savings (% of GNI)Consumption of fixed capital (% of GNI)Education expenditure (% of GNI)Energy depletion (% of GNI)Mineral depletion (% of GNI)Net forest depletion (% of GNI)CO2 damage (% of GNI)Particulate emissions damage (% of GNI)Adjusted net savings (% of GNI)
218 2011 The Little Green Data Book
Population (millions) 46 Land area (1,000 sq. km) 579 GDP ($ billions) 113.5
GNI per capita, World Bank Atlas method ($)Adjusted Net National Income per capita ($)Urban population (% of total)Urban population growth (average annual %, 1990-2009) AgricultureAgricultural land (% land area)Agricultural productivity, value added per worker (2000 $)Food production index (1999-2001=100)Population density, rural (people/ sq. km of arable land) Forests and biodiversityForest area (% land area)Deforestation (average annual %, 1990-2010)Nationally terrestrial protected area (% of land area)Threatened species, mammalsThreatened species, birdsThreatened species, fishThreatened species, higher plantsGEF benefits index for biodiversity (0-100, median is 1.5) EnergyGDP per unit of energy use (2005 PPP $/kg oil equivalent)Energy use per capita (kg oil equivalent)Energy from biomass products and waste (% of total)Electric power consumption per capita (kWh)Electricity generated using fossil fuel (% of total)Electricity generated by hydropower (% of total) Emissions and pollutionCO2 emissions per unit of GDP (kg/2005 PPP $)CO2 emissions per capita (metric tons)CO2 emissions growth (%, 1990–2007)Particulate matter (urban-pop.-weighted avg., μg/cu. m)Road sector energy use per capita (kg oil equivalent) Water and sanitationInternal freshwater resources per capita (cu. m)Freshwater withdrawal
Total (% of internal resources)Agriculture (% of total freshwater withdrawal)
Access to improved water source (% of total population)Rural (% of rural population)Urban (% of urban population)
Access to improved sanitation (% of total population)Rural (% of rural population)Urban (% of urban population)
Environment and healthAcute resp. infection prevalence (% of children under five)Diarrhea prevalence (% of children under five)Under-five mortality rate (per 1,000 live births) National accounting aggregates—savings, depletion and degradationGross savings (% of GNI)Consumption of fixed capital (% of GNI)Education expenditure (% of GNI)Energy depletion (% of GNI)Mineral depletion (% of GNI)Net forest depletion (% of GNI)CO2 damage (% of GNI)Particulate emissions damage (% of GNI)Adjusted net savings (% of GNI)
219The Little Green Data Book 2011
.. 37,990
.. 31,46777.9 77.34.7 1.0
7 3730,334 25,066
45 1061,526 331
3.8 28.9-0.9 -0.15.6 13.4
71013
00.2
4.2 6.613,030 5,131
0.0 3.916,891 9,518
100.0 62.90.0 11.3
0.6 0.431.0 12.5
147.3 17.989 24
1,884 964
34 9,031
2,032.0 10.583 42
100 100100 98100 100
97 9995 9898 100
6.28.8
7 7
.. 16.1
.. 14.1
.. 4.6
.. 0.9
.. 0.1
.. 0.0
.. 0.2
.. 0.1
.. 5.2
Country data
High-income group
Population (millions) 4.6 Land area (1,000 sq. km) 83.6 GDP ($ billions) 230.3
United Arab Emirates
GNI per capita, World Bank Atlas method ($)Adjusted Net National Income per capita ($)Urban population (% of total)Urban population growth (average annual %, 1990-2009) AgricultureAgricultural land (% land area)Agricultural productivity, value added per worker (2000 $)Food production index (1999-2001=100)Population density, rural (people/ sq. km of arable land) Forests and biodiversityForest area (% land area)Deforestation (average annual %, 1990-2010)Nationally terrestrial protected area (% of land area)Threatened species, mammalsThreatened species, birdsThreatened species, fishThreatened species, higher plantsGEF benefits index for biodiversity (0-100, median is 1.5) EnergyGDP per unit of energy use (2005 PPP $/kg oil equivalent)Energy use per capita (kg oil equivalent)Energy from biomass products and waste (% of total)Electric power consumption per capita (kWh)Electricity generated using fossil fuel (% of total)Electricity generated by hydropower (% of total) Emissions and pollutionCO2 emissions per unit of GDP (kg/2005 PPP $)CO2 emissions per capita (metric tons)CO2 emissions growth (%, 1990–2007)Particulate matter (urban-pop.-weighted avg., μg/cu. m)Road sector energy use per capita (kg oil equivalent) Water and sanitationInternal freshwater resources per capita (cu. m)Freshwater withdrawal
Total (% of internal resources)Agriculture (% of total freshwater withdrawal)
Access to improved water source (% of total population)Rural (% of rural population)Urban (% of urban population)
Access to improved sanitation (% of total population)Rural (% of rural population)Urban (% of urban population)
Environment and healthAcute resp. infection prevalence (% of children under five)Diarrhea prevalence (% of children under five)Under-five mortality rate (per 1,000 live births) National accounting aggregates—savings, depletion and degradationGross savings (% of GNI)Consumption of fixed capital (% of GNI)Education expenditure (% of GNI)Energy depletion (% of GNI)Mineral depletion (% of GNI)Net forest depletion (% of GNI)CO2 damage (% of GNI)Particulate emissions damage (% of GNI)Adjusted net savings (% of GNI)
220 2011 The Little Green Data Book
Population (millions) 62 Land area (1,000 sq. km) 242 GDP ($ billions) 2,174.5
Country data
High-income group
41,370 37,99030,590 31,467
90.0 77.30.5 1.0
73 3727,403 25,774
98 106103 331
11.9 28.9–0.3 –0.124.4 13.4
52
4114
3.5
10.0 6.63,395 5,131
2.2 3.96,061 9,51880.3 62.9
1.3 11.3
0.3 0.48.8 12.5
–5.4 17.913 24
641 964
2,378 9,031
10.0 10.52 42
100 100100 98100 100100 99100 98100 100
..
..6 7
12.0 16.113.5 14.1
5.1 4.61.2 0.90.0 0.10.0 0.00.2 0.20.0 0.12.2 5.2
United Kingdom
GNI per capita, World Bank Atlas method ($)Adjusted Net National Income per capita ($)Urban population (% of total)Urban population growth (average annual %, 1990-2009) AgricultureAgricultural land (% land area)Agricultural productivity, value added per worker (2000 $)Food production index (1999-2001=100)Population density, rural (people/ sq. km of arable land) Forests and biodiversityForest area (% land area)Deforestation (average annual %, 1990-2010)Nationally terrestrial protected area (% of land area)Threatened species, mammalsThreatened species, birdsThreatened species, fishThreatened species, higher plantsGEF benefits index for biodiversity (0-100, median is 1.5) EnergyGDP per unit of energy use (2005 PPP $/kg oil equivalent)Energy use per capita (kg oil equivalent)Energy from biomass products and waste (% of total)Electric power consumption per capita (kWh)Electricity generated using fossil fuel (% of total)Electricity generated by hydropower (% of total) Emissions and pollutionCO2 emissions per unit of GDP (kg/2005 PPP $)CO2 emissions per capita (metric tons)CO2 emissions growth (%, 1990–2007)Particulate matter (urban-pop.-weighted avg., μg/cu. m)Road sector energy use per capita (kg oil equivalent) Water and sanitationInternal freshwater resources per capita (cu. m)Freshwater withdrawal
Total (% of internal resources)Agriculture (% of total freshwater withdrawal)
Access to improved water source (% of total population)Rural (% of rural population)Urban (% of urban population)
Access to improved sanitation (% of total population)Rural (% of rural population)Urban (% of urban population)
Environment and healthAcute resp. infection prevalence (% of children under five)Diarrhea prevalence (% of children under five)Under-five mortality rate (per 1,000 live births) National accounting aggregates—savings, depletion and degradationGross savings (% of GNI)Consumption of fixed capital (% of GNI)Education expenditure (% of GNI)Energy depletion (% of GNI)Mineral depletion (% of GNI)Net forest depletion (% of GNI)CO2 damage (% of GNI)Particulate emissions damage (% of GNI)Adjusted net savings (% of GNI)
Population (millions) 307 Land area (1,000 sq. km) 9,147 GDP ($ billions) 14,119.0
United States
GNI per capita, World Bank Atlas method ($)Adjusted Net National Income per capita ($)Urban population (% of total)Urban population growth (average annual %, 1990-2009) AgricultureAgricultural land (% land area)Agricultural productivity, value added per worker (2000 $)Food production index (1999-2001=100)Population density, rural (people/ sq. km of arable land) Forests and biodiversityForest area (% land area)Deforestation (average annual %, 1990-2010)Nationally terrestrial protected area (% of land area)Threatened species, mammalsThreatened species, birdsThreatened species, fishThreatened species, higher plantsGEF benefits index for biodiversity (0-100, median is 1.5) EnergyGDP per unit of energy use (2005 PPP $/kg oil equivalent)Energy use per capita (kg oil equivalent)Energy from biomass products and waste (% of total)Electric power consumption per capita (kWh)Electricity generated using fossil fuel (% of total)Electricity generated by hydropower (% of total) Emissions and pollutionCO2 emissions per unit of GDP (kg/2005 PPP $)CO2 emissions per capita (metric tons)CO2 emissions growth (%, 1990–2007)Particulate matter (urban-pop.-weighted avg., μg/cu. m)Road sector energy use per capita (kg oil equivalent) Water and sanitationInternal freshwater resources per capita (cu. m)Freshwater withdrawal
Total (% of internal resources)Agriculture (% of total freshwater withdrawal)
Access to improved water source (% of total population)Rural (% of rural population)Urban (% of urban population)
Access to improved sanitation (% of total population)Rural (% of rural population)Urban (% of urban population)
Environment and healthAcute resp. infection prevalence (% of children under five)Diarrhea prevalence (% of children under five)Under-five mortality rate (per 1,000 live births) National accounting aggregates—savings, depletion and degradationGross savings (% of GNI)Consumption of fixed capital (% of GNI)Education expenditure (% of GNI)Energy depletion (% of GNI)Mineral depletion (% of GNI)Net forest depletion (% of GNI)CO2 damage (% of GNI)Particulate emissions damage (% of GNI)Adjusted net savings (% of GNI)
222 2011 The Little Green Data Book
Population (millions) 3.3 Land area (1,000 sq. km) 175.0 GDP ($ billions) 31.5
GNI per capita, World Bank Atlas method ($)Adjusted Net National Income per capita ($)Urban population (% of total)Urban population growth (average annual %, 1990-2009) AgricultureAgricultural land (% land area)Agricultural productivity, value added per worker (2000 $)Food production index (1999-2001=100)Population density, rural (people/ sq. km of arable land) Forests and biodiversityForest area (% land area)Deforestation (average annual %, 1990-2010)Nationally terrestrial protected area (% of land area)Threatened species, mammalsThreatened species, birdsThreatened species, fishThreatened species, higher plantsGEF benefits index for biodiversity (0-100, median is 1.5) EnergyGDP per unit of energy use (2005 PPP $/kg oil equivalent)Energy use per capita (kg oil equivalent)Energy from biomass products and waste (% of total)Electric power consumption per capita (kWh)Electricity generated using fossil fuel (% of total)Electricity generated by hydropower (% of total) Emissions and pollutionCO2 emissions per unit of GDP (kg/2005 PPP $)CO2 emissions per capita (metric tons)CO2 emissions growth (%, 1990–2007)Particulate matter (urban-pop.-weighted avg., μg/cu. m)Road sector energy use per capita (kg oil equivalent) Water and sanitationInternal freshwater resources per capita (cu. m)Freshwater withdrawal
Total (% of internal resources)Agriculture (% of total freshwater withdrawal)
Access to improved water source (% of total population)Rural (% of rural population)Urban (% of urban population)
Access to improved sanitation (% of total population)Rural (% of rural population)Urban (% of urban population)
Environment and healthAcute resp. infection prevalence (% of children under five)Diarrhea prevalence (% of children under five)Under-five mortality rate (per 1,000 live births) National accounting aggregates—savings, depletion and degradationGross savings (% of GNI)Consumption of fixed capital (% of GNI)Education expenditure (% of GNI)Energy depletion (% of GNI)Mineral depletion (% of GNI)Net forest depletion (% of GNI)CO2 damage (% of GNI)Particulate emissions damage (% of GNI)Adjusted net savings (% of GNI)
Population (millions) 28 Land area (1,000 sq. km) 425 GDP ($ billions) 32.1
Uzbekistan
GNI per capita, World Bank Atlas method ($)Adjusted Net National Income per capita ($)Urban population (% of total)Urban population growth (average annual %, 1990-2009) AgricultureAgricultural land (% land area)Agricultural productivity, value added per worker (2000 $)Food production index (1999-2001=100)Population density, rural (people/ sq. km of arable land) Forests and biodiversityForest area (% land area)Deforestation (average annual %, 1990-2010)Nationally terrestrial protected area (% of land area)Threatened species, mammalsThreatened species, birdsThreatened species, fishThreatened species, higher plantsGEF benefits index for biodiversity (0-100, median is 1.5) EnergyGDP per unit of energy use (2005 PPP $/kg oil equivalent)Energy use per capita (kg oil equivalent)Energy from biomass products and waste (% of total)Electric power consumption per capita (kWh)Electricity generated using fossil fuel (% of total)Electricity generated by hydropower (% of total) Emissions and pollutionCO2 emissions per unit of GDP (kg/2005 PPP $)CO2 emissions per capita (metric tons)CO2 emissions growth (%, 1990–2007)Particulate matter (urban-pop.-weighted avg., μg/cu. m)Road sector energy use per capita (kg oil equivalent) Water and sanitationInternal freshwater resources per capita (cu. m)Freshwater withdrawal
Total (% of internal resources)Agriculture (% of total freshwater withdrawal)
Access to improved water source (% of total population)Rural (% of rural population)Urban (% of urban population)
Access to improved sanitation (% of total population)Rural (% of rural population)Urban (% of urban population)
Environment and healthAcute resp. infection prevalence (% of children under five)Diarrhea prevalence (% of children under five)Under-five mortality rate (per 1,000 live births) National accounting aggregates—savings, depletion and degradationGross savings (% of GNI)Consumption of fixed capital (% of GNI)Education expenditure (% of GNI)Energy depletion (% of GNI)Mineral depletion (% of GNI)Net forest depletion (% of GNI)CO2 damage (% of GNI)Particulate emissions damage (% of GNI)Adjusted net savings (% of GNI)
224 2011 The Little Green Data Book
Population (thousands) 240 Land area (1,000 sq. km) 12 GDP ($ millions) 648
GNI per capita, World Bank Atlas method ($)Adjusted Net National Income per capita ($)Urban population (% of total)Urban population growth (average annual %, 1990-2009) AgricultureAgricultural land (% land area)Agricultural productivity, value added per worker (2000 $)Food production index (1999-2001=100)Population density, rural (people/ sq. km of arable land) Forests and biodiversityForest area (% land area)Deforestation (average annual %, 1990-2010)Nationally terrestrial protected area (% of land area)Threatened species, mammalsThreatened species, birdsThreatened species, fishThreatened species, higher plantsGEF benefits index for biodiversity (0-100, median is 1.5) EnergyGDP per unit of energy use (2005 PPP $/kg oil equivalent)Energy use per capita (kg oil equivalent)Energy from biomass products and waste (% of total)Electric power consumption per capita (kWh)Electricity generated using fossil fuel (% of total)Electricity generated by hydropower (% of total) Emissions and pollutionCO2 emissions per unit of GDP (kg/2005 PPP $)CO2 emissions per capita (metric tons)CO2 emissions growth (%, 1990–2007)Particulate matter (urban-pop.-weighted avg., μg/cu. m)Road sector energy use per capita (kg oil equivalent) Water and sanitationInternal freshwater resources per capita (cu. m)Freshwater withdrawal
Total (% of internal resources)Agriculture (% of total freshwater withdrawal)
Access to improved water source (% of total population)Rural (% of rural population)Urban (% of urban population)
Access to improved sanitation (% of total population)Rural (% of rural population)Urban (% of urban population)
Environment and healthAcute resp. infection prevalence (% of children under five)Diarrhea prevalence (% of children under five)Under-five mortality rate (per 1,000 live births) National accounting aggregates—savings, depletion and degradationGross savings (% of GNI)Consumption of fixed capital (% of GNI)Education expenditure (% of GNI)Energy depletion (% of GNI)Mineral depletion (% of GNI)Net forest depletion (% of GNI)CO2 damage (% of GNI)Particulate emissions damage (% of GNI)Adjusted net savings (% of GNI)
Population (millions) 28 Land area (1,000 sq. km) 882 GDP ($ billions) 326.1
Venezuela, RB
GNI per capita, World Bank Atlas method ($)Adjusted Net National Income per capita ($)Urban population (% of total)Urban population growth (average annual %, 1990-2009) AgricultureAgricultural land (% land area)Agricultural productivity, value added per worker (2000 $)Food production index (1999-2001=100)Population density, rural (people/ sq. km of arable land) Forests and biodiversityForest area (% land area)Deforestation (average annual %, 1990-2010)Nationally terrestrial protected area (% of land area)Threatened species, mammalsThreatened species, birdsThreatened species, fishThreatened species, higher plantsGEF benefits index for biodiversity (0-100, median is 1.5) EnergyGDP per unit of energy use (2005 PPP $/kg oil equivalent)Energy use per capita (kg oil equivalent)Energy from biomass products and waste (% of total)Electric power consumption per capita (kWh)Electricity generated using fossil fuel (% of total)Electricity generated by hydropower (% of total) Emissions and pollutionCO2 emissions per unit of GDP (kg/2005 PPP $)CO2 emissions per capita (metric tons)CO2 emissions growth (%, 1990–2007)Particulate matter (urban-pop.-weighted avg., μg/cu. m)Road sector energy use per capita (kg oil equivalent) Water and sanitationInternal freshwater resources per capita (cu. m)Freshwater withdrawal
Total (% of internal resources)Agriculture (% of total freshwater withdrawal)
Access to improved water source (% of total population)Rural (% of rural population)Urban (% of urban population)
Access to improved sanitation (% of total population)Rural (% of rural population)Urban (% of urban population)
Environment and healthAcute resp. infection prevalence (% of children under five)Diarrhea prevalence (% of children under five)Under-five mortality rate (per 1,000 live births) National accounting aggregates—savings, depletion and degradationGross savings (% of GNI)Consumption of fixed capital (% of GNI)Education expenditure (% of GNI)Energy depletion (% of GNI)Mineral depletion (% of GNI)Net forest depletion (% of GNI)CO2 damage (% of GNI)Particulate emissions damage (% of GNI)Adjusted net savings (% of GNI)
226 2011 The Little Green Data Book
Population (millions) 87 Land area (1,000 sq. km) 310 GDP ($ billions) 97.2
GNI per capita, World Bank Atlas method ($)Adjusted Net National Income per capita ($)Urban population (% of total)Urban population growth (average annual %, 1990-2009) AgricultureAgricultural land (% land area)Agricultural productivity, value added per worker (2000 $)Food production index (1999-2001=100)Population density, rural (people/ sq. km of arable land) Forests and biodiversityForest area (% land area)Deforestation (average annual %, 1990-2010)Nationally terrestrial protected area (% of land area)Threatened species, mammalsThreatened species, birdsThreatened species, fishThreatened species, higher plantsGEF benefits index for biodiversity (0-100, median is 1.5) EnergyGDP per unit of energy use (2005 PPP $/kg oil equivalent)Energy use per capita (kg oil equivalent)Energy from biomass products and waste (% of total)Electric power consumption per capita (kWh)Electricity generated using fossil fuel (% of total)Electricity generated by hydropower (% of total) Emissions and pollutionCO2 emissions per unit of GDP (kg/2005 PPP $)CO2 emissions per capita (metric tons)CO2 emissions growth (%, 1990–2007)Particulate matter (urban-pop.-weighted avg., μg/cu. m)Road sector energy use per capita (kg oil equivalent) Water and sanitationInternal freshwater resources per capita (cu. m)Freshwater withdrawal
Total (% of internal resources)Agriculture (% of total freshwater withdrawal)
Access to improved water source (% of total population)Rural (% of rural population)Urban (% of urban population)
Access to improved sanitation (% of total population)Rural (% of rural population)Urban (% of urban population)
Environment and healthAcute resp. infection prevalence (% of children under five)Diarrhea prevalence (% of children under five)Under-five mortality rate (per 1,000 live births) National accounting aggregates—savings, depletion and degradationGross savings (% of GNI)Consumption of fixed capital (% of GNI)Education expenditure (% of GNI)Energy depletion (% of GNI)Mineral depletion (% of GNI)Net forest depletion (% of GNI)CO2 damage (% of GNI)Particulate emissions damage (% of GNI)Adjusted net savings (% of GNI)
227The Little Green Data Book 2011
.. 37,990
.. 31,46795.1 77.3
0.7 1.0
11 37.. 25,774
101 106565 331
57.1 28.90.6 –0.1
15.2 13.421
1212
0.2
.. 6.6
.. 5,131
.. 3.9
.. 9,518
.. 62.9
.. 11.3
.. 0.4
.. 12.5
.. 17.931 24
.. 964
.. 9,031
.. 10.55 42.. 100.. 98.. 100.. 99.. 98.. 100
..
..
.. 7
.. 16.1
.. 14.1
.. 4.6
.. 0.9
.. 0.1
.. 0.0
.. 0.2
.. 0.1
.. 5.2
Country data
High-income group
Population (thousands) 110 Land area (1,000 sq. km) 0.4 GDP ($ millions) ..
Virgin Islands (U.S.)
GNI per capita, World Bank Atlas method ($)Adjusted Net National Income per capita ($)Urban population (% of total)Urban population growth (average annual %, 1990-2009) AgricultureAgricultural land (% land area)Agricultural productivity, value added per worker (2000 $)Food production index (1999-2001=100)Population density, rural (people/ sq. km of arable land) Forests and biodiversityForest area (% land area)Deforestation (average annual %, 1990-2010)Nationally terrestrial protected area (% of land area)Threatened species, mammalsThreatened species, birdsThreatened species, fishThreatened species, higher plantsGEF benefits index for biodiversity (0-100, median is 1.5) EnergyGDP per unit of energy use (2005 PPP $/kg oil equivalent)Energy use per capita (kg oil equivalent)Energy from biomass products and waste (% of total)Electric power consumption per capita (kWh)Electricity generated using fossil fuel (% of total)Electricity generated by hydropower (% of total) Emissions and pollutionCO2 emissions per unit of GDP (kg/2005 PPP $)CO2 emissions per capita (metric tons)CO2 emissions growth (%, 1990–2007)Particulate matter (urban-pop.-weighted avg., μg/cu. m)Road sector energy use per capita (kg oil equivalent) Water and sanitationInternal freshwater resources per capita (cu. m)Freshwater withdrawal
Total (% of internal resources)Agriculture (% of total freshwater withdrawal)
Access to improved water source (% of total population)Rural (% of rural population)Urban (% of urban population)
Access to improved sanitation (% of total population)Rural (% of rural population)Urban (% of urban population)
Environment and healthAcute resp. infection prevalence (% of children under five)Diarrhea prevalence (% of children under five)Under-five mortality rate (per 1,000 live births) National accounting aggregates—savings, depletion and degradationGross savings (% of GNI)Consumption of fixed capital (% of GNI)Education expenditure (% of GNI)Energy depletion (% of GNI)Mineral depletion (% of GNI)Net forest depletion (% of GNI)CO2 damage (% of GNI)Particulate emissions damage (% of GNI)Adjusted net savings (% of GNI)
228 2011 The Little Green Data Book
Population (millions) 4.0 Land area (1,000 sq. km) 6.0 GDP ($ billions) ..
GNI per capita, World Bank Atlas method ($)Adjusted Net National Income per capita ($)Urban population (% of total)Urban population growth (average annual %, 1990-2009) AgricultureAgricultural land (% land area)Agricultural productivity, value added per worker (2000 $)Food production index (1999-2001=100)Population density, rural (people/ sq. km of arable land) Forests and biodiversityForest area (% land area)Deforestation (average annual %, 1990-2010)Nationally terrestrial protected area (% of land area)Threatened species, mammalsThreatened species, birdsThreatened species, fishThreatened species, higher plantsGEF benefits index for biodiversity (0-100, median is 1.5) EnergyGDP per unit of energy use (2005 PPP $/kg oil equivalent)Energy use per capita (kg oil equivalent)Energy from biomass products and waste (% of total)Electric power consumption per capita (kWh)Electricity generated using fossil fuel (% of total)Electricity generated by hydropower (% of total) Emissions and pollutionCO2 emissions per unit of GDP (kg/2005 PPP $)CO2 emissions per capita (metric tons)CO2 emissions growth (%, 1990–2007)Particulate matter (urban-pop.-weighted avg., μg/cu. m)Road sector energy use per capita (kg oil equivalent) Water and sanitationInternal freshwater resources per capita (cu. m)Freshwater withdrawal
Total (% of internal resources)Agriculture (% of total freshwater withdrawal)
Access to improved water source (% of total population)Rural (% of rural population)Urban (% of urban population)
Access to improved sanitation (% of total population)Rural (% of rural population)Urban (% of urban population)
Environment and healthAcute resp. infection prevalence (% of children under five)Diarrhea prevalence (% of children under five)Under-five mortality rate (per 1,000 live births) National accounting aggregates—savings, depletion and degradationGross savings (% of GNI)Consumption of fixed capital (% of GNI)Education expenditure (% of GNI)Energy depletion (% of GNI)Mineral depletion (% of GNI)Net forest depletion (% of GNI)CO2 damage (% of GNI)Particulate emissions damage (% of GNI)Adjusted net savings (% of GNI)
Population (millions) 24 Land area (1,000 sq. km) 528 GDP ($ billions) 26.4
Yemen, Rep.
GNI per capita, World Bank Atlas method ($)Adjusted Net National Income per capita ($)Urban population (% of total)Urban population growth (average annual %, 1990-2009) AgricultureAgricultural land (% land area)Agricultural productivity, value added per worker (2000 $)Food production index (1999-2001=100)Population density, rural (people/ sq. km of arable land) Forests and biodiversityForest area (% land area)Deforestation (average annual %, 1990-2010)Nationally terrestrial protected area (% of land area)Threatened species, mammalsThreatened species, birdsThreatened species, fishThreatened species, higher plantsGEF benefits index for biodiversity (0-100, median is 1.5) EnergyGDP per unit of energy use (2005 PPP $/kg oil equivalent)Energy use per capita (kg oil equivalent)Energy from biomass products and waste (% of total)Electric power consumption per capita (kWh)Electricity generated using fossil fuel (% of total)Electricity generated by hydropower (% of total) Emissions and pollutionCO2 emissions per unit of GDP (kg/2005 PPP $)CO2 emissions per capita (metric tons)CO2 emissions growth (%, 1990–2007)Particulate matter (urban-pop.-weighted avg., μg/cu. m)Road sector energy use per capita (kg oil equivalent) Water and sanitationInternal freshwater resources per capita (cu. m)Freshwater withdrawal
Total (% of internal resources)Agriculture (% of total freshwater withdrawal)
Access to improved water source (% of total population)Rural (% of rural population)Urban (% of urban population)
Access to improved sanitation (% of total population)Rural (% of rural population)Urban (% of urban population)
Environment and healthAcute resp. infection prevalence (% of children under five)Diarrhea prevalence (% of children under five)Under-five mortality rate (per 1,000 live births) National accounting aggregates—savings, depletion and degradationGross savings (% of GNI)Consumption of fixed capital (% of GNI)Education expenditure (% of GNI)Energy depletion (% of GNI)Mineral depletion (% of GNI)Net forest depletion (% of GNI)CO2 damage (% of GNI)Particulate emissions damage (% of GNI)Adjusted net savings (% of GNI)
230 2011 The Little Green Data Book
Population (millions) 13 Land area (1,000 sq. km) 743 GDP ($ billions) 12.8
GNI per capita, World Bank Atlas method ($)Adjusted Net National Income per capita ($)Urban population (% of total)Urban population growth (average annual %, 1990-2009) AgricultureAgricultural land (% land area)Agricultural productivity, value added per worker (2000 $)Food production index (1999-2001=100)Population density, rural (people/ sq. km of arable land) Forests and biodiversityForest area (% land area)Deforestation (average annual %, 1990-2010)Nationally terrestrial protected area (% of land area)Threatened species, mammalsThreatened species, birdsThreatened species, fishThreatened species, higher plantsGEF benefits index for biodiversity (0-100, median is 1.5) EnergyGDP per unit of energy use (2005 PPP $/kg oil equivalent)Energy use per capita (kg oil equivalent)Energy from biomass products and waste (% of total)Electric power consumption per capita (kWh)Electricity generated using fossil fuel (% of total)Electricity generated by hydropower (% of total) Emissions and pollutionCO2 emissions per unit of GDP (kg/2005 PPP $)CO2 emissions per capita (metric tons)CO2 emissions growth (%, 1990–2007)Particulate matter (urban-pop.-weighted avg., μg/cu. m)Road sector energy use per capita (kg oil equivalent) Water and sanitationInternal freshwater resources per capita (cu. m)Freshwater withdrawal
Total (% of internal resources)Agriculture (% of total freshwater withdrawal)
Access to improved water source (% of total population)Rural (% of rural population)Urban (% of urban population)
Access to improved sanitation (% of total population)Rural (% of rural population)Urban (% of urban population)
Environment and healthAcute resp. infection prevalence (% of children under five)Diarrhea prevalence (% of children under five)Under-five mortality rate (per 1,000 live births) National accounting aggregates—savings, depletion and degradationGross savings (% of GNI)Consumption of fixed capital (% of GNI)Education expenditure (% of GNI)Energy depletion (% of GNI)Mineral depletion (% of GNI)Net forest depletion (% of GNI)CO2 damage (% of GNI)Particulate emissions damage (% of GNI)Adjusted net savings (% of GNI)
Population (millions) 13 Land area (1,000 sq. km) 387 GDP ($ billions) 5.6
Zimbabwe
233The Little Green Data Book 2011
Access to improved sanitation is the percentage of population with adequate access to excreta disposal facilities (private or shared, but not public) that can effectively prevent human, animal, and insect contact with excreta. Improved facilities range from simple but protected pit latrines to flush toi-lets with a sewerage connection. To be effective, facilities must be correctly constructed and properly maintained. (World Health Organization; data are for 2009)
Access to improved water source is the percentage of the population with reasonable access to an adequate amount of water from an improved source, such as piped water into a dwelling, plot, or yard; public tap or standpipe; tube-well or borehole; protected dug well or spring; or rainwater collection. Unimproved sources include an unprotected dug well or spring, cart with small tank or drum, bottled water, and tanker trucks. Reasonable access to an adequate amount means the availability of at least 20 liters a person a day from a source within 1 kilometer of the dwelling. (World Health Organization; data are for 2009)
Acute respiratory infection prevalence is the percentage of children under age five with acute respiratory infection in the two weeks prior to the survey. (United Nations Children’s Fund; data are for the most recent year available during 1998–2005)
Adjusted net national income equals gross national income minus consump-tion of fixed capital, energy depletion, mineral depletion, and net forest depletion. (World Bank; data are for 2009)
Adjusted net savings equal gross savings minus consumption of fixed capital, plus education expenditures, minus energy depletion, mineral depletion, net forest depletion, and particulate emissions and carbon dioxide damage. (World Bank; data are for 2009)
Agricultural land is arable land, land under permanent crops, and permanent pastures. Arable land includes land defined by the Food and Agriculture Organization of the United Nations as land under temporary crops (double-cropped areas are counted once), temporary meadows for mowing or for pasture, land under market or kitchen gardens, and land temporarily fallow. Land abandoned as a result of shifting cultivation is excluded. Land under permanent crops is land cultivated with crops that occupy the land for long periods and need not be replanted after each harvest, such as cocoa, cof-fee, and rubber. This category includes land under flowering shrubs, fruit trees, nut trees, and vines but excludes land under trees grown for wood or timber. Permanent pasture is land used for five or more years for forage, including natural and cultivated crops. (Food and Agriculture Organization; data are for 2009)
Agricultural productivity is the ratio of agricultural value added, measured in 2000 U.S. dollars, to the number of workers in agriculture. Agricultural productivity is measured by value added per unit of input. Agricultural value added includes that from forestry and fishing. Thus interpretations of land productivity should be made with caution. (See World Bank 2011 for details; data are for 2009)
Glossary
234 2011 The Little Green Data Book
Carbon dioxide (CO2) damage is estimated at $20 per ton of carbon (the unit damage in 1995 U.S. dollars) times the number of tons of carbon emitted. (World Bank estimates; data are for 2009)
Carbon dioxide (CO2) emissions growth is the cumulative percentage change in emissions stemming from the burning of fossil fuels and the manufacture of cement. Emissions include carbon dioxide produced during consumption of solid, liquid, and gas fuels and gas flaring. (Carbon Dioxide Information Analysis Center; data are for 1990–2007)
Carbon dioxide (CO2) emissions per capita are carbon dioxide emissions divided by midyear population. (Carbon Dioxide Information Analysis Center, World Bank, and United Nations; data are for 2007)
Carbon dioxide (CO2) emissions per unit of GDP are carbon dioxide emis-sions in kilograms per unit of GDP in 2005 purchasing power parity (PPP) terms. PPP GDP is gross domestic product converted to international dollars using PPP rates. An international dollar has the same purchasing power over GDP that a U.S. dollar has in the United States. (Carbon Dioxide Information Analysis Center and World Bank; data are for 2007)
Consumption of fixed capital is the replacement value of capital used up in the process of production. (United Nations; data are extrapolated to 2009 from the most recent year available)
Deforestation is the permanent conversion of natural forest area to other uses, including shifting cultivation, permanent agriculture, ranching, settle-ments, and infrastructure development. Deforested areas do not include areas logged but intended for regeneration or areas degraded by fuel-wood gathering, acid precipitation, or forest fires. Negative numbers indicate an increase in forest areas. (Food and Agriculture Organization; data are for 1990–2010)
Diarrhea prevalence is the percentage of children under age five who had diarrhea in the two weeks prior to the survey. (United Nations Children’s Fund; data are for the most recent year available during 1998–2005)
Education expenditure is public current operating expenditures in education, including wages and salaries and excluding capital investments in buildings and equipment. (United Nations; data are extrapolated to 2009 from the most recent year available)
Electricity generated using fossil fuel is use of coal, oil, and gas as a per-centage of total inputs to the generation of electricity. (International Energy Agency; data are for 2009)
Electricity generated by hydropower is use of hydropower as a percentage of total inputs to the generation of electricity. (International Energy Agency; data are for 2009)
Electric power consumption per capita is the production of power plants and combined heat and power plants, minus transmission, distribution, and
Glossary
235The Little Green Data Book 2011
transformation losses and own use by heat and power plants plus imports minus exports divided by midyear population. (International Energy Agency; data are for 2009)
Energy depletion is the ratio of the value of the stock of energy resources to the remaining reserve lifetime (capped at 25 years). It covers crude oil, natural gas, and coal. (See World Bank 2011 for details; data are for 2009)
Energy from biomass products and waste is energy from solid biomass, liquid biomass, biogas, industrial waste, and municipal waste as a percent-age of total energy use. (International Energy Agency; data are for 2009)
Energy use per capita refers to apparent consumption, which is equal to indigenous production plus imports and stock changes, minus exports and fuels supplied to ships and aircraft engaged in international transport. (International Energy Agency; data are for 2009)
Food production index indicates the relative level of net food production compared with the base period 1999–2001. It covers food crops that are considered edible and that contain nutrients. Coffee and tea are excluded because, although edible, they have no nutritive value (See the Food and Agriculture Organization’s Production Yearbook for details; data are for 2009)
Forest area is land under natural or planted stands of trees, whether produc-tive or not. (Food and Agriculture Organization; data are for 2010)
Freshwater withdrawal, agriculture, is withdrawals for irrigation and livestock production as a percentage of total freshwater withdrawal. (World Resources Institute; data are for various years; for details see World Development Indicators 2011, Primary data documentation.)
Freshwater withdrawal, total, is total water withdrawal, excluding evapora-tion losses from storage basins and including water from desalination plants in countries where they are a significant source. Withdrawals can exceed 100 percent of internal renewable resources because river flows from other countries are not included, because extraction from nonrenewable aquifers or desalination plants is considerable, or because there is significant water reuse. (Food and Agriculture Organization and World Resources Institute; data are for various years; for details see World Development Indicators 2011, Primary data documentation.)
GDP is gross domestic product and measures the total output of goods and services for final use occurring within the domestic territory of a given country, regardless of the allocation to domestic and foreign claims. GDP at purchaser values (market prices) is the sum of gross value added by all resident and nonresident producers in the economy plus any taxes and minus any subsidies not included in the value of the products. It is calculated without deductions for depreciation of fabricated assets or for depletion and degradation of natural resources. (World Bank, Organization for Economic Co-operation and Development, and United Nations; data are for 2009)
236 2011 The Little Green Data Book
GDP per unit of energy use is 2005 gross domestic product (GDP) in pur-chasing power parity (PPP) terms per kilogram of oil equivalent of energy use. PPP GDP is GDP converted to international dollars using PPP rates. An international dollar has the same purchasing power over GDP that a U.S. dol-lar has in the United States. (International Energy Agency and World Bank; data are for 2009)
GEF benefits index for biodiversity is a composite index of relative biodiver-sity potential for each country developed by the Global Environment Facility, based on the species represented in each country, their threat status, and the diversity of habitat types in each country. The index shown in the tables has been normalized so that values run from 0 (no biodiversity potential) to 100 (maximum biodiversity potential) (World Bank; estimates are for 2009)
GNI per capita is gross national income (GNI) divided by midyear population. GNI is gross domestic product plus net receipts of primary income (employee compensation and property income) from abroad. GNI per capita is in cur-rent U.S. dollars, converted using the World Bank Atlas method (see World Development Indicators 2011, Statistical methods). (World Bank, Organization for Economic Co-operation and Development, and United Nations; data are for 2009)
Gross savings are calculated as gross national income less total con-sumption, plus net transfers. (World Bank and Organization for Economic Co-operation and Development; data are for 2009)
Internal freshwater resources per capita are internal renewable resources, which include flows of rivers and groundwater from rainfall in the country but excludes river flows from other countries, divided by midyear population. (Refers to data reported to the Food and Agriculture Organization as of 2007)
Land area is a country’s total land area, excluding area under inland water bodies, national claims to continental shelf, and exclusive economic zones. In most cases the definition of inland water bodies includes major rivers and lakes. (Food and Agriculture Organization; data are for 2009)
Mineral depletion is the ratio of the value of the stock of mineral resources to the remaining reserve lifetime (capped at 25 years). It covers bauxite, copper, iron, lead, nickel, phosphate, tin, gold, silver, and zinc. (See World Bank 2011 for details; data are for 2009)
Nationally protected area is totally or partially protected areas of at least 1,000 hectares that are designated as national parks, natural monuments, nature reserves or wildlife sanctuaries; protected landscapes and seascapes; and scientific reserves. It includes World Conservation Union–protected area categories I–VI. (World Conservation Monitoring Centre; data are for the most recent year available)
Net forest depletion is the product of unit resource rents and the excess of round-wood harvest over natural growth. If growth exceeds harvest, this figure is zero. (Food and Agriculture Organization and World Bank estimates of natural growth; data are for 2009)
Glossary
237The Little Green Data Book 2011
Particulate emissions damage is calculated as the willingness to pay to reduce the risk of illness and death attributable to particulate emissions. (World Bank estimates; data are for 2009)
Particulate matter is fine suspended particulates of less than 10 microns in diameter that are capable of penetrating deep into the respiratory tract and causing damage. The indicator is the population-weighted average of all cities in the country with a population greater than 100,000. (World Bank estimates; data are for 2009)
Population includes all residents who are present regardless of legal status or citizenship except for refugees not permanently settled in the country of asylum, who are generally considered part of the population of their country of origin. (United Nations; data are midyear estimates for 2009)
Population density, rural, is rural population divided by arable land area. Rural population is estimated as the difference between the total population and urban population. (See urban population; data are for 2009)
Threatened species, birds, are the number of species of birds classified by the IUCN as endangered, vulnerable, rare, indeterminate, out of danger, or insufficiently known. Birds are listed for countries included within their breeding or wintering ranges. (World Conservation Monitoring Centre and IUCN; data are for 2010)
Threatened species, fish, are the number of species of fish—cold-blooded aquatic vertebrates of the superclass Pisces—classified by the IUCN as endangered, vulnerable, rare, indeterminate, out of danger, or insufficiently known. (World Conservation Monitoring Centre and IUCN; data are for 2010)
Threatened species, higher plants, are the number of native vascular plant species classified by the IUCN as endangered, vulnerable, rare, indetermi-nate, out of danger, or insufficiently known. (World Conservation Monitoring Centre and IUCN; data are for 2010)
Threatened species, mammals, are the number of species of mammals— excluding whales and porpoises—classified by the IUCN as endangered, vulnerable, rare, indeterminate, out of danger, or insufficiently known. (World Conservation Monitoring Centre and IUCN; data are for 2010)
Readsector energy use per capita is the total energy consumption in the road sector divided by midyear population (International Energy Agency 2010; data are for 2009).
Under-five mortality rate is the probability that a newborn baby will die before reaching age five if subject to current age-specific mortality rates. (United Nations and United Nations Children’s Fund; data are for 2009)
Urban population is the share of the midyear population living in areas defined as urban in each country (United Nations; data are for 2009)
Urban population growth is the exponential change in urban population for the period indicated. (United Nations; data are for 1990–2009)
239The Little Green Data Book 2011
World Bank 2011a. The Changing Wealth of Nations: Measuring Sustainable
Development in the New Millennium. Washington, D.C.: The World Bank.
———. 2011b. World Development Indicators 2011. Washington, D.C.: World Bank.
References
AFGHANISTAN ALBANIA ALGERIA ANGOLA ARGENTINA ARMENIA AZERBAIJAN BANGLADESH BELARUS BELIZE BENIN BHUTAN BOLIVIA BOSNIA AND HERZEGOVINA BOTSWANA BRAZIL BULGARIA BURKINA FASO BURUNDI CAMBODIA CAMEROON CAPE VERDE CENTRAL AFRICAN REPUBLIC CHAD CHILE CHINA COLOMBIA COMOROS DEMOCRATIC REPUBLIC OF CONGO REPUBLIC OF CONGO COSTA RICA CÔTE D’IVOIRE CROATIA DJIBOUTI DOMINICA DOMINICAN REPUBLIC ECUADOR ARAB REPUBLIC OF EGYPT EL SALVADOR ERITREA ETHIOPIA FIJI GABON THE GAMBIA GEORGIA GHANA GRENADA GUATEMALA GUINEA GUINEA-BISSAU GUYANA HAITI HONDURAS INDIA INDONESIA ISLAMIC REPUBLIC OF IRAN JAMAICA JORDAN KAZAKHSTAN KENYA KYRGYZ REPUBLIC LAO PEOPLE’S DEMOCRATIC REPUBLIC LATVIA LEBANON LESOTHO LIBERIA FORMER YUGOSLAV REPUBLIC OF MACEDONIA MADAGASCAR MALAWI MALAYSIA MALDIVES MALI MAURITANIA MAURITIUS MEXICO MOLDOVA MONGOLIA MONTENEGRO MOROCCO MOZAMBIQUE MYANMAR NEPAL NICARAGUA NIGER NIGERIA PAKISTAN PANAMA PAPUA NEW GUINEA PARAGUAY PERUPHILIPPINES POLAND ROMANIA RUSSIAN FEDERATION RWANDA SAMOA SÃO TOMÉ AND PRÍNCIPE SENEGAL SERBIA SEYCHELLESSIERRA LEONE SOLOMON ISLANDS SOMALIA SOUTH AFRICA SRILANKA ST. KITTS AND NEVIS ST. LUCIA ST. VINCENT AND THE GRENADINES SUDAN SWAZILAND TAJIKISTAN TANZANIA THAILAND TOGO TONGA TUNISIA TURKEY TURKMENISTAN UGANDA UKRAINE URUGUAY UZBEKISTAN VANUATU REPÚBLICA BOLIVARIANA DE VENEZUELA VIETNAM REPUBLIC OF YEMEN ZAMBIA ZIMBABWE