138
©FanRuan Software Co., Ltd. 1 / 138 Front Runner of BI and Reporting Tools FineReport (V10.0) Whitepaper CopyRight@2019 FanRuan Software Co., Ltd. All rights reserved.

©FanRuan Software Co., Ltd. 1 / 138
Front Runner of
BI and Reporting Tools
FineReport (V10.0) Whitepaper
CopyRight@2019
FanRuan Software Co., Ltd. All rights reserved.

©FanRuan Software Co., Ltd. 2 / 138
Catalogue
Contents
1.What is FineReport ........................................................................................................................ 9
1.1. Why do Software Companies Need FineReport? ............................................. 10
1.2. Why do End Users Need FineReport? .................................................................. 12
2. FineReport System Structure ................................................................................................ 16
2.1. System Structure ........................................................................................................ 16
2.1.1 Functional Structure of FineReport .................................................................. 16
2.1.2 Technology Architecture .................................................................................... 16
2.2. Product Composition ................................................................................................ 17
2.2.1. Report Designer ........................................................................................... 18
2.2.2. Report Server ................................................................................................ 19
3. FineReport Function Overview ............................................................................................. 20
3.1. Data Support ............................................................................................................... 20
3.2. Designer Introduction .............................................................................................. 21
3.2.1. Code-free Development, Drag & Drop Operations ........................... 21
3.2.2. Remote Design ............................................................................................. 23

©FanRuan Software Co., Ltd. 3 / 138
3.2.3. Multiple Working Directories ................................................................... 24
3.2.4. Multiple-designer Collaboration ............................................................. 25
3.2.5. Online Update & Upgrade ........................................................................ 26
3.2.6. AlphaFine Intelligent Assistant ................................................................. 26
3.3. Complex Report Processing .................................................................................... 29
3.3.1. Multi-source Data Association ................................................................. 29
3.3.2. Row and Column Symmetry ..................................................................... 29
3.3.3. Row/Column Split, Pagination and Group report .............................. 30
3.3.4. Dynamic Cross-cell Calculation ................................................................ 32
3.3.5. Formula ........................................................................................................... 33
3.3.6. Aggregation Report .................................................................................... 35
3.4. Dashboard .................................................................................................................... 36
3.4.1. Multi-screen Adaptation ............................................................................ 37
3.4.2. Rich Dashboard Components .................................................................. 39
3.4.3. Multiple Layout Modes .............................................................................. 39
3.4.4. Component Reuse ....................................................................................... 40
3.4.5. Component Linkage and Analysis ........................................................... 40
3.4.6. Data Monitoring ........................................................................................... 40
©FanRuan Software Co., Ltd. 4 / 138
3.4.7. Carousel .......................................................................................................... 41
3.4.8. Large screen combined with hardware ................................................. 42
3.5. Report Export and Printing ..................................................................................... 42
3.5.1. File Export ...................................................................................................... 42
3.5.2. No client Printing and Local Software Printing ................................... 43
3.5.3. Multiple printing options ........................................................................... 43
3.6. Data Query and Filtering ......................................................................................... 44
3.6.1. Rich control widget types .......................................................................... 45
3.6.2. Flexible parameter interface ..................................................................... 46
3.6.3. Advanced functions of parameter query .............................................. 46
3.7. Chart .............................................................................................................................. 48
3.7.1. Advanced Chart Technology .................................................................... 48
3.7.2. Rich chart types and styles ........................................................................ 49
3.7.3. Diverse chart interaction effects .............................................................. 51
3.7.4. Rich customizable settings ........................................................................ 55
3.7.5. Chart drill-down ........................................................................................... 59
3.7.6. Chart linkage ................................................................................................. 60
3.7.7. Data Map ........................................................................................................ 61

©FanRuan Software Co., Ltd. 5 / 138
3.8. Interactive analysis .................................................................................................... 65
3.8.1. Linkage ............................................................................................................ 65
3.8.2. Drill-down ...................................................................................................... 66
3.8.3. Multi-perspective data analysis ............................................................... 67
3.8.4. Real-time data analysis .............................................................................. 67
3.9. Data Entry ..................................................................................................................... 68
3.9.1. Diverse reporting style ............................................................................... 70
3.9.2. Submission control ...................................................................................... 70
3.9.3. Data validation .............................................................................................. 72
3.9.4. Multi-level reporting ................................................................................... 73
3.9.5. Data temporary storage ............................................................................. 74
3.9.6. Multi-sheet data entry ................................................................................ 76
3.9.7. Excel data import ......................................................................................... 77
3.10. Decision-making Platform ....................................................................................... 79
3.10.1. Directory Management .............................................................................. 80
3.10.2. User Management ....................................................................................... 80
3.10.3. Authorization ................................................................................................ 81
3.10.4. Hierarchical Authorization ......................................................................... 83

©FanRuan Software Co., Ltd. 6 / 138
3.10.5. System Management .................................................................................. 85
3.10.6. Intelligent Operation and Maintenance ................................................ 87
3.10.7. Message Center ............................................................................................ 92
3.10.8. Safety Management .................................................................................... 93
3.10.9. Registration Management ......................................................................... 96
3.10.10. Appearance customization ........................................................................ 97
3.11. Task Scheduling .......................................................................................................... 99
3.11.1. Timing tasks ................................................................................................... 99
3.11.2. Permission control of scheduled tasks ................................................ 102
3.11.3. Scheduled filling ......................................................................................... 102
3.12. Mobile apps ............................................................................................................... 103
3.12.1. ReactNative combined with native ....................................................... 104
3.12.2. OEM Cloud Packaging & Personalization ........................................... 104
3.12.3. HTML5 report .............................................................................................. 105
3.12.4. Mobile Adaptive and Zooming .............................................................. 105
3.12.5. Mobile Drilling and Linkage .................................................................... 106
3.12.6. Mobile terminal filling .............................................................................. 107
3.12.7. Mobile interactive experience ................................................................ 107

©FanRuan Software Co., Ltd. 7 / 138
3.12.8. Adding devices and bindings ................................................................. 108
3.12.9. Mobile message push ............................................................................... 110
3.13. International language support ........................................................................... 111
4. Application Deployment ...................................................................................................... 112
4.1. System Integration .................................................................................................. 112
4.1.1. Java project integration ........................................................................... 112
4.1.2. Non-java project integration .................................................................. 113
4.1.3. C/S project integration ............................................................................. 113
4.2. Web page integration............................................................................................. 114
4.3. Clustering ................................................................................................................... 115
4.4. Single Sign-On .......................................................................................................... 116
5. Extended development of FineReport ............................................................................. 117
5.1. API interface .............................................................................................................. 118
5.1.1. Program data source ................................................................................ 118
5.1.2. Report format settings ............................................................................. 119
5.1.3. Custom interaction .................................................................................... 119
5.1.4. Custom filling .............................................................................................. 119
5.1.5. Report reprocessing .................................................................................. 120
©FanRuan Software Co., Ltd. 8 / 138
5.1.6. Custom Functions ...................................................................................... 120
5.1.7. Import and export ..................................................................................... 120
5.2. Plugin development ..................................................................................................... 121
6. FineReport performance and optimization .................................................................... 123
6.1. Measured data .......................................................................................................... 123
6.2. Performance Optimization .................................................................................... 124
6.2.1. Report performance optimization ........................................................ 124
6.2.2. Server performance optimization ......................................................... 126
7. Product environment support ............................................................................................ 126
7.1. Software environment ............................................................................................ 126
7.2. Hardware environment ........................................................................................... 127
8. Contact us ................................................................................................................................ 128
9. About FanRuan ....................................................................................................................... 129
10. Honor......................................................................................................................................... 130
11. History ....................................................................................................................................... 134

©FanRuan Software Co., Ltd. 9 / 138
1.What is FineReport
FineReport is a “professional, simple and flexible” enterprise reporting software developed by
FanRuan Software Co., Ltd, architecturally designed based on “no-code development”
concept. With FineReport, users can quickly design complex reports and good-looking
dashboards by dragging and dropping report elements and incorporates reports and
dashboards to establish a decision-making platform . FineReport is a leading reporting software
in China with the highest domestic market share and widespread clients from various industries
and departments.
(1)Powerful Functions
With a deep understanding of user behaviors and demands, and after studying the development
of all walks of industries, FineReport becomes the one that knows reports the best and
outperforms competitors especially in complex report processing. For over ten years, FineReport
has focused on function research and mainstream innovation, so as to identify and fulfill the
core demands of clients at the fastest pace.
(2)Extremely-low Learning Costs
FineReport is easy to learn, operate and integrate. There are a variety of learning resources
available including online training, city class, etc. Besides, users can receive technical supports by
online chat, telephone, e-mail, etc.
(3)Extensive Experience

©FanRuan Software Co., Ltd. 10 / 138
FineReport possesses a unique understanding of enterprise informatization in various industries
and has demonstrated its rich experience in industrial applications. It can provide users with
practical advice concerning strategy, operation, organization, finance and marketing.
(4) Efficient Services
By adhering to the “timely, professional, thoughtful and meticulous” service spirits, FineReport
has established a comprehensive after-sales service and technical support system which have
passed the ISO9001 International Quality System Certification, to deliver complete and effective
after-sales services and technical support to our clients.
(5) Dedicated Culture
The culture of FineReport is to “Devote ourselves to our enduring undertakings with heart of
original inspiration and wisdom of maturity”. In FanRuan, everyone can rise to new challenges
through constant learning, seeking to provide our clients with excellent products and meticulous
services.
1.1. Why do Software Companies Need FineReport?
For software companies, with the help of FineReport, problems arising from coding from scratch
or developing reports based on open source software can be eliminated. What's more,
FineReport will accelerate your project progress and lower project costs.

©FanRuan Software Co., Ltd. 11 / 138
Until recently, most projects were developed through custom codes or based on customized
development platforms. However, this kind of development solutions has many disadvantages in
the long term, such as:
• Long project life cycle and frequent delays
• Project members are under pressure and working overtime
• Poor demand expansibility and the inability to fast respond to new demands
• Poor software quality and system performance with lots of bugs
• Difficult and complicated maintenance process
• High turnover risk and series consequences of brain drain
Open-source software is now being applied in some projects to save costs. Although the
software license cost is eliminated, such software is usually inferior to code development
because the project may be delayed due to problems including:
• Limited functionality that cannot meet your requirements
• Unguaranteed services and product bugs
• High learning costs, requiring long-term study
The advent of FineReport can free you from the problems mentioned above and
enable you to develop report applications efficiently. Thanks to the easy-to-use
feature of FineReport, end users can maintain and update the system through easy
modifications after the project delivery.
©FanRuan Software Co., Ltd. 12 / 138
1.2. Why do End Users Need FineReport?
There are common problems arising during the process of information construction of
enterprises:
1.2.1. The volume of business data shot up yet few of them are used for
operation analysis and business management.
During informatization, enterprises will witness an increase of business data. Although most
companies hold the opinion that data are a huge wealth, they don’t know how to make use of
them. Most data are merely accumulated together without effective data analysis and display,
and very few of them are used to support operation decisions, operation analysis and business
control.
1.2.2. Business data are disperse and difficult to utilize.
In most cases, an enterprise has several business systems (e.g. CRM, ERP and OA) which are
operated independently from each other. Under these circumstances, you have to access
different platforms to query data, and this makes it extremely hard to integrate and leverage
business. In addition, multi-source data collection can lead to duplicate entries, data out of
sync and different data structures, which can negatively impact the consistency and accuracy of
enterprise data.

©FanRuan Software Co., Ltd. 13 / 138
1.2.3. Processing data manually results in a heavy workload, low accuracy and
poor data security.
When senior managers require comprehensive cross-department and cross-system data, the
business department has to manually summarize and modify data via excel, and this results in
heavy workload, low efficiency and the increased probability of data error. Besides, daily and
monthly reports are made repeatedly and separately, making the reports inconvenient to
prepare, maintain and view. Excel only has a simple authorization function which is far from
enough to guarantee enterprise data security.
1.2.4. Original reports can no longer meet the requirements of new business.
When an enterprise customize reports for business analysis, the original reports may not meet
the requirements from the changing business. In this case, secondary development is generally
required to adjust the reporting system, which imposes great burdens on end users and
software companies. Furthermore, the lack of linkage and correspondence among the reports
makes it difficult to conduct a further comprehensive analysis.
1.2.5. Lack of a unified reporting management portal.
Although each business system has its directory, there lacks a common portal based upon which
the administrators can inquire and manage all reports and allocate authorities to departments.
1.2.6. Displaying data in a straightforward way fails to give managers a holistic
view of all the information.
©FanRuan Software Co., Ltd. 14 / 138
The built-in reports in the business system only have basic data summary and display functions,
and are weak in data visualization and analysis, not to mention business forecasting and pre-
warning to support multiple business applications. Therefore, it is difficult for the managers to
grasp global information and make decisions strategically.
1.2.7. People on business trips cannot view reports conveniently.
Today, mobile officing has become a trend. With portable terminals, the management can make
better use of their fragmented time and take real-time control of the enterprise no matter where
they are. However, due to all sorts of reasons, at least 80% of enterprises still work with reports
on PCs, and this inhebits managers from getting real-time information and making decisions to
adjust business timely.
Because of the problems described above, the decision making of the management is still
dependent on experience, making adverse impacts on the management and operation of
enterprises.
FineReport reporting software provides solutions to tackle all these problems.
a) Data Integration:
• Conveniently connect to multiple data sources.
• Retrieve data from multiple sources via a drag-and-drop interface.

©FanRuan Software Co., Ltd. 15 / 138
• Related businesses data are combined in one report to support operation analysis
and business monitoring.
b) Data Collection:
• Easily realize data entry to databases using reports as the interface.
• Ensure the correctness of the collected data via data validation and intelligent
submission control.
c) Data Visualization
• Reports with informative tables and charts can be accessed via PCs or mobile
devices.
• Gain deep insights through various analysis methods: chart analysis, drill-down
analysis, multi-dimensional analysis, custom analysis, and real-time analysis.

©FanRuan Software Co., Ltd. 16 / 138
2. FineReport System Structure
2.1. System Structure
2.1.1 Functional Structure of FineReport
Report developers prepare the data source and design reports; administrators configure the
report users and manage authorities; report users perform the query, analysis, printing, export,
and data entry on reports on the front end. The report application supports
PC/tablet/mobile/large screen devices, and is compatible with mainstream browsers.
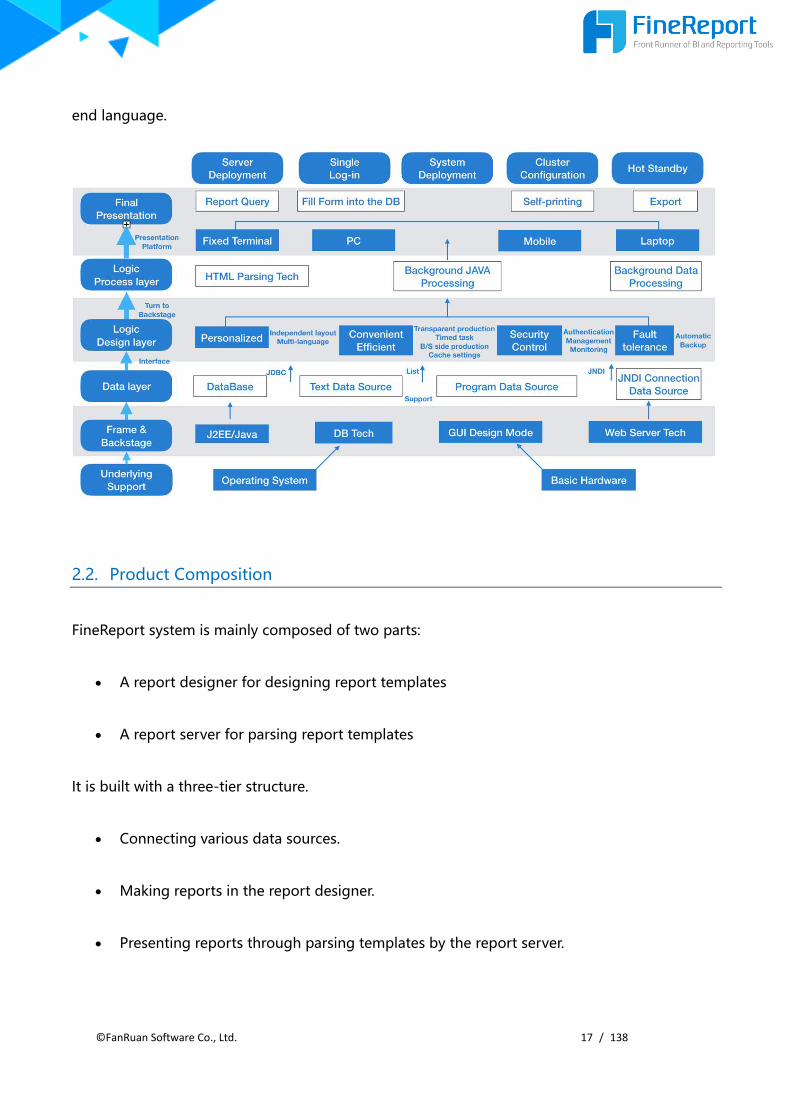
2.1.2 Technology Architecture
FineReport is a pure Java software which has good cross-platform compatibility. It can be
integrated with various business systems and be deployed in multiple operating systems and
mainstream web application servers. FineReport uses HTML language as the front-
©FanRuan Software Co., Ltd. 17 / 138
end language.
2.2. Product Composition
FineReport system is mainly composed of two parts:
• A report designer for designing report templates
• A report server for parsing report templates
It is built with a three-tier structure.
• Connecting various data sources.
• Making reports in the report designer.
• Presenting reports through parsing templates by the report server.

©FanRuan Software Co., Ltd. 18 / 138
2.2.1. Report Designer
FineReport designer supports various functions such as tables, charts, parameters, widgets, data
entry, printing, and exporting. It is an integrated platform for development, debugging, and
deployment.
©FanRuan Software Co., Ltd. 19 / 138
2.2.2. Report Server
A report server is a server in the form of a servlet that parses a report in a web environment. The
user interacts with the application through a browser and a report server.
Report parsing: FineReport server turns report templates into readable and interactable
reports by converting the template into an HTML page, making it convenient for users to
view, modify and print data through the browser.
Cache management: To reduce resource waste caused by frequent access, FineReport
provides a powerful caching mechanism for data caching, making user access more efficient.
Connection pool configuration: By establishing a database connection pool, the connections
can be efficiently and safely reused.
Performance management: FineReport supports distributed clusters, big data computing,
and massive concurrency.

©FanRuan Software Co., Ltd. 20 / 138
3. FineReport Function Overview
3.1. Data Support
FineReport can connect to data sources in a variety of ways. It can directly connect to popular
databases through JDBC, or share a data connection with the application server through
JNDI. What’s more, SAP systems can be connected to FineReport through JCO.
Supported data sources are:
Relational data sources: Oracle, SQL Server, MySQL, DB2, Sybase, Informix, and other
mainstream relational databases; support SQL to retrieve data tables or views, as well as
stored procedures.
Text data sources: Excel files, TXT files, XML files, etc.
Built-in data sources: Built-in server datasets and embedded datasets in report
templates.
Multidimensional databases: Essbase, SSAS, SAP BW, Hadoop, and FineBI cubes, etc.
NoSQL data sources: Non-relational databases such as MongoDB.
Other data sources: Program data sources, JSON data, SAP data sources, etc.

©FanRuan Software Co., Ltd. 21 / 138
3.2. Designer Introduction
3.2.1. Code-free Development, Drag & Drop Operations
FineReport has an interface similar to Excel, and this significantly reduces the cost of
learning. Anyone who is familiar to Excel can become a fast learner of FineReport.
FineReport supports multiple-sheet and crosssheet calculations and is perfectly compatible with
Excel formulas. Users can design complex report patterns in a WYSIWYG fashion.

©FanRuan Software Co., Ltd. 22 / 138
The aggregation report design mode supports the design of large irregular reports. By contrast,
the traditional Excel grid interface requires frequent merging and splitting of cells when
processing irregular reports, which is extremely tedious.

©FanRuan Software Co., Ltd. 23 / 138
The dashboard design mode enables you to create eye-catching management dashboards. It
allows you to freely combine charts, widgets and report bodies on a canvas by drag-and-drop
operations and realize component linkage and data drill down.
3.2.2. Remote Design
When traditional reporting tools work on an internal network, it requires to deploy both the
designer and the reporting project to servers – this is often referred to as a two-tier architecture,
which creates several problems. For instance, companies that use internal networks pay high
attention to server security, so they tend to use a specific server to connect to the database.
Under such circumstances, installing the designer on the server not only increases the
maintenance difficulty of the server administrator, but also reduces the security level of the

©FanRuan Software Co., Ltd. 24 / 138
server. What’s worse, when the reporting requirements change, it requires technicians to do
on-site operations, which is cumbersome and inefficient.
FineReport uses a three-tier architecture technology that allows users to design templates locally
and publish them remotely via remote design. Furthermore, users can edit and change report
templates directly on the server-side.
3.2.3. Multiple Working Directories
FineReport introduces the concept of a working directory for reporting. An individual report
application or an integrated report environment can be considered as a working directory. Each
working directory contains a corresponding jar file, a report template file, a resource
management file, etc. When FineReport is installed on your computer, the built-in webroot
folder under the local installation directory will function as an independent local working
directory.
©FanRuan Software Co., Ltd. 25 / 138
In practice, designing reports in remote directories becomes a common requirement. After
report server integration is deployed in a real system, report designers can configure and edit
report template files directly by connecting the designer to a remote environment. In the case of
multiple environments, such as test environment, production environment, etc., FineReport’s
capability to convenient switch among multiple work directories can provide a great
convenience for designers.
3.2.4. Multiple-designer Collaboration
A system development team inevitably has many people engaged during the development of
reports. The general method of version management is to apply SVN/VSS/CC, but the real-time
performance is unsatisfactory, especially when facing the requirement of report backup and
restore.
With FineReport, collaborative report design is practice. Multiple report designers can connect
to the same report development environment through the remote designer. In addition,
FineReport supports authorization, so as to control the scope of operation of each report maker
and ensure data security . To prevent conflicts caused by multiple people editing the same file at
the same time, FineReport offers a function to lock and unlock templates. Specifically, when
report maker A is editing a report template, the system will lock the template and prevents
others from editing the file at the same time.
©FanRuan Software Co., Ltd. 26 / 138
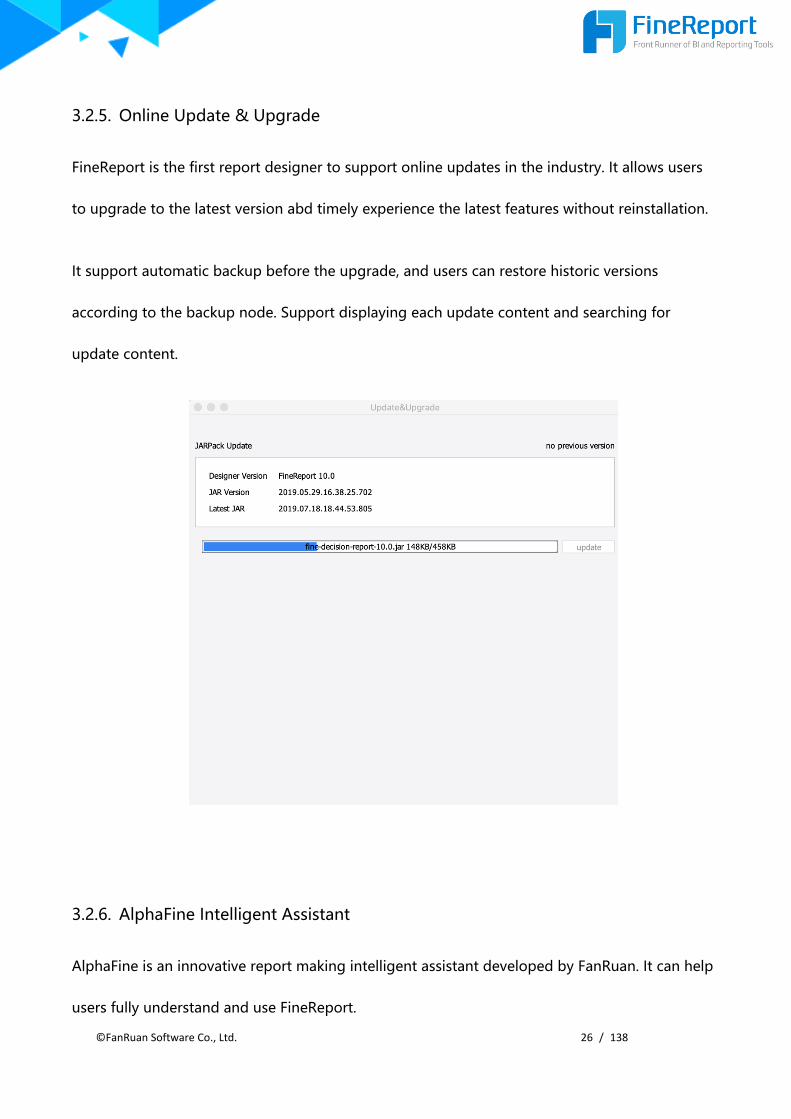
3.2.5. Online Update & Upgrade
FineReport is the first report designer to support online updates in the industry. It allows users
to upgrade to the latest version abd timely experience the latest features without reinstallation.
It support automatic backup before the upgrade, and users can restore historic versions
according to the backup node. Support displaying each update content and searching for
update content.
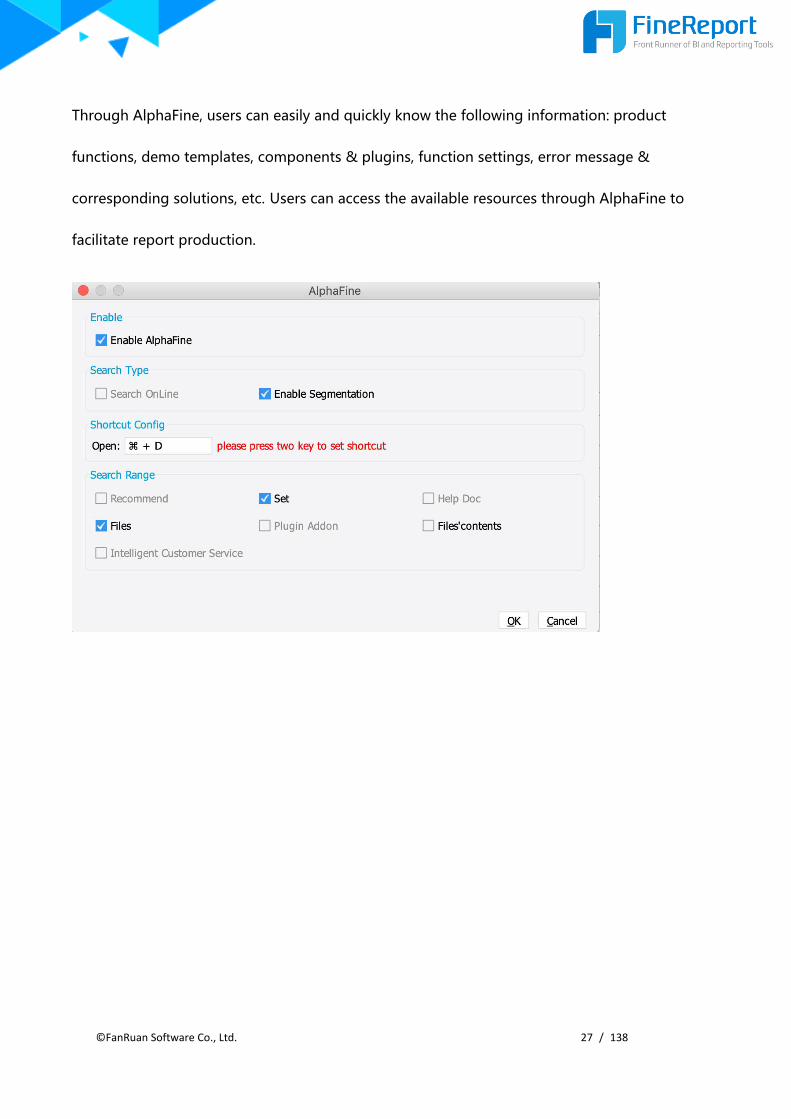
3.2.6. AlphaFine Intelligent Assistant
AlphaFine is an innovative report making intelligent assistant developed by FanRuan. It can help
users fully understand and use FineReport.
©FanRuan Software Co., Ltd. 27 / 138
Through AlphaFine, users can easily and quickly know the following information: product
functions, demo templates, components & plugins, function settings, error message &
corresponding solutions, etc. Users can access the available resources through AlphaFine to
facilitate report production.

©FanRuan Software Co., Ltd. 28 / 138
The following figure shows the search interface of AlphaFine, which allows you to search
template content, function settings, and so on.
The following figure shows the intelligent detection function of AlphaFine. Based on the
problem knowledge base in the cloud, users can quickly know the cause of the current error and
the corresponding solution.

©FanRuan Software Co., Ltd. 29 / 138
3.3. Complex Report Processing
3.3.1. Multi-source Data Association
FineReport provides a heterogeneous data source model that enables multi-source data
association. Data in the same report can come from multiple tables in the same database or
different databases.
3.3.2. Row and Column Symmetry
Some traditional reporting tools, due to the flaws in the strip-like presentation, the display effect
of horizontally expanded data is not as satisfactory as the effect of vertically expanded data. This
makes it difficult to make crosstabs and complicated reports. FineReport utilizes a processing
model that naturally supports symmetry of rows and columns, and all operations on vertically
expanded data can be fully applied on those expanded horizontally.
©FanRuan Software Co., Ltd. 30 / 138
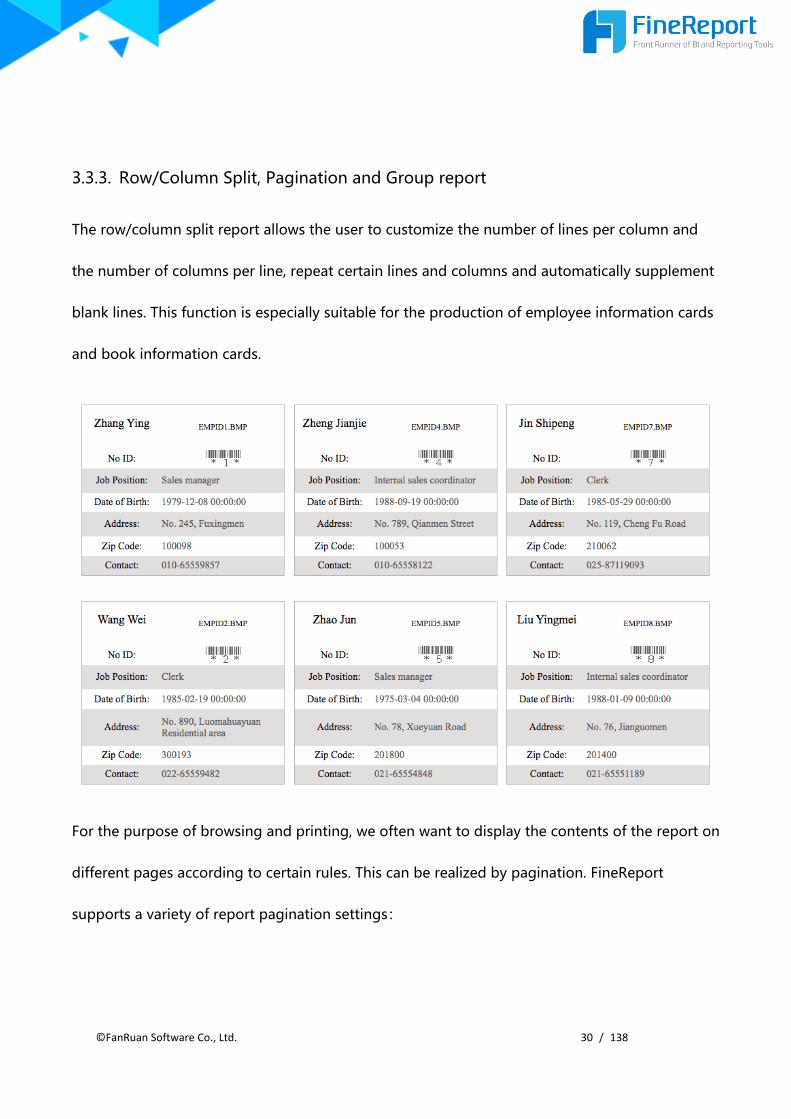
3.3.3. Row/Column Split, Pagination and Group report
The row/column split report allows the user to customize the number of lines per column and
the number of columns per line, repeat certain lines and columns and automatically supplement
blank lines. This function is especially suitable for the production of employee information cards
and book information cards.
For the purpose of browsing and printing, we often want to display the contents of the report on
different pages according to certain rules. This can be realized by pagination. FineReport
supports a variety of report pagination settings:
©FanRuan Software Co., Ltd. 31 / 138
Specify pagination: Users can decide how to paginate according to the actual situation.
For example, you can specify a fixed number of pages and display a fixed number of
lines in each page, or let the report to paginate according to groups.
Dynamically repeat title and end lines: No need to repeat input and design to achieve
titles and footers on different pages.
In-page total: Totals all data displayed in the page at the end of each page.
Non-pagination preview: All data are displayed on a single page, and the user can
browse the entire page by dragging the scroll bar.
Freeze the header: When dragging the scroll bar up and down or left and right, the
position of the first row or the first column is fixed relative to the window.
Grouping reports in irregular formats are commonly used in enterprises. In order to support
such reports perfectly, FineReport supports a variety of report grouping settings.
Custom formula grouping: Data are grouped according to a certain field, such as a date
field, and each date corresponds to a group. Considering the grouping is too detailed,
you can choose to group data by year and week.
Custom condition grouping: Custom condition grouping means to group data by range.
The groups are specified by defining a range of data, such as according to the score
range, age range, time period, etc. Record values fall in a certain value range are
displayed in the corresponding group.
©FanRuan Software Co., Ltd. 32 / 138
Adjacent consecutive grouping: The database table data is entered in time series. When
displaying data, FineReport can realize that the field value in adjacent rows are the same
according to the time sequence, making the report have a natural grouping.
Grouping: In sales analysis, the exists markets with high sales. When reporting the sales
performance, report makers tend to use these markets as the main analysis target and
summarize the data of other markets as an “Other” group. This can be realized by
merge grouping.
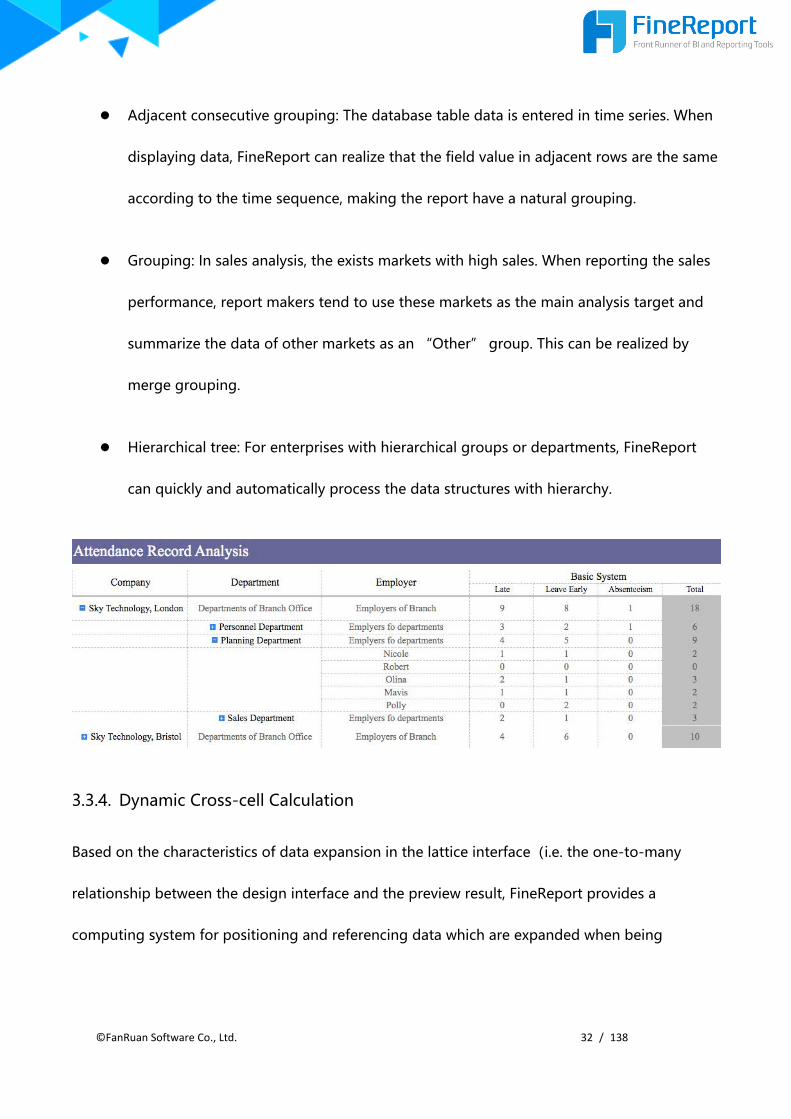
Hierarchical tree: For enterprises with hierarchical groups or departments, FineReport
can quickly and automatically process the data structures with hierarchy.
3.3.4. Dynamic Cross-cell Calculation
Based on the characteristics of data expansion in the lattice interface(i.e. the one-to-many
relationship between the design interface and the preview result, FineReport provides a
computing system for positioning and referencing data which are expanded when being

©FanRuan Software Co., Ltd. 33 / 138
previewed. This system utilizes hierarchical coordinates to realize cross-cell calculation. The
mechanism behind hierarchical coordinates is:
whereby Cellx refers to the target cell, Lk refers to the left parent of Cellx, Tk refers to the upper
parent of Cellx.
You can better understand the idea with the example below:
Dynamic cross-cell calculation covers calculations commonly used in reports: proportion, ratio,
ranking, row number, running total. Additionally, you make these calculations within data groups
or cross data group, so as to generate indexes like MoM ratio, YoY ratio, ranking within group,
etc.
3.3.5. Formula
In the process of template making, formulas are frequently used to generate statistics.
FineReport is fully compatible with Excel formulas and offers a set of functions. All the wrapped
functions have detailed descriptions to enable fast learning. The function of formula and rich

©FanRuan Software Co., Ltd. 34 / 138
functions reduce repeated manual work during template production and make report
maintenance easier.
Types of functions provided by FineReport: math and trigonometric functions, text functions,
date and time functions, logical functions, array related functions, table data functions,
hierarchical coordinate functions, and other functions.
FineReport allows users to customize functions according to special business requirements. The
function definition is based on Java and should follow FineReport function definition rules.

©FanRuan Software Co., Ltd. 35 / 138
3.3.6. Aggregation Report
Some complex large reports display data in fragmented areas and involves many statistics and
indicators. It is difficult to produce such reports using conventional methods.
Based on the characteristics of complex large reports, FineReport introduces the function of
aggregation report. An aggregation report consists of several report blocks (which are called
aggregation blocks). The blocks are placed independently and the data inside can have
relationships.
©FanRuan Software Co., Ltd. 36 / 138
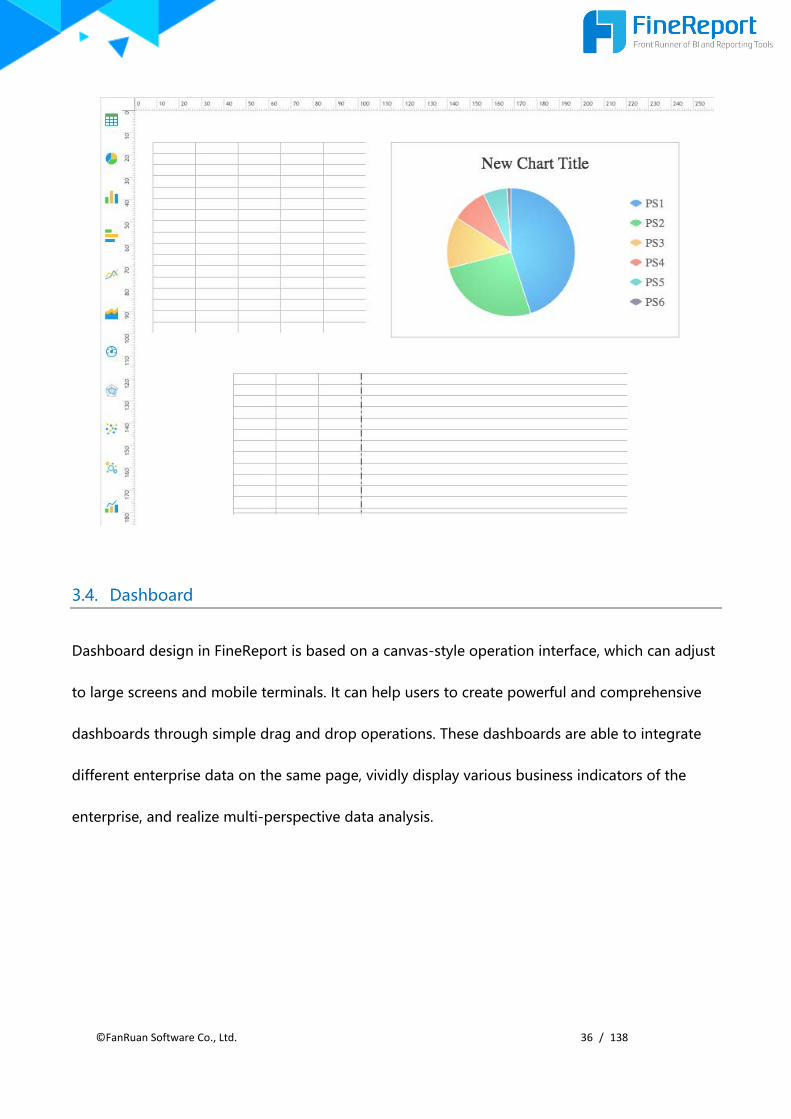
3.4. Dashboard
Dashboard design in FineReport is based on a canvas-style operation interface, which can adjust
to large screens and mobile terminals. It can help users to create powerful and comprehensive
dashboards through simple drag and drop operations. These dashboards are able to integrate
different enterprise data on the same page, vividly display various business indicators of the
enterprise, and realize multi-perspective data analysis.

©FanRuan Software Co., Ltd. 37 / 138
FineReport dashboards possess several advantages:
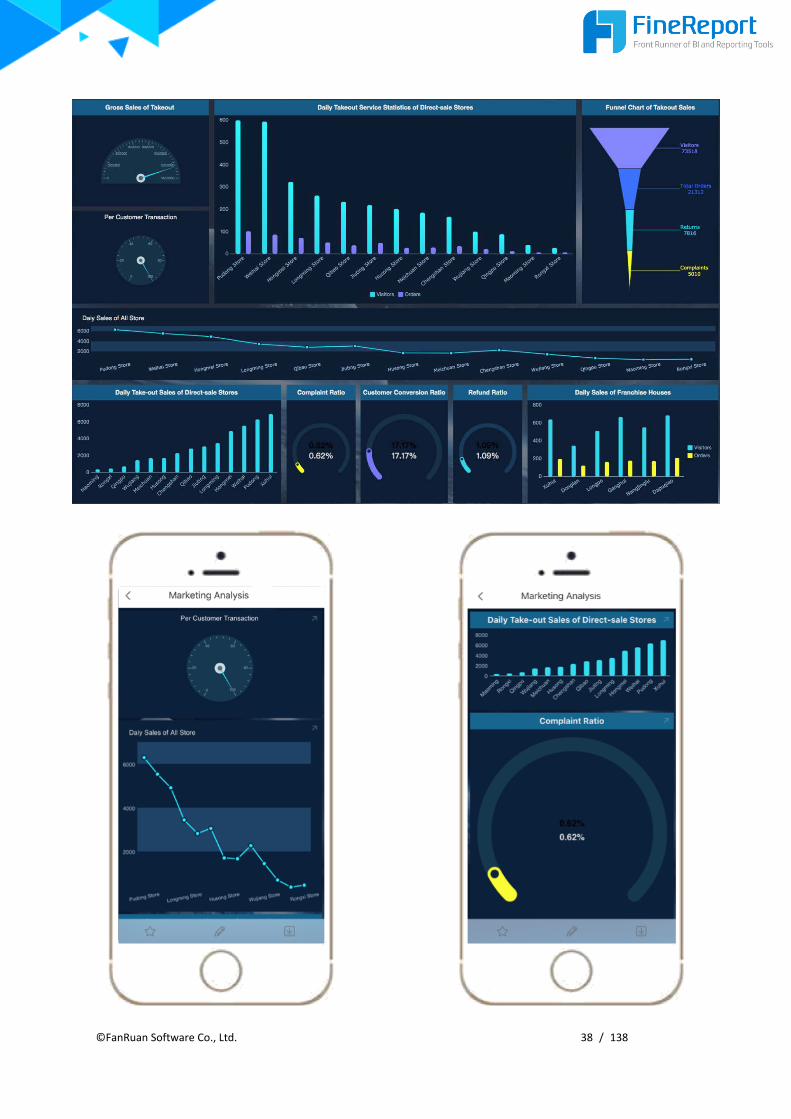
3.4.1. Multi-screen Adaptation
Support horizontal adaption and bi-directional adaption to screens. The dashboard template
only need to design once, and when being previewed, they can be adaptively displayed on PCs,
tablets, mobile phones, TVs and other terminal equipment.
©FanRuan Software Co., Ltd. 38 / 138
©FanRuan Software Co., Ltd. 39 / 138
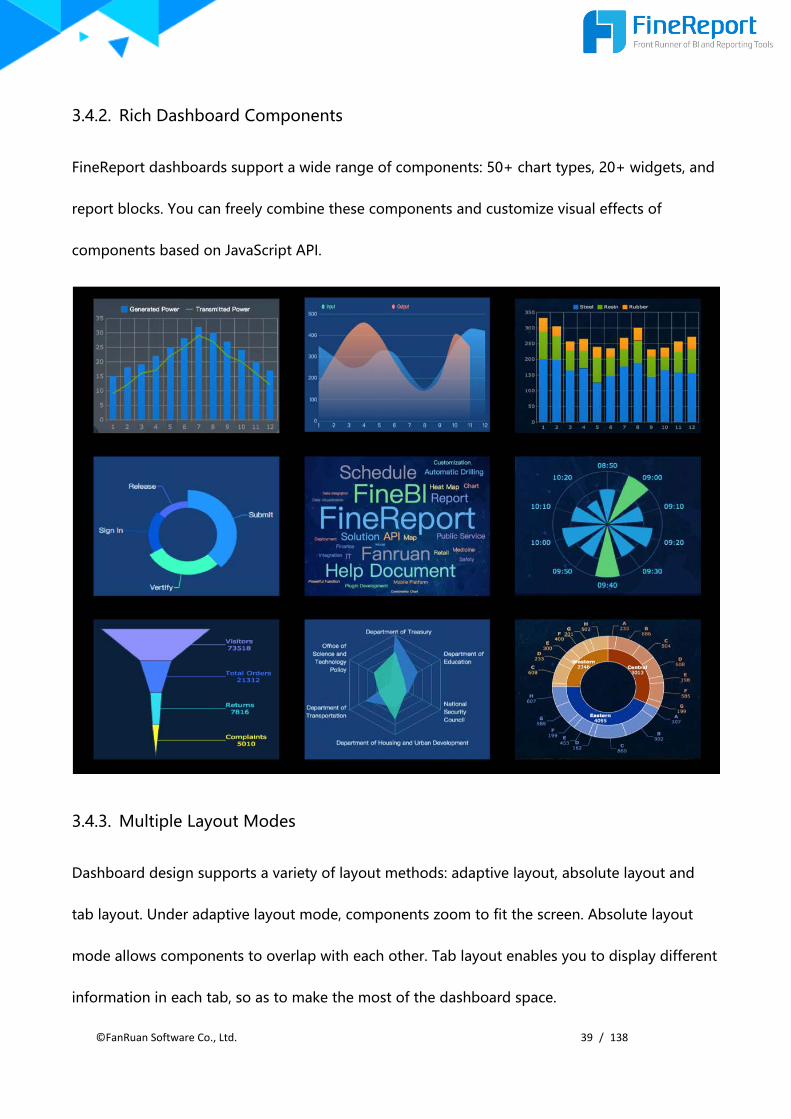
3.4.2. Rich Dashboard Components
FineReport dashboards support a wide range of components: 50+ chart types, 20+ widgets, and
report blocks. You can freely combine these components and customize visual effects of
components based on JavaScript API.
3.4.3. Multiple Layout Modes
Dashboard design supports a variety of layout methods: adaptive layout, absolute layout and
tab layout. Under adaptive layout mode, components zoom to fit the screen. Absolute layout
mode allows components to overlap with each other. Tab layout enables you to display different
information in each tab, so as to make the most of the dashboard space.
©FanRuan Software Co., Ltd. 40 / 138
3.4.4. Component Reuse
You can copy, cut, and paste any dashboard component and reuse them in the same or different
dashboard templates. The component reuse let users make good-looking reports more quickly.
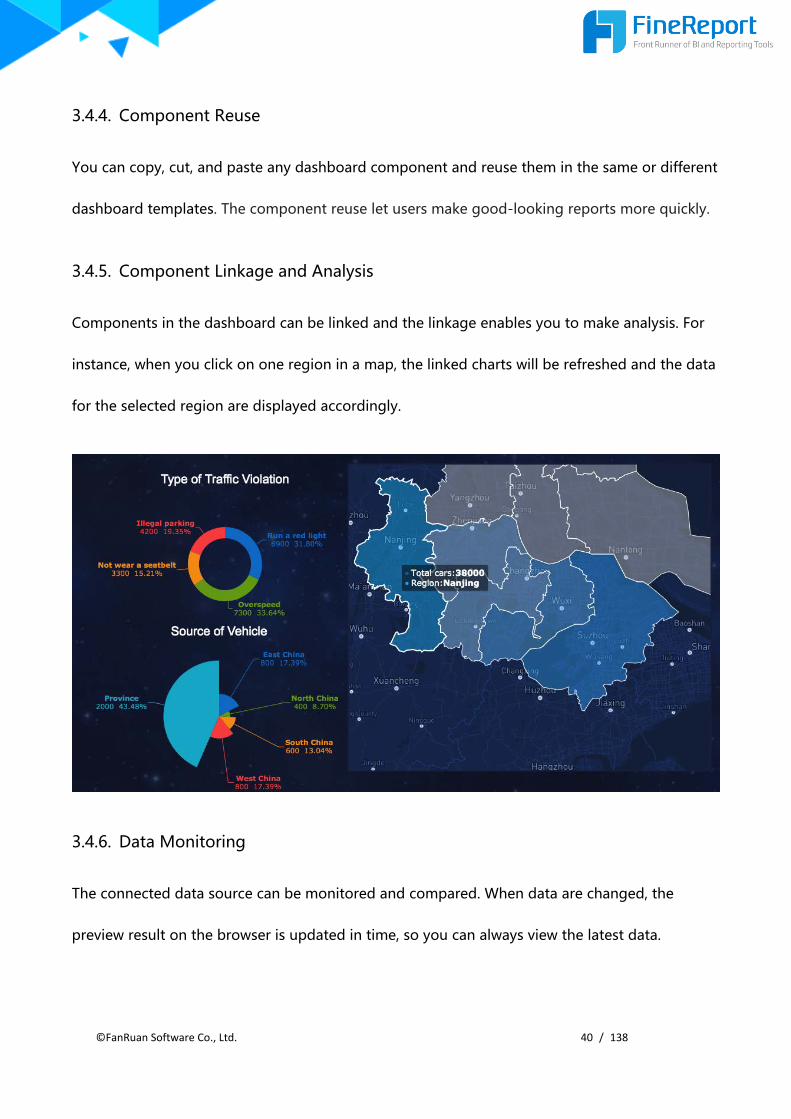
3.4.5. Component Linkage and Analysis
Components in the dashboard can be linked and the linkage enables you to make analysis. For
instance, when you click on one region in a map, the linked charts will be refreshed and the data
for the selected region are displayed accordingly.
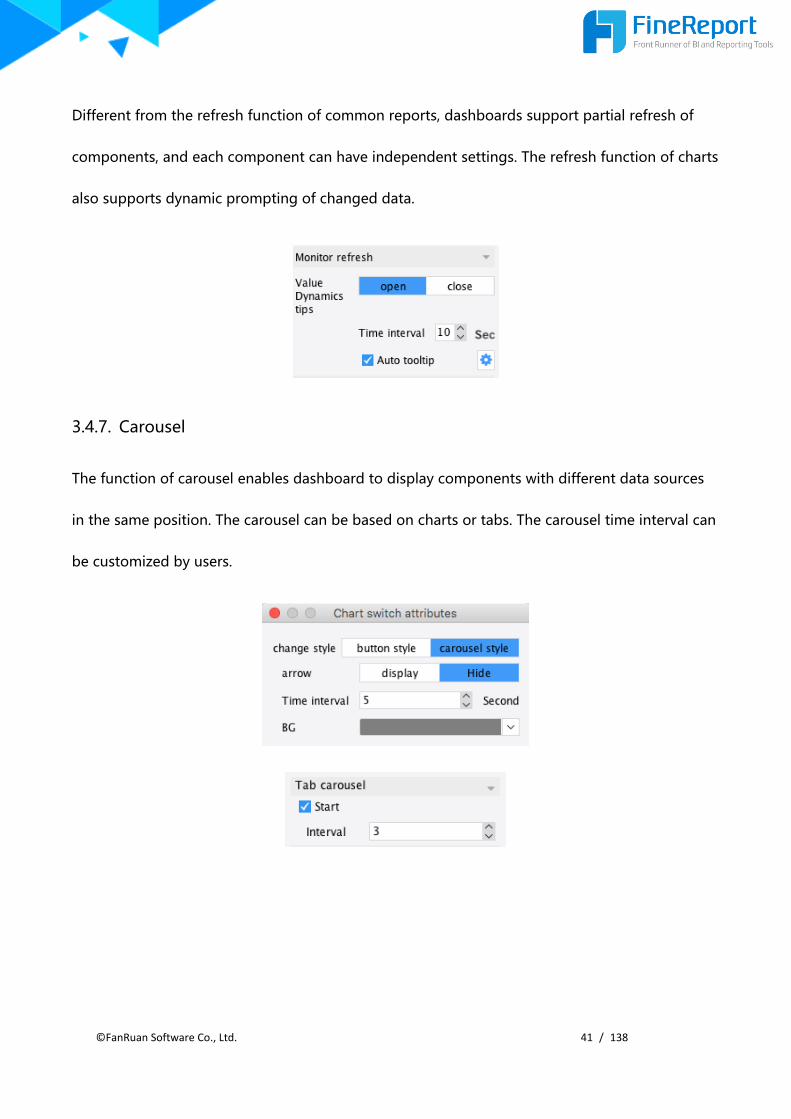
3.4.6. Data Monitoring
The connected data source can be monitored and compared. When data are changed, the
preview result on the browser is updated in time, so you can always view the latest data.
©FanRuan Software Co., Ltd. 41 / 138
Different from the refresh function of common reports, dashboards support partial refresh of
components, and each component can have independent settings. The refresh function of charts
also supports dynamic prompting of changed data.
3.4.7. Carousel
The function of carousel enables dashboard to display components with different data sources
in the same position. The carousel can be based on charts or tabs. The carousel time interval can
be customized by users.

©FanRuan Software Co., Ltd. 42 / 138
3.4.8. Large screen combined with hardware
FanRuan cooperates with top hardware manufacturers, so as to project FineReport dashboards
to various large-screen terminals, including all-in-one machines, smart TVs, spliced screens, LED
screen walls and so on.
3.5. Report Export and Printing
3.5.1. File Export
FineReport supports exporting files on the designer and on browsers.
Export format: PDF, Word, Excel, TXT, SVG and image format (PNG, JPG, BMP, etc.).
Export big data: Provide API for exporting big data in Excel format.
Output property setting: Control the export of hidden rows and hidden columns.
Support setting open passwords and edit passwords.
©FanRuan Software Co., Ltd. 43 / 138
3.5.2. No client Printing and Local Software Printing
“No Client Printing”is to call the printing function of the browser. Some browsers also support
silent print. This printing mode is lightweight and flexible.
"Local Software Printing" is realized by downloading the client locally and calling the local client.
You can configure printer, the number of copies, the page range, the layout style, the paper size,
and margins. You can save the settings to realize silent print without previewing.
Overall, the FineReport report printing solution has various advantages: precise pagination,
precise alignment, no footer/header interference, self-defined paper orientation and format,
continuous printing, and cross-browser printing.
3.5.3. Multiple printing options
The combination of no client printing and local software printing fulfills the application
requirements in usage scenarios . The supported printing options are listed as follows.
Print pre-printed forms: Support absolute positioning of invoice sets, check sets, etc.
Pagination: Force the sheet to paginate according to the number of rows or the number
of data groups; support duplicate headers, title/end rows, and title/end columns; fill
space with blank lines to ensure uniform printing format;
Zoom: When the template page size and printer page size does not match, you can set
a zoom ratio for the template to make it fit the printer page size.

©FanRuan Software Co., Ltd. 44 / 138
Silent printing: When you click the print button, the printer setting window does not
pop up and the printing task begins directly. This function is only supported by IE and
local software.
Offset: Different printers may print the same template differently; for instance, the
position of the content demonstrates an offset compared to the desired effect.
FineReport enables you to customize the offset of the printer so as to achieve the
desired printing effect.
Automatically select paper and orientation: The page settings of the template can be
passed to the printer, so the paper size and orientation can be identified automatically.
Print sheets from the same report template in different page sizes.
Bulk print: When there are a lot of templates to print and each template contains several
parameters, you can use JavaScript to call FineReport’s print method to print the
templates in batches.
3.6. Data Query and Filtering
In many cases, users want to enter condition values to query data and control the displayed
range of data. FineReport offers the definition of parameters and a parameter interface, so users
can control the content and the form of the report by inputting query conditions through the
interface.
©FanRuan Software Co., Ltd. 45 / 138
In addition to the parameters entered by users, some of the necessary parameters are
determined by the system environment, such as the username, role, current date and time of the
currently logged in user. These parameters allow you to perform flexible data analysis and their
values can be obtained through FineReport designer and system configuration.
The parameters supported in the FineReport report can be categorized into template parameters
and global parameters according to their scope of use. Global parameters can be used by all
templates under the current project application while template parameters is applicable only in
the current template. If considering the ways being used, parameters can be divided into
template parameters and dataset parameters. Dataset parameters are defined in SQL statements
and directly extract the data satisfying the condition. Differently, template parameters obtain the
required data by participating in filtering conditions after taking out all the data. When the data
amount is considerable, the usage of dataset parameters can improve the rendering efficiency of
the report.
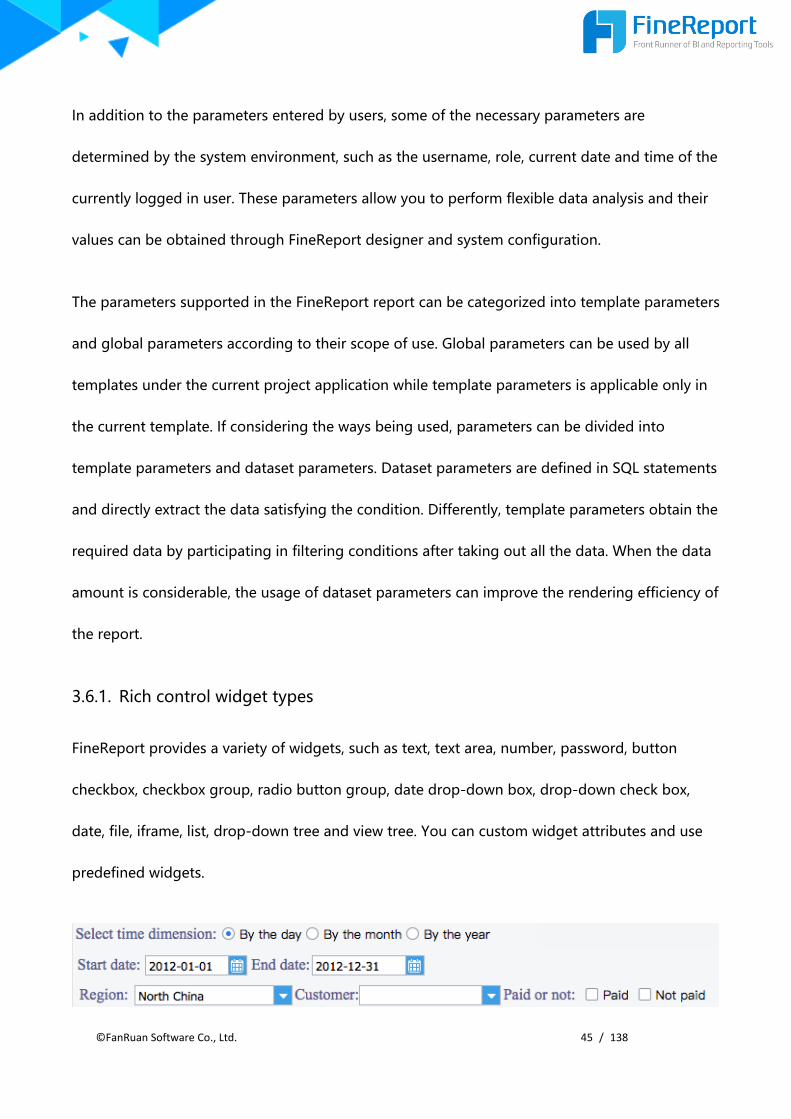
3.6.1. Rich control widget types
FineReport provides a variety of widgets, such as text, text area, number, password, button
checkbox, checkbox group, radio button group, date drop-down box, drop-down check box,
date, file, iframe, list, drop-down tree and view tree. You can custom widget attributes and use
predefined widgets.

©FanRuan Software Co., Ltd. 46 / 138
3.6.2. Flexible parameter interface
In order to allow users to quickly implement data query via parameters, FineReport provides a
parameter interface (a panel) to place widgets involved in data query. The user can design the
interface by simply dragging widgets. The parameter interface of FineReport is probably the best
in the industry.
Users can perform simple attribute setting on the parameter interface. The settable attributes
include whether to display the parameter interface, display the report content before clicking the
query button, the background of the parameter interface, and the display position of the
parameter interface.
3.6.3. Advanced functions of parameter query
Parameter linkage: The available values of the latter parameter will change according to
the former one. This function is often used for filtering queries with multiple levels; for
example, if “China” is the value of parameter country, the available values of the
parameter provinces are “Jiangsu, Shanghai, Anhui, Zhejiang”, etc. Similarly, if you
enter the United States for country, the available values for province are US states.

©FanRuan Software Co., Ltd. 47 / 138
Dynamic columns: In most cases, a report displays a table of data with fixed number of
columns. However, we may encounter situations where the columns of a dataset need
to be queried, and such effect is named dynamic columns. FineReport can achieve the
effect in two ways: one is through the use of functions, and the other is through the
definition of datasets.
Automatic query: The user can view the query result directly after inputting the
parameter values without clicking a query button.
Empty parameter values to show all: If users directly clicks the query button without
defining the values of some parameters, and the ordinary reporting tool may directly
prompt the SQL spelling error. FineReport can pre-set the parameter value to get all the
values.
Dynamic display parameter widgets: In many cases, some widgets only need to be
displayed when certain conditions are met. For instance, if select “annual report”, the
parameter interface will display the drop-down box with year options; similarly, if
select “monthly report”, it will display the drop-down box with year and month
options.
View different reports according to parameters: When querying data, the common
practice is to display- different data according to different parameter values; specifically,
the parameters control the data. Parameters in FineReport also allow users jump to
different reports according to parameter values.

©FanRuan Software Co., Ltd. 48 / 138
Record user's common parameter combination: User's most commonly used parameter
query combinations are stored and and be called directly at the next time. FineReport
also supports intelligent recommendation of common parameter combinations
according to user habits.
3.7. Chart
3.7.1. Advanced Chart Technology
The chart technology of enterprise reporting tools and business intelligence products often rely
on third-party charting widgets, such as FusionCharts and JFreeChart, but such approach has
natural defects: weak underlying functionalities, additional fees for advanced charts, weak
technical support and the lack of upgrade security.
FanRuan provides users with self-developed HTML5 charts, with advantages such as flexible
parameter passing and good interaction effects. It perfectly supports Android and iOS mobile
operating systems. A chart types support rich animation effects and have rich customizable
settings. In addition, FineReport provides a interface that enables users to introduce third-party
chart widgets according to their needs.

©FanRuan Software Co., Ltd. 49 / 138
3.7.2. Rich chart types and styles
Chart types supported in FineReport: pie, column, bar, line, area, gauge, radar, scatter, bubble,
combination, multilevel pie, map, drill map, rectangular treemap, funnel, heatmap, word cloud,
gantt, structure map.Each class is subdivided into various sub-types; for instance, column chart
includes stacked column chart and percentage stacked column chart.
FineReport includes a "Extended Chart" type in version 10.0, which supports 3D rotating GIS point
maps, particle counters, carousel KPI or cards, time gears and other cool 3D chart types to meet
the display needs of large screens in different scenarios..

©FanRuan Software Co., Ltd. 50 / 138
FineReport supports DIY chart . Users can freely modify the axis, data table, icon layout and style
settings, chart title, legend, series settings and other attributes to make the chart more beautiful.
FineReport supports inserting a chart into a cell or inserting a floating chart on the report body
for arbitrary movement. Charts inserted into cells can inherit properties of parent-child relation
and cell expansion. properties.

©FanRuan Software Co., Ltd. 51 / 138
The data source of FineReport can be defined in two ways. One is to use datasets as the data
sourceIt is applicable when only the chart is needed and the data themselves are not required to
be displayed. The other is to use cell data as the data source, and this is suitable for displaying
both the raw data and charts in the same report.
3.7.3. Diverse chart interaction effects
Rich chart interactions help users read data conveniently and greatly enhance the user
experience. FineReport charts support the following interaction effects.
Tooltip: When the mouse moves to a data point in the chart, the coordinate value and
other information of the data point is displayed.
©FanRuan Software Co., Ltd. 52 / 138
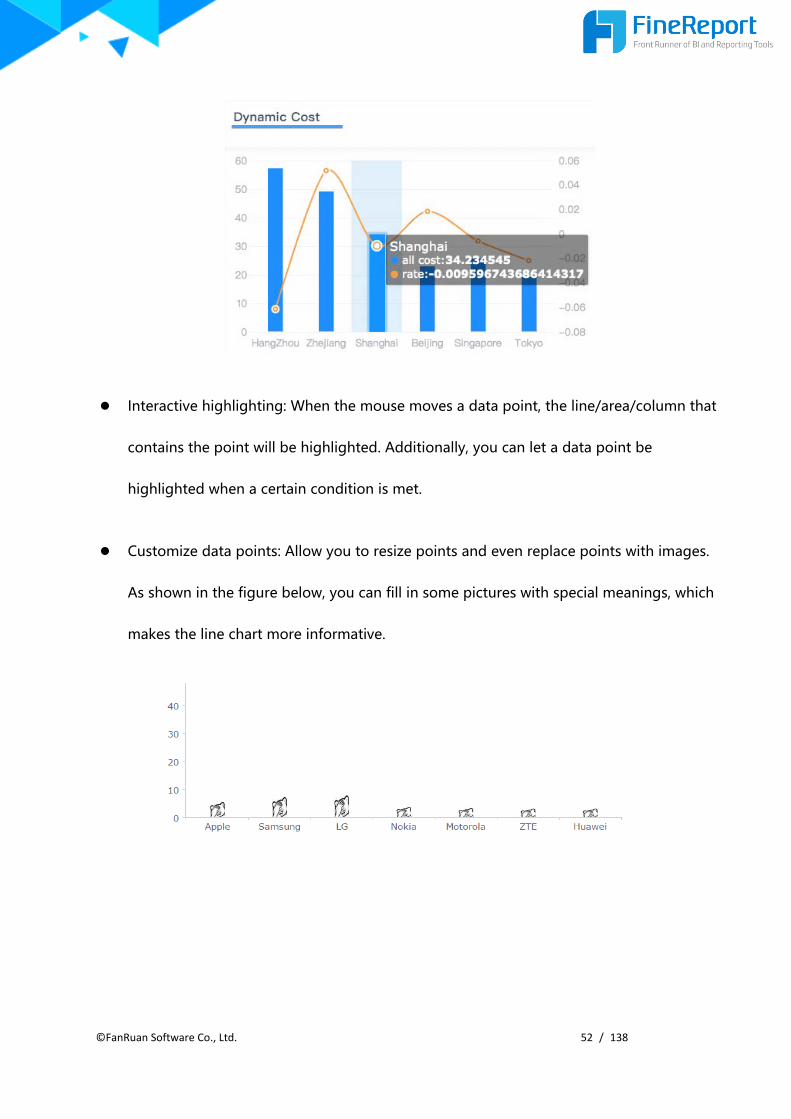
Interactive highlighting: When the mouse moves a data point, the line/area/column that
contains the point will be highlighted. Additionally, you can let a data point be
highlighted when a certain condition is met.
Customize data points: Allow you to resize points and even replace points with images.
As shown in the figure below, you can fill in some pictures with special meanings, which
makes the line chart more informative.
©FanRuan Software Co., Ltd. 53 / 138
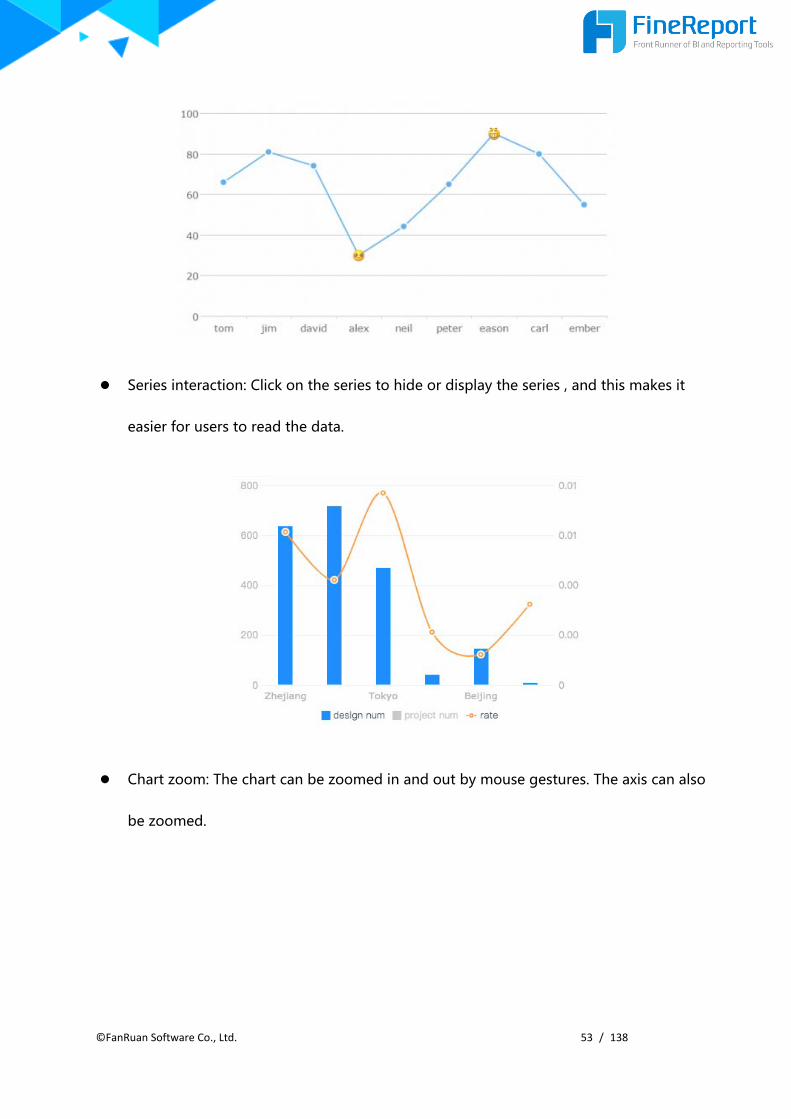
Series interaction: Click on the series to hide or display the series , and this makes it
easier for users to read the data.
Chart zoom: The chart can be zoomed in and out by mouse gestures. The axis can also
be zoomed.
©FanRuan Software Co., Ltd. 54 / 138
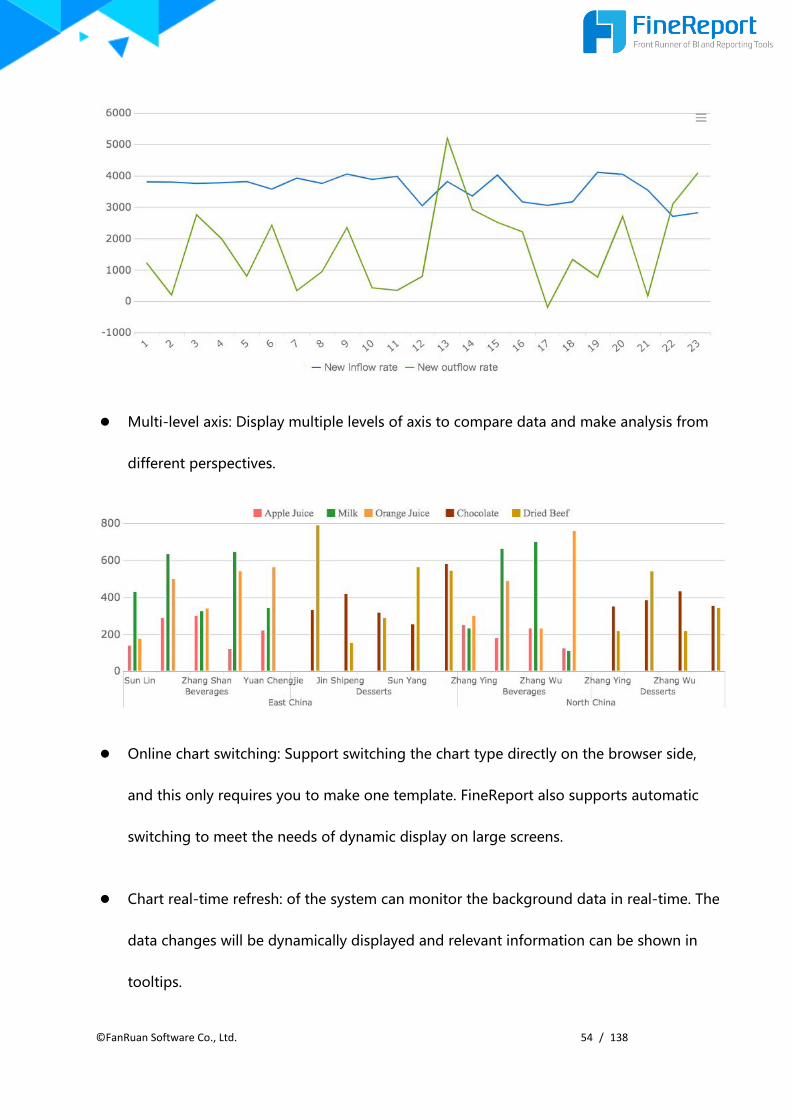
Multi-level axis: Display multiple levels of axis to compare data and make analysis from
different perspectives.
Online chart switching: Support switching the chart type directly on the browser side,
and this only requires you to make one template. FineReport also supports automatic
switching to meet the needs of dynamic display on large screens.
Chart real-time refresh: of the system can monitor the background data in real-time. The
data changes will be dynamically displayed and relevant information can be shown in
tooltips.

©FanRuan Software Co., Ltd. 55 / 138
● Flashing: Highlight certain points that meet pre-defined conditiosn.
● The browser side supports interactive operations such as sorting, saving, and full screen
display.
3.7.4. Rich customizable settings
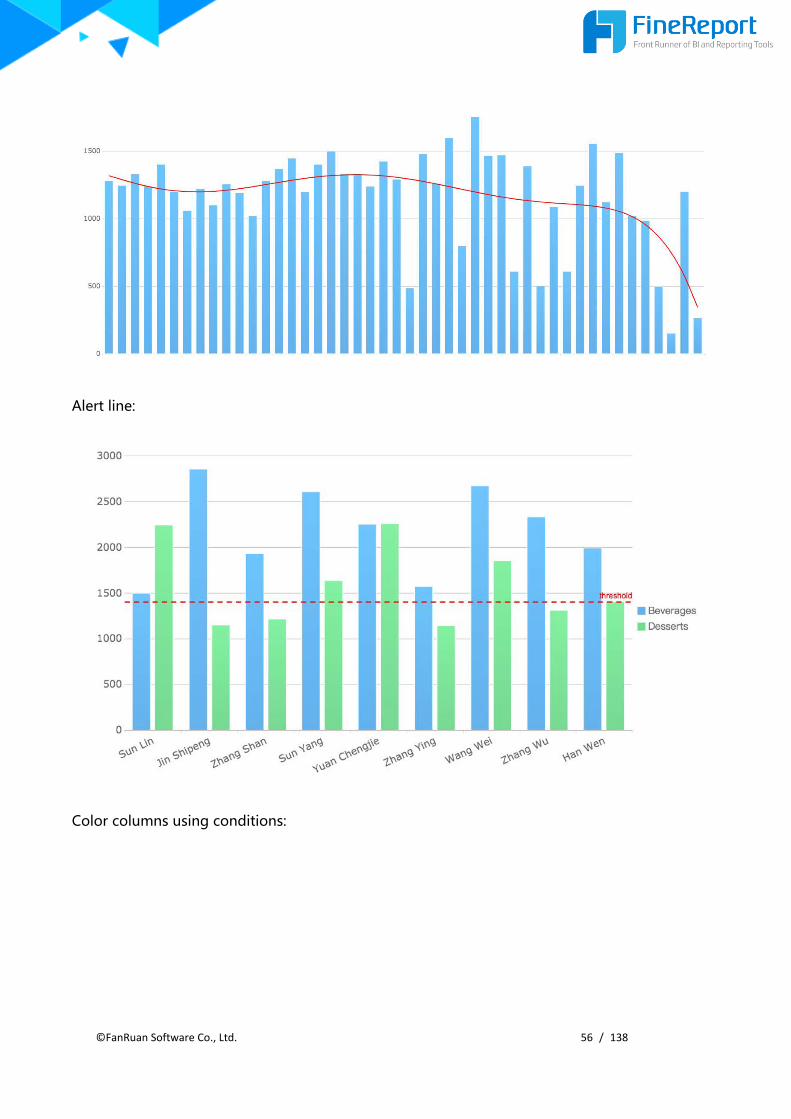
Trendline:
©FanRuan Software Co., Ltd. 56 / 138
Alert line:
Color columns using conditions:

©FanRuan Software Co., Ltd. 57 / 138
Order of axis labels:
Image as label:

©FanRuan Software Co., Ltd. 58 / 138
Stacked column chart:
Plot background:

©FanRuan Software Co., Ltd. 59 / 138
Image as data point:
3.7.5. Chart drill-down
As shown in the chart below, the map will zoom to a province to show the detailed information
after you click on the province. You can view city-level data if you click one of the cities..
©FanRuan Software Co., Ltd. 60 / 138
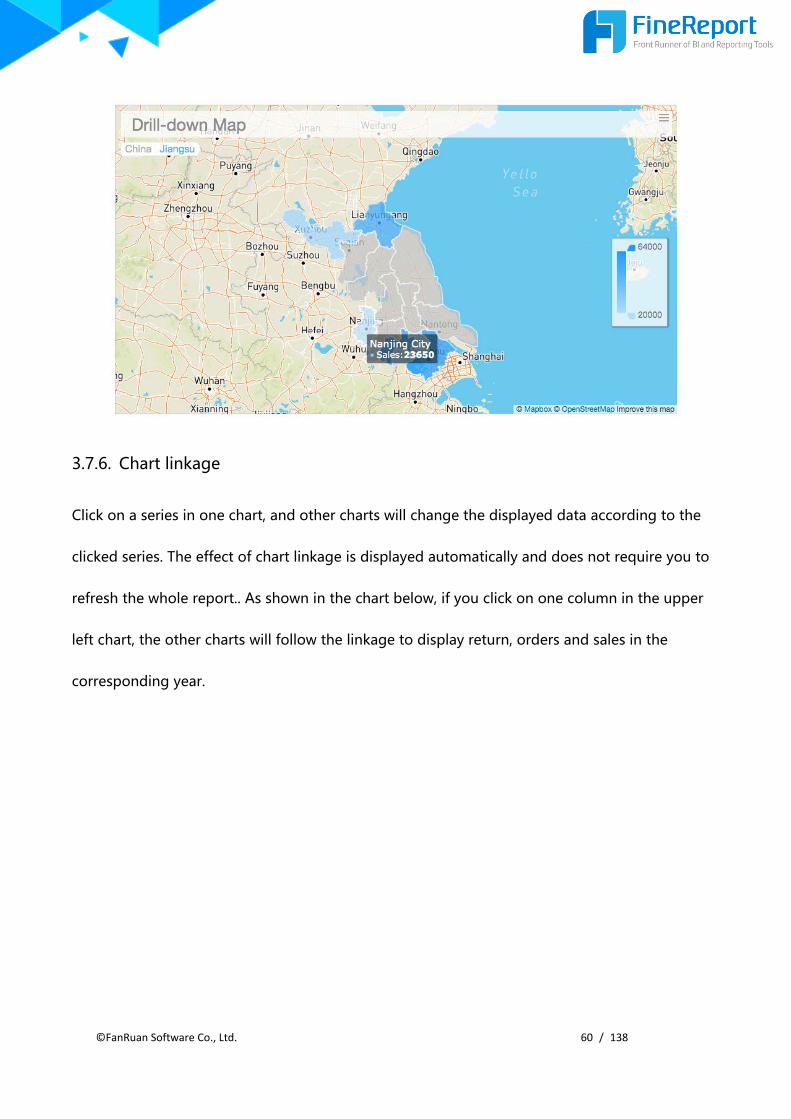
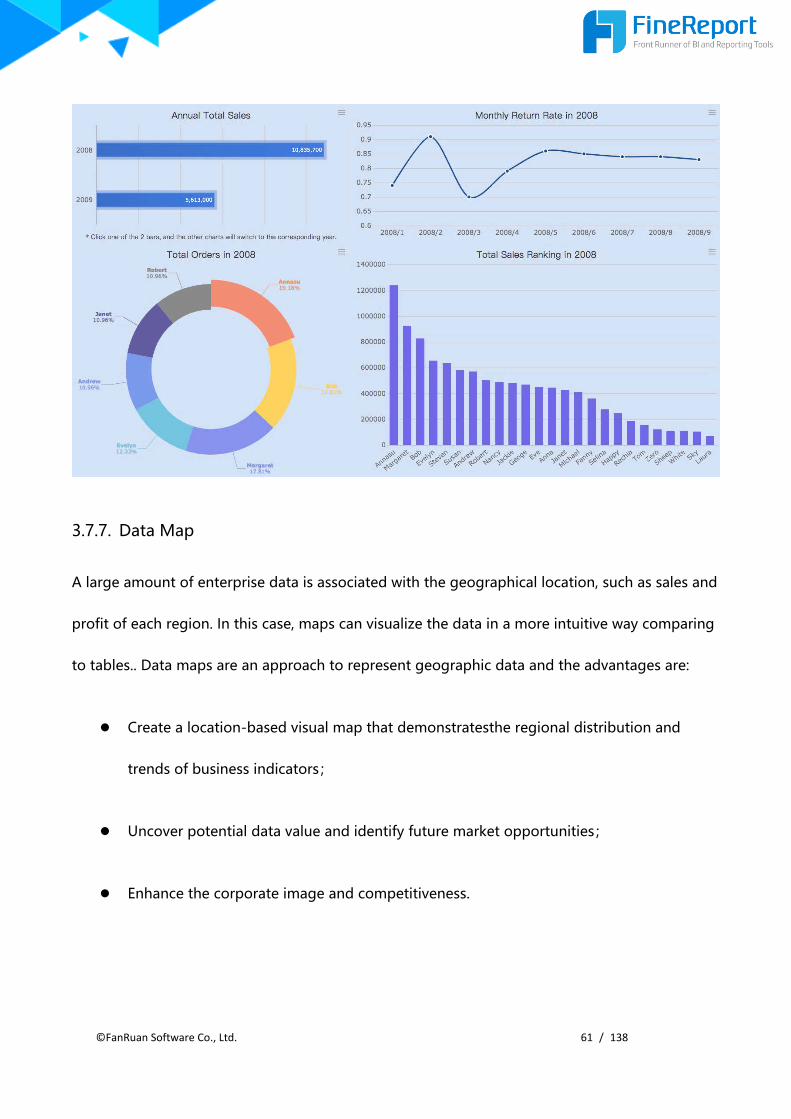
3.7.6. Chart linkage
Click on a series in one chart, and other charts will change the displayed data according to the
clicked series. The effect of chart linkage is displayed automatically and does not require you to
refresh the whole report.. As shown in the chart below, if you click on one column in the upper
left chart, the other charts will follow the linkage to display return, orders and sales in the
corresponding year.
©FanRuan Software Co., Ltd. 61 / 138
3.7.7. Data Map
A large amount of enterprise data is associated with the geographical location, such as sales and
profit of each region. In this case, maps can visualize the data in a more intuitive way comparing
to tables.. Data maps are an approach to represent geographic data and the advantages are:
Create a location-based visual map that demonstratesthe regional distribution and
trends of business indicators;
Uncover potential data value and identify future market opportunities;
Enhance the corporate image and competitiveness.
©FanRuan Software Co., Ltd. 62 / 138
FineReport’s data map function presents business data in a new and different way than
traditional tables. It is an advanced means of business analysis and can provide enterprises with
a lot of visual information.
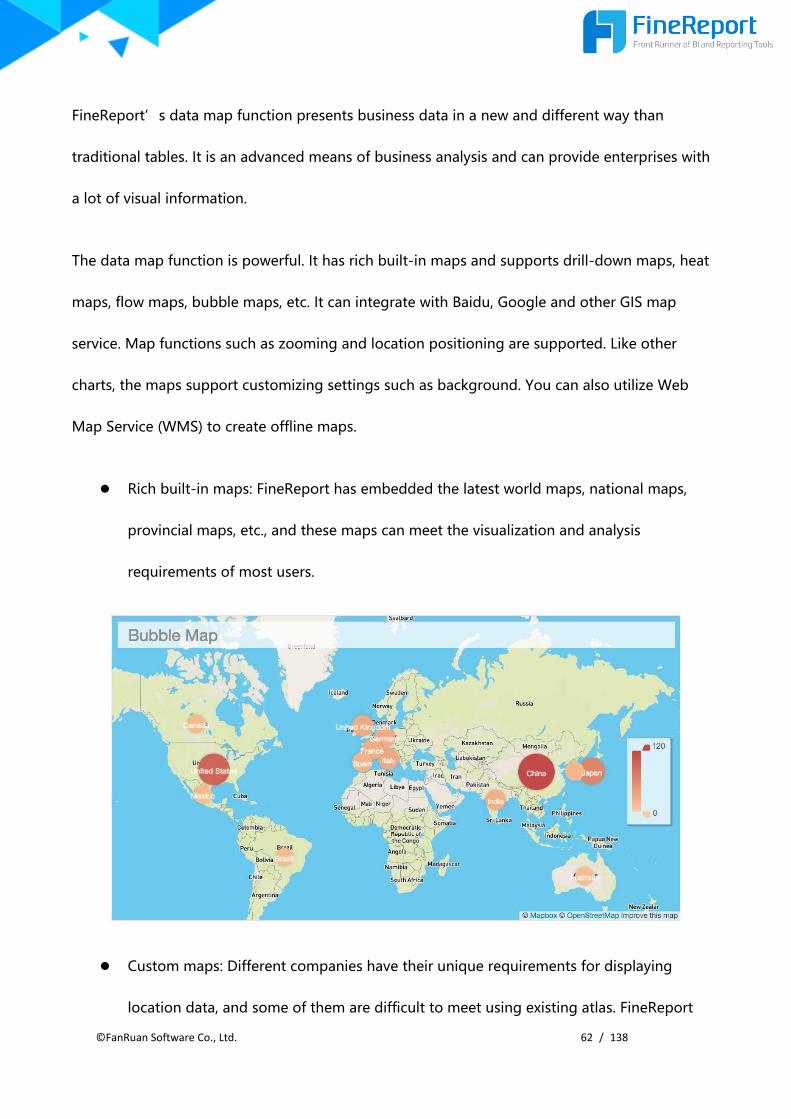
The data map function is powerful. It has rich built-in maps and supports drill-down maps, heat
maps, flow maps, bubble maps, etc. It can integrate with Baidu, Google and other GIS map
service. Map functions such as zooming and location positioning are supported. Like other
charts, the maps support customizing settings such as background. You can also utilize Web
Map Service (WMS) to create offline maps.
Rich built-in maps: FineReport has embedded the latest world maps, national maps,
provincial maps, etc., and these maps can meet the visualization and analysis
requirements of most users.
Custom maps: Different companies have their unique requirements for displaying
location data, and some of them are difficult to meet using existing atlas. FineReport
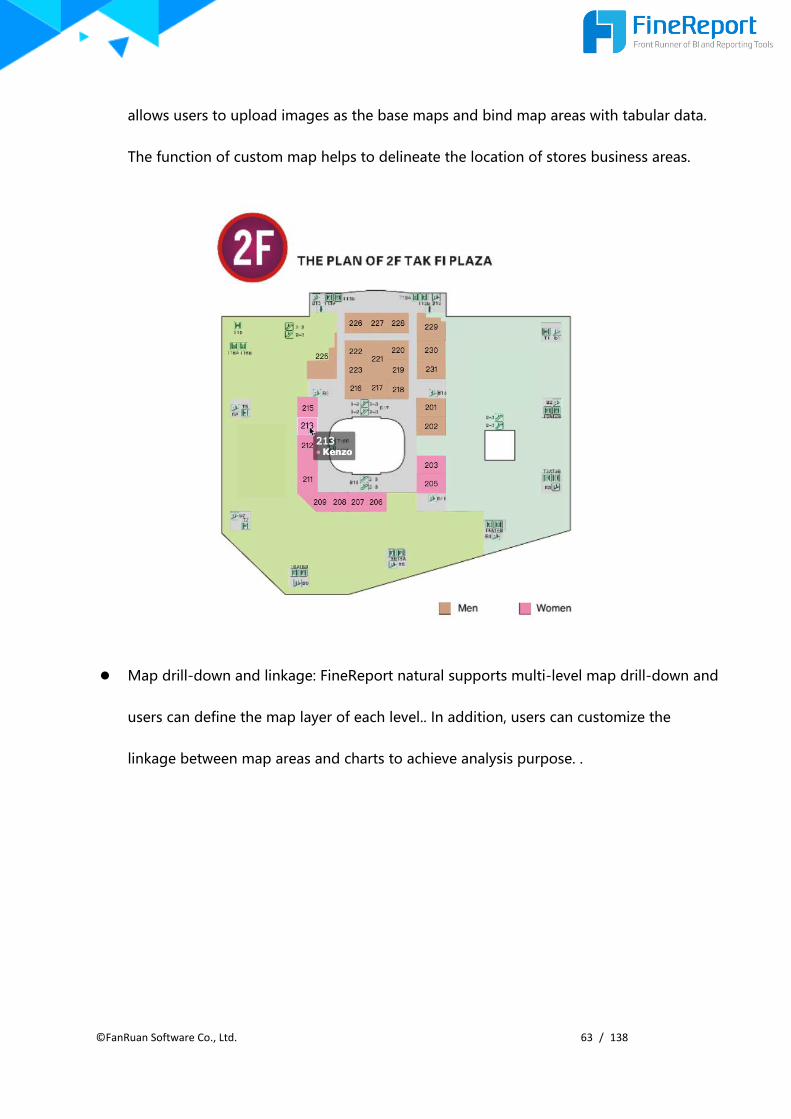
©FanRuan Software Co., Ltd. 63 / 138
allows users to upload images as the base maps and bind map areas with tabular data.
The function of custom map helps to delineate the location of stores business areas.
Map drill-down and linkage: FineReport natural supports multi-level map drill-down and
users can define the map layer of each level.. In addition, users can customize the
linkage between map areas and charts to achieve analysis purpose. .

©FanRuan Software Co., Ltd. 64 / 138
Heat map: The intensity/hue represents the data value and users can view the changes
and distribution of data points intuitively.
GIS map: FineReport can integrate GIS maps (e.g. Mapbox) to realize map zooming,
position positioning, and drilling.
©FanRuan Software Co., Ltd. 65 / 138
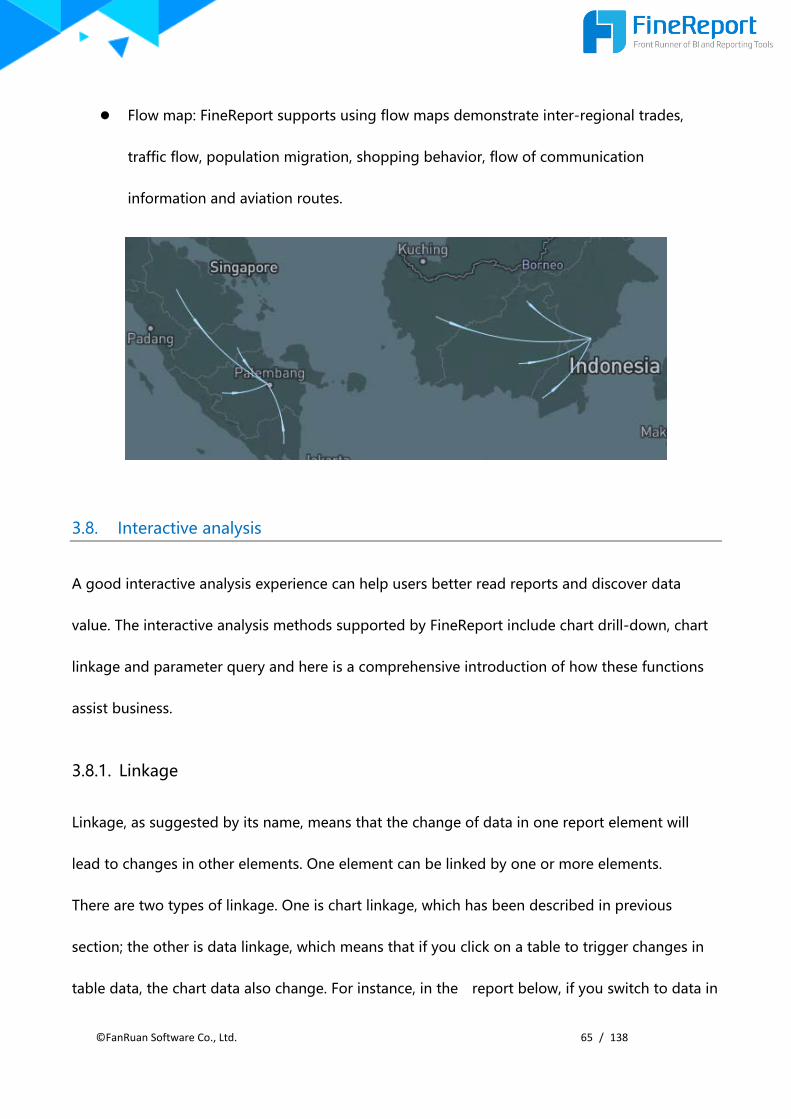
Flow map: FineReport supports using flow maps demonstrate inter-regional trades,
traffic flow, population migration, shopping behavior, flow of communication
information and aviation routes.
3.8. Interactive analysis
A good interactive analysis experience can help users better read reports and discover data
value. The interactive analysis methods supported by FineReport include chart drill-down, chart
linkage and parameter query and here is a comprehensive introduction of how these functions
assist business.
3.8.1. Linkage
Linkage, as suggested by its name, means that the change of data in one report element will
lead to changes in other elements. One element can be linked by one or more elements.
There are two types of linkage. One is chart linkage, which has been described in previous
section; the other is data linkage, which means that if you click on a table to trigger changes in
table data, the chart data also change. For instance, in the report below, if you switch to data in
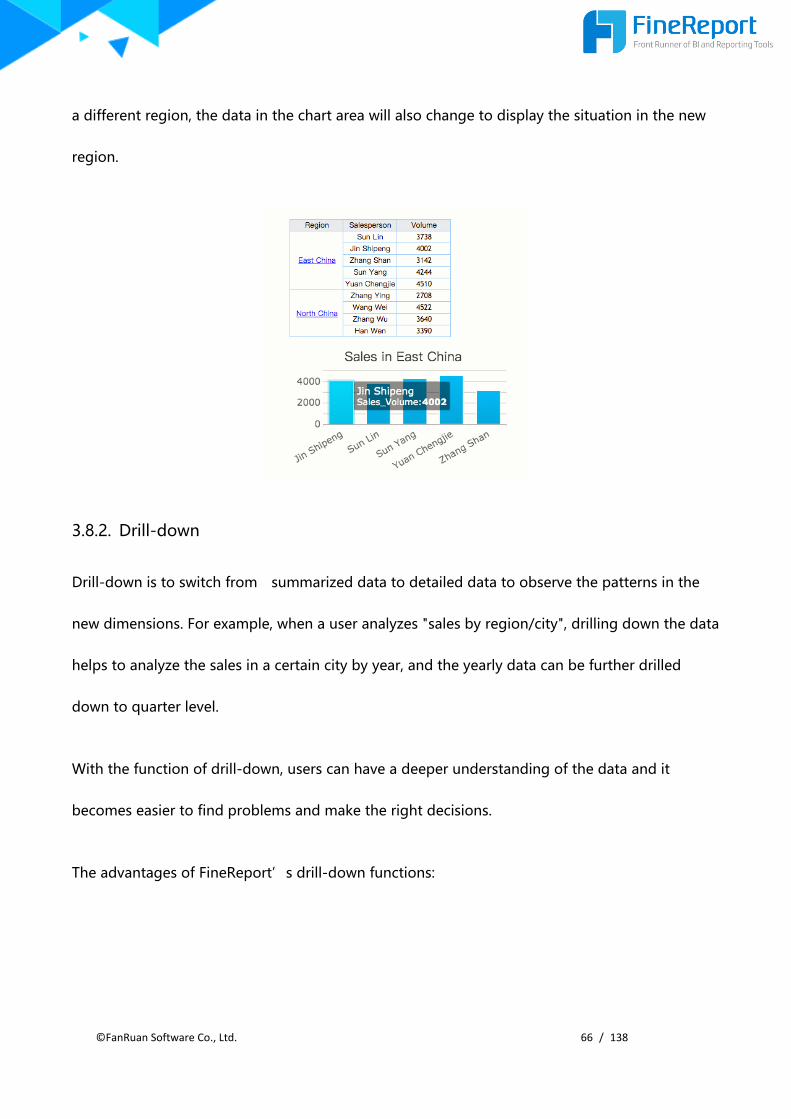
©FanRuan Software Co., Ltd. 66 / 138
a different region, the data in the chart area will also change to display the situation in the new
region.
3.8.2. Drill-down
Drill-down is to switch from summarized data to detailed data to observe the patterns in the
new dimensions. For example, when a user analyzes "sales by region/city", drilling down the data
helps to analyze the sales in a certain city by year, and the yearly data can be further drilled
down to quarter level.
With the function of drill-down, users can have a deeper understanding of the data and it
becomes easier to find problems and make the right decisions.
The advantages of FineReport’s drill-down functions:

©FanRuan Software Co., Ltd. 67 / 138
Multi-dimentional drill-down: You can drill-down from one record to different
dimensions. As shown in the figure below, click on one order number, and you can
choose to drill down to view order details or logistics information.
Drill-down combinations: Charts can be drilled down to charts, tables. Similarly, tables
can be drilled to tables and charts. Therefore, the drill-down relationship includes chart-
chart, chart-table and table-table.
Infinite drill-down levels: Users can set infinite drill-down levels. .
3.8.3. Multi-perspective data analysis
Multi-perspective data analysis is a comprehensive application, which is realized by the functions
of dashboard, chart, parameter query, drill-down and linkage
3.8.4. Real-time data analysis
The usual data analysis is based on logical data layer for filtering analysis, but in this way, the
data on the current page cannot be directly used for in-depth analysis.

©FanRuan Software Co., Ltd. 68 / 138
In order to realize convenient analysis in real time, FineReport provides the function of
secondary analysis which enables you to sort and filter data on current page.
3.9. Data Entry
Traditionally, reports are responsible for data visualization. CRM, ERP, OA and other basic
information systems will contain some pages for business personnel or users to add, modify,
delete and perform other operations with report data, and the changes will later be used to
update the database. Such a page is called a form. In FineReport, the function of data entry is
designed specially to design forms.
FineReport’s data entry is powerful enough to meet enterprise requirements.
Multi-source data entry: The data in one report can connect to multiple different
databases or data tables.
Independent data input and output:The form data can be retrieved from one database
and the editing result can be submitted to another database or several different
databases. The source and destination of the data can be completely independent.

©FanRuan Software Co., Ltd. 69 / 138
Irregular layout: For the financial, service, medical and other industries, the data entry
interface tend to have irregular layout and diversified editing styles.
Row-based form: If you need to add, delete, and modify the data from database tables,
you can create row-based forms to simulate the table structure.

©FanRuan Software Co., Ltd. 70 / 138
Form pagination: When data volume is large, the loading speed will be limited by the
performance of the browser. FineReport supports display form data in pages to ensure
user experience.
3.9.1. Diverse reporting style
To use the input data to update the database, the data should be contained in widgets which
will interact. FineReport provides a variety of widgets to realize different data entry
requirements.
Data entry widgets include text, text area, number, password, button, checkbox, radio group,
checkbox group, drop-down box, drop-down checkbox, date, file, list, iframe, drop-down tree
and view tree.
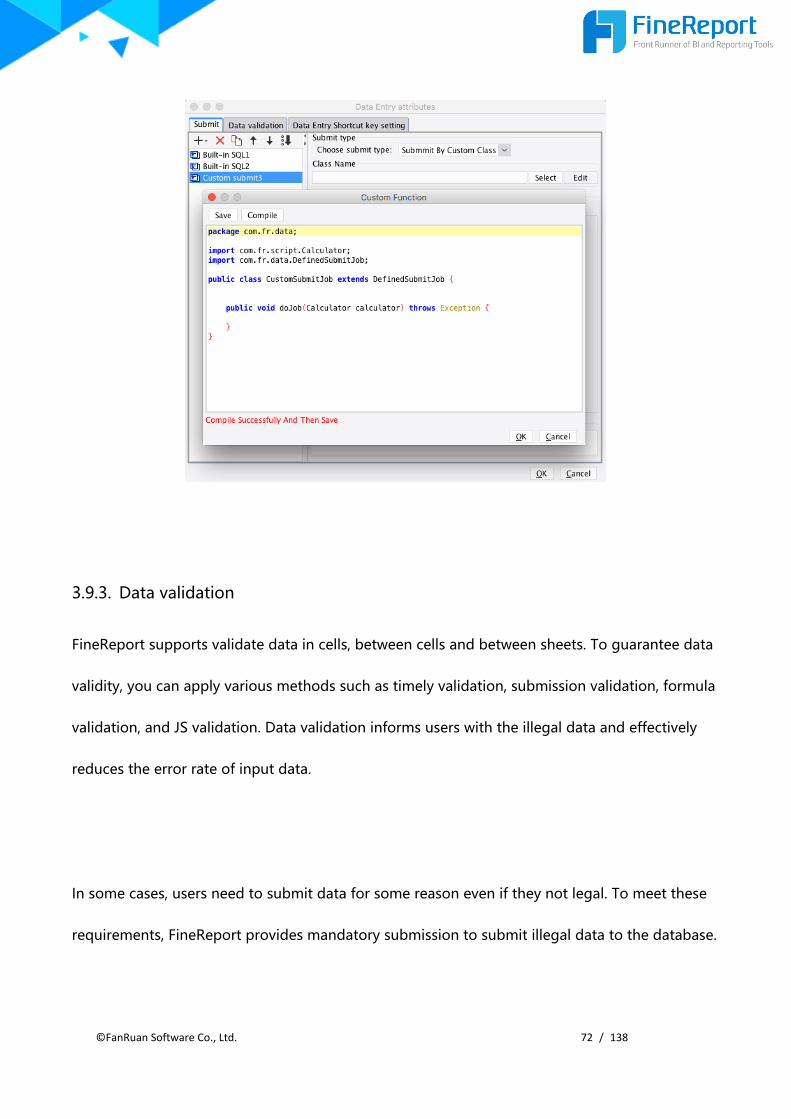
3.9.2. Submission control
FineReport supports multiple submission methods such as smart submission, insert submission,
update submission and delete submission. You can also set to prohibit submission if certain cells
are not edited. In order to make the process of form design easier, FineReport provides
functions to smart add fields and smart add cells (groups).

©FanRuan Software Co., Ltd. 71 / 138
By setting submission conditions, you can filter the submitted data. Specifically, when data are
submitted to database, they are judged by conditions and only those meet the condition can be
submitted to the database.
Custom submission control via Java API is also supported.
©FanRuan Software Co., Ltd. 72 / 138
3.9.3. Data validation
FineReport supports validate data in cells, between cells and between sheets. To guarantee data
validity, you can apply various methods such as timely validation, submission validation, formula
validation, and JS validation. Data validation informs users with the illegal data and effectively
reduces the error rate of input data.
In some cases, users need to submit data for some reason even if they not legal. To meet these
requirements, FineReport provides mandatory submission to submit illegal data to the database.

©FanRuan Software Co., Ltd. 73 / 138
3.9.4. Multi-level reporting
In most cases, after a form is reported, the data directly enter the database. However, in
enterprises, after staff enter data, it is necessary to let higher-level managers to process and
verify the data and only those pass the review can enter the database. This workflow is called
multi-level reporting.
The function of multi-level reporting supports multiple styles of workflow and allows users to
enter data via emails, system messages, etc. It also supports process control such as setting time
limits on user submission and scheduling of managers’ review tasks.
Simple reporting: Tasks flow from lower levels to higher levels. The process resembles a
straight line.
Joint data entry and reporting: During the process of the task flow, some nodes are
forked, and multiple users can participate in the task on one node.

©FanRuan Software Co., Ltd. 74 / 138
Distributed and level-by-level reporting: It means that during the process of the task
flow, the users responsible for one node can create a sub workflow. When the sub
workflow is completed, the task returns to the start node and the main workflow
continues.
3.9.5. Data temporary storage
In some forms, there are a lot of content to fill, and this takes users a long time. During this
process, there might exists unexpected situations such as mis-operation, network interruption,

©FanRuan Software Co., Ltd. 75 / 138
server problems, etc., and they may lead to loss of data. In addition, there are times when the
content is still up in the air and users want to rethink before submission. In this case, the data
should not enter the database directly and users may hope to temporarily store the entered
data. To solve the problems, FineReport provides a function of stash to realize temporary
storage of data.
As shown in the figure below, business personnel can temporarily store and clear the entered
data by clicking corresponding buttons. The temporarily stored data are saved in the built-in
hsql database. After submitting the data, the stashed data will be cleared automatically.
Sometimes, users may forget to click the stash button, so the function of automatic stash is
provided. After turning on the function, the entered data will be saved automatically and will be
cleared after being submitted.

©FanRuan Software Co., Ltd. 76 / 138
3.9.6. Multi-sheet data entry
Similar to Excel, a report template can contain multiple sheets of form, and this enables users to
edit multiple forms at the same time and print the forms in batches. The settings of each form
are determined separately, and users can decide to submit one form or all forms at a time.

©FanRuan Software Co., Ltd. 77 / 138
In a report with multiple sheets, users can implement cross-sheet calculation which means the
calculation in one sheet can reference cell values in another sheet. In addition, data validation
can take place across sheets.
3.9.7. Excel data import
Currently, most business personnel are familiar with the operations in Excel. FineReport supports
exporting forms as Excel files and users can enter data locally. Afterwards, the Excel file can be
imported to the corresponding form.
The match between the Excel file and the form is a major concern. FineReport has two types of
matching logic: matching by title or position matching, so the function of Excel data import
supports importing different styles of report including row-based reports and irregular reports.
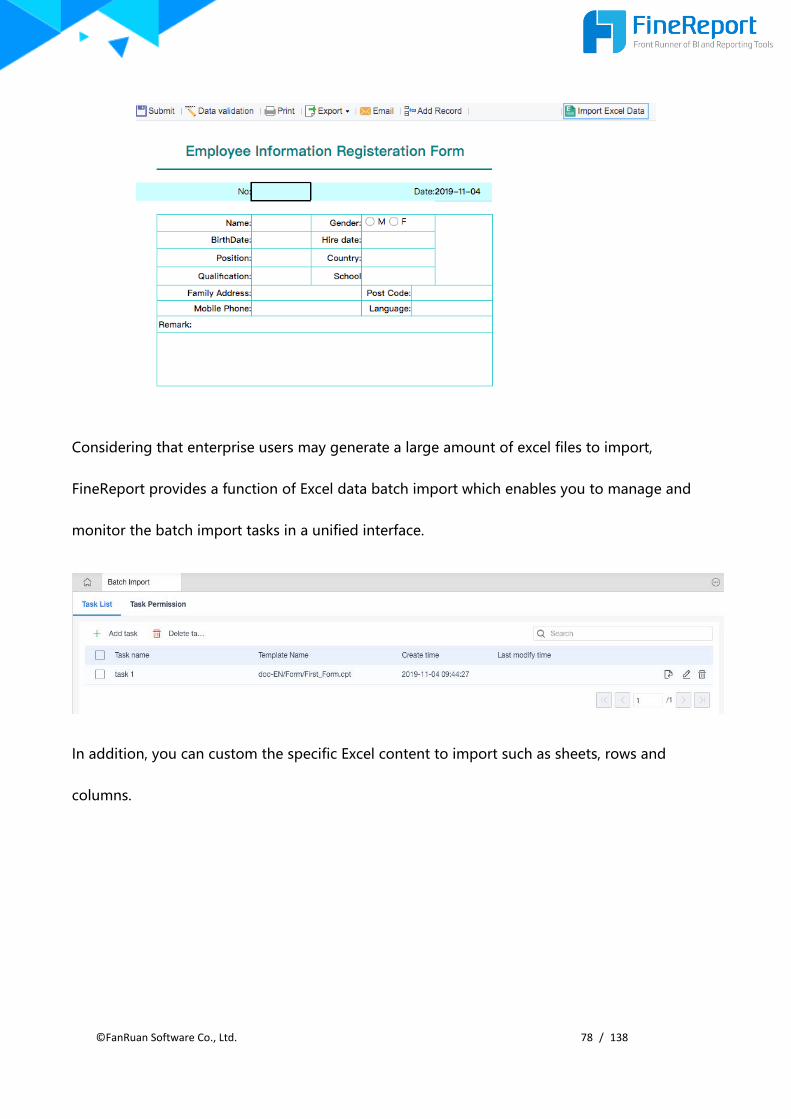
©FanRuan Software Co., Ltd. 78 / 138
Considering that enterprise users may generate a large amount of excel files to import,
FineReport provides a function of Excel data batch import which enables you to manage and
monitor the batch import tasks in a unified interface.
In addition, you can custom the specific Excel content to import such as sheets, rows and
columns.
©FanRuan Software Co., Ltd. 79 / 138
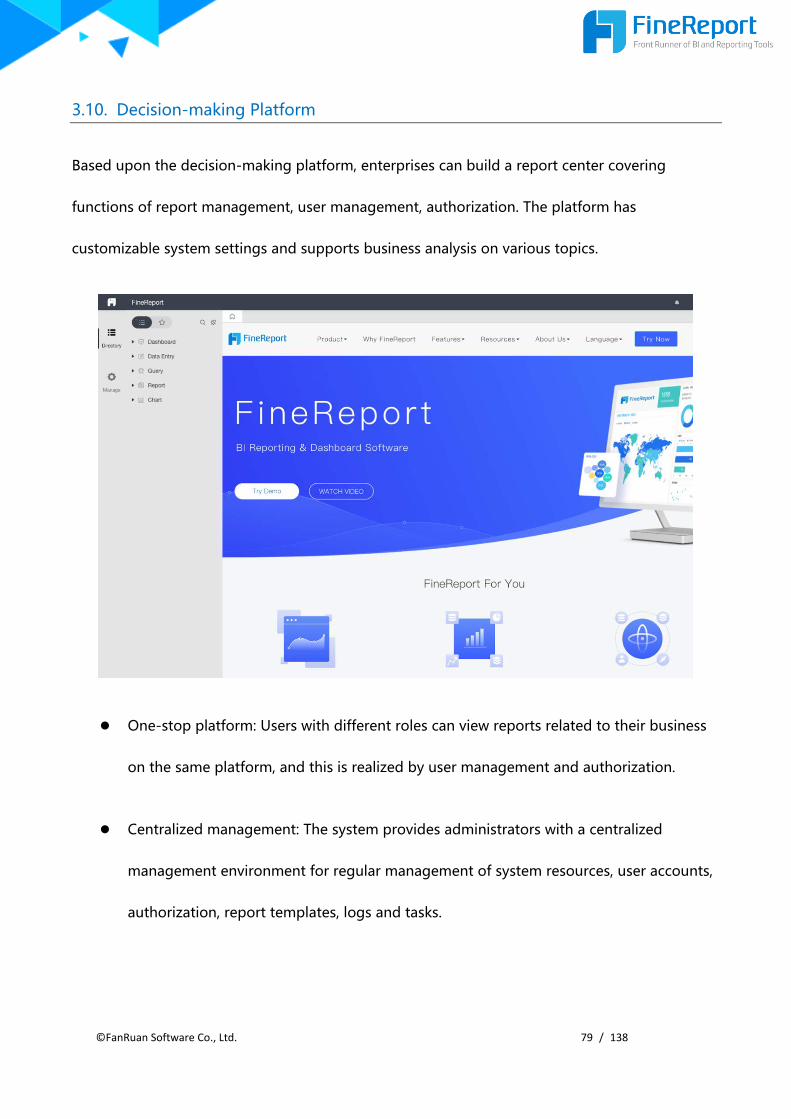
3.10. Decision-making Platform
Based upon the decision-making platform, enterprises can build a report center covering
functions of report management, user management, authorization. The platform has
customizable system settings and supports business analysis on various topics.
One-stop platform: Users with different roles can view reports related to their business
on the same platform, and this is realized by user management and authorization.
Centralized management: The system provides administrators with a centralized
management environment for regular management of system resources, user accounts,
authorization, report templates, logs and tasks.
©FanRuan Software Co., Ltd. 80 / 138
3.10.1. Directory Management
Directory management: To add, delete and modify the directory tree of the platform,
and the directory can be freely adjusted.
Node Management: Administrators or other authorized users can edit the content to be
displayed on each directory node, and the content can be report templates, URL links, or
multi-level reporting processes. The edit includes setting the preview mode of the
report, display terminal and report parameters.
Support sorting directories and nodes by dragging operations.
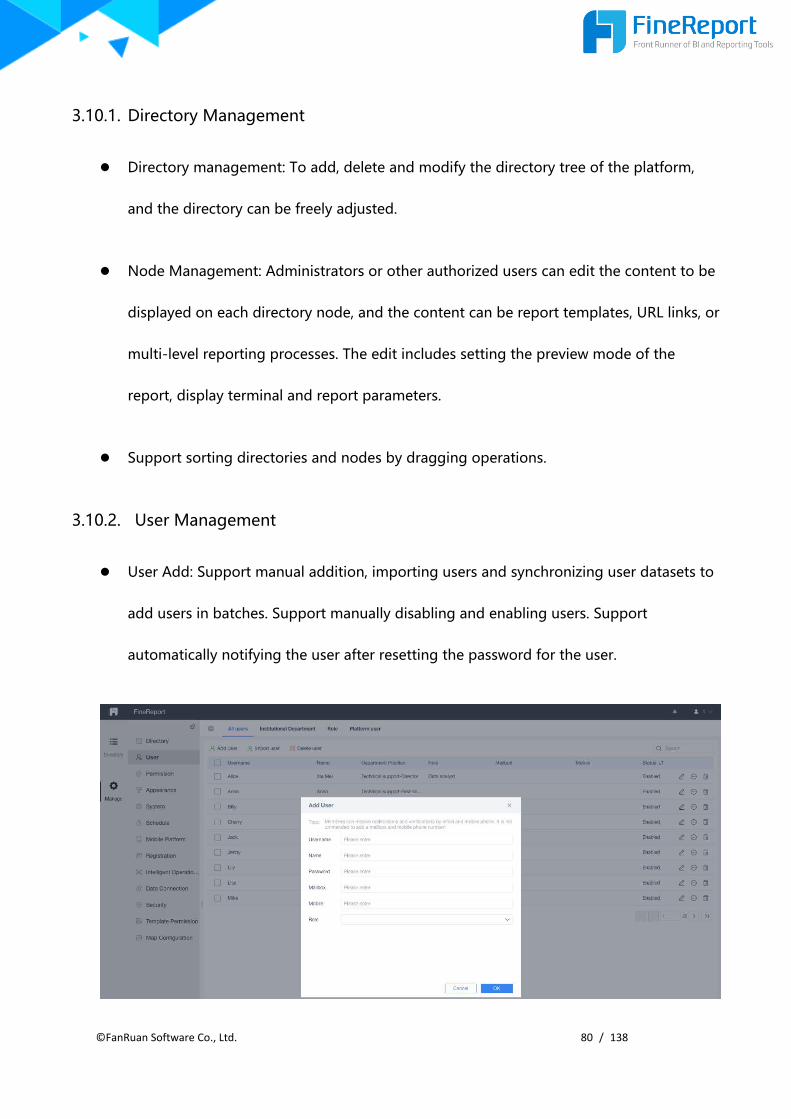
3.10.2. User Management
User Add: Support manual addition, importing users and synchronizing user datasets to
add users in batches. Support manually disabling and enabling users. Support
automatically notifying the user after resetting the password for the user.

©FanRuan Software Co., Ltd. 81 / 138
Department: Users can be classified and managed according to organizational structure.
Role: Users can be classified and managed by role.
User authentication: Provide three methods for user authentication when users log in:
built-in authentication, LDAP authentication and HTTP authentication, and all of them
can be perfectly integrated with other business systems. Built-in authentication utilizes
the user information inside the platform for authentication. If the username and
password are matched with the built-in user information, the authentication is passed.
LDAP authentication passes the username and password to the LDAP system for
authentication. If the authentication succeeds, the login succeeds. HTTP authentication
passes the username and password to a verification page for authentication. If the
authentication succeeds, the login succeeds.
3.10.3. Authorization
Authorization is the process of determine who can use what platform resource. Users can only
access resources with permissions.
The platform resources include reports, management permission and data connections.
The assignment of permissions can be based on department positions, roles or
usernames.

©FanRuan Software Co., Ltd. 82 / 138
The decision-making platform provides an interface for authorization.
Permission configuration: Assign permissions based on department positions, roles or
usernames.
Privilege quick configuration: Assign permissions based on the directory nodes.

©FanRuan Software Co., Ltd. 83 / 138
Permission reuse: Enable administrators to clone the rules of permission assignment
which can be reused on users in the same department or have the same role. This
function can greatly improve the efficiency of permission allocation.
Template permission: Control permission to access reports for third party systems.
Report content: You can let different users to view different report data and toolbar
widgets. The right to use report functions such as data entry can also be assigned to a
subset of users.
3.10.4. Hierarchical Authorization
For some enterprises, each subsidiary/department has its own administrator and assigns
permissions to employees. Under this circumstance, it requires a super administrator controls all
permissions and the sub-administrators manage users and report templates within responsible
department.

©FanRuan Software Co., Ltd. 84 / 138
Hierarchical authorization: Assign the authorization authority to the role of the lower-
level administrator, and configure the role (object) to which the role can be assigned. At
this time, when the role of the subordinate administrator logs in to the system, the
authority that he or she has authorized can be assigned to the corresponding role.
Template permissions include viewing, authorization, and editing.
Report editing: Report editing includes adding, editing, and deleting directories, and
adding, editing, and deleting reports. If a user has editing rights to a report directory,
the user has all the report management permissions.
Data connection control: Assign and authorize data permissions through role
permission control, including viewing, filing, and design permissions. Users with design
permissions can design and edit reports remotely. When a non-administrator remote
design, all the places involved in selecting a data connection can only select the data
connection that the role has the viewing permission, such as "database query" and
"storage procedure" and data dictionary when adding the data set. There are no
restrictions on program data sets, file data sets, and built-in data sets. Some data in the
server dataset does not see this server dataset if it comes from a data connection that
the role does not have permission to use.
©FanRuan Software Co., Ltd. 85 / 138
3.10.5. System Management
Provide functions such as login settings, password settings, print settings, SMS platform, mail
server, cache, and more. Among them, the login setting supports single login, last login
information reminder, password policy, login verification, and login lock.
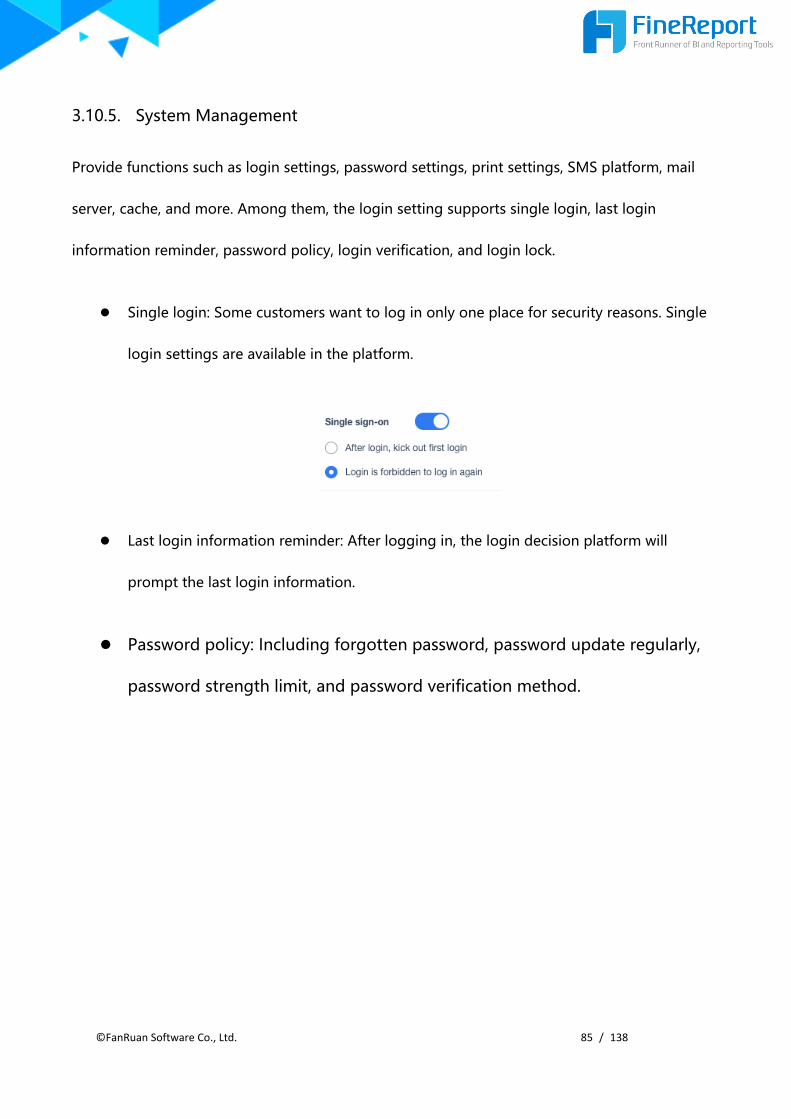
Single login: Some customers want to log in only one place for security reasons. Single
login settings are available in the platform.
Last login information reminder: After logging in, the login decision platform will
prompt the last login information.
Password policy: Including forgotten password, password update regularly,
password strength limit, and password verification method.

©FanRuan Software Co., Ltd. 86 / 138
Login verification: three verification methods: slider, SMS, and email.
Login lock: If you enter the wrong password more than a certain number of times, the
account will be locked to prevent brute force cracking of the user password.

©FanRuan Software Co., Ltd. 87 / 138
3.10.6. Intelligent Operation and Maintenance
Intelligent operation and maintenance consists of six modules: memory management, cluster
configuration, backup and restore, intelligent detection, cloud operation and maintenance, and
platform log.
Memory Management: Real-time monitoring and alerting including memory and CPU
utilization. Support intelligently clear sessions and free up memory. By limiting the
maximum number of rows in the template dataset, the maximum number of cells, and
the maximum sql execution time, the system is prevented from being jammed by
excessive templates. Support setting the life cycle of the session to ensure stable
operation of the server.

©FanRuan Software Co., Ltd. 88 / 138
Cluster Configuration: Quickly configure the cluster environment with a simple
operation. Support configuration of state servers and file servers in the platform, and
support hot deployment of add/drop nodes.

©FanRuan Software Co., Ltd. 89 / 138
Backup and restore: Support backup and restore of platform configuration information,
templates, jars, plug-ins, etc., and can set the frequency of backup, the maximum
number of copies, and the backup capacity. It also supports online update and upgrade
of server engineering.
©FanRuan Software Co., Ltd. 90 / 138
Intelligent Detection: It is divided into three categories: server configuration detection,
report management detection, and global attribute detection. For problems such as
preview template error, or server memory overflow, or loss of predefined styles, the data
decision making system uses the smart detection function to identify problems and
provide suggestions.
Cloud O&M: After this function is enabled, the cloud generates a test report after the
system automatically or the user manually uploads the data packet (no business data is
involved), and gives the user operation and maintenance proposal, which is combined
with the local operation and maintenance function and better protects the stability of
the system.
Cloud advantage:
Big calculations - giving more accurate, smarter, and more comprehensive operational
recommendations through a large number of complex computational models, big data-
based statistics, comparisons, and fittings
Zero cost – no need to consume local computing resources, large calculations are done
in the cloud center provided by FanRuan
Low threshold - no need to maintain the operation and maintenance tool itself
(Operation and maintenance tools are deployed in the cloud, maintained by FanRuan's
professionals)
High growth - the operation and maintenance platform continuously updates and

©FanRuan Software Co., Ltd. 91 / 138
grows. The function update does not require additional processing by the user, and
does not impose any burden on the user.
Data Security:
Data desensitization - only involves data for product improvement and application
operation and maintenance, and never involves business data
Data disclosure - users can see which data was uploaded at any time
Confidentiality agreement - may sign a confidentiality agreement if required
Supported features:
Performance Problem Template Recommendations - based on system usage,
recommend a template with performance issues
Platform Log: Monitors and analyzes the running status of the system. This function
allows you to view various indicators of the system running status, including access
statistics, user behavior, template heat, performance monitoring, management logs, and
error logs.
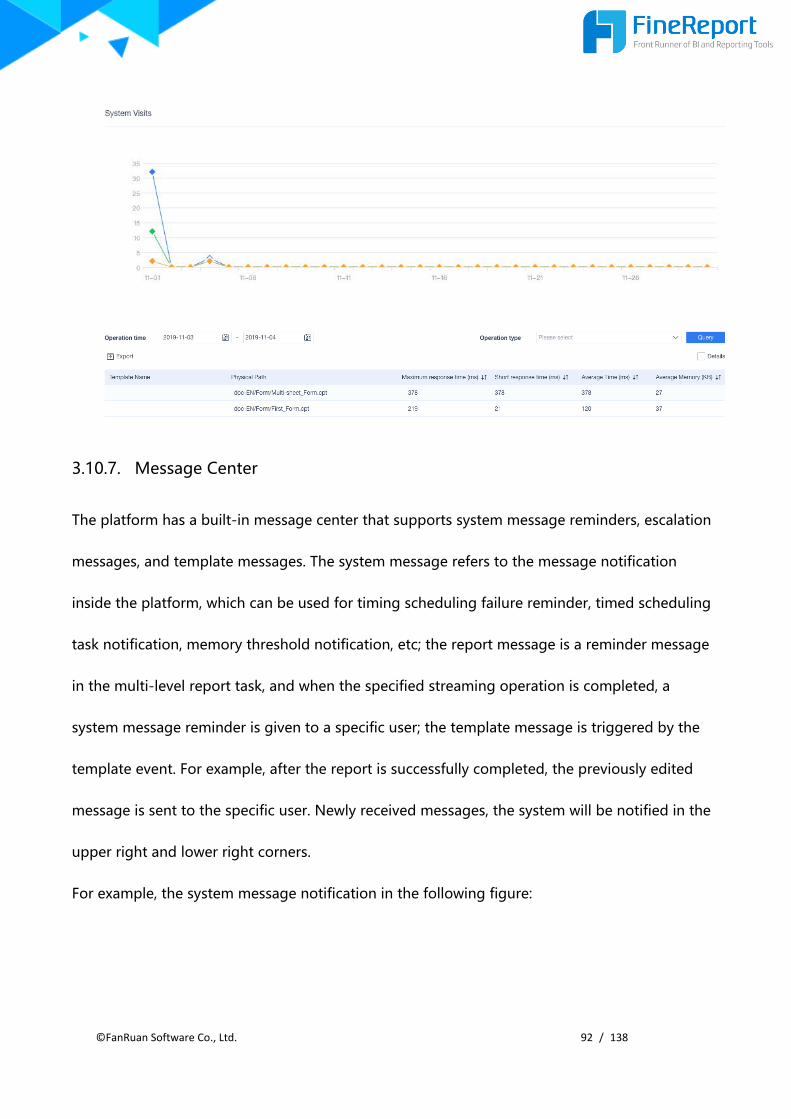
©FanRuan Software Co., Ltd. 92 / 138
3.10.7. Message Center
The platform has a built-in message center that supports system message reminders, escalation
messages, and template messages. The system message refers to the message notification
inside the platform, which can be used for timing scheduling failure reminder, timed scheduling
task notification, memory threshold notification, etc; the report message is a reminder message
in the multi-level report task, and when the specified streaming operation is completed, a
system message reminder is given to a specific user; the template message is triggered by the
template event. For example, after the report is successfully completed, the previously edited
message is sent to the specific user. Newly received messages, the system will be notified in the
upper right and lower right corners.
For example, the system message notification in the following figure:

©FanRuan Software Co., Ltd. 93 / 138
In addition to message notifications, FineReport also supports SMS, email, app notifications,
WeChat notifications and DingTalk notifications. Users can choose the appropriate notification
route according to their usage scenarios.
3.10.8. Safety Management
In order to ensure the security of enterprise applications, FineReport10.0 focuses on security,
and improves application security from both patching and active defense.
Security protection: including cookie enhancement, file upload verification, and Security
Headers. After the file upload verification is enabled, the suffix and size of the long-
distance file in the report and the appearance configuration of the platform are verified.
After the Security Headers are turned on, the HTTP Security Header attribute will be
attached to the request, and the vulnerability attack will be blocked.

©FanRuan Software Co., Ltd. 94 / 138
Access control: divided into two parts: the access frequency limit and the current
interception list. After the access frequency limit is enabled, the specific limit frequency
can be set, and the access request of the report is limited in frequency. If the limit
frequency is exceeded, the interception list is pulled. The interception list provides IP
information that exceeds the access frequency limit and joins the interception. The
administrator can remove the IP in the list.
SQL Anti-Injection: You can prevent the injection of malicious parameters by disabling
special keywords and changing the meaning of characters.
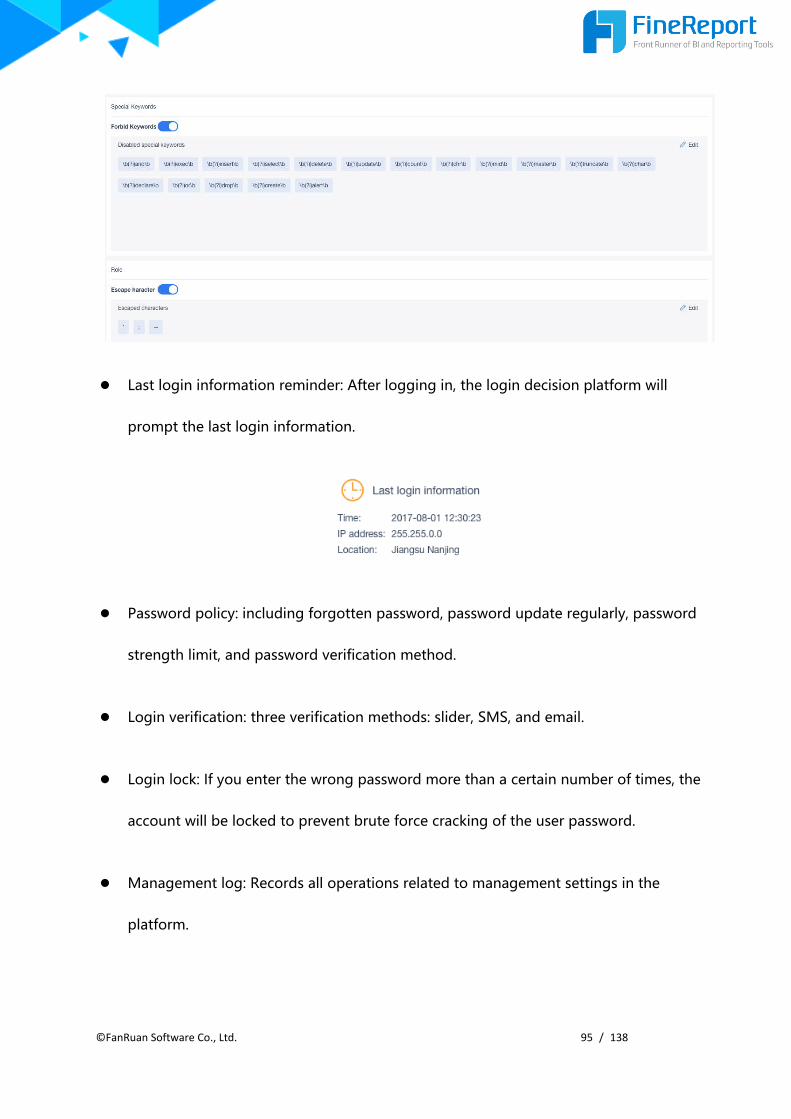
©FanRuan Software Co., Ltd. 95 / 138
Last login information reminder: After logging in, the login decision platform will
prompt the last login information.
Password policy: including forgotten password, password update regularly, password
strength limit, and password verification method.
Login verification: three verification methods: slider, SMS, and email.
Login lock: If you enter the wrong password more than a certain number of times, the
account will be locked to prevent brute force cracking of the user password.
Management log: Records all operations related to management settings in the
platform.

©FanRuan Software Co., Ltd. 96 / 138
3.10.9. Registration Management
Users can choose a registration method in local machine information authentication, private
cloud authentication, and public cloud authentication according to their own usage
environment.
Local Machine Information Authentication: The physical information of the report server
needs to be bound.

©FanRuan Software Co., Ltd. 97 / 138
Private Cloud Authentication: Applicable to deploying a system to a cloud platform
(such as Alibaba Cloud's ACE) or a machine without fixed physical information.
Public Cloud Authentication: Users do not need to provide machine physical
information, they can go directly to the FanRuan authentication server for online
authentication, which is convenient, fast, safe and reliable.
3.10.10. Appearance customization
Each enterprise does not have a single system, and it is hoped that each system can have a
unified UI specification, such as platform style, login interface, home page, and so on. In this
regard, FineReport is the first in the industry, completely open the API of the system appearance,
users can customize the decision system theme.

©FanRuan Software Co., Ltd. 98 / 138
The aesthetics of a system is determined by the login interface style + large background +
overall color + logo icon + theme package. The login interface style can be changed by the
official plug-in; the overall color matching is mainly determined by the background and color
matching, which can be visually configured in the decision-making platform-management
system-platform appearance, as shown in the following figure.
The interactive effects and menu layout are mainly done by the theme package. The more code
is written, the more things can be changed. Of course, the background image and the theme
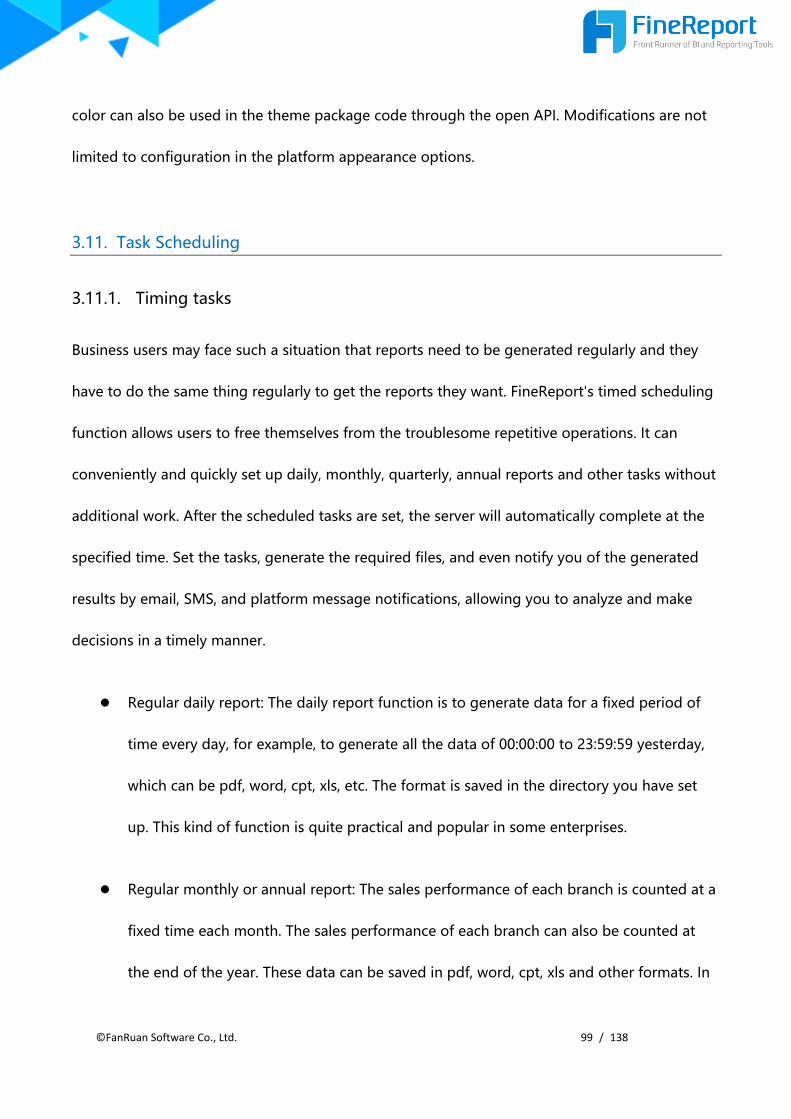
©FanRuan Software Co., Ltd. 99 / 138
color can also be used in the theme package code through the open API. Modifications are not
limited to configuration in the platform appearance options.
3.11. Task Scheduling
3.11.1. Timing tasks
Business users may face such a situation that reports need to be generated regularly and they
have to do the same thing regularly to get the reports they want. FineReport's timed scheduling
function allows users to free themselves from the troublesome repetitive operations. It can
conveniently and quickly set up daily, monthly, quarterly, annual reports and other tasks without
additional work. After the scheduled tasks are set, the server will automatically complete at the
specified time. Set the tasks, generate the required files, and even notify you of the generated
results by email, SMS, and platform message notifications, allowing you to analyze and make
decisions in a timely manner.
Regular daily report: The daily report function is to generate data for a fixed period of
time every day, for example, to generate all the data of 00:00:00 to 23:59:59 yesterday,
which can be pdf, word, cpt, xls, etc. The format is saved in the directory you have set
up. This kind of function is quite practical and popular in some enterprises.
Regular monthly or annual report: The sales performance of each branch is counted at a
fixed time each month. The sales performance of each branch can also be counted at
the end of the year. These data can be saved in pdf, word, cpt, xls and other formats. In

©FanRuan Software Co., Ltd. 100 / 138
the set directory, and then back up the data, you need to set multiple timer tasks for a
template.
Timed task file processing: After the timed task is completed, the result file can be saved
in the specified directory, FTP or as an attachment to send email reminders, SMS
notifications, platform message notifications, and push to mobile terminals.
Conditional timing task: Perform a conditional check judgment before executing the
timed task. If the condition is not met, it will not be executed or the test will be verified
again after the delay (Only when the task restart is checked, the delay will be verified
again after a delay).Conditional judgments consist of three types of choices: always
execution, formula judgment, and custom class judgment.

©FanRuan Software Co., Ltd. 101 / 138
Task management: For the scheduled tasks that have been set, you can perform
centralized management, including task running status viewing, pause, edit, copy, and
so on.
©FanRuan Software Co., Ltd. 102 / 138
3.11.2. Permission control of scheduled tasks
Through the permission control function of the timed task, the implementation can generate
different results for different users.
Timed task content permission control: Generally, there will be salary options in the
company's system. At the end of the month, you can click to view the salary information
of the current month. With the FineReport timing function, you can mount the salary
information of the current user's current month at the specified salary node at the end
of each month.
Timed task mail delivery enables different people to send different content: In the
general sales industry, there will be many distributors under one manufacturer, the
distributors need to purchase from the manufacturers, remittances, etc., and the
manufacturers will also have regular operations. Send an email to these distributors to
inform them about the remaining condition of the goods, the remittance, etc., and when
the company pays the salary, it will also send a salary email to the employee about the
employee.Then, the need to send different content emails to different people on a
regular basis can be easily achieved with the FineReport timing function.
3.11.3. Scheduled filling
FineReport also supports timing filling, and through the use of report templates, the data is
loaded, summarized, and filled into the library at regular intervals. For example, monthly
statistical statistics of each company's sales performance, these data are stored in the database

©FanRuan Software Co., Ltd. 103 / 138
of the branch, using the timed reporting function, the total performance of each division of the
company can be stored in the head office database.
3.12. Mobile apps
In the era of mobile Internet, information is everywhere. By making full use of mobile
applications, people can get rid of the limitations of office space and make full use of the
fragmentation time, which in turn can be“ managing between the thumbs, making decisions
thousands of miles away”.

©FanRuan Software Co., Ltd. 104 / 138
FineReport supports the integration of reports into mobile applications, and can display reports
according to the operating characteristics of mobile devices, such as support for page
enlargement and reduction.
The native app developed by FineReport (app name: data analysis), supports IOS, Android
system, has a comfortable experience, supports chart gesture operations, various drill linkage
and other interactive features. It supports mobile device hardware address binding, supports
VPN, supports multiple logins, password protection and other security settings to ensure user
information security.
3.12.1. ReactNative combined with native
The core framework of the native APP application system adopts ReactNative technology,
designed and implemented according to the MVC idea, and the view and model are separated
to maintain the scalability of the view and the reusability of the model. The entire system has
good stability and scalability.
At the same time, the table display in the APP adopts the native rendering technology, which is
optimized for the mobile processor. Compared with the traditional HTML report, the rendering
speed and the smoothness of the interactive operation are greatly improved.
3.12.2. OEM Cloud Packaging & Personalization
In addition to providing official apps, it also supports customizing enterprise personalization
applications through the OEM cloud packaging platform, which can replace application names,
icons, startup pages, copyright information; built-in enterprise-specific servers, VPN
©FanRuan Software Co., Ltd. 105 / 138
configurations, and so on. At the same time, the enterprise can control its version iteration
independently, and improve the personalization and stability of mobile applications.
The mobile side also supports a variety of personalized customization solutions such as custom
theme plugins, directory style plugins, adding directory banners, and modifying directory icons.
3.12.3. HTML5 report
In addition to native parsing, FineReport also supports HTML5 parsing, which can be easily
integrated with third-party applications. At the same time, HTML5 reports use the same set of
underlying code architecture as APP, and the interaction, experience, and functionality are highly
consistent with APP.
3.12.4. Mobile Adaptive and Zooming
Whether it is APP native or HTML5 report, it can adapt to different resolution screens, zoom the
report page to achieve the best effect, and on the mobile side, the decision report will be
converted into stream layout adaptive display according to the component order. Users can also
analyze individual components by component magnification, while supporting two-finger zoom
for partial magnification for a clearer view of some detail data.

©FanRuan Software Co., Ltd. 106 / 138
3.12.5. Mobile Drilling and Linkage
The mobile terminal is the same as the PC end, supports data drilling, chart drilling, and
supports multi-dimensional (multi-target) drilling, and the drilling effect is in line with
the characteristics of the mobile terminal. With the linkage operation, the effect of the
mobile terminal is basically the same as that of the PC.
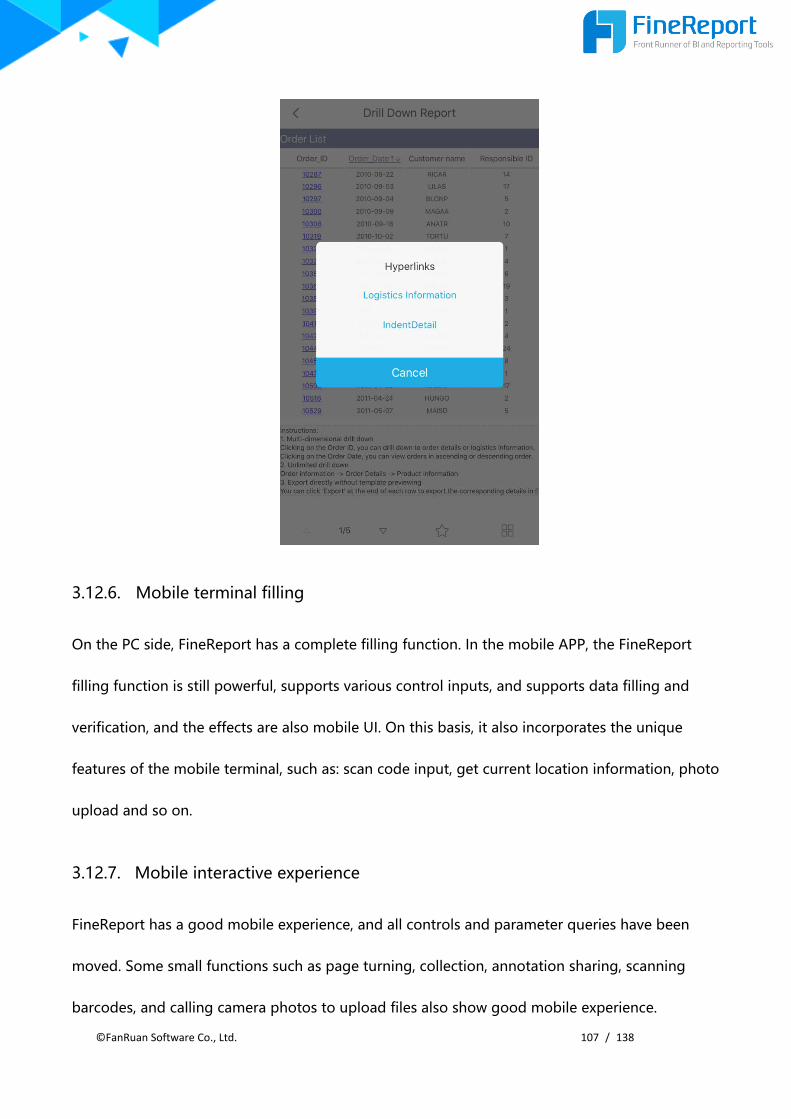
©FanRuan Software Co., Ltd. 107 / 138
3.12.6. Mobile terminal filling
On the PC side, FineReport has a complete filling function. In the mobile APP, the FineReport
filling function is still powerful, supports various control inputs, and supports data filling and
verification, and the effects are also mobile UI. On this basis, it also incorporates the unique
features of the mobile terminal, such as: scan code input, get current location information, photo
upload and so on.
3.12.7. Mobile interactive experience
FineReport has a good mobile experience, and all controls and parameter queries have been
moved. Some small functions such as page turning, collection, annotation sharing, scanning
barcodes, and calling camera photos to upload files also show good mobile experience.

©FanRuan Software Co., Ltd. 108 / 138
3.12.8. Adding devices and bindings
FineReport supports manual input of URLs and QR code scanning to add servers, which is
convenient and quick.
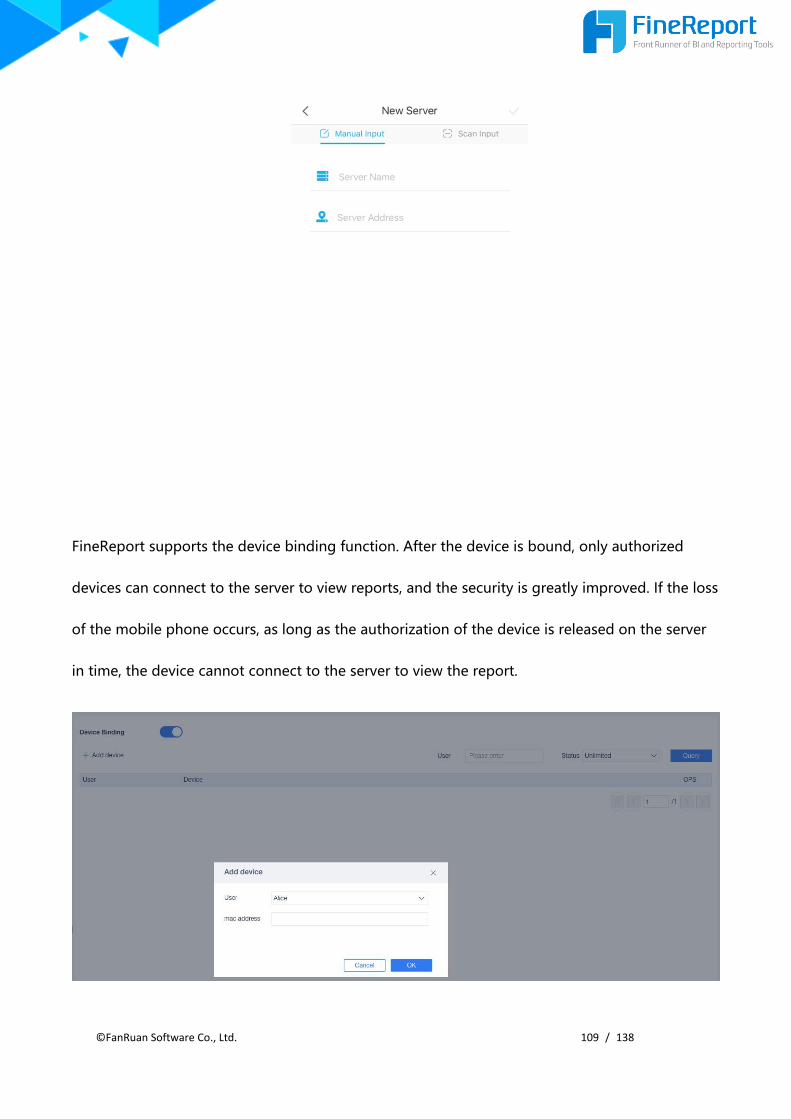
©FanRuan Software Co., Ltd. 109 / 138
FineReport supports the device binding function. After the device is bound, only authorized
devices can connect to the server to view reports, and the security is greatly improved. If the loss
of the mobile phone occurs, as long as the authorization of the device is released on the server
in time, the device cannot connect to the server to view the report.
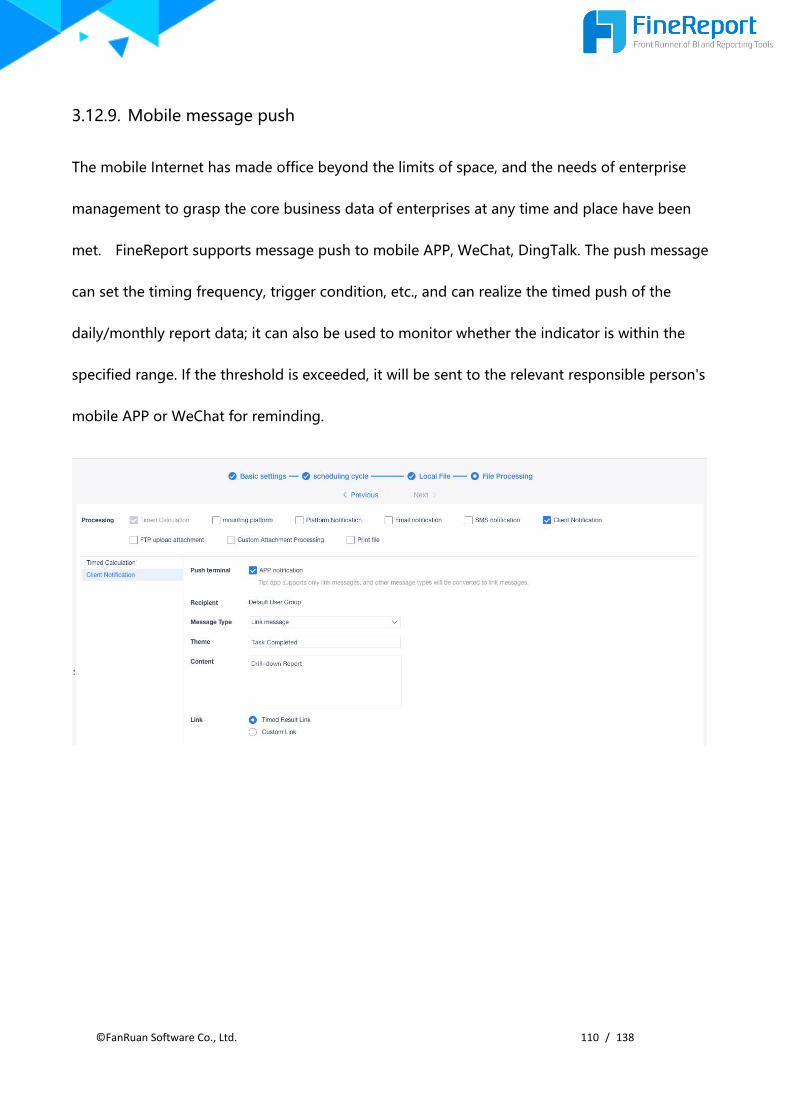
©FanRuan Software Co., Ltd. 110 / 138
3.12.9. Mobile message push
The mobile Internet has made office beyond the limits of space, and the needs of enterprise
management to grasp the core business data of enterprises at any time and place have been
met. FineReport supports message push to mobile APP, WeChat, DingTalk. The push message
can set the timing frequency, trigger condition, etc., and can realize the timed push of the
daily/monthly report data; it can also be used to monitor whether the indicator is within the
specified range. If the threshold is exceeded, it will be sent to the relevant responsible person's
mobile APP or WeChat for reminding.
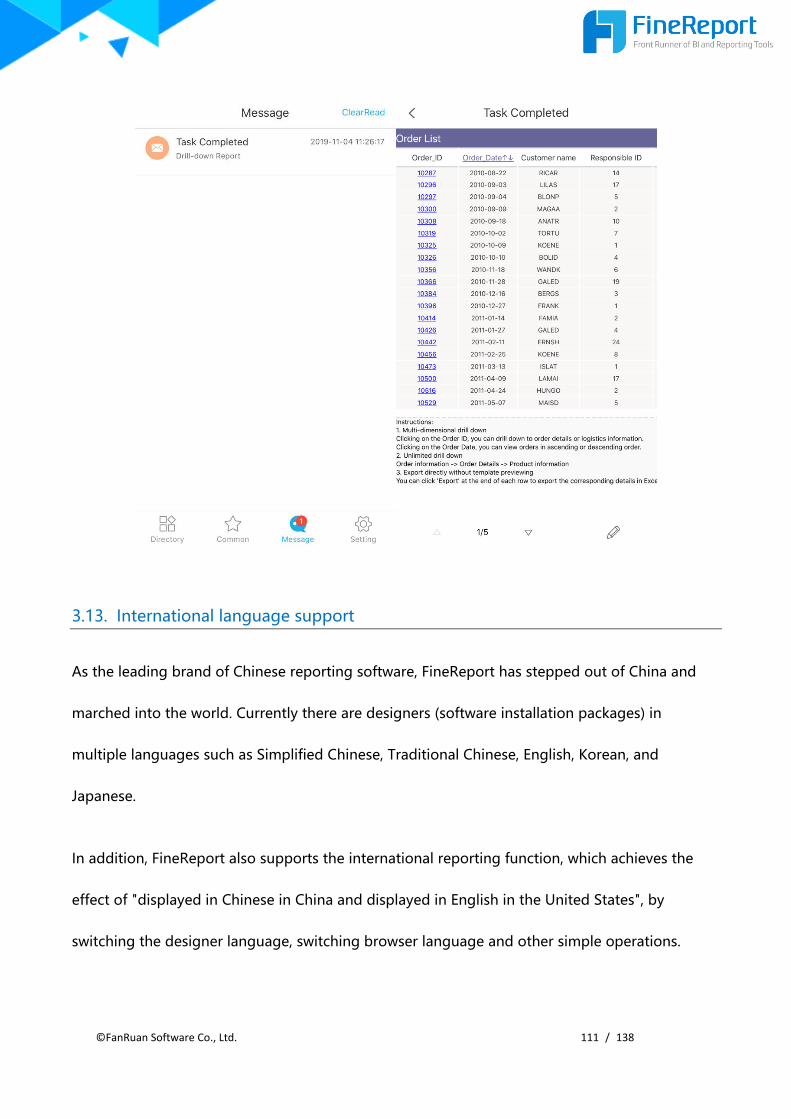
©FanRuan Software Co., Ltd. 111 / 138
3.13. International language support
As the leading brand of Chinese reporting software, FineReport has stepped out of China and
marched into the world. Currently there are designers (software installation packages) in
multiple languages such as Simplified Chinese, Traditional Chinese, English, Korean, and
Japanese.
In addition, FineReport also supports the international reporting function, which achieves the
effect of "displayed in Chinese in China and displayed in English in the United States", by
switching the designer language, switching browser language and other simple operations.

©FanRuan Software Co., Ltd. 112 / 138
4. Application Deployment
Application Deployment is divided into two parts: report engineering deployment and web page
integration. FineReport is perfect for page integration. For engineering purposes, report
engineering can be deployed as a stand-alone project or integrated into existing projects.
4.1. System Integration
4.1.1. Java project integration
FineReport is a pure Java software, so for J2EE projects, seamless integration is possible. The
integration principle is as follows:
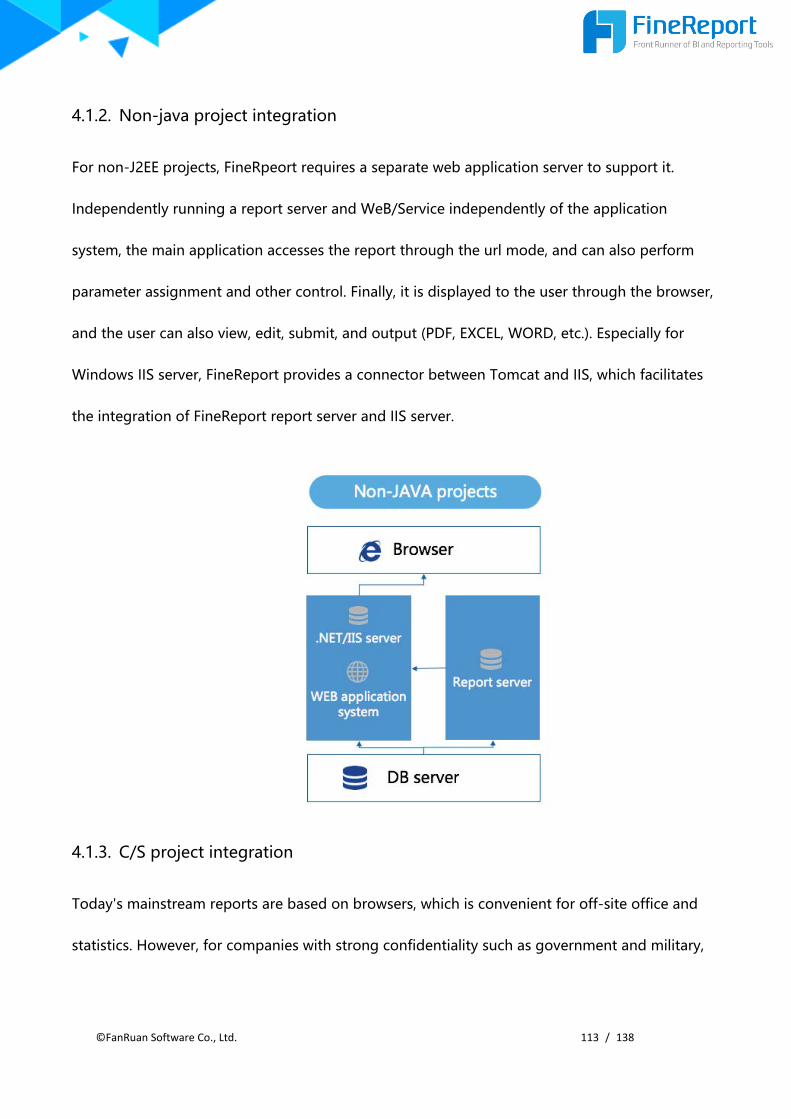
©FanRuan Software Co., Ltd. 113 / 138
4.1.2. Non-java project integration
For non-J2EE projects, FineRpeort requires a separate web application server to support it.
Independently running a report server and WeB/Service independently of the application
system, the main application accesses the report through the url mode, and can also perform
parameter assignment and other control. Finally, it is displayed to the user through the browser,
and the user can also view, edit, submit, and output (PDF, EXCEL, WORD, etc.). Especially for
Windows IIS server, FineReport provides a connector between Tomcat and IIS, which facilitates
the integration of FineReport report server and IIS server.
4.1.3. C/S project integration
Today's mainstream reports are based on browsers, which is convenient for off-site office and
statistics. However, for companies with strong confidentiality such as government and military,

©FanRuan Software Co., Ltd. 114 / 138
or companies that only have internal management and do not want to communicate with the
external network, the C/S system is more in line with the actual needs of enterprises and units.
FineReport uses a strategy of embedding a browser in a program to call a report to integrate
with a C/S project.
In this way, the background operation is the same as that of the ordinary B/S system, but the
report can only be displayed in the browser, so it is impossible to directly call the url like the
ordinary B/S system when the report is connected in the foreground.
4.2. Web page integration
Reports present data through various styles such as tables, charts, etc. for statistical analysis.
Such a data table or chart can be implemented by the user when developing the system, but the
workload is large and the maintenance is difficult. Users often use off-the-shelf report software
to develop reports, and finally embed the prepared reports into their own systems to save the
project development cycle.
Now the user-developed system basically tends to the browser/server mode of the BS
architecture. These systems may be developed by different languages, such as HTML, ASP, JSP,
PHP, etc., so the prepared reports need to be embedded in these pages as part of the page.
FineReport integrates reports into web pages through the Frame framework.
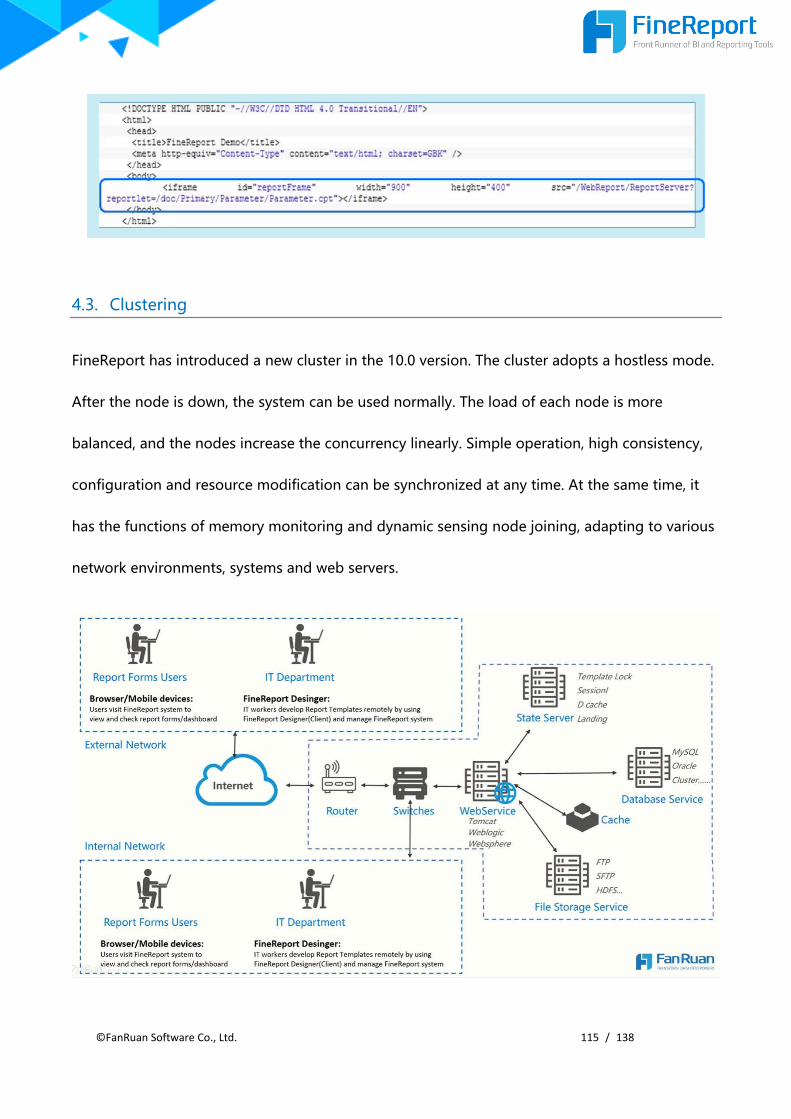
©FanRuan Software Co., Ltd. 115 / 138
4.3. Clustering
FineReport has introduced a new cluster in the 10.0 version. The cluster adopts a hostless mode.
After the node is down, the system can be used normally. The load of each node is more
balanced, and the nodes increase the concurrency linearly. Simple operation, high consistency,
configuration and resource modification can be synchronized at any time. At the same time, it
has the functions of memory monitoring and dynamic sensing node joining, adapting to various
network environments, systems and web servers.
©FanRuan Software Co., Ltd. 116 / 138
The advantages of the 10.0 cluster are:
High Consistency:All configurations and files made through the FineReport can be
synchronized to each node of the cluster at any time.
High Availability:All stand-alone features are supported. After a single node is down,
the system can still access normally.
Powerful Features:As the number of nodes increases, the concurrency supported by
the system grows almost linearly. And the load of each node is more balanced.
Simple to Use:The cluster environment can be quickly configured through simple
operations in the platform, where the addition and deletion of nodes supports hot
deployment. In addition, you can monitor the health and logs of each node in the
platform.
4.4. Single Sign-On
FineReport offers a variety of single sign-on methods to meet the needs of different
applications.
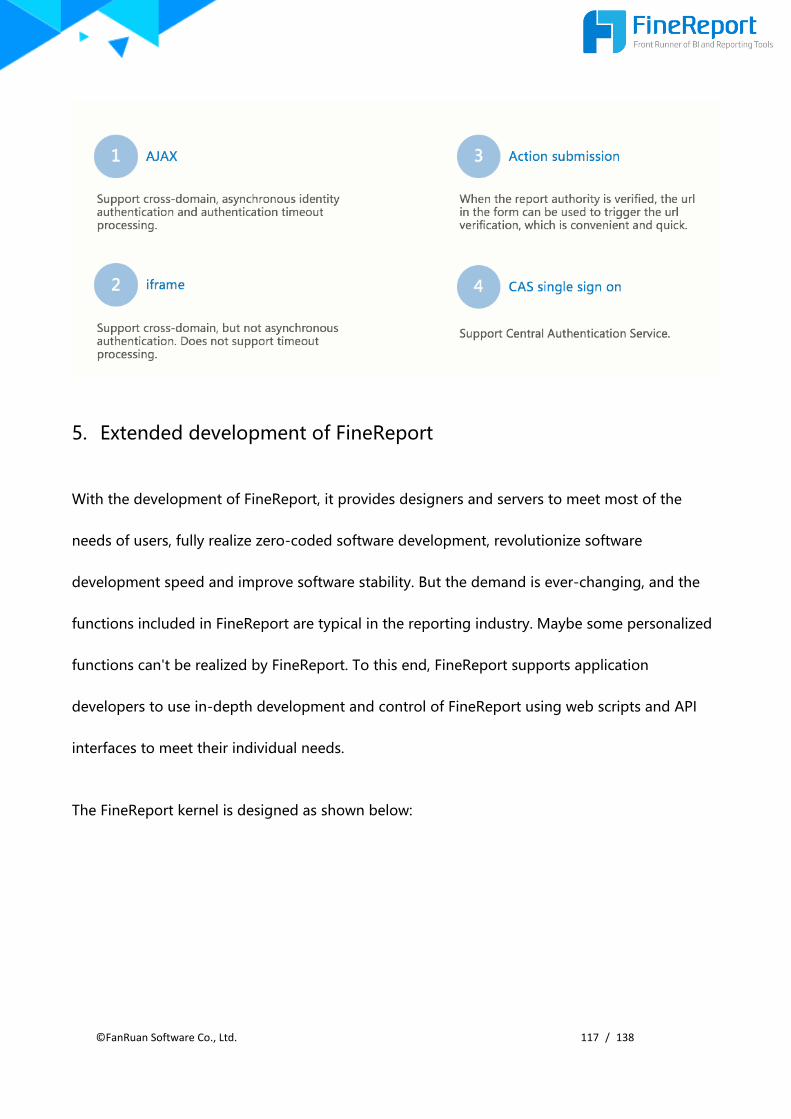
©FanRuan Software Co., Ltd. 117 / 138
5. Extended development of FineReport
With the development of FineReport, it provides designers and servers to meet most of the
needs of users, fully realize zero-coded software development, revolutionize software
development speed and improve software stability. But the demand is ever-changing, and the
functions included in FineReport are typical in the reporting industry. Maybe some personalized
functions can't be realized by FineReport. To this end, FineReport supports application
developers to use in-depth development and control of FineReport using web scripts and API
interfaces to meet their individual needs.
The FineReport kernel is designed as shown below:
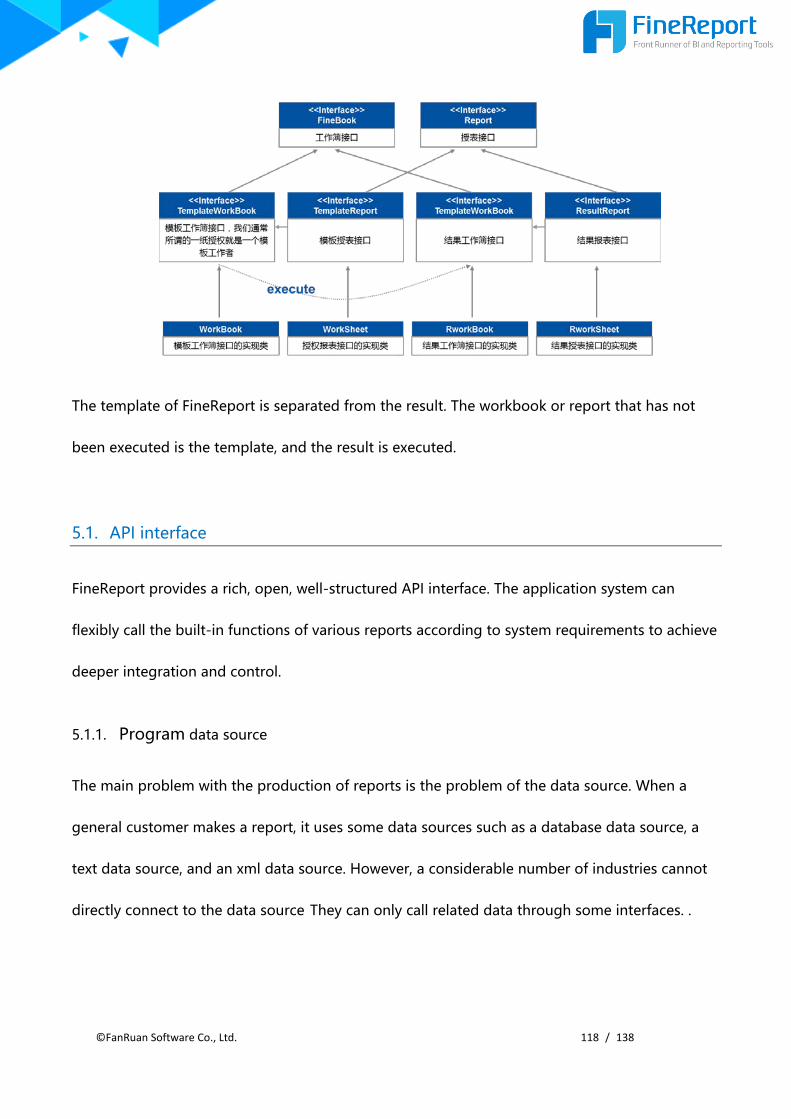
©FanRuan Software Co., Ltd. 118 / 138
The template of FineReport is separated from the result. The workbook or report that has not
been executed is the template, and the result is executed.
5.1. API interface
FineReport provides a rich, open, well-structured API interface. The application system can
flexibly call the built-in functions of various reports according to system requirements to achieve
deeper integration and control.
5.1.1. Program data source
The main problem with the production of reports is the problem of the data source. When a
general customer makes a report, it uses some data sources such as a database data source, a
text data source, and an xml data source. However, a considerable number of industries cannot
directly connect to the data source They can only call related data through some interfaces. .
©FanRuan Software Co., Ltd. 119 / 138
FineReport reads data sources through the AbstractTableData abstract class, enabling customers
to meet complex and variable data sources when reporting.
5.1.2. Report format settings
The user can control multiple properties of the report object's cell properties, web properties,
parameters, page settings, etc., and can freely control the display style of the cell, the buttons of
the toolbar, the display of the parameter panel, the assignment of parameters, and the like.
5.1.3. Custom interaction
In actual report production, there are many times when trigger events are needed to make
report creation more convenient and friendly. FineReport reports use the jquery v1.5.2
framework, which makes it easier for users to process HTML documents, events, animation
effects, and easily provide AJAX interaction for websites, and it is compatible with various
browsers (IE 6.0+, FF 1.5+, Safari2.0+, Opera 9.0+). After the FineReport report is parsed, it will
eventually become an html page, so you can use js to process the report. Users can use the
jQuery framework to manipulate the report. On this basis, FineReport also encapsulates many
built-in js methods.
5.1.4. Custom filling
The user can define the filling method according to his own needs, and fill in the interface to
save the user operation log to the database, and perform various processing when the report
succeeds and fails.
©FanRuan Software Co., Ltd. 120 / 138
5.1.5. Report reprocessing
FineReport Designer can basically design most reports with zero code. However, the
requirements are ever-changing. Maybe some personalized functions can't be realized by the
designer. Therefore, the template can be read into the program, modified and then exported.
Access the report in a browser. Obviously, this is cumbersome. For this case, you can also
directly save the read template as a program network report and directly access the defined
program network report on the web side.
5.1.6. Custom Functions
FineReport has provided a large number of built-in functions, which are enough to meet the
user's report production requirements under normal circumstances, but in some special fields,
some special functions may be needed. In this case, FineReport provides a custom function
mechanism. The user defines some functions according to the business needs, but these
functions must meet the FineReport function definition rules: Functionname (Para,Para,...), where
Function name is the function name and Para is the parameter.
In FineReport, each function is defined as a class. This class must implement the Function
interface. In the operation, the class is first retrieved by function name reflection, and then its
run (Object[] agrs) method is called.
5.1.7. Import and export
FineReport provides powerful input and output functions, all of which are in the com.fr.report.io
package. The input of the report refers to the creation of a WorkBook object from the template
©FanRuan Software Co., Ltd. 121 / 138
file (in XML format) of the report. The output refers to saving the report as various format files.
FineReport supports saving the report as cpt, built-in data cpt, Pdf, Excel, Word, Svg, Csv and
other file formats to release the export process.
5.2. Plugin development
A plugin is a program written in accordance with a certain specification of the application
interface. Many softwares have plugins, and there are countless plugins. For example, in IE, after
installing the relevant plug-ins, the WEB browser can directly call the plug-in to implement a
specific function.
FineReport has opened a lot of API interfaces for users to customize their personalization needs,
and provides a complete set of plug-in development, installation, use, and management
solutions. In this way, the user can implement a certain function by FanRuan official, or by
himself, or other technical personnel.
For the plug-ins that have been developed, FanRuan provides a plug-in mall for users to choose,
as shown below.

©FanRuan Software Co., Ltd. 122 / 138
At the same time, FanRuan is working hard to build the FineReport ecosystem, allowing more
technicians to benefit from the development of FineReport plug-ins. FanRuan officially publishes
various types of paid plug-in development bidding from time to time. Interested developers can
carry out the bidding, and the plug-in developed can obtain the official cash reward as long as it
is qualified. In addition, developers can also develop various types of plug-ins based on their

©FanRuan Software Co., Ltd. 123 / 138
own understanding of the industry, and sell them to the FanRuan Plug-in Mall for continuous
profit. Corporate customers, if they have individualized needs, cannot meet the existing
functions, or they can publish their own bidding plans to attract developers to help you meet
your needs.
6. FineReport performance and optimization
In addition to the functions of the finished software, users are more concerned about the
stability, number of concurrent, data volume and other performance. This section introduces you
to this aspect.
6.1. Measured data
The measured data shows that the common details or grouped reports, after opening
FanRuan’s line engine, 500,000 rows and 5 columns of data, that is, 2.5 million grids, memory
consumption between 100-150M, response time is about 1.5S; Million lines, 5 columns of data,
that is, 5 million grids, memory consumption is around 130-200M, response time is about 2.5S.
For concurrency, FineReport on the Intel(R) Core(TM) i7-2600 CPU @3.4GHz 3.39GHz/16G
memory machine, 500,000 data reports of about 2.5 million cells, 100 users concurrent access,
the average response time is 28s; and 1 million data reports of about 5 million cells, 100 users
concurrent access, the average response time is 32S.

©FanRuan Software Co., Ltd. 124 / 138
6.2. Performance Optimization
In the actual system, various performance problems are often encountered. For example, the
system access time is too long; frequent access to large data reports consumes too much server
memory and causes memory overflow; excessive user concurrent access causes the server to
crash; accessing a complex report for a few minutes and then accessing again, still have to wait
the same time to see the result; the web page frequently appears request timeouts, etc., which
greatly affects work efficiency and experience.
Based on more than ten years of experience, FineReport has summarized a set of practical
performance optimization solutions. From the data source acquisition, report production ideas,
control usage to server configuration, there is a complete set of solutions.
6.2.1. Report performance optimization
Optimize report fetch: The designer spells out the final SQL, passes the SQL statement
to the database, executes the database, and returns the data to the designer. So we can
improve the performance of the report by controlling the amount of data and pre-
processing the data, such as using SQL statements to take specific fields, direct
grouping in SQL instead of grouping in reports, direct sorting in SQL instead of sorting
in reports, use Views, stored procedures, and more.
Optimize the calculation time of the report: After completing the report fetch, the
designer will expand, group, list, summarize and other data returned by the database.
Good template making habits can often optimize the calculation time of the report,
©FanRuan Software Co., Ltd. 125 / 138
such as using blank cells, use hidden rows and columns carefully, use merged cells with
caution, use parent chart, and so on.
Using parameter injection: For multi-dataset related reports, the report will be slow to
display when the data is large, or complicated by writing SQL statements. At this point,
using the dynamic parameter injection function can not only speed up the presentation
of the report, but also eliminate the need to write complex SQL statements.
Data set cache and sharing: For large data volume reports, if you query the data directly
from the database each time, it not only increases the pressure of the database server,
but also greatly affects the speed of fetching and reduces the execution speed of the
report. For this purpose, FineReport provides data set caching and sharing. FineReport
can first cache the results of its data set query. For the cached data, when you use the
same data set again, you don't need to connect to the database again to re-query the
data, and directly use the cached result, that is to use FineReport's data set sharing
mechanism , to achieve resource reuse, reduce the access time and thus improve the
presentation speed of the report.
Enable row engine execution layered report: Very simple for report form, just a simple
single data source detail report, but the amount of data is very large, millions, millions
or even more. Report fetching and calculation time is quite long. At this point, you can
enable the line engine to improve the display speed of the report. For the user, the
query report will not feel lagging.

©FanRuan Software Co., Ltd. 126 / 138
6.2.2. Server performance optimization
Memory: JVM stack memory is a key indicator to determine the performance of the
application server. The default memory configuration of the server is relatively small. In
larger applications, this memory is not enough, so you can improve performance by
viewing and modifying the web server memory size.
Concurrency: Concurrent means that multiple clients access the application system at
the same time. The number of connections is the maximum number of simultaneous
accesses to the server. The number of control connections can optimize the
performance of the server and ensure the efficiency of the server. FineReport provides
two methods: static concurrency and priority access concurrency control.
Server cluster: The cluster can use multiple computers for parallel computing to achieve
high computing speed. It can also be backed up by multiple computers, so that any one
machine breaks, the whole system still works normally. FineReport fully supports server
clusters. It must be clear that the servers in the cluster need to have intranet
communication support. Reporting applications on different servers must be consistent.
7. Product environment support
7.1. Software environment
The specific software environment requirements are as follows:
Operating system: Solaris, Aix, Windows, Linux, Unix, IRIX;

©FanRuan Software Co., Ltd. 127 / 138
Database: Oracle, SqlSever, Mysql, Access, Sybase, DB2, Postgre, Derby (mainly some
relational databases and multidimensional databases);
Server: web application server such as Tomcat, JBoss, Weblogic, WeB/Sphere, Tongweb,
resin, etc.
Browser: Main browsers such as IE, FireFox, and Chrome.
7.2. Hardware environment
The specific hardware environment requirements are as follows:
Number of
registered
users
System
online
number
Mean
concurre
ncy
Recommended configuration Minimum configuration
2000~5000 400~1000 0~100 Stand-alone (JVM memory
8G)
Stand-alone(JVMmemory8G)
4000~10000 800~2000 0~200 Stand-alone
(JVMmemory12G)
Stand-alone(JVMmemory8G)
6000~15000 1200~3000 200~300 Stand-alone
(JVMmemory16G)
Stand-alone(JVMmemory12G)
8000~20000 1600~4000 300~400 Two-node(JVMmemory12G) Two-node(JVMmemory8G)
10000~25000 2000~5000 400~500 Two-node(JVMmemory16G) Two-node(JVMmemory12G)

©FanRuan Software Co., Ltd. 128 / 138
Description:
Number of registered users: Users registered by the system
Number of online users: The number of online users at the same time in a certain period of
time (between 5% and 20% of the total number of registered users, 20%)
Number of concurrent users: The number of users who send requests to the server at the
same time (usually about 10-25% of the number of online users)
Recommended configuration: 90% of users have access time less than 2s
Minimum configuration: 90% of users have access times below 4s
JVMmemory: The memory assigned to the FineReport container Tomcat.
Physical memory: The hardware's memory is recommended to be at least 1.25 times that of
jvmmemory.
CPU: The test server cpu has two pieces, the model is Intel Xeon E5-2620 V4.
Note: Network and database sql processing affect the experience duration. This report only
deals with the length of FineReport processing, intranet, non-complex sql, and can ignore
network speed and database factors.
8. Contact us
Learn more about FineReport, you can -
12000~30000 2400~6000 500~600 Three-node(JVMmemory16G) Three-node(JVMmemory12G)
30000 以上 6000 以上 600~900 Three-node(JVMmemory16G) Three-node(JVMmemory16G)

©FanRuan Software Co., Ltd. 129 / 138
Product official website:https://www.finereport.com/en/
Business: [email protected]
Support: [email protected]
9. About FanRuan
FanRuan Software Co., Ltd., founded in 2006, is a professional big data BI and analytics platform
vendor in China. Specializing in BI and data analysis, we are committed to providing one-stop BI
solutions to businesses around the globe.
We are the industry pioneer in terms of professional standards, organizational size, service
scope, and clients, and have been recognized by many professional consulting organizations
including Gartner, IDC and CCID. We were selected as one of Forbes Top 50 Potential Chinese
Unlisted Companies in 2018 and one of Top 50 Chinese Big Data Enterprises" for two
consecutive years in 2018 and 2019.
1. Organizational size
By the end of 2020, we have more than 1300 employees, most of whom are well mannered,
highly educated and highly skilled.
2. Sales performance
Our sales in 2020 totaled 130 million USD, which is maintained at a rapid growth rate.

©FanRuan Software Co., Ltd. 130 / 138
3. Service Scope
Headquartered in Wuxi City, Jiangsu Province,we have set up 14 branch offices globally to
deliver efficient services to all regions.
4. Industry Coverage
Our business covers almost all market segments referred in National Statistical Standard
(GB/T4754-2011).
5. Clients
We have established partnership with 15,000 clients, and our products and services are well
received and trusted by both Global Top 500 enterprises and China Top 500 enterprises.
Our products have been successfully implemented and utilized by nearly 38,000 enterprises or
institutions in IT application projects.
10. Honor
IDC
"China BI Software Tracker,2018"
No. 1 in China's BI market share
Forbes
Forbes Top 50 Potential Chinese Unlisted Companies 2018
The only BI vendor

©FanRuan Software Co., Ltd. 131 / 138
CMMI 3
Capability Maturity Model Integration Level 3
Gartner
"Market Guide for Traditional Enterprise Reporting Platforms 2017"
The only Chinese vendor
CCID
CCID Consulting Annual Report 2017-2018
No. 1 in China's BI market share
KPMG
Top 50 Chinese Retailtech Enterprises, 2020
More
In 2020, FanRuan was selected as “Top 50 Chinese Big Data Enterprices” by Big Data Industry
Alliance of China
In 2020, FanRuan was selected as “Key Enterprises in National Planning Layout”
In 2020, FanRuan was selected as “Top 200 Best Employers”by China Internet Week
In 2020, FanRuan was selected as “Best BI Solution Vender”by China Enterprise IT Award
In 2019, FanRuan was selected as the “Top 50 Chinese Big Data Enterprises” by Big Data
Industry Alliance of China
©FanRuan Software Co., Ltd. 132 / 138
In 2019, FanRuan was selected as the “Best Partner for Electric Power Informatization” by the
Specialized Collaboration Committee on Electric Power Informatization
In 2019, FanRuan was selected as “China's Top 10 Service Providers in Logistics and Purchasing
Informatization” by China Federation of Logistics & Purchasing
In 2019, FanRuan was granted “Gold i Award: Best Amoeba Management Solution” by China
Internet Weekly
In 2019, FanRuan was selected as Huawei Cloud’s First Batch of Strategic Partners
In 2018, FanRuan was selected as the “Top 50 Chinese Big Data Enterprises” by the Big Data
Industry Alliance of China
In 2017, FanRuan won “China Enterprise IT Award: Best BI Solution Vendor”
In 2017, FanRuan was listed as the “Top 10 Chinese BI Solution Vendors” by Business Partner
Consulting
In 2017, FanRuan’s FineBI was granted “Best Big Data BI Product Innovation Award” by
China Internet Weekly
In 2017, FanRuan won the Most Growth Value Award in the Sixth Financial Summit
2017, FineBI, eNet
In 2017, FanRuan’s FineBI was granted “Gold E Award: Best Big Data BI Innovative” by
eNetProduct Award

©FanRuan Software Co., Ltd. 133 / 138
In 2017, FanRuan became the Standing Member of China Cloud Service Alliance
In 2017, FanRuan’s FineBI was granted “Innovation Award for Data Visualization Products”
by Shanghai Chief Information Officer Union
In 2017, FanRuan was granted “China's Leading Enterprise Award for IT Innovation” by
ChinaByte
In 2017, FanRuan’s FineBI was granted the “Most Influential Product Award for IT
Innovation” by ChinaByte
In 2017, FanRuan’s CEO Marks won “Chinese IT Business Partner Elite Award”
In 2016, FanRuan’s FineBI was listed into “BI Solutions of the Year 2016” by China Internet
Weekly
In 2016, FanRuan’s CEO Marks was selected as “2016 Most Influential People in the BI
Industry”
In 2016, FanRuan’s products were listed as “IT Impression: The Most Influential BI Brand” by
51CTO
In 2016, FanRuan was selected as the “Best BI Solution Vendors” by CEIA
In 2015, FanRuan won “China’s Leading Enterprise Award for BI Solution”
In 2015, FanRuan won the “Excellent Product/Solution Award” in the 11th Informatization
Leader Summit & VSharing CIO Annual Meeting
In 2014, FanRuan’s products were granted “ISO 9000 QMS Certification”
In 2014, FanRuan won the title of “National High-Tech Enterprise”
©FanRuan Software Co., Ltd. 134 / 138
11. History
2020
Sales exceed 130 million USD and still grows at high speed.
2019
Sales hit 100 million USD;
FanRuan Press Conference and Media Appreciation Banquet are held in Beijing. Write Paper on
Business Intelligence V1.0 is officially released;
FanRuan participates in 2020 World Internet of Things Exposition;
The 2nd Smart Data Conference is held in Nanjing, with 1,500 participants taking part;
IDC publishes "China BI Software Tracker, 2018” and FanRuan ranks No. 1 in China’s BI market
share;
FanRuan is listed as No. 1 in China's BI market share in CCID Consulting Annual Report 2017-
2018;
FanRuan is selected as Huawei Cloud’s First Batch of Strategic Partners;
2018

©FanRuan Software Co., Ltd. 135 / 138
The new headquarter is officially settled in Wuxi Xidong New City , and the sales exceed 400
million yuan that month;
FanRuan releases FineReport V10.0 and FineBI V5.0;
R&D team wins the championship in business team rankings in Analysys OLAP Algorithm
Contest;
FanRuan holds the First Smart Data Conference, with more than 1,200 participants taking part;
FanRuan is listed as Forbes Top 50 Potential Chinese Unlisted Companies in 2018, the only
vendor to make the list in its industry;
IDC publishes "China BI Software Tracker, 2017” and FanRuan ranks No. 1 in China’s BI market
share;
2017
Sales reach278 million yuan, maintaing a high growth rate for consecutive years;
FanRuan releases FineReport V9.0featured by openness, intelligence and non-exclusiveness;
FanRuan holds a roadshow in the 50th city, marking the half-completion of the milestone of
100-city Roadshow;
R&D team wins the second place in business team rankings at Analysys OLAP Algorithm
Contest;

©FanRuan Software Co., Ltd. 136 / 138
FanRuan is the only Chinese vendor selected by " Gartner Market Guide for Traditional
Enterprise Reporting Platforms 2017;"
The Visual Plug-in Development Contest organized by FanRuan attracts 2,038 participants,
topping the previous record;
FanRuan participates in GuiYang International Big Data Expo and attracts many exhibitors to
feedback product experience;
FanRuan offers 16 training sessions in 16 cities in April. A total of more than 130 training
sessions are held throughout the year;January
CEO Office opens a hotline that is always on standby 24 hours a day, 7 days a week, for handling
customer complaints;
2016
FanRuan win “CEIA China IT Award for Best BI Solution Vendors”;
FanRuan successfully holds Pharmaceutical Industry IT Value Summit, with CIOs from 120
domestic leading pharmaceutical enterprises attending for discussion and views sharing;
FanRuan releases FineBI V4.0, which is awarded as the Most Innovative Product of the Year 2016
by many institutions;
FanRuan starts BI benchmarking roadshows, raising the curtain of 100-city roadshows;

©FanRuan Software Co., Ltd. 137 / 138
FanRuan starts using a new brand image and domain 'fanruan.com,' and proposes a new brand
connotation of “translating data into productivity”;
2015
With sales hitting 100 million yuan, FanRuan moves into the ranks of Billion Yuan Software Club;
2014
FanRuan switches into the fast lane of business growth, with a commitment to becoming a
leading BI vendor and analytics platform;
2013
FanRuan releases FineBI V1.0, setting off a wave of new-type BI;
2012
FineReport ranks No. 1 in terms of brand reputation and market share in the BI industry, and
become the leading reporting software in China;
2010
FanRuan has establishes partnership with over 1000 clients and becomes a champion in
reporting software;
2008
FanRuan releases FineReport V6.0, striding into a new development stage;
©FanRuan Software Co., Ltd. 138 / 138
2006
FanRuan Software Co., Ltd is incorporated. In the same year, FineReport V3.0 is launched,
stunning the whole market of data analysis;
-END-


