Frontal Object Perception using radar and mono-vision R. Omar Chavez-Garcia * , Trung-Dung Vu * , Julien Burlet † , Olivier Aycard * * University of Grenoble1 - FRANCE Email: [email protected]† TRW Conekt, Birmingham - ENGLAND Email: [email protected]Abstract—In this paper, we detail a complete software archi- tecture of a key task that an intelligent vehicle has to deal with: frontal object perception. This task is solved by processing raw data of a radar and a mono-camera to detect and track moving objects. Data sets obtained from highways, country roads and urban areas were used to test the proposed method. Several experiments were conducted to show that the proposed method obtains a better environment representation, i.e., reduces the false alarms and miss detections from individual sensor evidence. I. I NTRODUCTION Perceiving or understanding the environment surrounding a vehicle is a very important step in driving assistance systems or autonomous vehicles. Recently, there have been considerable research efforts focusing on specific aspect of this problem [1], [2] in the frame of several european projects 1 . However, for many aspects of perception, there still remains many open questions. In the frame of the european project Interactive, the goal is to In this paper, we detail the software architecture of one module of this architecture: the frontal object perception is dedicated to detect and track the moving objects located in front of the ego-vehicle. This module uses the raw data of a radar and a camera as inputs. Fig. 1. General architecture of the Frontal Object Perception. Figure 1 shows the general architecture of the frontal object perception module for one of the ego-vehicle involved in the interactIVe project. This architecture is composed of three levels of processing that are described in the next sections: 1) first of all, raw data of radar and mono-vision are processed to detect moving objects. Actually, these 1 http://www.intersafe-2.eu, www.prevent-ip.org 1 http://www.interactive-ip.eu processings are done in two steps: first of all, each sensor delivers informations about moving objects that it has detected. In a second step, and secondly these informations are used to detect moving pedestrians and moving vehicles. 2) the Fusion processing which takes as an input the list of the detected objects (pedestrians and vehicles) provided by both kind of sensors and delivers a fused list of detected objects. In most of the works related to fusion [3] [4], the fusion is done after tracking. The main advantage of this strategy is that the fusion could be designed indepen- dently of the sensors. This is very convenient to design generic methods to perform sensor data fusion. On the other hand, high level fusion has several drawbacks: to be able to perform fusion, we have to wait until an object is tracked which can take several frames. Another important problem is when an object is detected, it is sometimes not created for tracking due to numerous false alarms or mis-detections. To overcome these diffi- culties, we will perform the fusion at the detection level (ie, before tracking). The basic idea is to perform fusion using the list of detected objects provided by each sensor to decrease the level of false alarms or mis-detections and hence to improve the quality of tracking. 3) the Tracking processing module which takes as an input the fused list of objects and delivers a list of tracked objects. The rest of the paper is organized as follows. In the next section, we present the demonstrator used for this work and sensors installed on it. In section III, we describe the sensor processing done with radar and mono-vision. In sections IV and V, we detail our work on fusion and tracking. Experimen- tal results are reported in section VI. We conclude this work in section VII. II. VEHICLE DEMONSTRATOR A car demonstrator part of the interactIVe European project is used in order to obtain data sets from different situations. The process of data acquisition focus in three scenarios: highway, countryside, and urban areas. The TRW Conekt demonstrator car is a Fiat Stilo previously used in the PReVENT-SASPENCE project. It is equipped with a sensor
Transcript
Frontal Object Perception using radar andmono-vision
R. Omar Chavez-Garcia∗, Trung-Dung Vu∗, Julien Burlet†, Olivier Aycard∗∗University of Grenoble1 - FRANCEEmail: [email protected]
Abstract—In this paper, we detail a complete software archi-tecture of a key task that an intelligent vehicle has to deal with:frontal object perception. This task is solved by processing rawdata of a radar and a mono-camera to detect and track movingobjects. Data sets obtained from highways, country roads andurban areas were used to test the proposed method. Severalexperiments were conducted to show that the proposed methodobtains a better environment representation, i.e., reduces the falsealarms and miss detections from individual sensor evidence.
I. INTRODUCTION
Perceiving or understanding the environment surrounding avehicle is a very important step in driving assistance systems orautonomous vehicles. Recently, there have been considerableresearch efforts focusing on specific aspect of this problem [1],[2] in the frame of several european projects1.
However, for many aspects of perception, there still remainsmany open questions. In the frame of the european projectInteractive, the goal is to
In this paper, we detail the software architecture of onemodule of this architecture: the frontal object perception isdedicated to detect and track the moving objects located infront of the ego-vehicle. This module uses the raw data of aradar and a camera as inputs.
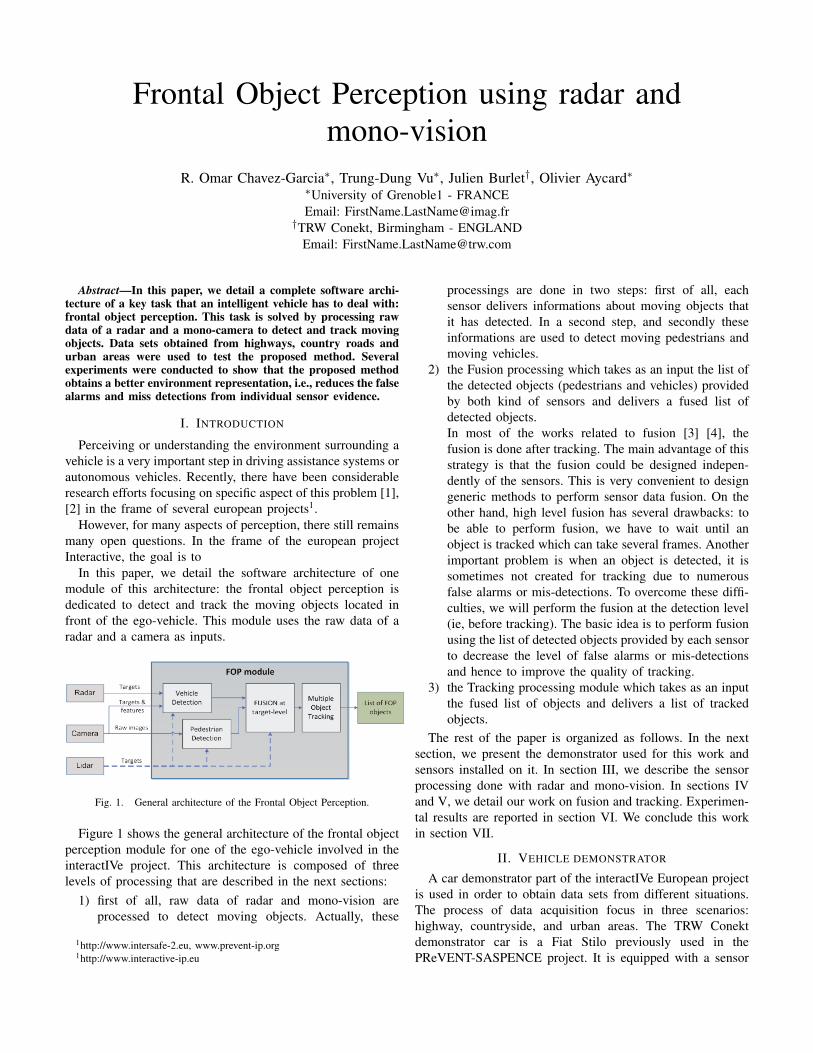
Fig. 1. General architecture of the Frontal Object Perception.
Figure 1 shows the general architecture of the frontal objectperception module for one of the ego-vehicle involved in theinteractIVe project. This architecture is composed of threelevels of processing that are described in the next sections:
1) first of all, raw data of radar and mono-vision areprocessed to detect moving objects. Actually, these
processings are done in two steps: first of all, eachsensor delivers informations about moving objects thatit has detected. In a second step, and secondly theseinformations are used to detect moving pedestrians andmoving vehicles.
2) the Fusion processing which takes as an input the list ofthe detected objects (pedestrians and vehicles) providedby both kind of sensors and delivers a fused list ofdetected objects.In most of the works related to fusion [3] [4], thefusion is done after tracking. The main advantage of thisstrategy is that the fusion could be designed indepen-dently of the sensors. This is very convenient to designgeneric methods to perform sensor data fusion. On theother hand, high level fusion has several drawbacks: tobe able to perform fusion, we have to wait until anobject is tracked which can take several frames. Anotherimportant problem is when an object is detected, it issometimes not created for tracking due to numerousfalse alarms or mis-detections. To overcome these diffi-culties, we will perform the fusion at the detection level(ie, before tracking). The basic idea is to perform fusionusing the list of detected objects provided by each sensorto decrease the level of false alarms or mis-detectionsand hence to improve the quality of tracking.
3) the Tracking processing module which takes as an inputthe fused list of objects and delivers a list of trackedobjects.
The rest of the paper is organized as follows. In the nextsection, we present the demonstrator used for this work andsensors installed on it. In section III, we describe the sensorprocessing done with radar and mono-vision. In sections IVand V, we detail our work on fusion and tracking. Experimen-tal results are reported in section VI. We conclude this workin section VII.
II. VEHICLE DEMONSTRATOR
A car demonstrator part of the interactIVe European projectis used in order to obtain data sets from different situations.The process of data acquisition focus in three scenarios:highway, countryside, and urban areas. The TRW Conektdemonstrator car is a Fiat Stilo previously used in thePReVENT-SASPENCE project. It is equipped with a sensor
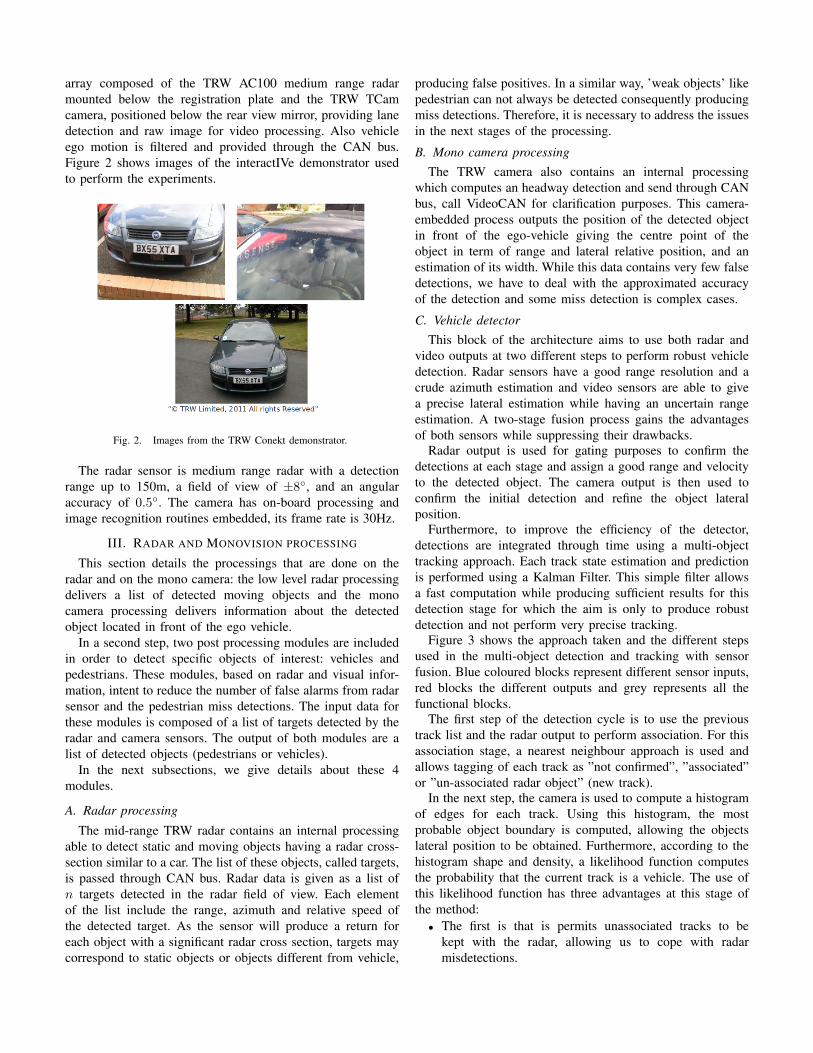
array composed of the TRW AC100 medium range radarmounted below the registration plate and the TRW TCamcamera, positioned below the rear view mirror, providing lanedetection and raw image for video processing. Also vehicleego motion is filtered and provided through the CAN bus.Figure 2 shows images of the interactIVe demonstrator usedto perform the experiments.
Fig. 2. Images from the TRW Conekt demonstrator.
The radar sensor is medium range radar with a detectionrange up to 150m, a field of view of ±8, and an angularaccuracy of 0.5. The camera has on-board processing andimage recognition routines embedded, its frame rate is 30Hz.
III. RADAR AND MONOVISION PROCESSING
This section details the processings that are done on theradar and on the mono camera: the low level radar processingdelivers a list of detected moving objects and the monocamera processing delivers information about the detectedobject located in front of the ego vehicle.
In a second step, two post processing modules are includedin order to detect specific objects of interest: vehicles andpedestrians. These modules, based on radar and visual infor-mation, intent to reduce the number of false alarms from radarsensor and the pedestrian miss detections. The input data forthese modules is composed of a list of targets detected by theradar and camera sensors. The output of both modules are alist of detected objects (pedestrians or vehicles).
In the next subsections, we give details about these 4modules.
A. Radar processing
The mid-range TRW radar contains an internal processingable to detect static and moving objects having a radar cross-section similar to a car. The list of these objects, called targets,is passed through CAN bus. Radar data is given as a list ofn targets detected in the radar field of view. Each elementof the list include the range, azimuth and relative speed ofthe detected target. As the sensor will produce a return foreach object with a significant radar cross section, targets maycorrespond to static objects or objects different from vehicle,
producing false positives. In a similar way, ’weak objects’ likepedestrian can not always be detected consequently producingmiss detections. Therefore, it is necessary to address the issuesin the next stages of the processing.
B. Mono camera processingThe TRW camera also contains an internal processing
which computes an headway detection and send through CANbus, call VideoCAN for clarification purposes. This camera-embedded process outputs the position of the detected objectin front of the ego-vehicle giving the centre point of theobject in term of range and lateral relative position, and anestimation of its width. While this data contains very few falsedetections, we have to deal with the approximated accuracyof the detection and some miss detection is complex cases.
C. Vehicle detectorThis block of the architecture aims to use both radar and
video outputs at two different steps to perform robust vehicledetection. Radar sensors have a good range resolution and acrude azimuth estimation and video sensors are able to givea precise lateral estimation while having an uncertain rangeestimation. A two-stage fusion process gains the advantagesof both sensors while suppressing their drawbacks.
Radar output is used for gating purposes to confirm thedetections at each stage and assign a good range and velocityto the detected object. The camera output is then used toconfirm the initial detection and refine the object lateralposition.
Furthermore, to improve the efficiency of the detector,detections are integrated through time using a multi-objecttracking approach. Each track state estimation and predictionis performed using a Kalman Filter. This simple filter allowsa fast computation while producing sufficient results for thisdetection stage for which the aim is only to produce robustdetection and not perform very precise tracking.
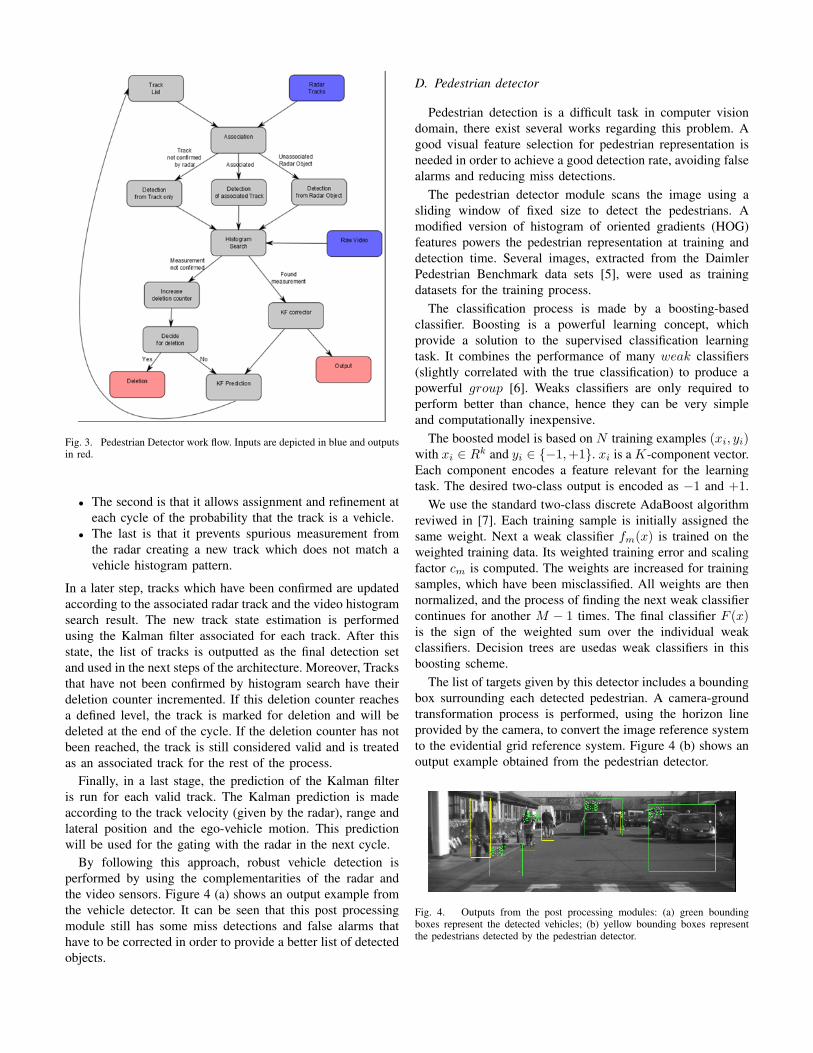
Figure 3 shows the approach taken and the different stepsused in the multi-object detection and tracking with sensorfusion. Blue coloured blocks represent different sensor inputs,red blocks the different outputs and grey represents all thefunctional blocks.
The first step of the detection cycle is to use the previoustrack list and the radar output to perform association. For thisassociation stage, a nearest neighbour approach is used andallows tagging of each track as ”not confirmed”, ”associated”or ”un-associated radar object” (new track).
In the next step, the camera is used to compute a histogramof edges for each track. Using this histogram, the mostprobable object boundary is computed, allowing the objectslateral position to be obtained. Furthermore, according to thehistogram shape and density, a likelihood function computesthe probability that the current track is a vehicle. The use ofthis likelihood function has three advantages at this stage ofthe method:• The first is that is permits unassociated tracks to be
kept with the radar, allowing us to cope with radarmisdetections.
Fig. 3. Pedestrian Detector work flow. Inputs are depicted in blue and outputsin red.
• The second is that it allows assignment and refinement ateach cycle of the probability that the track is a vehicle.
• The last is that it prevents spurious measurement fromthe radar creating a new track which does not match avehicle histogram pattern.
In a later step, tracks which have been confirmed are updatedaccording to the associated radar track and the video histogramsearch result. The new track state estimation is performedusing the Kalman filter associated for each track. After thisstate, the list of tracks is outputted as the final detection setand used in the next steps of the architecture. Moreover, Tracksthat have not been confirmed by histogram search have theirdeletion counter incremented. If this deletion counter reachesa defined level, the track is marked for deletion and will bedeleted at the end of the cycle. If the deletion counter has notbeen reached, the track is still considered valid and is treatedas an associated track for the rest of the process.
Finally, in a last stage, the prediction of the Kalman filteris run for each valid track. The Kalman prediction is madeaccording to the track velocity (given by the radar), range andlateral position and the ego-vehicle motion. This predictionwill be used for the gating with the radar in the next cycle.
By following this approach, robust vehicle detection isperformed by using the complementarities of the radar andthe video sensors. Figure 4 (a) shows an output example fromthe vehicle detector. It can be seen that this post processingmodule still has some miss detections and false alarms thathave to be corrected in order to provide a better list of detectedobjects.
D. Pedestrian detector
Pedestrian detection is a difficult task in computer visiondomain, there exist several works regarding this problem. Agood visual feature selection for pedestrian representation isneeded in order to achieve a good detection rate, avoiding falsealarms and reducing miss detections.
The pedestrian detector module scans the image using asliding window of fixed size to detect the pedestrians. Amodified version of histogram of oriented gradients (HOG)features powers the pedestrian representation at training anddetection time. Several images, extracted from the DaimlerPedestrian Benchmark data sets [5], were used as trainingdatasets for the training process.
The classification process is made by a boosting-basedclassifier. Boosting is a powerful learning concept, whichprovide a solution to the supervised classification learningtask. It combines the performance of many weak classifiers(slightly correlated with the true classification) to produce apowerful group [6]. Weaks classifiers are only required toperform better than chance, hence they can be very simpleand computationally inexpensive.
The boosted model is based on N training examples (xi, yi)with xi ∈ Rk and yi ∈ −1,+1. xi is a K-component vector.Each component encodes a feature relevant for the learningtask. The desired two-class output is encoded as −1 and +1.
We use the standard two-class discrete AdaBoost algorithmreviwed in [7]. Each training sample is initially assigned thesame weight. Next a weak classifier fm(x) is trained on theweighted training data. Its weighted training error and scalingfactor cm is computed. The weights are increased for trainingsamples, which have been misclassified. All weights are thennormalized, and the process of finding the next weak classifiercontinues for another M − 1 times. The final classifier F (x)is the sign of the weighted sum over the individual weakclassifiers. Decision trees are usedas weak classifiers in thisboosting scheme.
The list of targets given by this detector includes a boundingbox surrounding each detected pedestrian. A camera-groundtransformation process is performed, using the horizon lineprovided by the camera, to convert the image reference systemto the evidential grid reference system. Figure 4 (b) shows anoutput example obtained from the pedestrian detector.
Fig. 4. Outputs from the post processing modules: (a) green boundingboxes represent the detected vehicles; (b) yellow bounding boxes representthe pedestrians detected by the pedestrian detector.
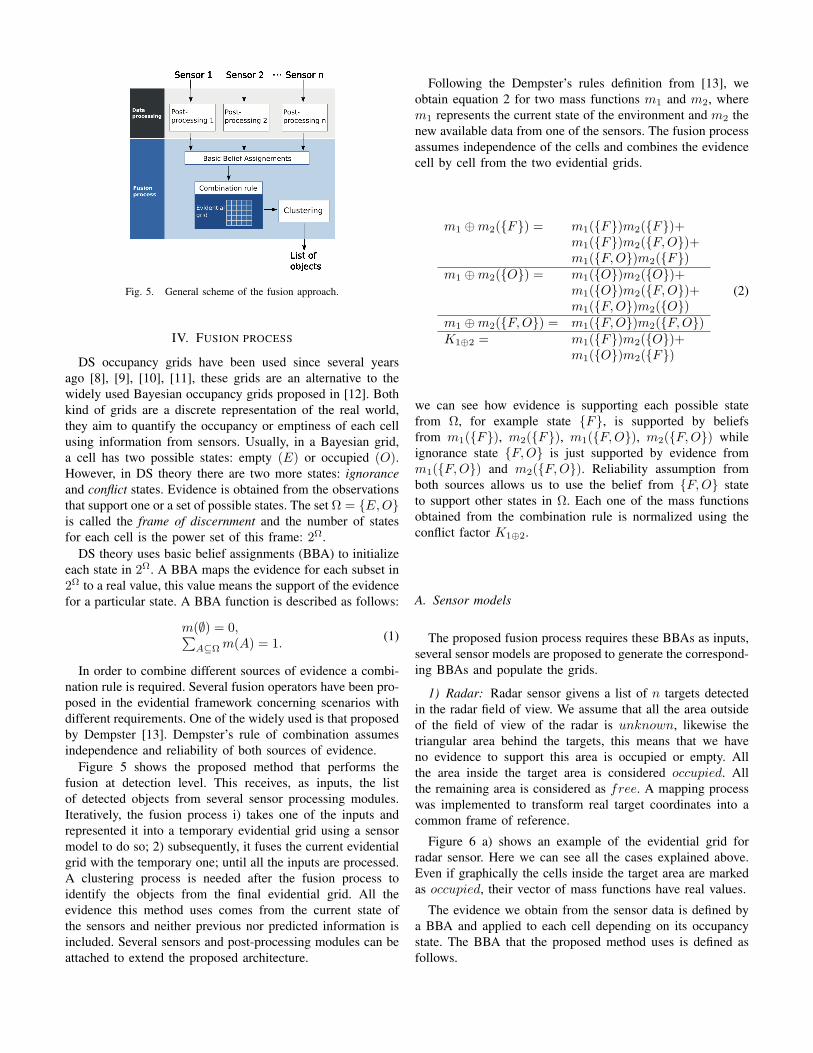
Fig. 5. General scheme of the fusion approach.
IV. FUSION PROCESS
DS occupancy grids have been used since several yearsago [8], [9], [10], [11], these grids are an alternative to thewidely used Bayesian occupancy grids proposed in [12]. Bothkind of grids are a discrete representation of the real world,they aim to quantify the occupancy or emptiness of each cellusing information from sensors. Usually, in a Bayesian grid,a cell has two possible states: empty (E) or occupied (O).However, in DS theory there are two more states: ignoranceand conflict states. Evidence is obtained from the observationsthat support one or a set of possible states. The set Ω = E,Ois called the frame of discernment and the number of statesfor each cell is the power set of this frame: 2Ω.
DS theory uses basic belief assignments (BBA) to initializeeach state in 2Ω. A BBA maps the evidence for each subset in2Ω to a real value, this value means the support of the evidencefor a particular state. A BBA function is described as follows:
m(∅) = 0,∑A⊆Ω m(A) = 1.
(1)
In order to combine different sources of evidence a combi-nation rule is required. Several fusion operators have been pro-posed in the evidential framework concerning scenarios withdifferent requirements. One of the widely used is that proposedby Dempster [13]. Dempster’s rule of combination assumesindependence and reliability of both sources of evidence.
Figure 5 shows the proposed method that performs thefusion at detection level. This receives, as inputs, the listof detected objects from several sensor processing modules.Iteratively, the fusion process i) takes one of the inputs andrepresented it into a temporary evidential grid using a sensormodel to do so; 2) subsequently, it fuses the current evidentialgrid with the temporary one; until all the inputs are processed.A clustering process is needed after the fusion process toidentify the objects from the final evidential grid. All theevidence this method uses comes from the current state ofthe sensors and neither previous nor predicted information isincluded. Several sensors and post-processing modules can beattached to extend the proposed architecture.
Following the Dempster’s rules definition from [13], weobtain equation 2 for two mass functions m1 and m2, wherem1 represents the current state of the environment and m2 thenew available data from one of the sensors. The fusion processassumes independence of the cells and combines the evidencecell by cell from the two evidential grids.
m1 ⊕m2(F) = m1(F)m2(F)+m1(F)m2(F,O)+m1(F,O)m2(F)
m1 ⊕m2(O) = m1(O)m2(O)+m1(O)m2(F,O)+m1(F,O)m2(O)
m1 ⊕m2(F,O) = m1(F,O)m2(F,O)K1⊕2 = m1(F)m2(O)+
m1(O)m2(F)
(2)
we can see how evidence is supporting each possible statefrom Ω, for example state F, is supported by beliefsfrom m1(F), m2(F), m1(F,O), m2(F,O) whileignorance state F,O is just supported by evidence fromm1(F,O) and m2(F,O). Reliability assumption fromboth sources allows us to use the belief from F,O stateto support other states in Ω. Each one of the mass functionsobtained from the combination rule is normalized using theconflict factor K1⊕2.
A. Sensor models
The proposed fusion process requires these BBAs as inputs,several sensor models are proposed to generate the correspond-ing BBAs and populate the grids.
1) Radar: Radar sensor givens a list of n targets detectedin the radar field of view. We assume that all the area outsideof the field of view of the radar is unknown, likewise thetriangular area behind the targets, this means that we haveno evidence to support this area is occupied or empty. Allthe area inside the target area is considered occupied. Allthe remaining area is considered as free. A mapping processwas implemented to transform real target coordinates into acommon frame of reference.
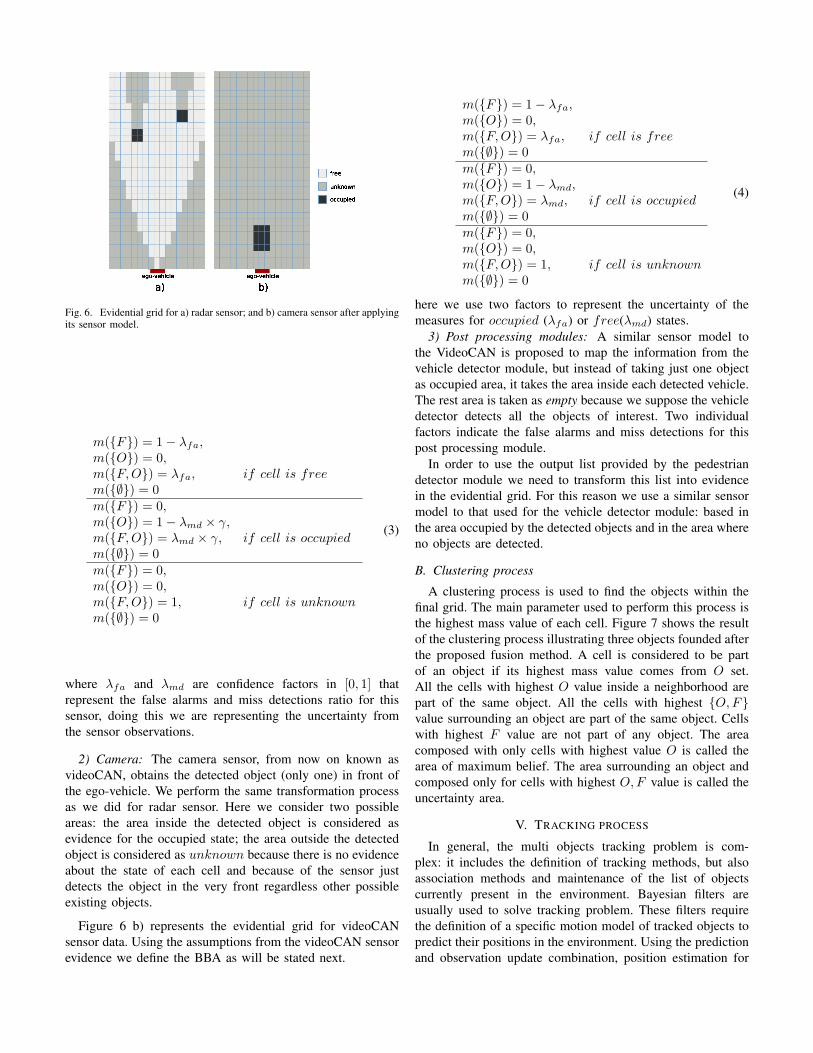
Figure 6 a) shows an example of the evidential grid forradar sensor. Here we can see all the cases explained above.Even if graphically the cells inside the target area are markedas occupied, their vector of mass functions have real values.
The evidence we obtain from the sensor data is defined bya BBA and applied to each cell depending on its occupancystate. The BBA that the proposed method uses is defined asfollows.
Fig. 6. Evidential grid for a) radar sensor; and b) camera sensor after applyingits sensor model.
m(F) = 1− λfa,m(O) = 0,m(F,O) = λfa, if cell is freem(∅) = 0m(F) = 0,m(O) = 1− λmd × γ,m(F,O) = λmd × γ, if cell is occupiedm(∅) = 0m(F) = 0,m(O) = 0,m(F,O) = 1, if cell is unknownm(∅) = 0
(3)
where λfa and λmd are confidence factors in [0, 1] thatrepresent the false alarms and miss detections ratio for thissensor, doing this we are representing the uncertainty fromthe sensor observations.
2) Camera: The camera sensor, from now on known asvideoCAN, obtains the detected object (only one) in front ofthe ego-vehicle. We perform the same transformation processas we did for radar sensor. Here we consider two possibleareas: the area inside the detected object is considered asevidence for the occupied state; the area outside the detectedobject is considered as unknown because there is no evidenceabout the state of each cell and because of the sensor justdetects the object in the very front regardless other possibleexisting objects.
Figure 6 b) represents the evidential grid for videoCANsensor data. Using the assumptions from the videoCAN sensorevidence we define the BBA as will be stated next.
m(F) = 1− λfa,m(O) = 0,m(F,O) = λfa, if cell is freem(∅) = 0m(F) = 0,m(O) = 1− λmd,m(F,O) = λmd, if cell is occupiedm(∅) = 0m(F) = 0,m(O) = 0,m(F,O) = 1, if cell is unknownm(∅) = 0
(4)
here we use two factors to represent the uncertainty of themeasures for occupied (λfa) or free(λmd) states.
3) Post processing modules: A similar sensor model tothe VideoCAN is proposed to map the information from thevehicle detector module, but instead of taking just one objectas occupied area, it takes the area inside each detected vehicle.The rest area is taken as empty because we suppose the vehicledetector detects all the objects of interest. Two individualfactors indicate the false alarms and miss detections for thispost processing module.
In order to use the output list provided by the pedestriandetector module we need to transform this list into evidencein the evidential grid. For this reason we use a similar sensormodel to that used for the vehicle detector module: based inthe area occupied by the detected objects and in the area whereno objects are detected.
B. Clustering process
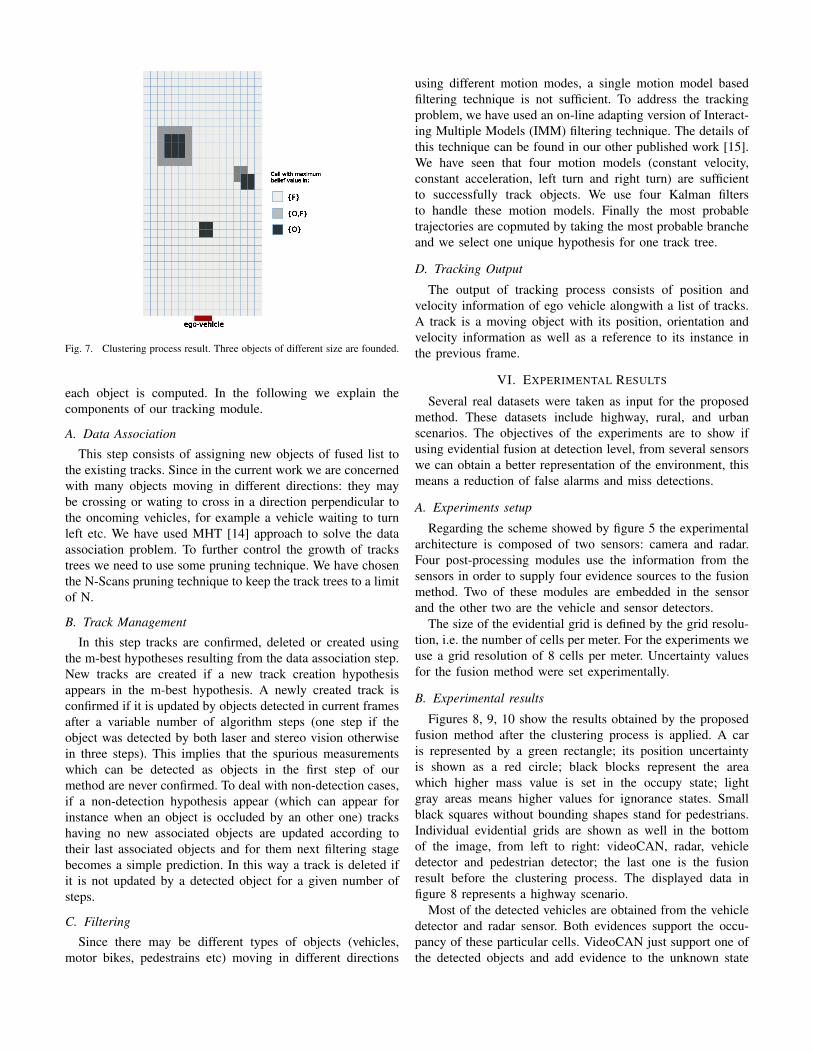
A clustering process is used to find the objects within thefinal grid. The main parameter used to perform this process isthe highest mass value of each cell. Figure 7 shows the resultof the clustering process illustrating three objects founded afterthe proposed fusion method. A cell is considered to be partof an object if its highest mass value comes from O set.All the cells with highest O value inside a neighborhood arepart of the same object. All the cells with highest O,Fvalue surrounding an object are part of the same object. Cellswith highest F value are not part of any object. The areacomposed with only cells with highest value O is called thearea of maximum belief. The area surrounding an object andcomposed only for cells with highest O,F value is called theuncertainty area.
V. TRACKING PROCESS
In general, the multi objects tracking problem is com-plex: it includes the definition of tracking methods, but alsoassociation methods and maintenance of the list of objectscurrently present in the environment. Bayesian filters areusually used to solve tracking problem. These filters requirethe definition of a specific motion model of tracked objects topredict their positions in the environment. Using the predictionand observation update combination, position estimation for
Fig. 7. Clustering process result. Three objects of different size are founded.
each object is computed. In the following we explain thecomponents of our tracking module.
A. Data Association
This step consists of assigning new objects of fused list tothe existing tracks. Since in the current work we are concernedwith many objects moving in different directions: they maybe crossing or wating to cross in a direction perpendicular tothe oncoming vehicles, for example a vehicle waiting to turnleft etc. We have used MHT [14] approach to solve the dataassociation problem. To further control the growth of trackstrees we need to use some pruning technique. We have chosenthe N-Scans pruning technique to keep the track trees to a limitof N.
B. Track Management
In this step tracks are confirmed, deleted or created usingthe m-best hypotheses resulting from the data association step.New tracks are created if a new track creation hypothesisappears in the m-best hypothesis. A newly created track isconfirmed if it is updated by objects detected in current framesafter a variable number of algorithm steps (one step if theobject was detected by both laser and stereo vision otherwisein three steps). This implies that the spurious measurementswhich can be detected as objects in the first step of ourmethod are never confirmed. To deal with non-detection cases,if a non-detection hypothesis appear (which can appear forinstance when an object is occluded by an other one) trackshaving no new associated objects are updated according totheir last associated objects and for them next filtering stagebecomes a simple prediction. In this way a track is deleted ifit is not updated by a detected object for a given number ofsteps.
C. Filtering
Since there may be different types of objects (vehicles,motor bikes, pedestrains etc) moving in different directions
using different motion modes, a single motion model basedfiltering technique is not sufficient. To address the trackingproblem, we have used an on-line adapting version of Interact-ing Multiple Models (IMM) filtering technique. The details ofthis technique can be found in our other published work [15].We have seen that four motion models (constant velocity,constant acceleration, left turn and right turn) are sufficientto successfully track objects. We use four Kalman filtersto handle these motion models. Finally the most probabletrajectories are copmuted by taking the most probable brancheand we select one unique hypothesis for one track tree.
D. Tracking Output
The output of tracking process consists of position andvelocity information of ego vehicle alongwith a list of tracks.A track is a moving object with its position, orientation andvelocity information as well as a reference to its instance inthe previous frame.
VI. EXPERIMENTAL RESULTS
Several real datasets were taken as input for the proposedmethod. These datasets include highway, rural, and urbanscenarios. The objectives of the experiments are to show ifusing evidential fusion at detection level, from several sensorswe can obtain a better representation of the environment, thismeans a reduction of false alarms and miss detections.
A. Experiments setup
Regarding the scheme showed by figure 5 the experimentalarchitecture is composed of two sensors: camera and radar.Four post-processing modules use the information from thesensors in order to supply four evidence sources to the fusionmethod. Two of these modules are embedded in the sensorand the other two are the vehicle and sensor detectors.
The size of the evidential grid is defined by the grid resolu-tion, i.e. the number of cells per meter. For the experiments weuse a grid resolution of 8 cells per meter. Uncertainty valuesfor the fusion method were set experimentally.
B. Experimental results
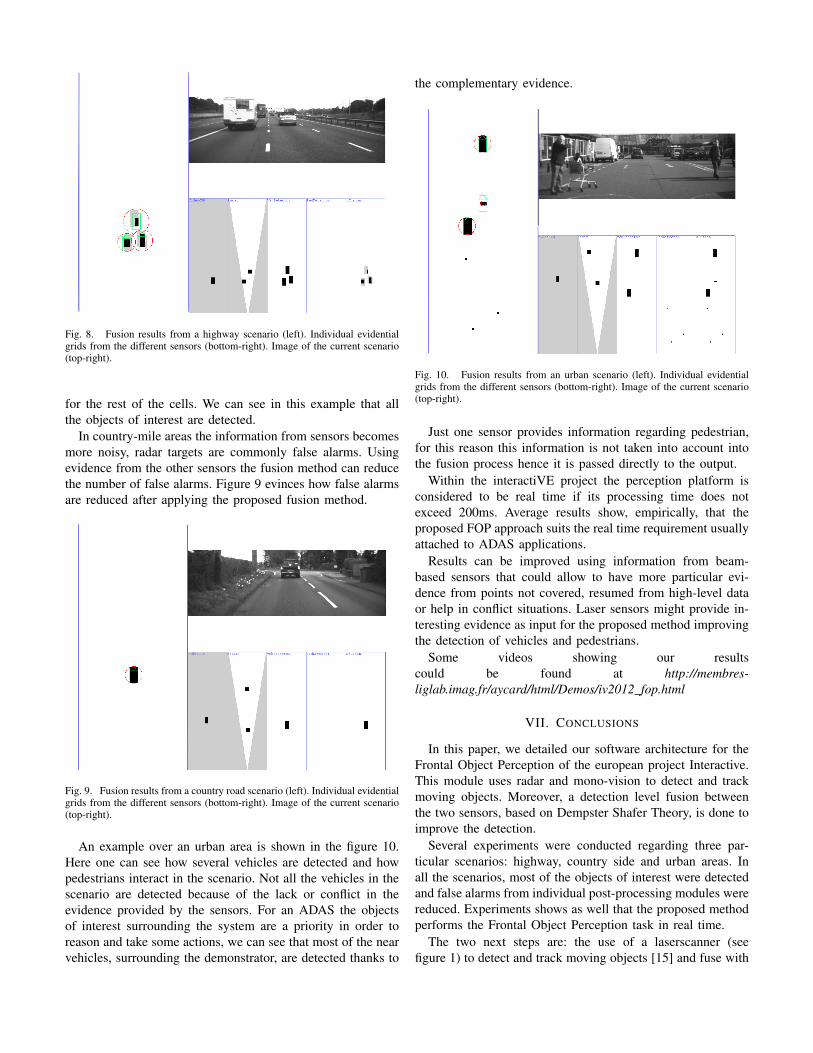
Figures 8, 9, 10 show the results obtained by the proposedfusion method after the clustering process is applied. A caris represented by a green rectangle; its position uncertaintyis shown as a red circle; black blocks represent the areawhich higher mass value is set in the occupy state; lightgray areas means higher values for ignorance states. Smallblack squares without bounding shapes stand for pedestrians.Individual evidential grids are shown as well in the bottomof the image, from left to right: videoCAN, radar, vehicledetector and pedestrian detector; the last one is the fusionresult before the clustering process. The displayed data infigure 8 represents a highway scenario.
Most of the detected vehicles are obtained from the vehicledetector and radar sensor. Both evidences support the occu-pancy of these particular cells. VideoCAN just support one ofthe detected objects and add evidence to the unknown state
Fig. 8. Fusion results from a highway scenario (left). Individual evidentialgrids from the different sensors (bottom-right). Image of the current scenario(top-right).
for the rest of the cells. We can see in this example that allthe objects of interest are detected.
In country-mile areas the information from sensors becomesmore noisy, radar targets are commonly false alarms. Usingevidence from the other sensors the fusion method can reducethe number of false alarms. Figure 9 evinces how false alarmsare reduced after applying the proposed fusion method.
Fig. 9. Fusion results from a country road scenario (left). Individual evidentialgrids from the different sensors (bottom-right). Image of the current scenario(top-right).
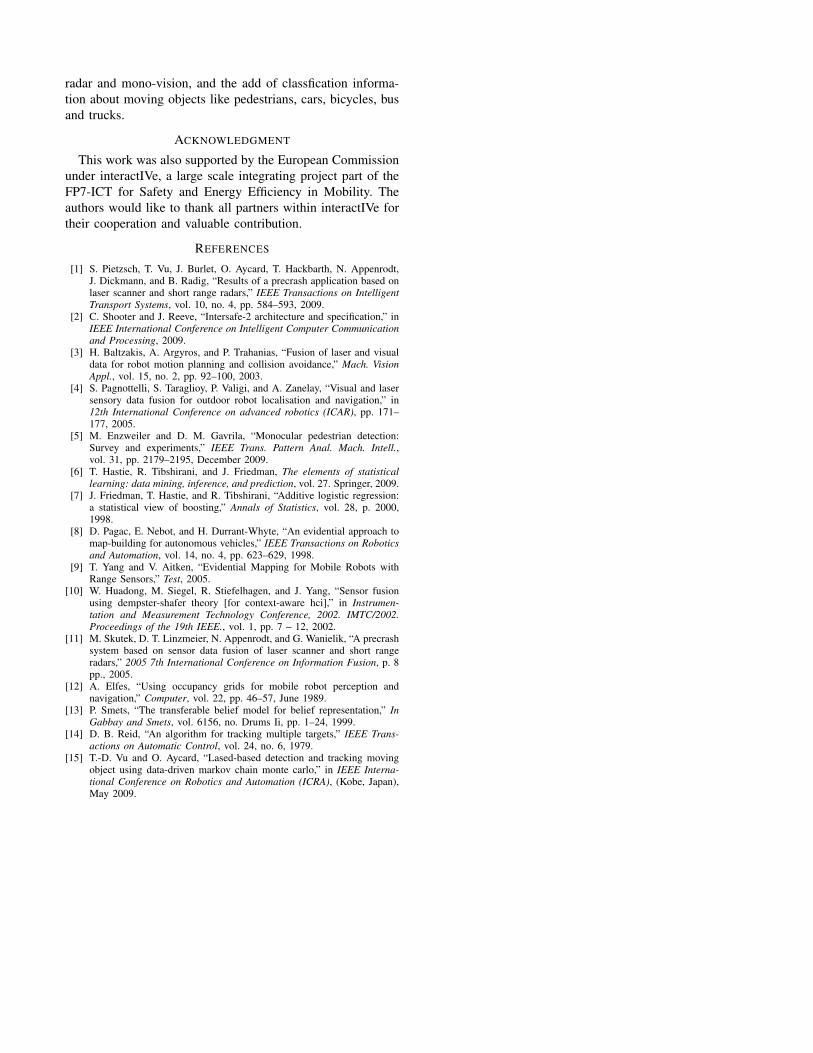
An example over an urban area is shown in the figure 10.Here one can see how several vehicles are detected and howpedestrians interact in the scenario. Not all the vehicles in thescenario are detected because of the lack or conflict in theevidence provided by the sensors. For an ADAS the objectsof interest surrounding the system are a priority in order toreason and take some actions, we can see that most of the nearvehicles, surrounding the demonstrator, are detected thanks to
the complementary evidence.
Fig. 10. Fusion results from an urban scenario (left). Individual evidentialgrids from the different sensors (bottom-right). Image of the current scenario(top-right).
Just one sensor provides information regarding pedestrian,for this reason this information is not taken into account intothe fusion process hence it is passed directly to the output.
Within the interactiVE project the perception platform isconsidered to be real time if its processing time does notexceed 200ms. Average results show, empirically, that theproposed FOP approach suits the real time requirement usuallyattached to ADAS applications.
Results can be improved using information from beam-based sensors that could allow to have more particular evi-dence from points not covered, resumed from high-level dataor help in conflict situations. Laser sensors might provide in-teresting evidence as input for the proposed method improvingthe detection of vehicles and pedestrians.
Some videos showing our resultscould be found at http://membres-liglab.imag.fr/aycard/html/Demos/iv2012 fop.html
VII. CONCLUSIONS
In this paper, we detailed our software architecture for theFrontal Object Perception of the european project Interactive.This module uses radar and mono-vision to detect and trackmoving objects. Moreover, a detection level fusion betweenthe two sensors, based on Dempster Shafer Theory, is done toimprove the detection.
Several experiments were conducted regarding three par-ticular scenarios: highway, country side and urban areas. Inall the scenarios, most of the objects of interest were detectedand false alarms from individual post-processing modules werereduced. Experiments shows as well that the proposed methodperforms the Frontal Object Perception task in real time.
The two next steps are: the use of a laserscanner (seefigure 1) to detect and track moving objects [15] and fuse with
radar and mono-vision, and the add of classfication informa-tion about moving objects like pedestrians, cars, bicycles, busand trucks.
ACKNOWLEDGMENT
This work was also supported by the European Commissionunder interactIVe, a large scale integrating project part of theFP7-ICT for Safety and Energy Efficiency in Mobility. Theauthors would like to thank all partners within interactIVe fortheir cooperation and valuable contribution.
REFERENCES
[1] S. Pietzsch, T. Vu, J. Burlet, O. Aycard, T. Hackbarth, N. Appenrodt,J. Dickmann, and B. Radig, “Results of a precrash application based onlaser scanner and short range radars,” IEEE Transactions on IntelligentTransport Systems, vol. 10, no. 4, pp. 584–593, 2009.
[2] C. Shooter and J. Reeve, “Intersafe-2 architecture and specification,” inIEEE International Conference on Intelligent Computer Communicationand Processing, 2009.
[3] H. Baltzakis, A. Argyros, and P. Trahanias, “Fusion of laser and visualdata for robot motion planning and collision avoidance,” Mach. VisionAppl., vol. 15, no. 2, pp. 92–100, 2003.
[4] S. Pagnottelli, S. Taraglioy, P. Valigi, and A. Zanelay, “Visual and lasersensory data fusion for outdoor robot localisation and navigation,” in12th International Conference on advanced robotics (ICAR), pp. 171–177, 2005.
[5] M. Enzweiler and D. M. Gavrila, “Monocular pedestrian detection:Survey and experiments,” IEEE Trans. Pattern Anal. Mach. Intell.,vol. 31, pp. 2179–2195, December 2009.
[6] T. Hastie, R. Tibshirani, and J. Friedman, The elements of statisticallearning: data mining, inference, and prediction, vol. 27. Springer, 2009.
[7] J. Friedman, T. Hastie, and R. Tibshirani, “Additive logistic regression:a statistical view of boosting,” Annals of Statistics, vol. 28, p. 2000,1998.
[8] D. Pagac, E. Nebot, and H. Durrant-Whyte, “An evidential approach tomap-building for autonomous vehicles,” IEEE Transactions on Roboticsand Automation, vol. 14, no. 4, pp. 623–629, 1998.
[9] T. Yang and V. Aitken, “Evidential Mapping for Mobile Robots withRange Sensors,” Test, 2005.
[10] W. Huadong, M. Siegel, R. Stiefelhagen, and J. Yang, “Sensor fusionusing dempster-shafer theory [for context-aware hci],” in Instrumen-tation and Measurement Technology Conference, 2002. IMTC/2002.Proceedings of the 19th IEEE., vol. 1, pp. 7 – 12, 2002.
[11] M. Skutek, D. T. Linzmeier, N. Appenrodt, and G. Wanielik, “A precrashsystem based on sensor data fusion of laser scanner and short rangeradars,” 2005 7th International Conference on Information Fusion, p. 8pp., 2005.
[12] A. Elfes, “Using occupancy grids for mobile robot perception andnavigation,” Computer, vol. 22, pp. 46–57, June 1989.
[13] P. Smets, “The transferable belief model for belief representation,” InGabbay and Smets, vol. 6156, no. Drums Ii, pp. 1–24, 1999.
[14] D. B. Reid, “An algorithm for tracking multiple targets,” IEEE Trans-actions on Automatic Control, vol. 24, no. 6, 1979.
[15] T.-D. Vu and O. Aycard, “Lased-based detection and tracking movingobject using data-driven markov chain monte carlo,” in IEEE Interna-tional Conference on Robotics and Automation (ICRA), (Kobe, Japan),May 2009.


![Automated Driving: Design and Verify Perception Systems...Velocity: [-9.37 0 0] Size: [0 1.8 0] Radar-based object detector Radar Detector SensorID = 2; Timestamp = 1461634696407521;](https://static.documents.pub/doc/80x56/5f775810e202332f2824eade/automated-driving-design-and-verify-perception-systems-velocity-937-0-0.jpg)


