30
1 M82C-MT M82C-MT World’s Top Global Mega Trends To 2025 and Implications to Business, Society and Cultures
| Date post: | 27-Jul-2015 |
| Category: |
Technology |
| Upload: | pole-numerique-cci-de-bordeaux |
| View: | 276 times |
| Download: | 2 times |

1 M82C-MT M82C-MT
World’s Top Global Mega Trends To 2025 and Implications to Business, Society and Cultures

2 M82C-MT
Global Mega Trends
Urbanization – City as a Customer
Smart is the New Green
Social Trends: Gen Y, Middle Bulge, She-conomy, Geosocialization
Connectivity and Convergence
Bricks and Clicks
Innovating to Zero
New Business Models: Value for Many
Economy: Beyond BRIC: The Next Game Changers
Future Infrastructure Development
Health, Wellness and Well Being
Future of Mobility Future of Energy
Mega Trends are transformative, global forces that define the future world with their far reaching impacts on businesses, societies, economies, cultures, and personal lives.
Definition of Mega Trends That Frost & Sullivan Tracks
Source: Frost & Sullivan analysis.

3 M82C-MT
News Headlines in 2025
Robots have entered our homes for personal use.
Sensory devices guide our everyday lives.
Mobile ;inancial transactions are now in crypto-‐currencies.
Big data has entered the Zettabyte era.
3D printing is commonplace. 4D printing is gaining mainstream acceptance .
High Speed Rail to connect from China to Europe.
There are 6 million autonomous cars in Europe
and North America.
Summer Sale: Low-‐cost holidays in space.

4 M82C-MT
The Mega Trend Matrix Understanding Implications of Key Mega Trends on Global Economy
Note: The size of the bubble represents the scale of opportunity within each Mega Trend. These Mega Trends have been plotted based on quantitative and qualitative reasoning. Source: Frost & Sullivan Analysis
Low Degree of Certainty
Deg
ree
of Im
pact
on
Glo
bal E
cono
my
Low
H
igh
High
Urbanization
Innovating to Zero
Health, Wellness, and
Well-Being
Connectivity and
Convergence
Bricks and Clicks
Infrastructure Development
Smart is the New Green Future of
Energy
Future of Mobility
Social Trends
Economic Trends
New Business Models
Mega Trend Matrix, Global, 2025

5 M82C-MT
Connected Home – 31% Connected Work –15% Connected City – 54%
• Home Automation • Home Energy • Home Health • Home Entertainment
• Mobility -‐ Mobile email, Uni;ied
Communication
• Mobile Working • Enterprise Social
Networking
• eGovernance • eCitizens
• Smart transportation cards, connected cars
• E-‐learning • Mobile banking
Connected Living describes a world in which consumers use many different devices to experience compelling new services that integrate video, voice, and data services to provide access and ubiquitous connectivity
anytime and anywhere.
Future Connected Living Ecosystem Connected life contains three important aspects of connected home, connected city, and connected work
Connected Living Total Market: $730 Billion in 2020

6 M82C-MT 6
QIVICON B2B Business Hub including partners from…
Health (E.g
Tunstall)
Multimedia (E.g
Samsung)
Automation (E.g Belkin)
Security (E.g Pax)
Energy EnBW, Solon
Appliances, electronics (A&E) Miele, Samsung
QIVICON CONNECTED HOME PLATFORM for consumers aggregating service from all partners.
Consumer Homes
B2B
B2B2C
Case Study: Connected Home’s B2B Platform Of Deutsche Telekom A platform-based approach that brings together leading companies �
• First company worldwide to offer a "software as a service’ connected home platform
• Open and independent B2B platform for partners
• Largest range of partners in the connected home space

7 M82C-MT
2000s 2014 2015 2016 2016+ 2016+ 2016 2015 2014 2000s
Eye
Facial
Voice
Touch
Gesture
Gaze controlled
Games
uMoove Mobile Eye
Scroll phones
Tobii Eye Tracking Analytics
cars
PayPal – Pay with Face
Amscreen Face
Scanners
Tactical Identification
System
Google 411 Voice
Search
Windows Speech
Recognition
Siri - Personal Assistant
AMOLED Touch
Screens
Holographic Touchscreen
Kinect Gesture Gaming
Leapmotion Computer
Control
Snapdrago mobile
technology
Sensorization of Things Multi-Factor sensory-based trackers revolutionise the field of personal devices
The radial timeline diagram depicts which products are impacted in the next decade by sensory tracking technology in consumer electronics
Sensory Tracking Technology in
Consumers Devices
Source: Frost & Sullivan Analysis

8 M82C-MT
Gamification - solutions to generate $8 billion globally within a decade, driven by increasing need for consumer engagement
20 %
16 % 14 %
10 % 10 %
Games Social Networking
Enetrtainment Maps/Navigation Video
Consumer App Usage Patterns, Global, 2012
Gamification – a customer interaction approach to design behaviours, develop skills and engage customers
Uses • Mobile and tablet applications • Software programs • Educational tools
Predicted areas of impact • Employee performance • Education • Personal development • Customer engagement platforms
The use of game mechanics and design in non game context to impact engagement and outcome
Current enablers • Mobile • Cloud • Social networking • Location based services
Future enablers • Gesture control • Augmented reality
Source: Deloitte, Google Trends, Frost & Sullivan Analysis.
Gamification Market, Global, 2012-2020, ($ billion)
0,2 0,4 0,9
1,8
3,2
4,9
6,6
7,5 8,3
2012 2013 2014 2015 2016 2017 2018 2019 2020
9 M82C-MT
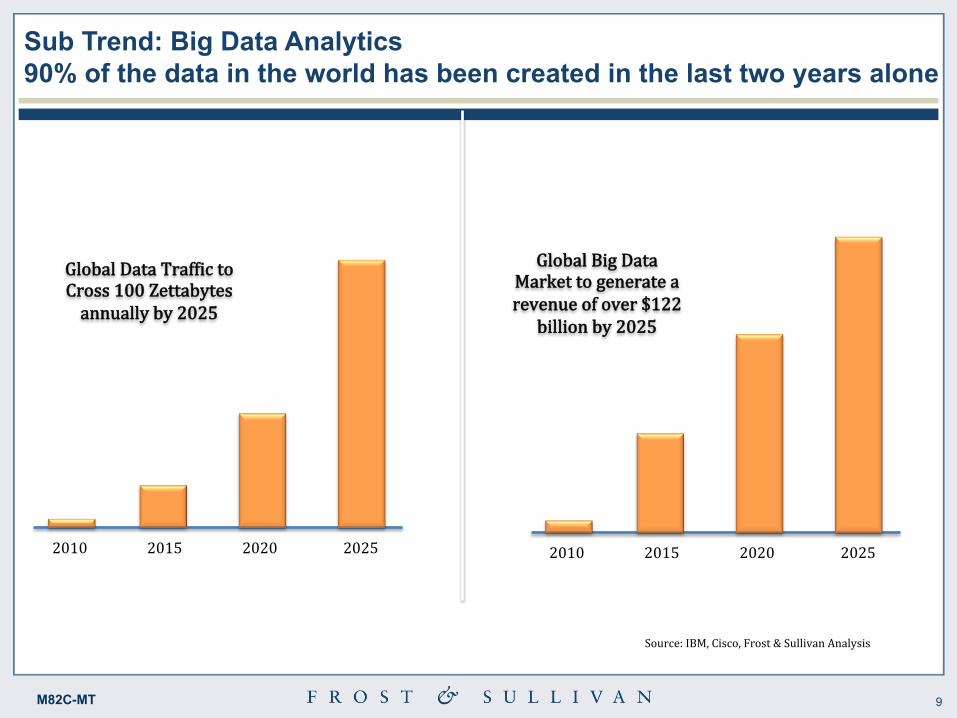
Sub Trend: Big Data Analytics 90% of the data in the world has been created in the last two years alone
Source: IBM, Cisco, Frost & Sullivan Analysis
Global Data Traf;ic in Zettabytes, 2010-‐2025 Global Big Data Market in $ billion, 2010-‐2025
2010 2020 2025 2015
3.56
87.85
122.6
47.37
2010 2020 2025 2015
1.2
34.1
100.2
7.6
Global Data Traf;ic to Cross 100 Zettabytes annually by 2025
Global Big Data Market to generate a revenue of over $122
billion by 2025

10 M82C-MT
Big Data Deluge Digital content is doubling every 18 months
2012 2020
1.2 Zettabyte
100.2 Zettabyte
Database
Data Warehouse
ERPs
CRMs
Systems
Web blogs
Social Media
Audio, Video
Excel, CSV
Online
Structured Data Unstructured Data
Social Sentiment Analysis Data Analytics
Marketing Optimization -
Micromarketing
Open Innovation Discovery and Navigation IT Economics
Security Intelligence
Asset Management Data Visualization
+40% / Year
Types of Data-Enabled Services Big Data Creates New Value Propositions for Businesses
Cloud-connected cars Facebook Personalized Marketing
Nissan is looking at analytics on sensor data
and telematics to improve self-diagnostics
Facebook analyses location data to reach more customers
with personalized, targeted products
Smart Factories Emergency Responses Pepsi’s Latin American
division merged customer, logistics, and manufacturing data to significantly improve
its plant operations
During Superstorm Sandy, 2012, Twitter hashtags
were analysed to find out where power, fuel, food and
water were urgently needed.
Big Data
Big Data is growing at 40% annually
Data Traffic per Year, Global, 2012 and 2020
Source: IBM, Cisco, Frost & Sullivan Analysis
Big Data, Sources & Types of Services, 2014
11 M82C-MT
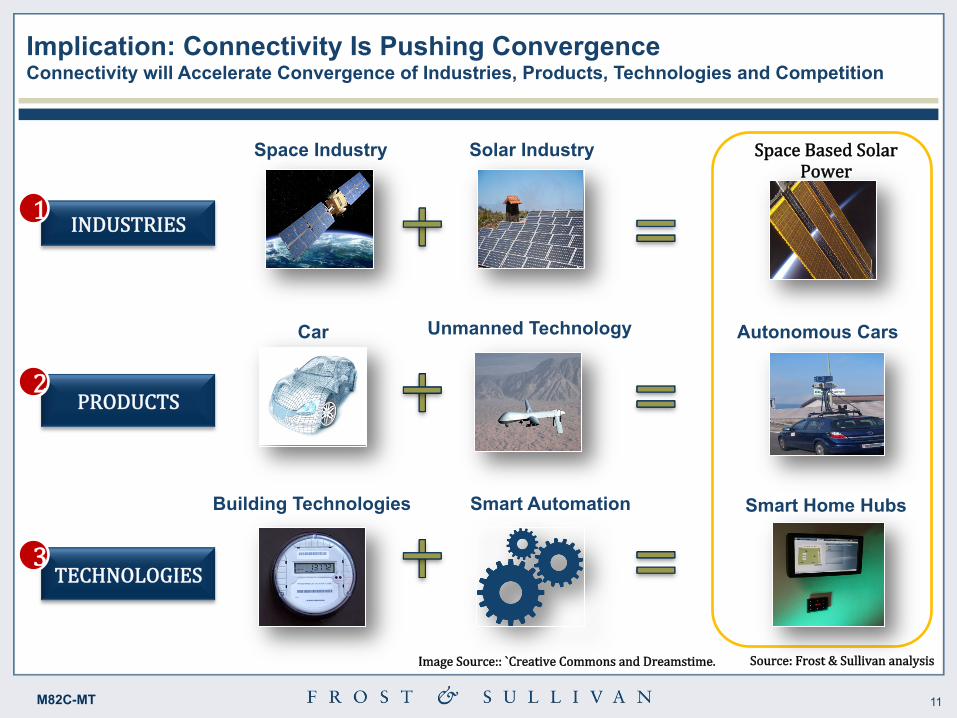
Implication: Connectivity Is Pushing Convergence Connectivity will Accelerate Convergence of Industries, Products, Technologies and Competition
INDUSTRIES
PRODUCTS
Car Unmanned Technology Autonomous Cars
TECHNOLOGIES
Building Technologies Smart Automation Smart Home Hubs
Space Industry Solar Industry Space Based Solar Power
1
3
2
Source: Frost & Sullivan analysis Image Source:: `Creative Commons and Dreamstime.

12 M82C-MT
Convergence is Driving Unconventional Players to Contest for New Markets!
• Google -‐ Nest , Titan Aerospace
• Amazon -‐ Dash, Fire TV
• Facebook – Oculus, Connectivity Labs

13 M82C-MT
Smart
Technology Smart
Buildings Smart Mobility Smart Windows Smart Clouds LEVEL 3
Sensing Mechanism +
Two-‐way Flow of Data
Communication
Smart Chip Smart Lighting LEVEL 2
Basic Sensing Mechanism + One-‐
way Data Communication
Smart Bandages LEVEL 1
Basic Sensing Mechanism
Image Source: Dreamstime and Connected Digital World Source: Frost & Sullivan
A smart product is characterized by an intelligent
sensing technology that is increasingly being integrated with
Internet technologies, thereby allowing the product to react to and
communicate with the changing environment around it. This leads
to optimal operations and improvement in ef;iciency.
Smart is the New Green 3 Levels of Smart Products and Technologies

14 M82C-MT
20,93
14,11
16,65 13,75
9,09
15,26
10,21
Smart Infrastructure3 CAGR: 8.9% (2012-‐2020)
Smart cities To Create Huge Business Opportunities With A Market Value Of $1.5 Trillion By 2020
1
2
4
5
6
Smart Governance and Smart Education2 CAGR: 12.4% (2012-‐2020)
Smart Energy CAGR: 19.6% (2012-‐2020)
Smart Transportation CAGR: 14.8% (2012-‐2020)
Smart Healthcare CAGR: 6.9% (2012-‐2020)
Smart Building CAGR: 8.8% (2012-‐2020)
7 , Smart City Market by Segments,1 Global 2020
Source: Frost & Sullivan analysis.
Note: The graph represent the market share of each segment in the smart city market.
For more information on smart city market sectors please refer to appendix
Smart City Market
2Smart Education includes eLearning services for schools, universities, enterprises, and government entities
1These numbers represent the entire smart solutions eco-‐system in each segment for both urban and non-‐urban panoramas
Smart Security CAGR: 14% (2012-‐2020)
3
3Other Smart Infrastructure such as sensor networks, digital management of water utilities not included in other segments

15 M82C-MT
Global Smart Cities in 2025 More than 26 global cities will be Smart Cities in 2025, and more than 50% of which will be from Europe and North America.
Tianjin Wuhan
Shenzhen
Glasgow
Los Angeles New York
Smart Cities in 2025
Toronto
San Francisco
Vancouver
Paris London Berlin
Barcelona
Amsterdam
Seattle
Tokyo
Singapore
Calgary
Chicago
Vienna
Copenhagen
Oslo
Seoul
Beijing
Helsinki
Sydney
Image Source: Dreamstime and Frost and Sullivan Image Library. Source: Forbes Smart City List, Innovation City Index; specific Smart Project Websites for each city; Frost & Sullivan analysis.
Stockholm
Smart Cities, Global, 2025
Boston
San Diego
Luxembourg Chengdu
Johannesburg
Delhi
Jakarta Select Smart City Projects in 20251
1This list is not exhaustive. The cities highlighted here have implemented smart city projects in at least one of eight smart city aspects discussed in this study
16 M82C-MT
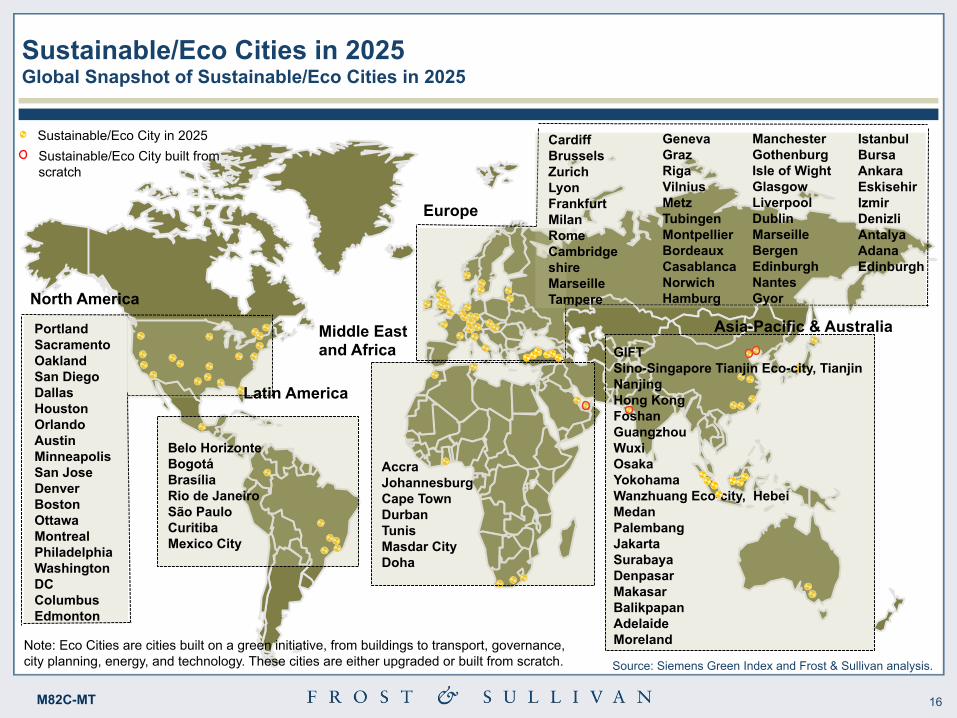
Sustainable/Eco Cities in 2025 Global Snapshot of Sustainable/Eco Cities in 2025
Source: Siemens Green Index and Frost & Sullivan analysis.
Note: Eco Cities are cities built on a green initiative, from buildings to transport, governance, city planning, energy, and technology. These cities are either upgraded or built from scratch.
Sustainable/Eco City in 2025 Sustainable/Eco City built from scratch
Accra Johannesburg Cape Town Durban Tunis Masdar City Doha
Belo Horizonte Bogotá Brasília Rio de Janeiro São Paulo Curitiba Mexico City
Portland Sacramento Oakland San Diego Dallas Houston Orlando Austin Minneapolis San Jose Denver Boston Ottawa Montreal Philadelphia Washington DC Columbus Edmonton
Cardiff Brussels Zurich Lyon Frankfurt Milan Rome Cambridge shire Marseille Tampere
Geneva Graz Riga Vilnius Metz Tubingen Montpellier Bordeaux Casablanca Norwich Hamburg
Manchester Gothenburg Isle of Wight Glasgow Liverpool Dublin Marseille Bergen Edinburgh Nantes Gyor
GIFT Sino-Singapore Tianjin Eco-city, Tianjin Nanjing Hong Kong Foshan Guangzhou Wuxi Osaka Yokohama Wanzhuang Eco-city, Hebei Medan Palembang Jakarta Surabaya Denpasar Makasar Balikpapan Adelaide Moreland
North America
Latin America
Europe
Middle East and Africa
Asia-Pacific & Australia
Istanbul Bursa Ankara Eskisehir Izmir Denizli Antalya Adana Edinburgh

17 M82C-MT
The Next Game Changers in 2025 (Beyond BRICSs) High GDP growth, improved FDIs, and rapid industrialization to give rise to a new lot of emerging countries, beyond BRIC nations, that contend to become next decade’s economic leaders
$2,327 Billion
$635 Billion
$1,041 Billion $2,441
Billion
$653 Billion
$772 Billion $323
Billion
$483 Billion
Mexico Egypt
South Africa
Turkey
Poland
Indonesia
Thailand
Vietnam
Philippines Next Game Changers
Note : The figure denotes GDP at market prices. Forecasts to 2025 have been extrapolated based on Nominal GDP growth rate projections
Source: International Monetary Fund. Oxford Economics, Frost & Sullivan,
$3,071 Billion
$730 Billion
Nigeria
The trillion dollar economies

18 M82C-MT
New Business Models
Examples B2C Co-‐Creation (Eg. Quirky.com)
On-‐Demand Services Digital Media / Online Streaming Collapsing Video Rentals: eg. Net;lix
Pay as you Go Insurance Value for Many
• (Low Cost Models -‐ Tata Nano) • Group Buying (Groupon) • Micro Financing
B2B Online Platforms • E Rental (Workspaces) • E Distribution (eg. Deliv) • E Exchanges • Hypermarkets • E-‐Travel: Concur
Sharing: Corporate Car Sharing
Alliance Based Models Integrator Models (IBM Smarter Planet) Online Stock Trading – traditional brokers
P2P/C2C
Online Retail (Eg. Ebay) • E-‐Auction (eg. Taobao)
Sharing – Car Sharing Peer-‐to-‐peer lending
G2B Open Business Model (Online Bidding of Projects) – (e.g Chicago Open Data Model)
PPP -‐ BOO, BOT, BOM
G2G E-‐Records, E-‐Consultancy -‐ (e.g G2G Information System like NEGIS)
19 M82C-MT
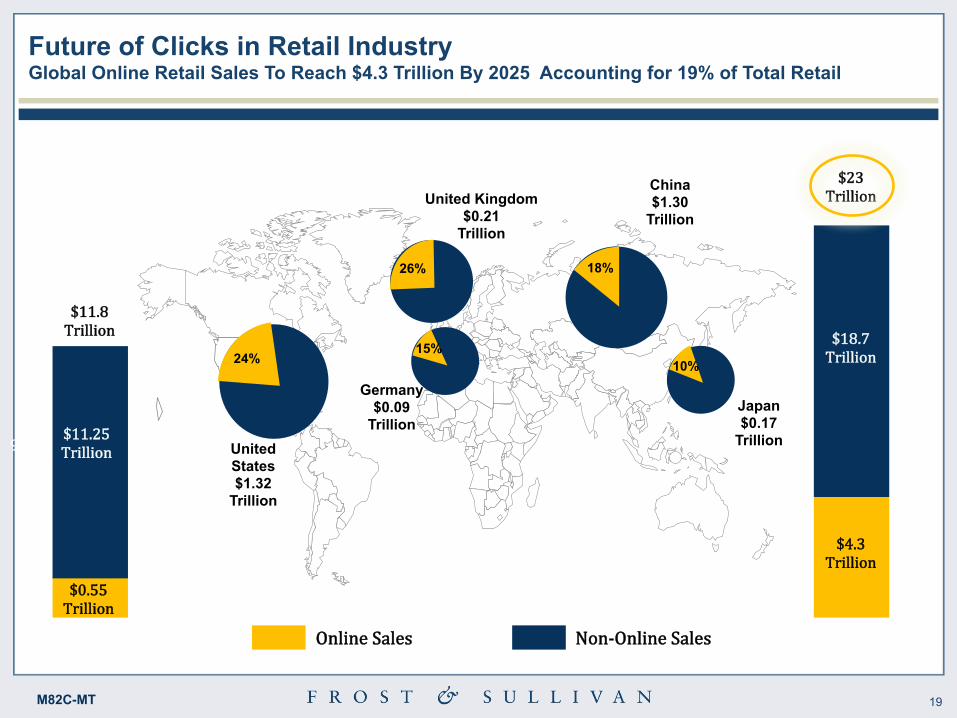
Future of Clicks in Retail Industry Global Online Retail Sales To Reach $4.3 Trillion By 2025 Accounting for 19% of Total Retail
$11.8 Trillion
$23 Trillion
$18.7 Trillion
$11.25 Trillion
$4.3 Trillion
$0.55 Trillion
Online Sales Non-‐Online Sales
5%
95%
19%
81%
2011 2025
United States $1.32
Trillion
24%
18%
China $1.30
Trillion United Kingdom
$0.21 Trillion
Germany $0.09
Trillion Japan $0.17
Trillion
26%
15% 10%
20 M82C-MT
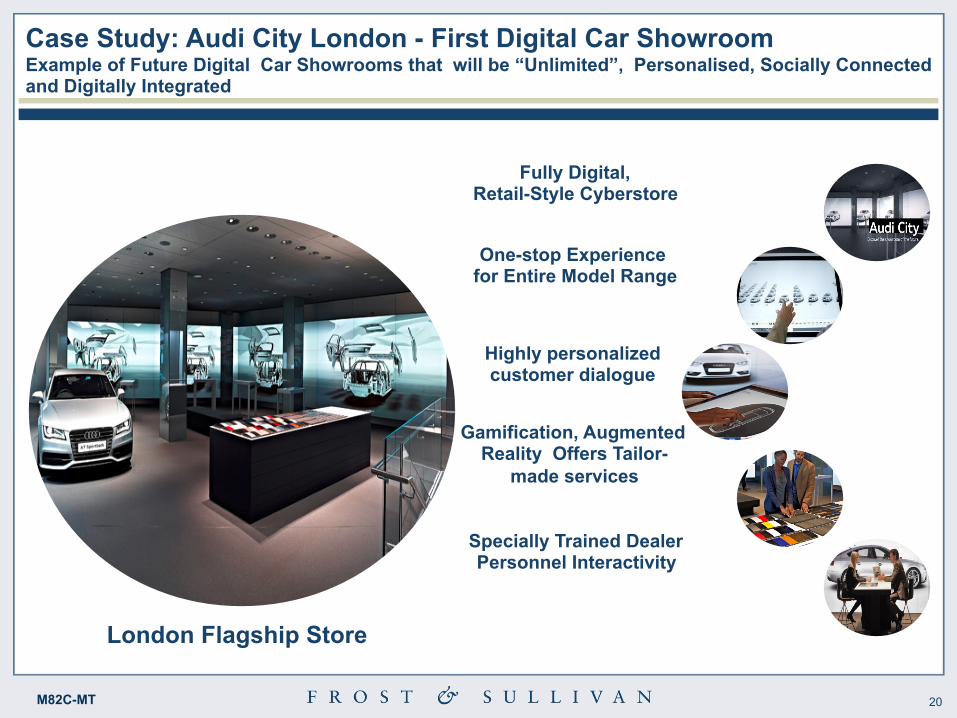
Fully Digital, Retail-Style Cyberstore
One-stop Experience for Entire Model Range
Gamification, Augmented Reality Offers Tailor-
made services
Specially Trained Dealer Personnel Interactivity
London Flagship Store
Highly personalized customer dialogue
Case Study: Audi City London - First Digital Car Showroom Example of Future Digital Car Showrooms that will be “Unlimited”, Personalised, Socially Connected and Digitally Integrated
21 M82C-MT
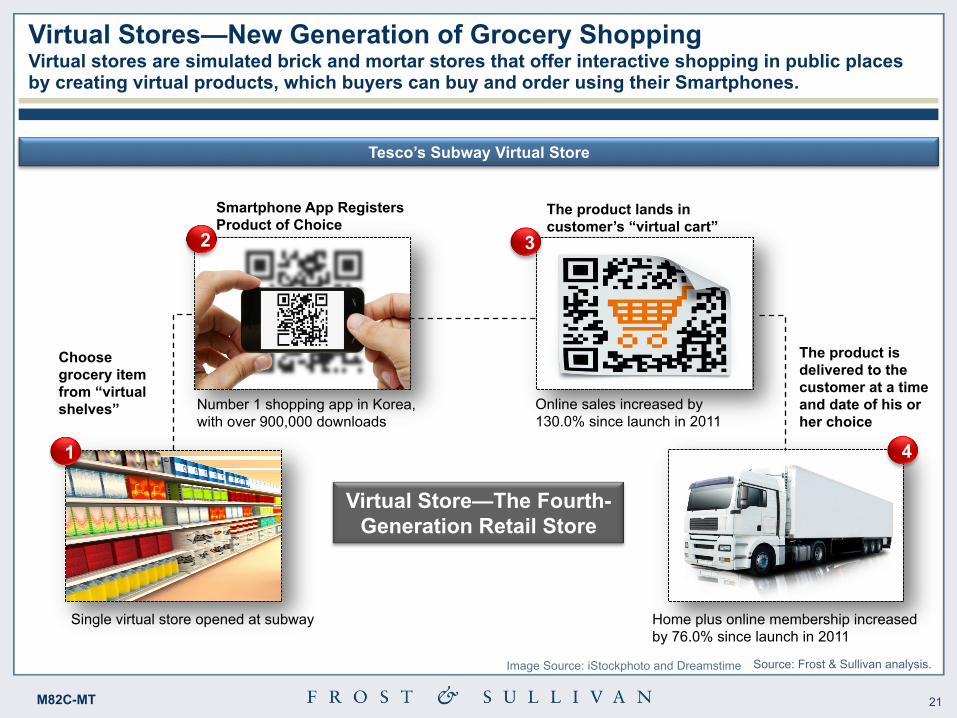
Virtual Stores—New Generation of Grocery Shopping Virtual stores are simulated brick and mortar stores that offer interactive shopping in public places by creating virtual products, which buyers can buy and order using their Smartphones.
1
2 3
4
Choose grocery item from “virtual shelves”
Smartphone App Registers Product of Choice
The product lands in customer’s “virtual cart”
The product is delivered to the customer at a time and date of his or her choice
Number 1 shopping app in Korea, with over 900,000 downloads
Online sales increased by 130.0% since launch in 2011
Home plus online membership increased by 76.0% since launch in 2011
Virtual Store—The Fourth-Generation Retail Store
Tesco’s Subway Virtual Store
Single virtual store opened at subway
Source: Frost & Sullivan analysis. Image Source: iStockphoto and Dreamstime

22 M82C-MT
3D Printing The consumer and commercial products are expected to account for 28% of 3D printing revenues by 2020
$1.1 Billion $7.1 Billion
2009
2020
Global 3D Printing Market, Segment Breakdown, 2009 and 2020
Total Market ($Billion)
By Industry (% Share)
Source: Frost & Sullivan Analysis
• Human Organs • Medical Devices • Body Tissues • Nano-medicine • Pharmaceuticals
Healthcare
• Concept Modeling • Prototypes • Spare Parts • End-use Parts • Tooling
Automotive
• Manufacturing On-demand
• Cutting Tools • Customization • Domestic Production
3D Printed Products in Key Industries
3D printing is a computer-driven additive manufacturing technology used for producing the final product from a
digital model by laying down successive layers of material.
Design Print Finish
Manufacturing
3D printing begins with creating a digital model of the object, usually using CAD
software
The 3D printer slices model into numerous
digital cross-sections, and automatically builds the
model using materials like thermoplastics
The final 3D printed object is then cleaned to remove overhung
material and is polished for final use
28 %
20 % 4 %
12 %
15 %
16 %
5 %
Consumer & Commercial
Automotive
Architecture
Industrial Application
Aerospace & Defense
Medical and Dental
Other

23 M82C-MT
Rise of the Robots Robots priced between $1,566 and $4,699 could enter our personal lives commercializing the personal robots market by 2020
2004 2013
ASIMO = $150,000 LUNA = $1,000
Commercialization of Robotics Steep fall in personal robots ownership prices from $150,000 to $1,000
Source: Frost & Sullivan Analysis
• Non-commercial • Not for sale • Available only on lending
basis
• Commercial • Currently available on auction
basis • Expected to retail between $1,000
and $3,000
Robotics for Elderly Care: Assisted Living
Robots as Teaching Assistants
Robots for household care Robots as Nannies
Robots for companionship
Robots as personal assistants
Robots at Home (Personal Robot Applications)
2010
$1.29 billion
2020
$17.39 billion
Global Personal Robots Market

24 M82C-MT
Executive Summary – Top Ten Transformational Shifts by 2020
12
3
6
5
9
8
4
7 Connected
Living Big Data Clouds
Smart Cities
Sharing Economy
Rise of Personal Robotics Sensorization
of Things
Resource Nexus
Circular Economy
Wearable Computing
3D Printing
While all Mega Trends are important, the selection and raking of these trends indicate which seismic shifts will have particular relevance in shaping the landscape in which the world will evolve this decade.
Impact on Future Products and Services Measured based on most impact on future products and services capabilities resulting in new convergent and
radical devices
Minor Conservative Radical
Gro
wth
Attr
activ
enes
s A
sses
sed
base
d on
mar
ket a
ttrac
tiven
ess
in te
rms
of re
venu
e /
ship
men
t.
Hig
h Lo
w
Source: Frost & Sullivan analysis.
10

25 M82C-MT
Top Industries of the Future
Market Size Potential1 by 2020 ($Billion)
Gro
wth
Pot
entia
l2 (2
012-
2030
)
Market Size Potential1 by 2020 ($Billion)
Gro
wth
Pot
entia
l2 (2
012-
2030
)
Top Mature Industries by 2020 Top Emerging Industries by 2020
1Relative score assigned for potential annual turnover (revenue / shipment) of the industry in 2025 1Measured by qualitative factors that has the scope to create a boom in the industry such as new patents, innovation cycle and industry impact
Source: Bloomberg, Frost and Sullivan Analysis
Oil & Gas
Pharma & Healthcare
Chemical, Materials &
Food
ICT
Automobile
Metals & Mining
Energy, Power
Aerospace & Defence
Engineering & Construction
Electronics Virtual
Commerce Big Data
3D Printing
Cloud Computing
Cyber Security
Managed Services
Wellness Industry
Urban Logistics
Alternative Energy
Waste Management

26 M82C-MT
Some Key Strategic Challenges
1 (Fair) Trade Providing social premium for community development projects; Balance between self-reliance and global market integration; Fostering export dependency
2 Collaborative Ecosystem Shift from social intranet to online collaborative workspaces; Directly embedding collaborative processes to improve the speed and quality of their decisions
3 Economic Shifts Changes in business strategies; China and India to lead the global economy in the near future; Looking Beyond BRICS
4 The Retail Issue Look at internet retailing; look at the format of your retailing offer and how this fits into new trends for micro solutions driven by convenience
5 Complexity Management New value chain partnerships; Integration of product innovations; Facing the impact of adjacent markets
6 Sustainable Development Incorporation of increased interdisciplinary planning; Adopting new business models for collective ownership
7 Where You Live Is your City ‘Smart’ or ‘Sustainable’; What are your City Planning Policies ?
8 Government Inhibition Focus on public-based solutions; Reduced foreign direct investments;
9 Sustainable and Livable Cities
Need for more green initiatives; demand for carbon neutral energy production and advanced spatial planning and urban design solutions
10 Organizational Changes Need for more integrated solutions; Dynamic and flexible working practices; exterior innovations; structural changes
Source: Frost & Sullivan

27 M82C-MT
Macro To Micro
From Macro to Micro: Taking Mega Trends from Information to Strategy Implementation
Mega Trend Selected trends that impact your
business and markets
Sub Trend A sub-‐layer of trends that has a
wide ranging impact
Impact to Your Industry/Region Visualising the roadmap of these critical
forces through scenario-‐building and macro economic forecasts
Impact on Future Product/ Technology/Offer
Analysis of Opportunities and Unmet Needs

28 M82C-MT
Learn More About “New Mega Trends”
Published Book: New Mega Trends Implications for our Future Lives By Sarwant Singh Publisher: Palgrave Macmillan http://www.palgrave.com/products/title.aspx?pid=577423
Join Our Mega Trend Group On Mega Trends: Strategic Planning and Innovation Based on Frost & Sullivan Research
29 M82C-MT
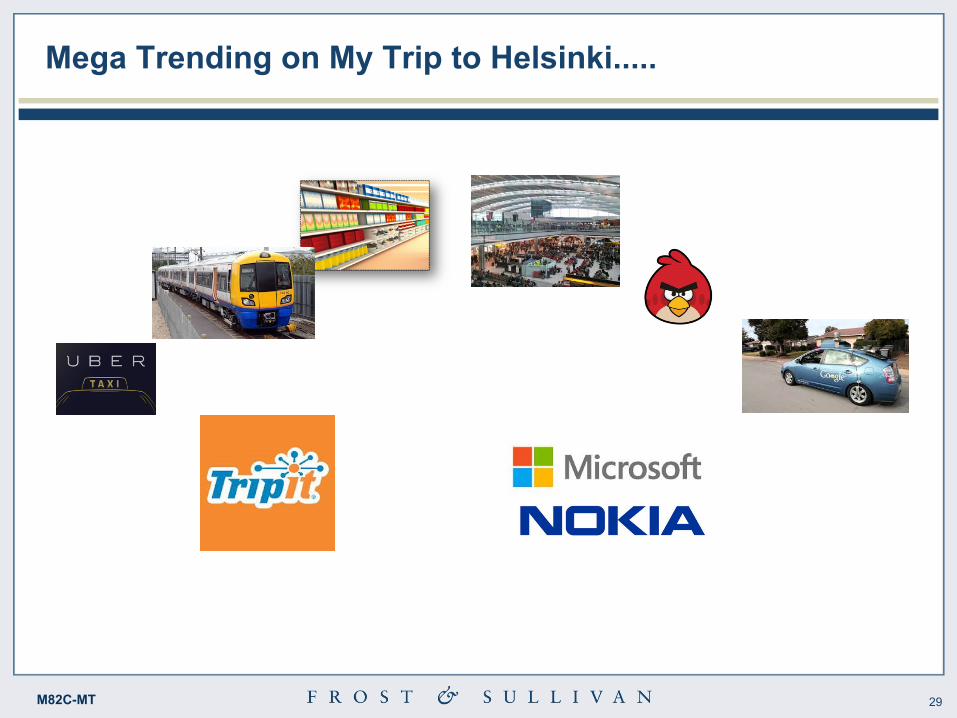
Mega Trending on My Trip to Helsinki.....

30 M82C-MT
Thank You !
Iain Jawad Director Strategic Partnerships
(+44) (0)20 7343 8311 [email protected]
“We Accelerate Growth”


