16
FRUITS AND VEGETABLES MARKET OF BRAZIL

FRUITS AND VEGETABLESMARKET OF BRAZIL

2 3
CONTENT
SECTOR OVERVIEWSTATISTICSRULES AND REGULATIONS OF IMPORTDUTY RATESSALES TAXMINIMUM THRESHOLDSOTHER TAXES AND CUSTOMS
IMPORT ANALYSIS BY MAIN CROPPOTATOONIONSGARLICAPPLESPEARSORANGESGRAPESMANDARINS
CONCLUSION
P 4P 4P 7P 7P 7P 8P 8
P 10P 10P 12P 14P 16P 18P 20P 22P 24
P 26

4 5
GENERAL OVERVIEWAs of July 2014, the population in Brazil was estimated at 202,656,788, making it the world’s 6th most populous country. With Annual population growth of about 1% over the past decade, it is adding nearly 2 million new residents each year. Brazil is by far the largest and most populous country in South America. By exploiting its large labor pool and its vast natural resources, Brazil is South America’s leading economic power and regional leader. The country continues to grow and develop its industrial and agricultural sector. The country’s rapidly expanding middle class has helped Brazil’s economy outweigh that of all other South American countries.
1 Brazil, June 2014, The World Factbook, Central Intelligence Agency2 “Brazil: Competitive Factors in Brazil Affecting U.S. and Brazilian Agricultural Sales in Selected Third Country Markets”, April 2012, United States International Trade Commission
Brazil has the 7th largest economy by nominal GDP in the world and seventh largest by purchasing power parity.
Brazil is one of the fastest-growing major economies in the world with an average annual GDP growth rate of over 5%, reaching an all-time high of 7.5% in 2010.
GDP (real growth rate) recorded 2.3% in 2015, ranking 136 in comparison to the countries of the world.
As of 2013, the Agriculture sector contributed to 5.5% of GDP, while the industry and services sectors contributed to 26.4% and 68.1% respectively. In future decades, Brazil is expected to become one of the five largest economies in the world1.
In 2013, the labor force in Brazil was approximately 107.3 million, ranking number 6 in comparison to the world.
Moreover, the agriculture sector employed around 15.7% of the labor force, while the industry sector and services sectors employed 13.3% and 71% of the labor force respectively1. The fruit industry in Brazil is responsible for 5.6 million jobs, with 34% of this amount related to the agricultural labor force.
Brazil is one of the world’s leading consumers of meats, grains, and oilseeds. It ranks 3rd in global consumption of beef, broilers, turkey, and soybean oil. Average Brazilian per capita consumption exceeds 3,100 calories per day, one of the highest levels among South and Central American countries. Brazilian consumption of almost all agricultural products has been growing in volume. This trend toward higher overall food consumption and increased diversification of diets is driven by population growth, higher income levels, and growth of the middle class. Not only did domestic consumption of almost all agricultural products increase but there was also shift in consumption away from traditional staple foods toward a more diversified diet containing fruits, vegetables, oils, etc. As Brazil’s food consumption continues to rise, agricultural production will have to increase significantly if it is to supply a growing number of consumers in global export markets.
STATISTICSIn 2013, total exports were recorded
at $244.8 billion while total imports were recorded at $241.4 billion, making the country a net importer of products1.
Brazilian agricultural exports are spread out among a large number of destination markets. Brazil’s main export partners are China (17%), US (11.1%), Argentina (7.4%), Netherlands (6.2)1.Other important markets included Japan, Venezuela, and several markets in the Middle East (Iran, Saudi Arabia, and Egypt). Brazilian agricultural exports to members of Mercosul, accounted for less than 2% of the total 2.
Brazil’s top five import sources provided 80% of Brazilian imports. Argentina is the largest agricultural import source, supplying just under 40% of the total. The EU is the second largest supplying around 16% and the United States third with 15%. Uruguay and Paraguay are the fourth and fifth largest import source to Brazil. Argentina was a major supplier of wheat and milled grains, while Paraguay supplied wheat, rice, and corn, and Uruguay supplied wheat, rice, and milled grains.

6 7
Brazil Import Value for All Products (Billion USD) (2009-2013)
Brazil Import Value for Vegetables (Million USD) (2009-2013)
The estimated value of imports for vegetable products in 2013 increased by 26.6% from the previous year and recorded approximately $797 million.
Over the past four years, the average growth rate of Brazilian imports of vegetables was around 32.51%.
Source: United Nations Commodity Trade Statistics Database, UN Comtrade
Source: United Nations Commodity Trade Statistics Database, UN Comtrade
The estimated value of imports for fruit products in 2013 decreased by 0.43% from the previous year and was recorded at approximately $789.558 million.
Over the past four years, the average growth rate of Brazilian vegetables was approximately 18.01%.
Source: United Nations Commodity Trade Statistics Database, UN Comtrade
Brazil Import Value for Fruits (Million USD) (2009-2013)
Source: United Nations Commodity Trade Statistics Database, UN Comtrade
Brazil Import Share for Vegetable and Fruit Products (HS 07-08) (2013)

8 9
MINISTRY OF AGRICULTURE, LIVESTOCK AND FOOD SUPPLY
Administers regulations related to production, marketing, import and export of certain products. Regulates, classifies and inspects imported products entering Brazil. Inspection and clearance of foreign products under MAPA’s jurisdiction at Brazilian ports and airports as well as establishing documents and procedures for such products to enter Brazil.Has authority over: animal, fresh fruit and vegetables, alcoholic beverages, juices, grains, seeds, animal feed and pet food4.
NATIONAL AGENCY OF SANITARY SURVEILLANCE-ANVISA
An independent agency which is part of the Ministry of Health that aims at protecting human health. Establishes standards and regulations regarding food safety and contaminants.Responsible for the compliance and registration of any food processing facility established in, or exporting to, Brazil.
RULES AND REGULATIONS FOR IMPORTAUTHORITIES INVOLVED IN FOOD INDUSTRY REGULATIONS
IMPORT PROCEDURES
TARIFFS
Implements regulations and inspections of all food products under ANVISA’s competence. Responsible for the clearance and inspection procedures of any food product under ANVISA’s competence at entry ports.Has authority over: mainly processed foods5.
NATIONAL INSTITUTE OF METROLOGY, STANDARDIZATION AND INDUSTRIAL QUALITY -INMETRO
Conducts tests on domestic and imported products (be they industrial or food products) to make sure they meet the specifications of their labels, Brazilian standards and the safety of their packaging materials. Establishes standards for packaging and labeling6.
DEPARTMENT OF CONSUMER PROTECTION AND DEFENSE (DPDC) PROCON
Enforces the Brazilian Consumer Code (CDC), which regulates consumer claims against adulterated food products, incorrect or misleading labels and fraud.
Each Brazilian state in Brazil has an office of the Department of Consumer Protection and Defense that assists consumers directly in pursuing their rights7.
Brazil uses the MERCOSUR Common Nomenclature (NCM), which is formed by the 6-first digits of the Harmonized System (HS) plus 2 additional digits. Using the correct NCM code avoids problems with customs and wrong taxation, as all taxes are based on the product NCM. Brazil is a member of the MERCOSUR agreement between Argentina, Paraguay,
according to Brazilian requirements. The mandatory import documentation in Brazil includes: Bill of Lading (B/L) or Airway Bill (AWB), Commercial Invoice, Packing List, Certificate of Origin (when applicable), Certificate of Analysis. Other documents required for the licensing process or on a Letter of Credit might be needed. When arriving at Brazilian customs, the Declaration of Import (DI) must be filled (electronically) as well as other procedures under-taken by the custom agent hired. Random shipments are chosen by the SISCOMEX to undergo physical inspections. Re-inspections are performed by MAPA and ANVISA inspectors if they believe it is necessary8.
Uruguay and Venezuela (not a full member yet). Those countries within MERCOSUR are usually exempt from paying the import duty when trading with each other. MERCOSUR has also trade agreements with other countries. Import duty, which can vary from 0% to 35%, depending on the product8.
3 Camila Jerger, “Brazil’s Food and Beverage Market”, May 2012, Business Network Switzerland, OSEC 4 Livestock and Food Supply, Ministry of Agriculture, Federal Government of Brazil 5 ANVISA, National Agency of Sanitary Surveillance, Ministry of Health, Federal Government of Brazil 6 INMETRO, National Institute of Metrology, Quality and Technology, Federal Government of Brazil
7 PROCON SP, Foundation of Defense and consumer protection, Federal Government of Brazil8 Camila Jerger, “Brazil’s Food and Beverage Market”, May 2012, Business Network Switzerland, OSEC
When importing to Brazil, the importer is held accountable for any problems or health risks caused by the product. Before shipping a product into Brazil, all importers must register with the Brazilian International Trade Secretariat (SECEX) and obtain an import license depending on the product. In order for importers to check whether the products needs a license or not, they can enter Brazil’s automated import system (SISCOMEX). By entering the product and origin information on this system, they can get information about the authorities involved in granting such licenses if needed. Heavy fines are applied if the importer does not comply with the standards and regulations concerning imports; all paperwork must be prepared
Brazil is a member of the World Trade Organization (WTO). The country is committed to following the regulations and practices of both the Codex Alimentarius (CODEX) principles and the Sanitary and Phytosanitary Agreement (SPS). However, before taking any regulations into account, they have to be published in Brazil’s Official Gazette (Diário Oficial). In addition, there are many agencies and ministries that are responsible for regulating imports of agriculture commodities while ensuring the safety of the Brazilian food supply3.
10 11
IMPORT ANALYSIS BY MAIN CROPPOTATOES
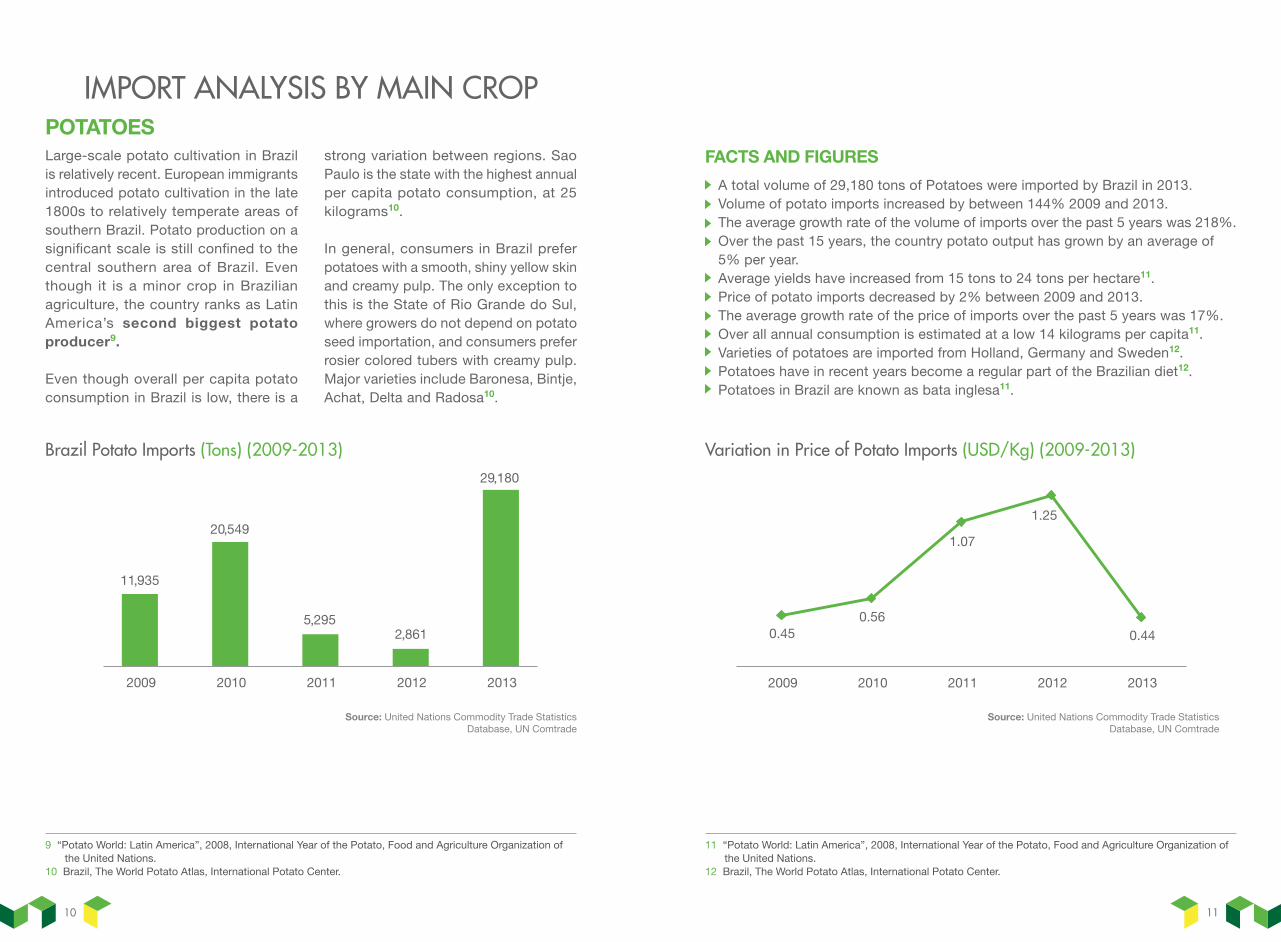
A total volume of 29,180 tons of Potatoes were imported by Brazil in 2013.Volume of potato imports increased by between 144% 2009 and 2013.The average growth rate of the volume of imports over the past 5 years was 218%.Over the past 15 years, the country potato output has grown by an average of 5% per year. Average yields have increased from 15 tons to 24 tons per hectare11.Price of potato imports decreased by 2% between 2009 and 2013.The average growth rate of the price of imports over the past 5 years was 17%.Over all annual consumption is estimated at a low 14 kilograms per capita11. Varieties of potatoes are imported from Holland, Germany and Sweden12. Potatoes have in recent years become a regular part of the Brazilian diet12.Potatoes in Brazil are known as bata inglesa11.
FACTS AND FIGURES
Source: United Nations Commodity Trade Statistics Database, UN Comtrade
Source: United Nations Commodity Trade Statistics Database, UN Comtrade
Brazil Potato Imports (Tons) (2009-2013) Variation in Price of Potato Imports (USD/Kg) (2009-2013)
Large-scale potato cultivation in Brazil is relatively recent. European immigrants introduced potato cultivation in the late 1800s to relatively temperate areas of southern Brazil. Potato production on a significant scale is still confined to the central southern area of Brazil. Even though it is a minor crop in Brazilian agriculture, the country ranks as Latin America’s second biggest potato producer9.
Even though overall per capita potato consumption in Brazil is low, there is a
strong variation between regions. Sao Paulo is the state with the highest annual per capita potato consumption, at 25 kilograms10.
In general, consumers in Brazil prefer potatoes with a smooth, shiny yellow skin and creamy pulp. The only exception to this is the State of Rio Grande do Sul, where growers do not depend on potato seed importation, and consumers prefer rosier colored tubers with creamy pulp. Major varieties include Baronesa, Bintje, Achat, Delta and Radosa10.
11 “Potato World: Latin America”, 2008, International Year of the Potato, Food and Agriculture Organization of the United Nations.12 Brazil, The World Potato Atlas, International Potato Center.
9 “Potato World: Latin America”, 2008, International Year of the Potato, Food and Agriculture Organization of the United Nations.10 Brazil, The World Potato Atlas, International Potato Center.

12 13
176,772 tons of garlic were imported by Brazil in 2013.Volume of garlic imports increased by 17% between 2009 and 2013.The average growth rate of the volume of imports over the past 5 years was 4%.Price of garlic imports increased by 59% between 2009 and 2013.The average growth rate of the price of imports over the past 5 years was 22%.Per capita consumption reached 1.5 kg per inhabitant per year.
GARLICFACTS AND FIGURES
Source: United Nations Commodity Trade Statistics Database, UN Comtrade
Source: United Nations Commodity Trade Statistics Database, UN Comtrade
Brazil Garlic Imports (Tons) (2009-2013)
Variation in Price of Garlic Imports (USD/Kg) (2009-2013)
Garlic is the fifth most economically important vegetable in Brazil. However this crop is frequently infected by a complex of different viruses that cause significant degeneration of the crop under field conditions. Thus resulting in a high demand on imports13.
Brazil is one of the biggest garlic importers in the world. The main distributor of garlic to Brazil was China, followed by Argentina, the first and second largest biggest producers and exporters of garlic. Besides China and Argentina, Brazil was also importing garlic from Spain and Mexico14.
Brazil’s National Garlic Producers Association (ANAPA) argued for the continuation of a 35% tax on garlic imported from outside of Mercosur. President of ANAPA warned the Brazilian publication that the sector could collapse without protection against volume from China. Brazil import of garlic from China has grown 400% over the past 10 years. 65% of the Brazilian garlic market is currently supplied by import. The biggest obstacle to expansion of domestic production comes from “unfair competition” created by Chinese garlic. Brazilian producers will be observing the government’s actions on Chinese anti-dumping regulations over the coming months15.
13 Oliveria & Hoffmann, “Plant Disease”, July 2014, The American Phytopathological Society. 14 Marco Lucini, “Garlic Importation in Brazil”, September 2010,National Garlic Producers Association of Brazil.15 “Brazil Braces before decision on Chinese garlic Imports”, October 2013, Fresh Fruit Portal.

14 15
PEAS
A total volume of 45,049 tons of peas were imported by Brazil in 2013.Volume of peas imported increased by 44% between 2009 and 2013. The average growth rate of the volume of imports over the past 5 years was 11%Price of pea imports increased by 52% between 2009 and 2013.The average growth rate of the price of imports over the past 5 years was 16%.As of 2014 import duties on peas was at a rate of 10%17.
FACTS AND FIGURES
Source: United Nations Commodity Trade Statistics Database, UN Comtrade
Brazil Peas Imports (Tons) (2009-2013)
Legumes rank next in importance to cereals as human food sources. They contain more protein than any other vegetable and thus are similar to animal meat in food value. In addition, because all parts of the plant are rich in protein,
legumes are valuable as field and forage crops. When plowed under they are an excellent fertilizer and greatly increase the nitrogenous content of soil16.
Source: United Nations Commodity Trade Statistics Database, UN Comtrade
Variation in Price of Peas Imports (USD/Kg) (2009-2013)
16 “Legumes, Nuts and Seeds”, Plants of Economic or Aesthetic Importance, University of California, Riverside. 17 Fujikawa, “Taxes and Duties for NCM 0708.10.00”, January 2014, The Brazil Business.

16 17
KIDNEY BEANS
303,220 tons of kidney beans were imported by Brazil in 2013.Volume of kidney beans imported increased by 178% between 2009 and 2013.The average growth rate of the volume of imports over the past 5 years was 32%.Price of kidney bean imports increased by 65% between 2009 and 2013.The average growth rate of the price of imports over the past 5 years was 14%.As of 2014, import duties on kidney beans were at a rate of 10%20.
FACTS AND FIGURES
Source: United Nations Commodity Trade Statistics Database, UN Comtrade
Brazil Kidney Beans Imports (Tons) (2009-2013)
Kidney beans are indigenous to the Americas and were early used by the Amerindians of both South and North America. In modern times the young pods, the unripe seeds and the dried ripe seeds are all used for human consumption. The whole plant is used for forage18.
Beans are one of the cornerstones of Brazilian nutrition. Consequently, they are also fundamental in Brazilian traditional gastronomy. They are the most important source of protein for the poorer strata of society - those who cannot afford to regularly consume animal protein.
Without the proteins provided by beans, the good nutrition of millions of Brazilians would be at risk19.
Even though beans will grow on a variety of soils, a fertile soil, rich in lime, is required for a good yield. A warmer climate than for peas is desirable, and crop rotation should be practiced. On large farms machines harvest the crop and the beans are dried, stored and threshed before marketing. The culls are fed to livestock and the straw is used for forage. Presently these beans are grown worldwide18.
Source: United Nations Commodity Trade Statistics Database, UN Comtrade
Variation in Price of Kidney Bean Imports (USD) (2009-2013)
18 “Legumes, Nuts and Seeds”, Plants of Economic or Aesthetic Importance, University of California, Riverside.19 “Black-eyed Peas”, August 2010, Flavors of Brazil.
20 Fujikawa, “Taxes and Duties for NCM 0708.10.00”, January 2014, The Brazil Business

18 19
ORANGES
14,598 tons of oranges were imported by Brazil in 2013.Volume of oranges imported increased by 700% between 2009 and 2013.The average growth rate of the volume of imports over the past 5 years was 87%.Price of orange imports decreased by 12% between 2009 and 2013.The average growth rate of the price of imports over the past 5 years was -3%.Brazil’s juice and oranges are exported to nations like the United Kingdom, United States, Germany, Argentina, Uruguay, Belgium, Canada, France, Italy, Portugal and Spain23. Fresh orange crop production for 2014/2015 season is expected to be larger than the one from the previous season24.
FACTS AND FIGURES
Source: United Nations Commodity Trade Statistics Database, UN Comtrade
Brazil Orange Imports (Tons) (2009-2013)
Almost 35% of all the oranges produced in the world come from Brazil. In addition, Brazil makes and distributes more orange juice than any other country in the world. The country makes more than 50% of the world’s orange juice. However recent history hasn’t been all that kind to the citrus producing giant. Orange juice production has grown stagnant over the past few years and orange juice exports, which the local industry relies heavily on, have fallen almost 15% since their peak in 2003.
In the past years, an overproduction was seen among the Brazilian producers, making it necessary to establish measures in order to reduce the stocks. One of the biggest crisis of this sector happened
in 2012, when the USA suspended the purchase of Brazilian oranges because of a certain pesticide used on the crop. This crisis was a hard hit to the Brazilian fruit industry, but that was not enough to take from them the title of 'world’s largest orange producer'. Brazilian production faced a decrease of 16.1% in 2013, according to the Instituto Brasileiro de Geografia e Estatística, reflecting the government’s attempt to reduce stocks to avoid bigger problems21.
In order to produce orange juice, we need certain types of citrus verities. Not all oranges can be used for orange juice production. For example, Navel oranges can’t be used in juice because this type of variety is too bitter to be made into juice22.
Source: United Nations Commodity Trade Statistics Database, UN Comtrade
Variation in Price of Orange Imports (USD) (2009-2013)
21 Igor Utsumi, “The Brazilian Orange Industry”, May 2014, The Brazil Business.22 “Orange juice imports decline, alongside, alongside consumption, July 2013, Fresh Fruit Portal.
23 Rebeca Duran, “ Fruit Market in Brazil”, February 2014, The Brazil Business.24 Nunez & Slot, “Brazilian Orange crop expected to increase”, April 2014, Fresh Plaza.

20 21
93,964 tons of apples were imported by Brazil in 2013.Volume of apples imported increased by 53% between 2009 and 2013.The average growth rate of the volume of imports over the past 5 years was 18%Price of apple imports increased by 36% between 2009 and 2013.The average growth rate of the price of imports over the past 5 years was 8%.Paraná is famous for being associated with apple production in Brazil26. Apples are the second highest fruit imported in volume and value in the country27. Brazil’s apple season officially starts in February28. Crops are basically in two varieties: Galas and Fujis28.In 2002 apple consumption per capita was of 1.68 kilos29. In 2008 it grew to 2.15 kilos per capita, a rise of 28% in six years29.Fresh apple consumption them 3.42 kg per inhabitant in 2010, indicating also that consumption will further increase due to the pressure on the market30. Argentina was the major supplier providing 79% of the total imports29.Chile and France were also major suppliers of apples following Argentina30.
APPLESFACTS AND FIGURES
Source: United Nations Commodity Trade Statistics Database, UN Comtrade
Brazil Apple Imports (Tons) (2009-2013)
According to the Brazilian Apples Producers Associations, total planted area for apples in Brazil is estimated to have increased slightly over the years. Santa Catarina continues to be the main apple producing state in Brazil, accounting for 50 % of total area, followed by Rio Grande do Sul with 44 %. Total planted area expansion is on hold in Rio Grande do Sul and Parana states due to a significant drop in economic returns and unfavorable weather conditions. Producers from the southwestern part of Sao Paulo state planted 50 hectares of apples. This new area takes advantage of existing infrastructure from the planting of peach, plums and nectarines. Trade sources indicate that there is a potential growth of 10 % for the next year, based on good transportation system, expansion plans and existing infrastructure25.
Over the years, there was a decrease in exports of Brazilian apples; this is attributed to the low product quality and a weaker demand from the European Union. Trade sources estimate that apple exports will decrease further next year. One of the reasons is the reduced quality of Brazilian apples due to unfavorable weather conditions during stages of fruit development. In addition, last year's flooding in Rio Grande do Sul damaged the infrastructure and consequently distribution is not running as smoothly as usual25.
Consumption of apples in Brazil is mostly fresh with large variations in preference depending on the region. Consumers in southern Brazil, prefer larger apples while consumers in the central region of Brazil prefer medium-sized apples. Those in the northeast favor smaller-sized apples25.
Source: United Nations Commodity Trade Statistics Database, UN Comtrade
Variation in Price of Apple Imports (USD) (2009-2013)
25 Priscila Mingm, “ Annual Fresh Deciduous Fruit Report, 2011, Global Agriculture Information Network, USDA.
26 Rebeca Duran, “Fruit Market in Brazil”, February 2014, The Brazil Business 27 “Brazil: Fruit Exports results for 2012”, February 2013, Fresh Plaza28 “Brazil on track for historic quality apple crop”, December 2011, Fresh Fruit Portal 29 “Brazil: Apple Imports Grow 48%”, September 2009, Fresh Plaza, Valor Econômico30 Priscila Mingm, “ Annual Fresh Deciduous Fruit Report, 2011, Global Agriculture Information Network, USDA
22 23
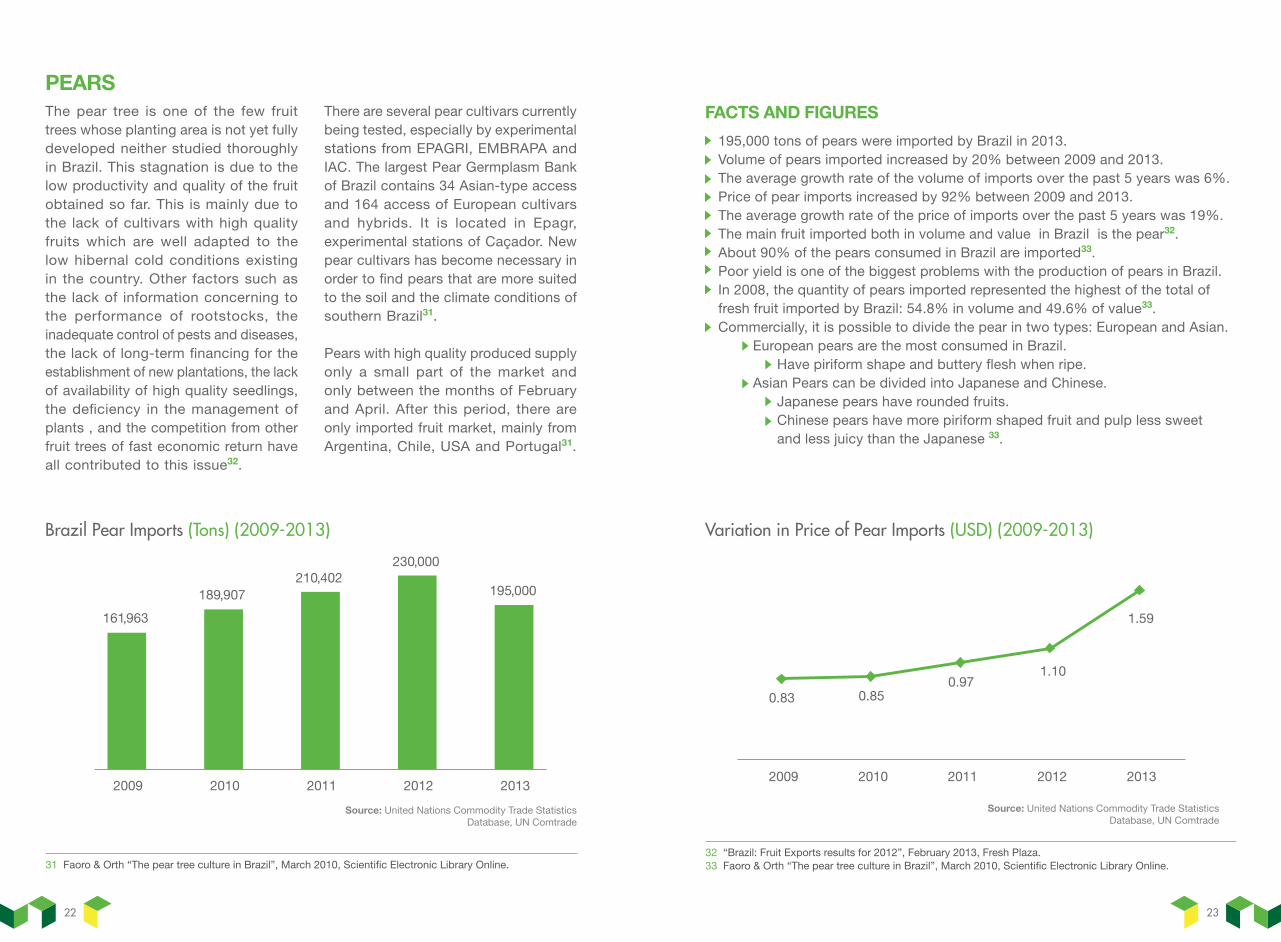
195,000 tons of pears were imported by Brazil in 2013.Volume of pears imported increased by 20% between 2009 and 2013.The average growth rate of the volume of imports over the past 5 years was 6%.Price of pear imports increased by 92% between 2009 and 2013.The average growth rate of the price of imports over the past 5 years was 19%.The main fruit imported both in volume and value in Brazil is the pear32. About 90% of the pears consumed in Brazil are imported33. Poor yield is one of the biggest problems with the production of pears in Brazil. In 2008, the quantity of pears imported represented the highest of the total of fresh fruit imported by Brazil: 54.8% in volume and 49.6% of value33.Commercially, it is possible to divide the pear in two types: European and Asian. European pears are the most consumed in Brazil. Have piriform shape and buttery flesh when ripe. Asian Pears can be divided into Japanese and Chinese. Japanese pears have rounded fruits. Chinese pears have more piriform shaped fruit and pulp less sweet and less juicy than the Japanese 33.
PEARSFACTS AND FIGURES
Source: United Nations Commodity Trade Statistics Database, UN Comtrade
Brazil Pear Imports (Tons) (2009-2013)
The pear tree is one of the few fruit trees whose planting area is not yet fully developed neither studied thoroughly in Brazil. This stagnation is due to the low productivity and quality of the fruit obtained so far. This is mainly due to the lack of cultivars with high quality fruits which are well adapted to the low hibernal cold conditions existing in the country. Other factors such as the lack of information concerning to the performance of rootstocks, the inadequate control of pests and diseases, the lack of long-term financing for the establishment of new plantations, the lack of availability of high quality seedlings, the deficiency in the management of plants , and the competition from other fruit trees of fast economic return have all contributed to this issue32.
There are several pear cultivars currently being tested, especially by experimental stations from EPAGRI, EMBRAPA and IAC. The largest Pear Germplasm Bank of Brazil contains 34 Asian-type access and 164 access of European cultivars and hybrids. It is located in Epagr, experimental stations of Caçador. New pear cultivars has become necessary in order to find pears that are more suited to the soil and the climate conditions of southern Brazil31.
Pears with high quality produced supply only a small part of the market and only between the months of February and April. After this period, there are only imported fruit market, mainly from Argentina, Chile, USA and Portugal31.
Source: United Nations Commodity Trade Statistics Database, UN Comtrade
Variation in Price of Pear Imports (USD) (2009-2013)
31 Faoro & Orth “The pear tree culture in Brazil”, March 2010, Scientific Electronic Library Online.32 “Brazil: Fruit Exports results for 2012”, February 2013, Fresh Plaza.33 Faoro & Orth “The pear tree culture in Brazil”, March 2010, Scientific Electronic Library Online.
24 25
GRAPES
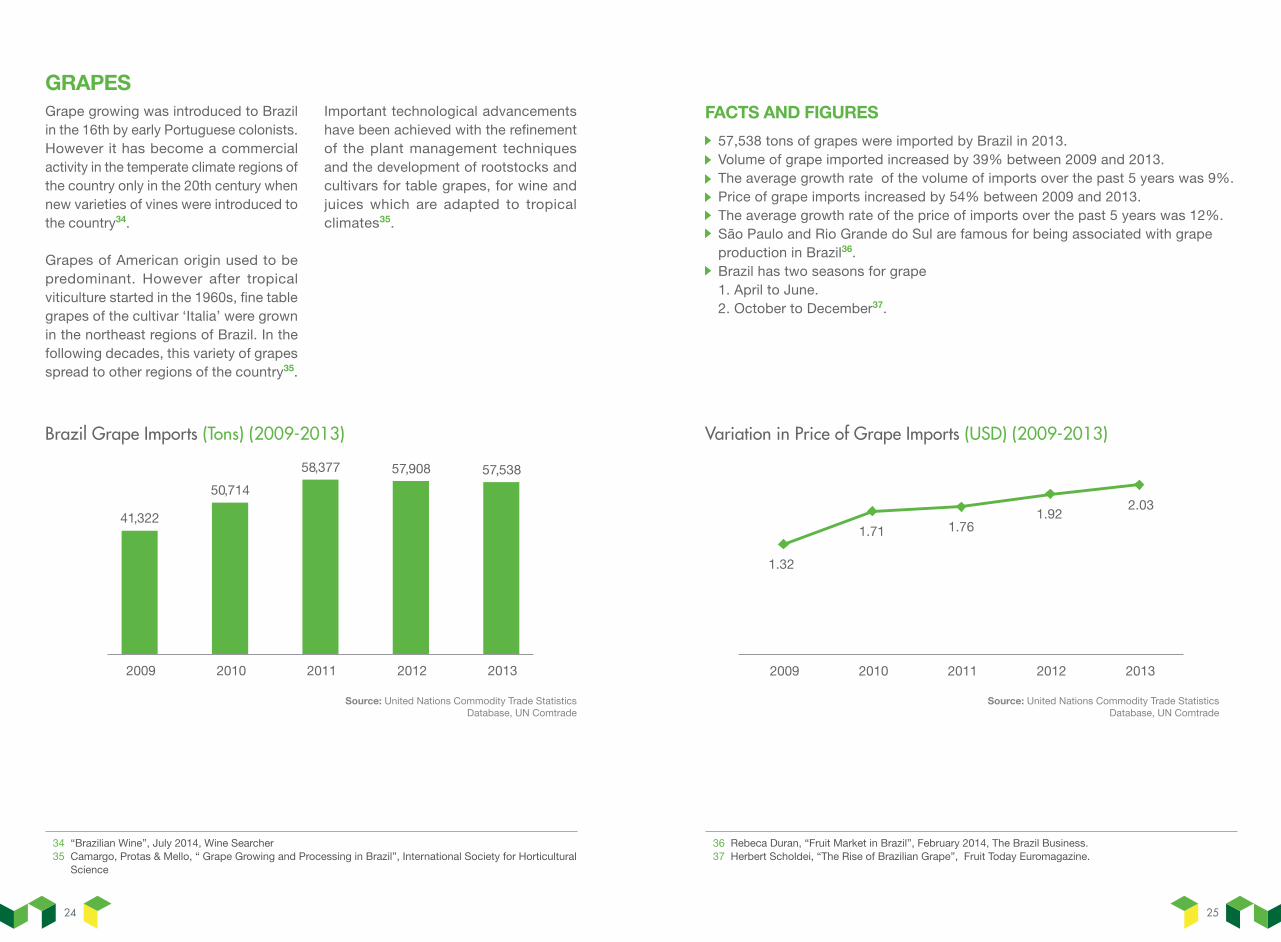
57,538 tons of grapes were imported by Brazil in 2013.Volume of grape imported increased by 39% between 2009 and 2013.The average growth rate of the volume of imports over the past 5 years was 9%. Price of grape imports increased by 54% between 2009 and 2013.The average growth rate of the price of imports over the past 5 years was 12%.São Paulo and Rio Grande do Sul are famous for being associated with grape production in Brazil36. Brazil has two seasons for grape1. April to June. 2. October to December37.
FACTS AND FIGURES
Source: United Nations Commodity Trade Statistics Database, UN Comtrade
Brazil Grape Imports (Tons) (2009-2013)
Grape growing was introduced to Brazil in the 16th by early Portuguese colonists. However it has become a commercial activity in the temperate climate regions of the country only in the 20th century when new varieties of vines were introduced to the country34.
Grapes of American origin used to be predominant. However after tropical viticulture started in the 1960s, fine table grapes of the cultivar ‘Italia’ were grown in the northeast regions of Brazil. In the following decades, this variety of grapes spread to other regions of the country35.
Important technological advancements have been achieved with the refinement of the plant management techniques and the development of rootstocks and cultivars for table grapes, for wine and juices which are adapted to tropical climates35.
Source: United Nations Commodity Trade Statistics Database, UN Comtrade
Variation in Price of Grape Imports (USD) (2009-2013)
34 “Brazilian Wine”, July 2014, Wine Searcher 35 Camargo, Protas & Mello, “ Grape Growing and Processing in Brazil”, International Society for Horticultural Science
36 Rebeca Duran, “Fruit Market in Brazil”, February 2014, The Brazil Business. 37 Herbert Scholdei, “The Rise of Brazilian Grape”, Fruit Today Euromagazine.

26 27
CONCLUSIONIn conclusion, the Brazilian fruit and vegetable market vegetables is an appealing one for Lebanese exports. Over the last couple of years, imports of both fruits and vegetables have increased tremendously in Brazil. With an average growth rate of roughly 25%, Brazilian imports of fruits and vegetables should continue growing, creating an attractive market for all those exporters out there. Brazil’s top five import sources provided 80% of Brazilian imports. Three of these countries are members of Mercosul, thus benefit from the free-trade agreement which eliminates tariffs, import quotas, and preferences on most goods and services traded between them.
Brazil has the seventh largest economy by nominal GDP in the world and is one of the fastest-growing major economies in the world. As the country continues to grow and develop, its middle-class has expanded rapidly and income levels increased, altering consumption patterns of the country. Due to population growth,
higher income levels, and growth of the middle class, Brazilian consumption of almost all agriculture products has been growing in volume. With a population of approximately 203 million people (sixth most populous country in the world), the average Brazilian per capita consumption is one of the highest levels among South and Central American countries.
As food consumption continues to rise, Brazilian agriculture production will have to increase tremendously to fulfill the changing needs of their growing population. Therefore the volume of Brazilian agricultural imports of fruits and vegetables will continue to rise, thus giving Lebanon an opportunity to enter this market.

28 29
If you require any further information on investing in Lebanon or on the services IDAL can offer you, please do not hesitate to contact us at the following:
/InvestInLebanon
+961 (1) 983306/7/8+961 (1) 983302/3
Lazarieh Tower, 4th Floor,Emir Bechir Street,Riad El-Solh, Beirut, LebanonP.O.Box: 113-7251www.investinlebanon.gov.lb
/InvestInLebanon
@Invest_Lebanon
/Investmentdevelopmentauthorityoflebanon
CONTACT US

30
2016


