Franklin Synergy Bank CRA Public Evaluation Franklin, Tennessee February 22, 2016 PUBLIC DISCLOSURE February 22, 2016 COMMUNITY REINVESTMENT ACT PERFORMANCE EVALUATION Franklin Synergy Bank 722 Columbia Avenue Franklin, Tennessee RSSD ID NUMBER: 3635533 FEDERAL RESERVE BANK OF ATLANTA 1000 Peachtree Street, N.E. Atlanta, Georgia 30309-4470 NOTE: This document is an evaluation of this institution’s record of meeting the credit needs of its entire community, including low- and moderate-income neighborhoods, consistent with safe and sound operation of the institution. This evaluation is not, nor should it be construed as, an assessment of the financial condition of this institution. The rating assigned to the institution does not represent an analysis, conclusion, or opinion of the federal financial supervisory agency concerning the safety and soundness of this financial institution.
Transcript
Franklin Synergy Bank CRA Public Evaluation Franklin, Tennessee February 22, 2016
PUBLIC DISCLOSURE
February 22, 2016
COMMUNITY REINVESTMENT ACT
PERFORMANCE EVALUATION
Franklin Synergy Bank 722 Columbia Avenue Franklin, Tennessee
RSSD ID NUMBER: 3635533
FEDERAL RESERVE BANK OF ATLANTA 1000 Peachtree Street, N.E.
Atlanta, Georgia 30309-4470
NOTE: This document is an evaluation of this institution’s record of meeting the credit needs of its entire community, including low- and moderate-income neighborhoods, consistent with safe and sound operation of the institution. This evaluation is not, nor should it be construed as, an assessment of the financial condition of this institution. The rating assigned to the institution does not represent an analysis, conclusion, or opinion of the federal financial supervisory agency concerning the safety and soundness of this financial institution.
Franklin Synergy Bank CRA Public Evaluation Franklin, Tennessee February 22, 2016
1
TABLE OF CONTENTS PAGE
INSTITUTION’S CRA RATING
Institution’s Community Reinvestment Act (CRA) Rating .........................................................................2
Summary of Major Factors Supporting Rating ............................................................................................2
INSTITUTION
Scope of Examination ..................................................................................................................................3
Description of Institution .............................................................................................................................3
Conclusions with Respect to Performance Tests .......................................................................................12
FAIR LENDING OR OTHER ILLEGAL CREDIT PRACTICES REVIEW ......................................................24
APPENDICES
Appendix A – Scope Of Examination .......................................................................................................25
Appendix B – Definitions and General Information ..................................................................................26
Appendix C – Glossary ..............................................................................................................................27
Franklin Synergy Bank CRA Public Evaluation Franklin, Tennessee February 22, 2016
2
INSTITUTION’S CRA RATING
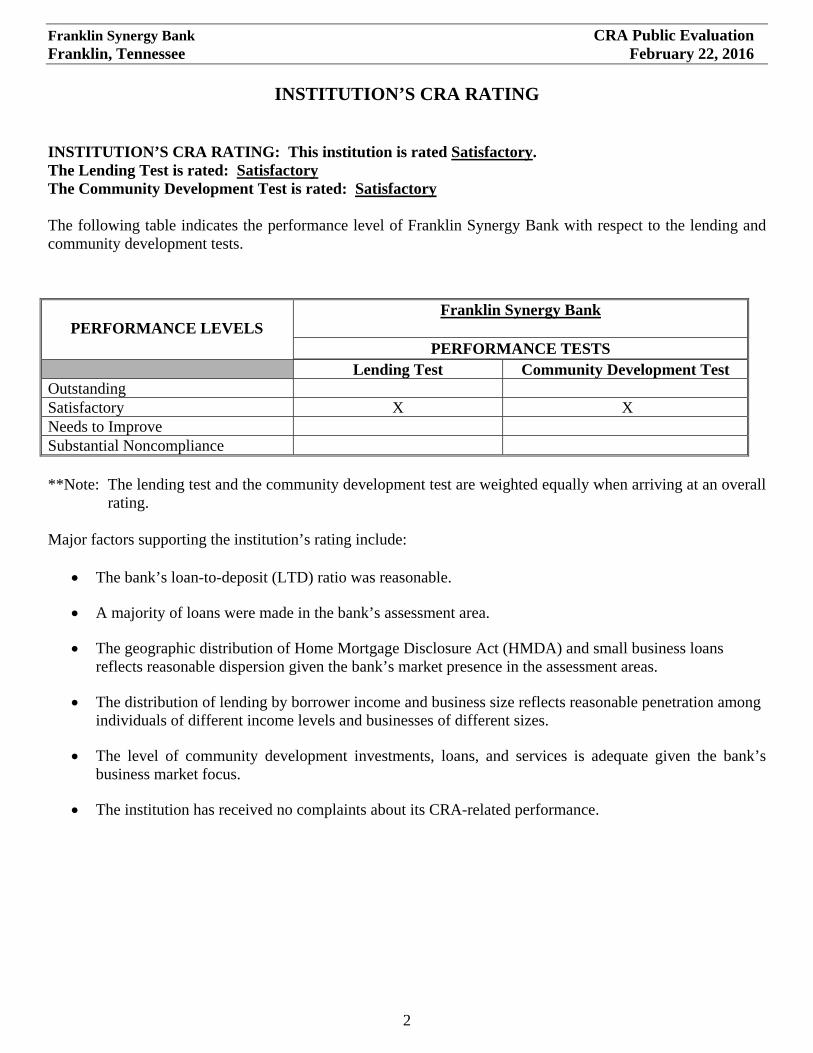
INSTITUTION’S CRA RATING: This institution is rated Satisfactory. The Lending Test is rated: Satisfactory The Community Development Test is rated: Satisfactory The following table indicates the performance level of Franklin Synergy Bank with respect to the lending and community development tests.
PERFORMANCE LEVELS Franklin Synergy Bank
PERFORMANCE TESTS
Lending Test Community Development Test Outstanding Satisfactory X X Needs to Improve Substantial Noncompliance **Note: The lending test and the community development test are weighted equally when arriving at an overall
rating. Major factors supporting the institution’s rating include:
The bank’s loan-to-deposit (LTD) ratio was reasonable.
A majority of loans were made in the bank’s assessment area.
The geographic distribution of Home Mortgage Disclosure Act (HMDA) and small business loans reflects reasonable dispersion given the bank’s market presence in the assessment areas.
The distribution of lending by borrower income and business size reflects reasonable penetration among individuals of different income levels and businesses of different sizes.
The level of community development investments, loans, and services is adequate given the bank’s business market focus.
The institution has received no complaints about its CRA-related performance.
Franklin Synergy Bank CRA Public Evaluation Franklin, Tennessee February 22, 2016
3
INSTITUTION
SCOPE OF EXAMINATION The CRA performance evaluation assesses the bank’s record of meeting the credit needs of its community, including low- and moderate-income neighborhoods, within the context of information such as asset size and financial condition of the institution, competitive factors, as well as the economic and demographic characteristics of its defined assessment area. Franklin Synergy Bank’s CRA performance evaluation was based on CRA activities within its assessment area using the Interagency Intermediate Small Institution Examination Procedures. Under these procedures, effective as of September 1, 2005, institutions meeting the threshold size are evaluated using two separately rated tests: a lending test, and a community development test. The community development test includes an evaluation of community development loans, investments, and services in light of community needs within its assessment areas and the capacity of the bank. Franklin Synergy Bank’s one CRA assessment area, referred to as the Nashville assessment area in this report, is comprised of Williamson, Rutherford and Davidson counties, which are part of the Nashville-Davidson-Franklin-Murfreesboro, TN MSA. The bank’s assessment area has changed since the previous examination due to the 2014 acquisition of MidSouth Bank in Rutherford County. In 2013, the assessment area included only Williamson and Davidson counties; Rutherford County was added in 2014. The evaluation included an analysis of HMDA-reportable and commercial originated from January 1, 2013 through December 31, 2014. Lending performance was analyzed separately for 2013 and 2014 due to the change in the assessment area. Given the bank’s asset size and offices located in an MSA, it submits annual reports about its residential real estate loan originations and applications, pursuant to the HMDA. These loans are referred to as “HMDA-reportable” loans in this evaluation. Franklin Synergy Bank reported a greater volume of HMDA-reportable loans than commercial loans, in both number and dollar amount; therefore, HMDA-reportable lending was given more weight than commercial lending in evaluating the bank’s lending performance. For the community development test, the examination covered community development loans, qualified investments, and community development services from December 3, 2012 through February 22, 2016. The CRA defines a community development activity as having a primary purpose of providing any of the following: affordable housing or community services for low- or moderate-income persons; economic development through the financing of small businesses; or revitalizing or stabilizing low- or moderate-income geographies, designated disaster areas, or distressed or underserved nonmetropolitan middle-income geographies that benefit the assessment area or a larger statewide or regional area that includes the assessment area. As part of this evaluation, community contacts were made with local community and governmental representatives who are familiar with the economic and demographic characteristics as well as community development opportunities in the assessment area. Information obtained from these contacts was used to inform the context for the communities in which the bank operates and to gather information on the bank’s performance. Specific information obtained from the community contacts is incorporated in the applicable section of the evaluation; the contacts did not identify any unmet credit needs. DESCRIPTION OF INSTITUTION
Franklin Synergy Bank is a community bank headquartered in Franklin, Tennessee. The bank is the sole subsidiary of Franklin Financial Network, a holding company also located in Franklin. The bank has been in operation since 2007, and its primary trade area is the rapidly growing and highly competitive middle
Franklin Synergy Bank CRA Public Evaluation Franklin, Tennessee February 22, 2016
4
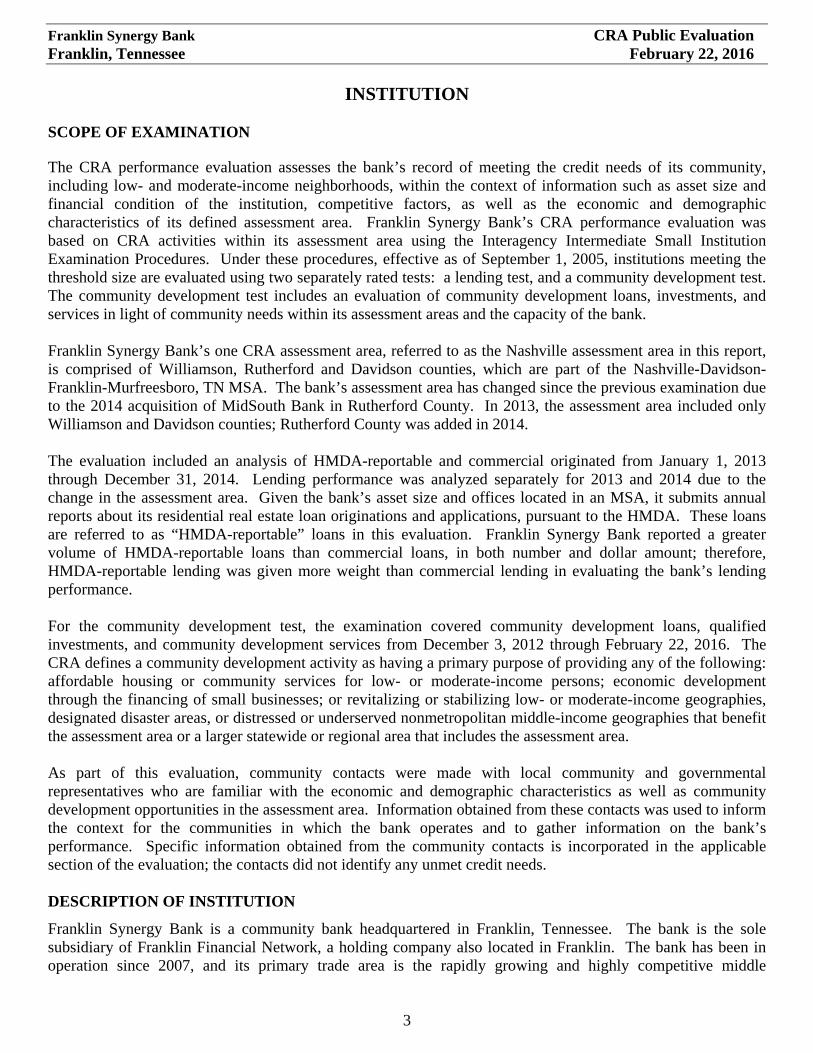
Tennessee region. Franklin Synergy Bank is a full service bank, offering a variety of mortgage, commercial and consumer credit products to meet the needs of the community. Branch Offices Franklin Synergy Bank operates 11 branches in Williamson and Rutherford counties. Since the last examination, the bank also opened two branches in upper-income census tracts in Williamson County. In addition, the bank operates 15 cash-only ATMs within its footprint. Loan Portfolio According to the September 30, 2015, Report of Condition (ROC), the bank’s assets totaled almost $2.2 billion, an increase of approximately $1.6 billion, or 275.0 percent, since the bank’s previous CRA evaluation conducted in December 2012. The following table and graphs show the composition of the loan portfolio according to the Consolidated Reports of Condition and Income.
* This table does not include the entire loan portfo lio . Specifically, it excludes loans to depository institutions, bankers acceptances, lease financing receivables, obligations o f state and political subdivisions, and other loans that do not meet any o ther category. Contra assets are also not included in this table.
28.4
%
34.6
%
0.2%
0.1%
26.7
%
8.5%
0.5%
0.9%
29.9
%
28.9
%
0.1%
0.3%
30.1
%
9.7%
0.5%
0.4%
29.9
%
23.1
%
0.1%
0.2%
26.8
%
19.4
%
0.3%
0.3%
0.0%
5.0%
10.0%
15.0%
20.0%
25.0%
30.0%
35.0%
40.0%
Construction &Development
Secured by 1-4Family
Dwellings
Farmland Multifamily NonfarmNonresidential
Commercial &Industrial
Loans toIndividuals
Agricultural
Loan Portfolio Trend
12/31/2013
12/31/2014
9/30/2015
Franklin Synergy Bank CRA Public Evaluation Franklin, Tennessee February 22, 2016
5
As shown in the charts above, the bank is primarily focused on real estate lending. Construction and development loans make up the largest percentage of the loan portfolio as of September 30, 2015, followed by loans secured by nonfarm nonresidential (commercial real estate) and loans secured by 1-4 family dwelling units. The bank’s focus on real estate lending did not change during the review period, but the composition of the loan portfolio shifted. Loans secured by 1-4 family dwelling units have declined as a share of total loans, while commercial and industrial loans have increased, representing nearly 20.0 percent of total loans as of September 2015. Overall, total loans have increased significantly, with loan volume up more than 165.0 percent during the review period. Credit Products Franklin Synergy Bank is a community bank that offers a wide variety of credit products to meet the credit needs of its community, including residential mortgage loans (single family and multi-family), home equity loans, home improvement loans, construction loans, consumer loans and credit cards, commercial real estate and small business loan products. The bank offers flexible mortgage products, including FHA and VA loans as well as loans through the Tennessee Housing Development Agency. Franklin Synergy Bank complies with the requirements of the CRA. No known legal impediments exist that would restrict the bank from meeting the credit needs of its assessment areas. The bank received a satisfactory rating at its previous evaluation conducted by the Federal Reserve Bank of Atlanta dated December 3, 2012, under the intermediate small bank examination procedures.
DESCRIPTION OF INSTITUTION’S OPERATIONS IN THE NASHVILLE ASSESSMENT AREA
Overview The Nashville assessment area consists of Williamson, Rutherford, and Davidson counties, which are part of the 13-county Nashville-Davidson- Franklin-Murfreesboro MSA. As noted earlier, the Nashville assessment area changed in 2014 to include Rutherford County, after the bank acquired MidSouth Bank. As of December 31, 2015, Franklin Synergy Bank operated 11 branch offices in the assessment area, with 6 in Williamson County and 5 in Rutherford County. Of the 11 branches, one is located in a low-income tract and one in a moderate-income tract. The Nashville assessment area is a highly competitive banking market where national and regional banks have a significant presence. However, the number of local community banks similar in asset size and structure to Franklin Synergy is increasing. According to the June 30, 2015 FDIC Summary of Deposits Report, there are 49 financial institutions operating 386 branch locations across the assessment area with $38.5 billion in total deposits. Franklin Synergy Bank ranked 6th in deposit market share with $1.5 billion, or 3.9 percent of total deposits. Bank of America held the largest deposit market share at 20.8 percent followed by Regions Bank at 15.7 percent and SunTrust at 14.9 percent. Other competitive institutions in the assessment area include Pinnacle Financial Partners, CapStar, and Avenue Bank. HMDA-reportable lending is similarly competitive. Franklin Synergy Bank ranked 12th out of 532 HMDA reporters in 2013 and increased to 5th out of 565 HMDA reporters in 2014; the bank’s share of total HMDA-reportable loans increased from 1.8 percent to 2.9 percent over the review period. Wells Fargo Bank, JP Morgan Chase, Franklin American Mortgage, Regions, and Bank of America are the dominant HMDA lenders in the market. Population and Income Characteristics The Nashville assessment area is growing rapidly. Between 2000 and 2010, the population increased 22.1 percent, compared to statewide population growth of 11.5 percent. Davidson County is the largest county in the
Franklin Synergy Bank CRA Public Evaluation Franklin, Tennessee February 22, 2016
6
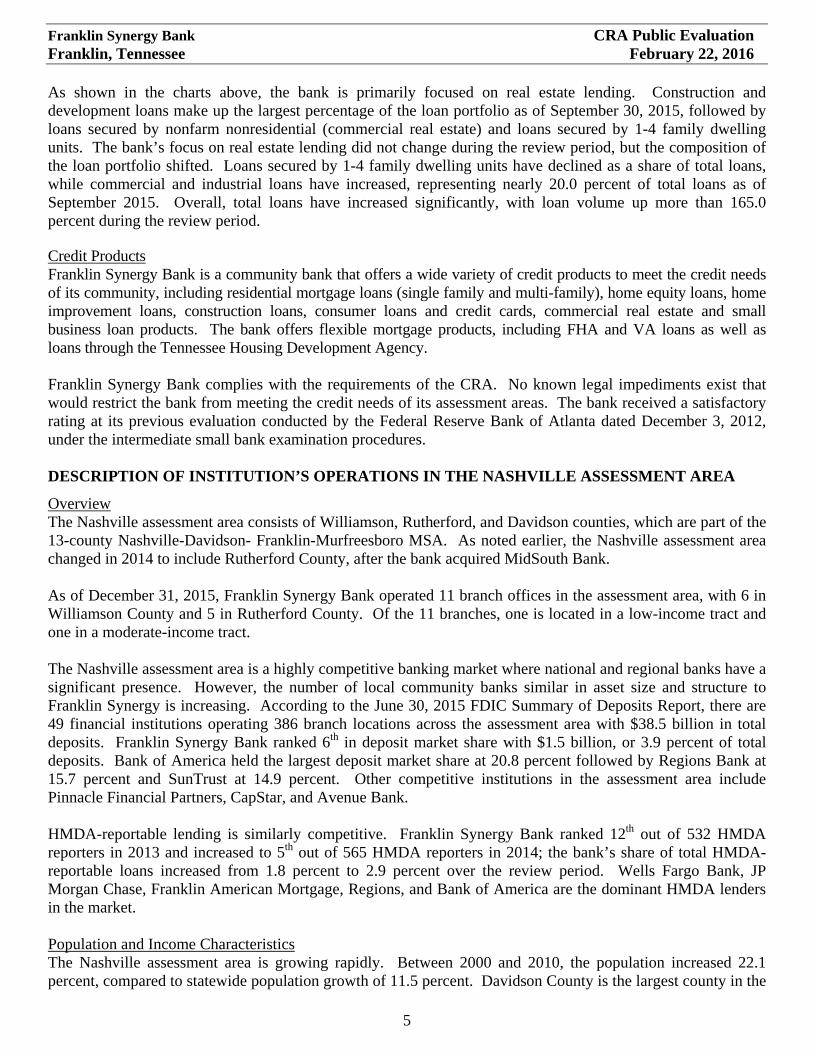
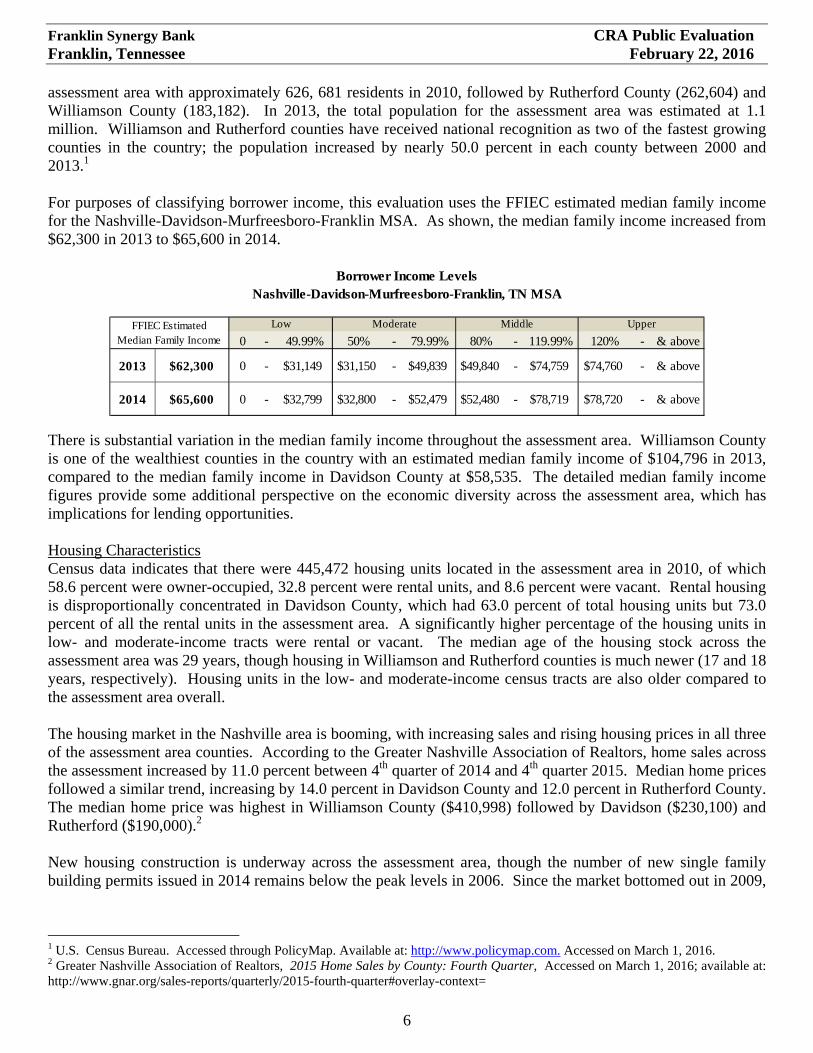
assessment area with approximately 626, 681 residents in 2010, followed by Rutherford County (262,604) and Williamson County (183,182). In 2013, the total population for the assessment area was estimated at 1.1 million. Williamson and Rutherford counties have received national recognition as two of the fastest growing counties in the country; the population increased by nearly 50.0 percent in each county between 2000 and 2013.1 For purposes of classifying borrower income, this evaluation uses the FFIEC estimated median family income for the Nashville-Davidson-Murfreesboro-Franklin MSA. As shown, the median family income increased from $62,300 in 2013 to $65,600 in 2014.
There is substantial variation in the median family income throughout the assessment area. Williamson County is one of the wealthiest counties in the country with an estimated median family income of $104,796 in 2013, compared to the median family income in Davidson County at $58,535. The detailed median family income figures provide some additional perspective on the economic diversity across the assessment area, which has implications for lending opportunities. Housing Characteristics Census data indicates that there were 445,472 housing units located in the assessment area in 2010, of which 58.6 percent were owner-occupied, 32.8 percent were rental units, and 8.6 percent were vacant. Rental housing is disproportionally concentrated in Davidson County, which had 63.0 percent of total housing units but 73.0 percent of all the rental units in the assessment area. A significantly higher percentage of the housing units in low- and moderate-income tracts were rental or vacant. The median age of the housing stock across the assessment area was 29 years, though housing in Williamson and Rutherford counties is much newer (17 and 18 years, respectively). Housing units in the low- and moderate-income census tracts are also older compared to the assessment area overall. The housing market in the Nashville area is booming, with increasing sales and rising housing prices in all three of the assessment area counties. According to the Greater Nashville Association of Realtors, home sales across the assessment increased by 11.0 percent between 4th quarter of 2014 and 4th quarter 2015. Median home prices followed a similar trend, increasing by 14.0 percent in Davidson County and 12.0 percent in Rutherford County. The median home price was highest in Williamson County ($410,998) followed by Davidson ($230,100) and Rutherford ($190,000).2 New housing construction is underway across the assessment area, though the number of new single family building permits issued in 2014 remains below the peak levels in 2006. Since the market bottomed out in 2009,
1 U.S. Census Bureau. Accessed through PolicyMap. Available at: http://www.policymap.com. Accessed on March 1, 2016. 2 Greater Nashville Association of Realtors, 2015 Home Sales by County: Fourth Quarter, Accessed on March 1, 2016; available at: http://www.gnar.org/sales-reports/quarterly/2015-fourth-quarter#overlay-context=
Borrower Income LevelsNashville-Davidson-Murfreesboro-Franklin, TN MSA
FFIEC Estimated Median Family Income
Low Moderate Middle Upper
Franklin Synergy Bank CRA Public Evaluation Franklin, Tennessee February 22, 2016
7
the number of new residential permits issued is up by over 140.0 percent across the assessment area; rapid growth is occurring in each of the assessment area counties.3 The assessment area’s overall affordability ratio is 28.9 compared to the state of Tennessee at 32.3, indicating that housing in the assessment area is less affordable than elsewhere in the state. The affordability ratio is defined as the median household income divided by the median housing value. A higher ratio means the housing is considered more affordable while a lower ratio means the housing is considered less affordable. Housing is least affordable in Williamson County and most affordable in Rutherford County. Employment Conditions Nashville is the state capital and serves as a vital hub for government, business, education, and tourism in the state of Tennessee. While known as the country music capital, Nashville is also home to over 250 health care companies, including HCA, which is the largest private hospital management company in the country. The automotive industry has also established a strong presence in middle Tennessee, particularly with the Nissan North America headquarters in Franklin (Williamson County). Nissan also has its largest manufacturing plant in North America located in Smyrna (Rutherford County), where it employs over 7,000.4 The primary sectors for employment are similar in Williamson and Davidson counties. In these two counties, the largest employment concentrations are in education and health services, retail trade, professional and business services, finance and insurance, food service and accommodations, and government. The leading private sector employers include Vanderbilt University, Nissan North America, HCA Holdings, Inc., St. Thomas Health and Community Health Systems.5 Rutherford County is more dependent on manufacturing than the other two counties; in 2014, nearly 19.0 percent of total private nonfarm employment in the county was in manufacturing.6 Job growth in the middle Tennessee region has been very strong in the past few years, exceeding the rate of growth of the state and nation. During the 12 months ending June 2014, nonfarm payrolls increased by 25,100 jobs, or 3.2 percent, to 820,900 jobs. The current number of jobs in the Nashville MSA is nearly 8.0 percent more than the previous peak of 766,500 jobs during the 12 months ending June 2008. Notable job growth occurred in the professional and business services, education and health care services, leisure and hospitality, manufacturing and mining, logging, and construction sectors. Much of the professional, business services and health care services growth has occurred in Davidson and Williamson counties while the leisure and hospitality growth has happened primarily in Nashville, driven by a new convention center. Rutherford County has seen more growth in manufacturing and supply chain management, with Amazon and others opening new distribution centers in the county. 7
3 US Census Bureau Residential Construction Branch. Accessed through PolicyMap. Accessed on March 1, 2016; available from http://www.policymap.com 4 U.S. Department of Housing and Urban Development, Office of Policy Development and Research. Housing Market Profiles: Quick Facts About Nashville-Davidson—Murfreesboro—Franklin Tennessee. Accessed on March 1, 2016; available at: https://www.huduser.gov/portal/periodicals/USHMC/reg//NashvilleTN_HMP_July14.pdf 5 Nashville Area Chamber of Commerce. Accessed on September 8, 2015; available at: http://www.nashvilleareainfo.com/homepage/relocation-expansion/major-employers. 6 Bureau of Labor Statistics, REIS 7 U.S. Department of Housing and Urban Development, Office of Policy Development and Research. Comprehensive Housing Market Analysis, Nashville-Davidson--Murfreesboro--Franklin, Tennessee. As of July 1, 2014. Accessed on September 8, 2015; available at: http://www.huduser.org/portal/publications/pdf/NashvilleTN_comp_2014.pdf
Franklin Synergy Bank CRA Public Evaluation Franklin, Tennessee February 22, 2016
8
The following table shows the unemployment rates for the counties in the bank’s assessment area, the Nashville MSA and the state of Tennessee. The low unemployment rate throughout the assessment area is a further indication of the robust growth underway in the Nashville area.
Community Development Opportunities The Nashville market has a strong community development environment with numerous community service organizations targeting low-to-moderate income individuals and families. In addition, there are active community development financial institutions (CDFIs) specializing in affordable housing finance and small business lending, as well as an effective network of nonprofits providing financial counseling. These assets create a favorable environment and opportunity for banks to partner with nonprofits, developers and CDFIs to provide affordable housing, neighborhood revitalization, and small business development by investing, lending directly, or providing technical assistance to the organizations or those they serve. It is also important to note that the community development industry is most established in Davidson County, but many of the organizations serve a broader regional area. In the suburban counties, additional nonprofit capacity is needed to address community development needs. Affordable Housing and Neighborhood Stabilization The availability of affordable housing, and particularly rental housing, is one of the biggest concerns throughout the Nashville assessment area. Between 2009 and 2013, more than 40.0 percent of renters in the assessment area were paying more than 30.0 percent of their income for housing, and were therefore considered to be cost-burdened; close to 80.0 percent of the lowest income renters (incomes under $20,000) were paying more than 30.0 percent of their income for rent.8 A report by the National Low Income Housing Coalition confirms housing affordability is a problem in Nashville, finding that a minimum wage worker would have to work 2.2 jobs (assuming 40 hours a week for 52 weeks a year) in order to afford the fair market rent for a 2-bedroom apartment in the Nashville MSA.9 There are many new luxury apartment complexes recently completed or
8 US Census Bureau. Percent of Renters Cost Burdened, PolicyMap. Accessed on September 8, 2015; available at: http://www.policymap.com. 9 National Low Income Housing Coalition. “Out of Reach 2014.” Accessed on September 8, 2015; available at: http://nlihc.org/oor/2014
Not Seasonally Adjusted. Source: Bureau of Labor Statistics
Franklin Synergy Bank CRA Public Evaluation Franklin, Tennessee February 22, 2016
9
under construction, particularly near the urban centers in the assessment area. However, very few affordable rentals are being developed, largely because land prices have become too high to make these projects work, particularly in the areas close to employment and transit. There are affordable housing efforts underway in both Nashville and Franklin. The city of Franklin, via the city’s Housing Commission, is working to develop a multi-faceted incentive program designed to address the shortage of affordable housing in the community. According to a community contact, the city has recognized that the vast majority of the people who work in the city, including public service employees and those employed in the dominant retail and service sectors, cannot afford to buy a home in the city. A 2014 housing assessment identified the greatest needs to be starter homes under $250,000 and affordable rental housing.10 However the community contact noted that in 2016, there were fewer than 50 homes on the market in Franklin for less than $325,000. The city is exploring various programs and policies to expand affordable housing.11 In addition, the Franklin Housing Authority has embarked on a multi-year redevelopment plan for all of the city’s public housing units. The goal is to increase housing density and housing choices on existing public housing sites. To date, one senior living project has been developed. The plan is based on public/private partnerships and leveraging a multitude of funding sources, including low-income housing tax credits, Federal Home Loan Bank of Atlanta funds and other public and private sources.12 There are a number of opportunities for financial institutions to participate in this effort by providing financing and technical assistance and eventually, services to the residents at the redeveloped projects. Nashville is also developing a strategy to increase affordable housing. A key component of this strategy is the Barnes Housing Trust Fund (the “Barnes Fund”), which was created in 2013. The Barnes Fund is administered by The Housing Fund, which is a CDFI that provides flexible financing for affordable housing and community development throughout middle Tennessee. Funding to capitalize the Barnes Fund has been limited, and city leaders are exploring a new dedicated revenue source to expand the fund. The trust fund provides critical funding (grants and funds to reduce borrowing costs) that is needed to develop new affordable housing in Nashville.13 In addition, the city is pursuing other policies and new programs to support both new affordable housing and to help preserve existing affordable housing in quickly gentrifying neighborhoods. Similar to the efforts in Franklin, the housing strategy relies on public/private partnerships and provides an opportunity for financial institution engagement. One of the other challenges cited by community contacts in the assessment area is finding qualified homebuyers. Many low- and moderate-income homebuyers are still recovering from the economic downturn, and remain in part time or low wage jobs. Finding homebuyers who can qualify for mortgages is difficult, especially given tighter underwriting standards at many banks. Small Business and Economic Development Small businesses play a vital role in the Nashville economy. According to 2014 Dun & Bradstreet information, there were 54,143 businesses within the assessment area, of which 88.5 percent had total annual revenues less than or equal to $1 million, and were therefore considered to be small businesses. Small business lending in the assessment area is finally recovering from the recession. The number of small business loans in 2013 increased
10 BBC Research & Consulting. “City of Franklin Housing Needs Assessment.” Accessed on March 9, 2016; available at: http://www.franklintn.gov/Home/ShowDocument?id=19661 11 The Tennessean. April 23, 2014. “Report: Franklin must create more affordable housing.” Accessed on March 9, 2016; available: http://www.tennessean.com/story/news/local/williamson/2014/04/23/report-franklin-must-create-affordable-housing/8066229/ 12 Franklin Housing Authority. “Master Housing Plan.” Accessed on March 9, 2016; available: http://www.franklinhousingauthority.com/redevelopment/master-housing-plan 13 Nashville Mayor’s Office, Barnes Housing Trust Fund. Accessed on March 9, 2016; available at: https://www.nashville.gov/Mayors-Office/Economic-Opportunity-and-Empowerment/Affordable-Housing/Barnes-Fund.aspx
Franklin Synergy Bank CRA Public Evaluation Franklin, Tennessee February 22, 2016
10
by 49.0 percent from a record low in 2010. There are a number of non-profit small business providers active in the assessment area providing underserved small businesses with financing, education, support services, and access to angel investors to help spur job creation and business growth. A community contact with a CDFI specializing in small business lending mentioned that economic conditions in middle Tennessee have recovered, with most industries back to prerecession levels, and there exists enormous opportunities for entrepreneurs and start-ups. According to the contact, direct investments and contributions into CDFIs is the best opportunity for bank participation. Unlike banks, CDFIs do not have underwriting and loan suitability constraints. Furthermore, local financial institutions can support CDFIs by serving on loan or advisory committees, sending referrals, and sponsoring business support programming for current and prospective entrepreneurs. Increasing Financial Capability and Stability While the Nashville economy has been thriving, the number of people living in poverty has also been rising. In Davidson County, nearly 20.0 percent of the population was living in poverty in 2014.14 The concentration of people living in poverty is lower in the other counties, but rising nonetheless. Compounding the challenges of living in poverty, many lower-income families are not participating in mainstream financial services. Approximately 9.4 percent of households are unbanked in the Nashville MSA, meaning they have no type of deposit account with a financial institution. In addition, 18.4 percent of households are considered underbanked, meaning they have a bank account but also regularly use alternative financial services providers.15 There are initiatives underway by community development organizations and financial institutions to address the financial stability of low- and moderate-income individuals. First, local United Way chapters lead an active network of volunteer income tax assistance (VITA) sites in Davidson, Williamson and Rutherford counties that provide free tax preparation for individuals and families earning less than $62,000. According to the United Way of Metropolitan Nashville, the middle Tennessee network of VITA sites prepared over 13,800 tax returns in 2015. In addition to tax preparation, many of the VITA sites promote other financial stability programs providing a good opportunity for local financial institutions to engage with low- and moderate-income consumers by promoting education and services. Second, Bank On Music City, led by the United Way of Metropolitan Nashville, is an effort to increase access to mainstream financial services for currently unbanked individuals. Five financial institutions are participating in this initiative to provide low-cost basic transaction accounts. Furthermore, Nashville was one of five cities selected in 2013 to receive a grant by Bloomberg Philanthropies and Living Cities’ Cities for Financial Empowerment (CFE) Fund to help residents reduce debt and build assets through free, one-on-one financial counseling centers. Since opening, these centers have served more than 3,300 clients and helped them reduce debt by nearly $2.0 million.16 There are 10 Financial Empowerment Centers (FECs) throughout Nashville, and the city is exploring new strategies to ensure the long term sustainability of this highly effective program. There are opportunities for financial institutions to participate in financial education classes and related programming run through the FECs. Demographic Characteristics by Census Tract
14 Metropolitan Social Services, Planning, Coordination & Social Data Analysis. “2015 Community Needs Evaluation.” Accessed on March 9, 2016; available at: http://www.nashville.gov/Portals/0/SiteContent/SocialServices/docs/cne/2015ExecSumCNEcombined030216surveylink.pdf 15 2013 FDIC National Survey of Unbanked and Underbanked Households. Accessed on March 9, 2016; available at: http://economicinclusion.gov/ 16 Nashville Mayor’s Office. Accessed on March 9, 2016; available at: http://www.nashville.gov/Mayors-Office/Economic-Opportunity-and-Empowerment/Financial-Empowerment-Center.aspx
Franklin Synergy Bank CRA Public Evaluation Franklin, Tennessee February 22, 2016
11
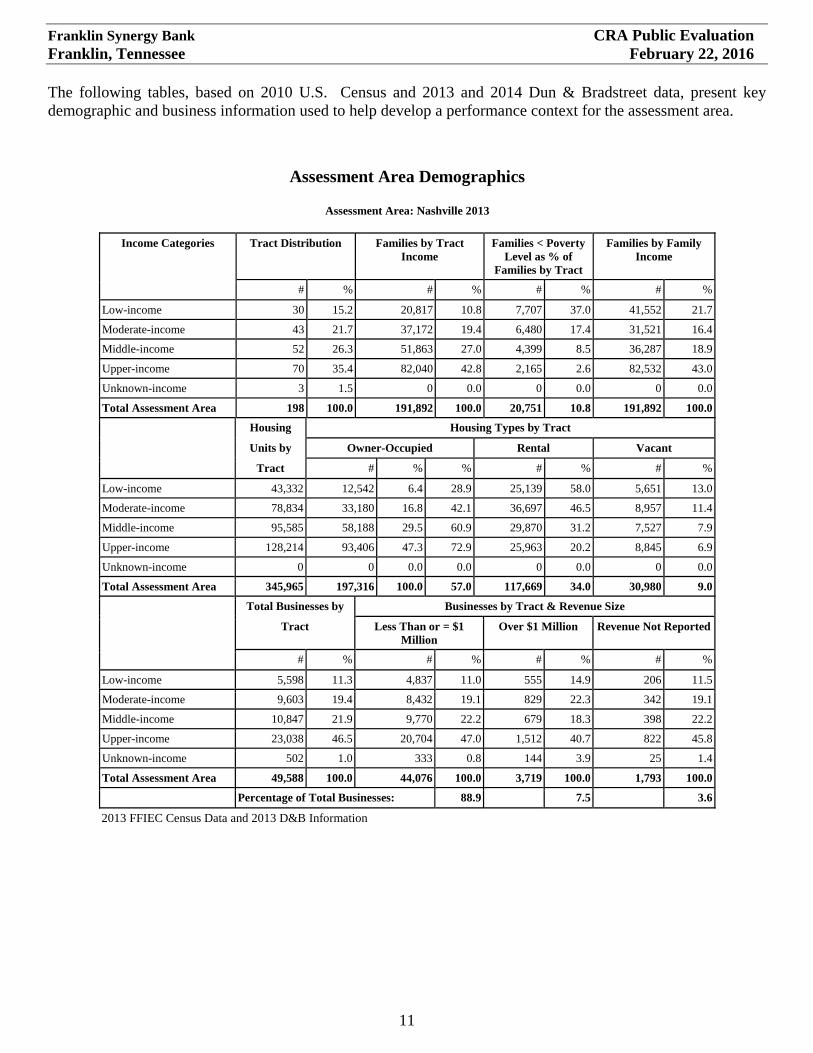
The following tables, based on 2010 U.S. Census and 2013 and 2014 Dun & Bradstreet data, present key demographic and business information used to help develop a performance context for the assessment area.
Assessment Area Demographics
Assessment Area: Nashville 2013
Income Categories Tract Distribution Families by Tract Income
Total Assessment Area 49,588 100.0 44,076 100.0 3,719 100.0 1,793 100.0
Percentage of Total Businesses: 88.9 7.5 3.6
2013 FFIEC Census Data and 2013 D&B Information
Franklin Synergy Bank CRA Public Evaluation Franklin, Tennessee February 22, 2016
12
CONCLUSIONS WITH RESPECT TO PERFORMANCE TESTS LENDING TEST Overview Franklin Synergy Bank’s overall performance rating for the lending test is satisfactory. The bank’s lending performance is evaluated by an analysis of HMDA and commercial loans originated between January 1, 2013 and December 31, 2014. The LTD ratio is reasonable given the institution’s size, financial condition, and competition in the market. The majority of loans were originated inside the assessment area. The geographic
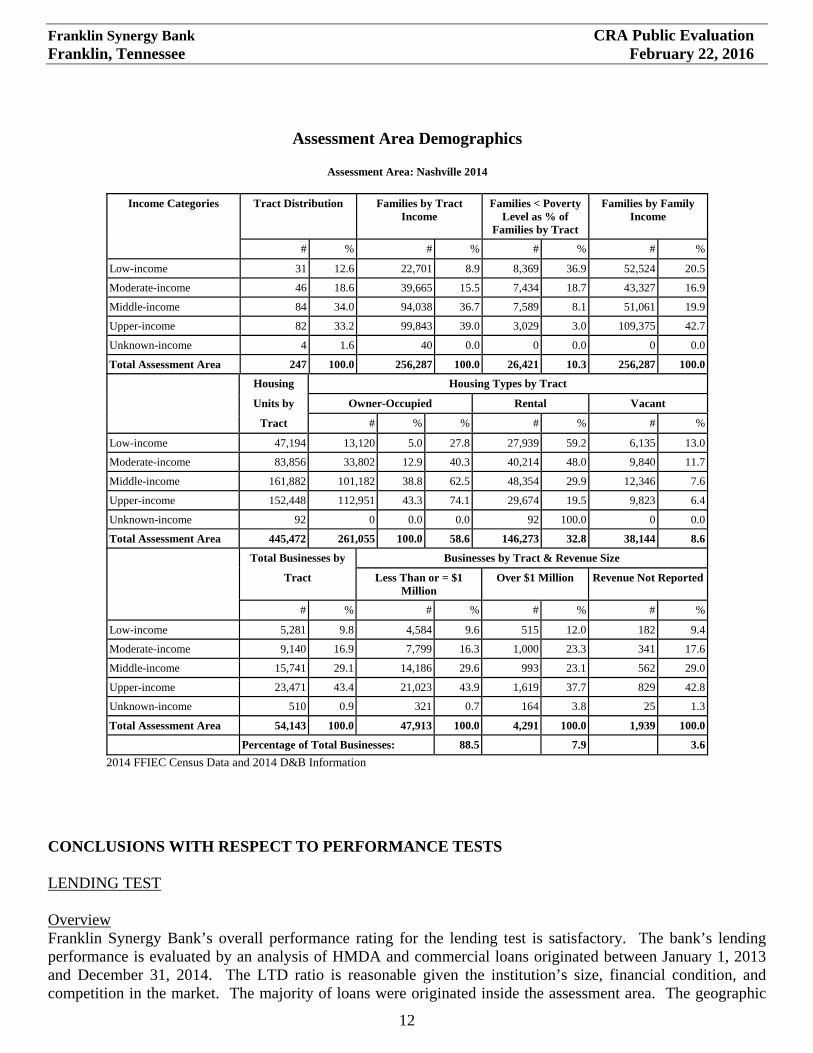
Assessment Area Demographics
Assessment Area: Nashville 2014
Income Categories Tract Distribution Families by Tract Income
Total Assessment Area 54,143 100.0 47,913 100.0 4,291 100.0 1,939 100.0
Percentage of Total Businesses: 88.5 7.9 3.6
2014 FFIEC Census Data and 2014 D&B Information
Franklin Synergy Bank CRA Public Evaluation Franklin, Tennessee February 22, 2016
13
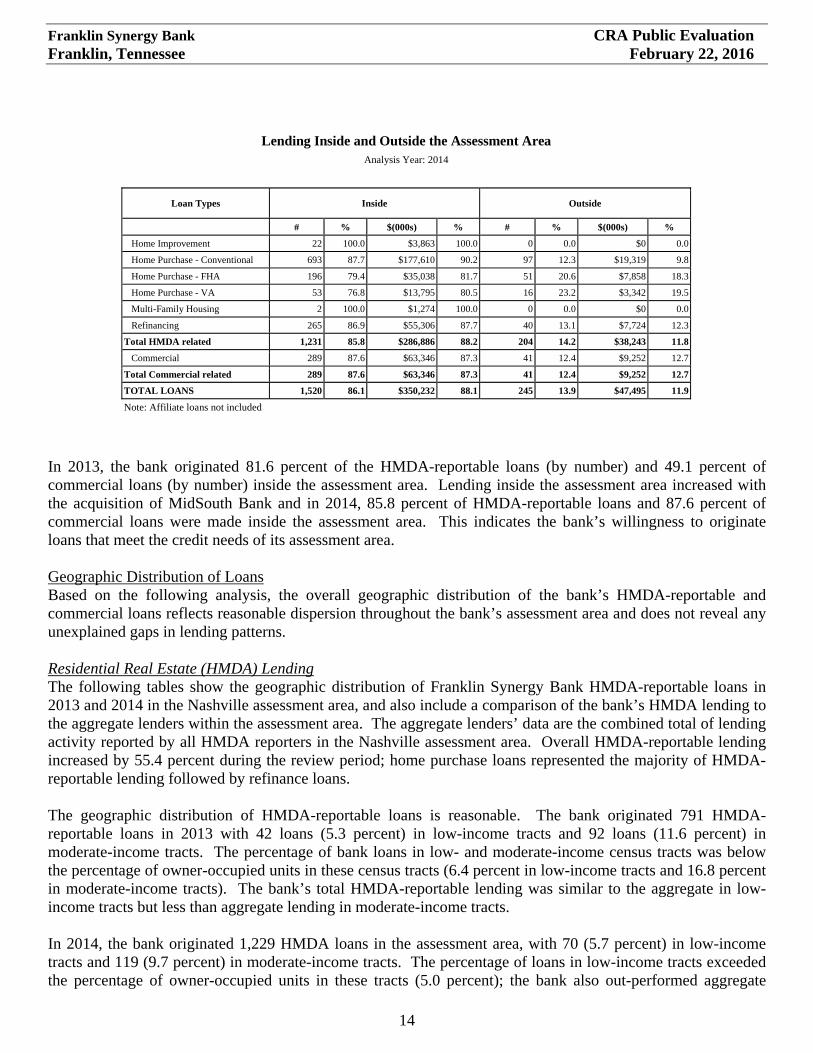
distribution of loans reflects reasonable dispersion throughout the bank’s assessment areas and the distribution of borrowers reflects reasonable penetration among customers of different income levels and businesses of different sizes. Performance context information, such as demographic and economic conditions, competition, and the bank’s structure was also considered in the evaluation of the bank’s lending performance. Due to the change in the assessment area definition during the review period, lending performance in 2013 and 2014 was evaluated separately. Loan-to-Deposit Ratio The bank’s net average LTD ratio for the 12 quarters ending December 31, 2015, was 66.4 percent, which is considered reasonable given the bank’s size, financial condition, lending strategy, and competition in the assessment area. The bank’s average LTD ratio was compared to the average LTD ratios of four other financial institutions of similar asset size and with branch offices in the assessment area. Franklin Synergy’s LTD ratio was below similar institutions, where the average LTD ratio ranged from 75.0 percent to 104.6 percent. Assessment Area Concentration The bank originated the majority of total loans to borrowers residing in and businesses located within the bank’s assessment area. The tables below show the number and percentage of loans that were located inside and outside of the bank’s assessment areas in 2013 and 2014.
Lending Inside and Outside the Assessment Area
Analysis Year: 2013
Loan Types Inside Outside
# % $(000s) % # % $(000s) %
Home Improvement 11 84.6 $2,618 91.0 2 15.4 $258 9.0
Total Commercial related 140 49.1 $29,078 46.0 145 50.9 $34,086 54.0
TOTAL LOANS 931 74.2 $238,369 78.2 323 25.8 $66,510 21.8
Note: Affiliate loans not included
Franklin Synergy Bank CRA Public Evaluation Franklin, Tennessee February 22, 2016
14
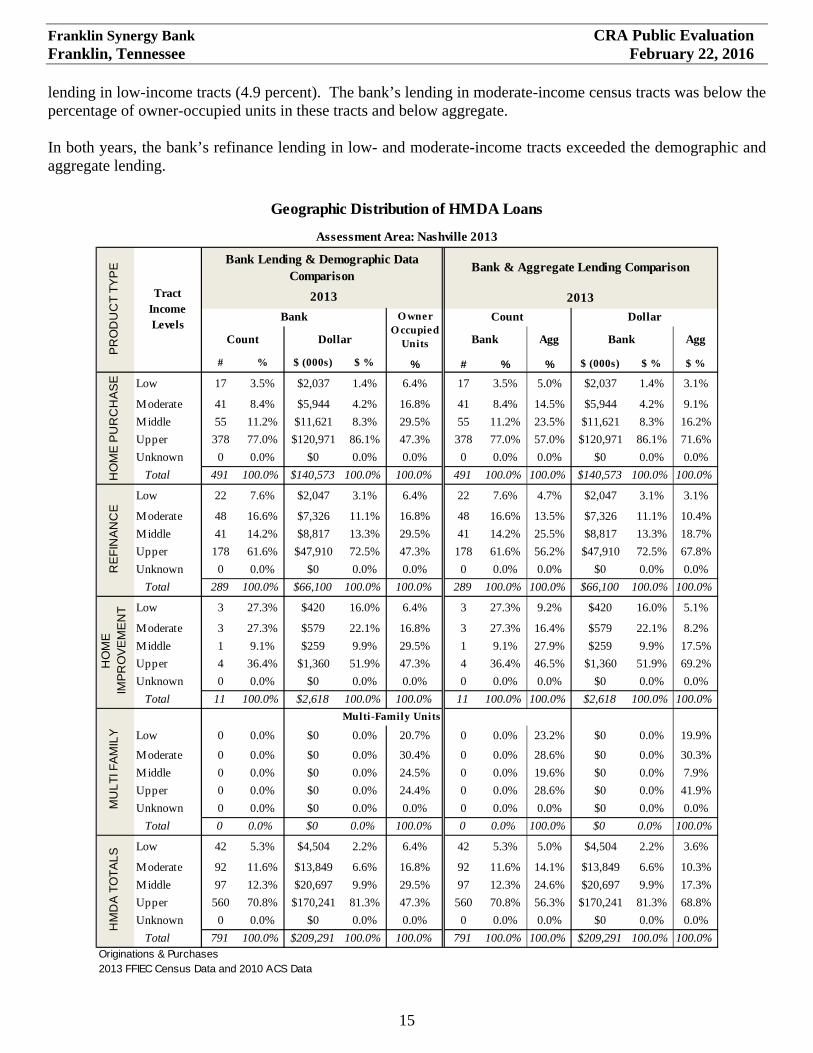
In 2013, the bank originated 81.6 percent of the HMDA-reportable loans (by number) and 49.1 percent of commercial loans (by number) inside the assessment area. Lending inside the assessment area increased with the acquisition of MidSouth Bank and in 2014, 85.8 percent of HMDA-reportable loans and 87.6 percent of commercial loans were made inside the assessment area. This indicates the bank’s willingness to originate loans that meet the credit needs of its assessment area. Geographic Distribution of Loans Based on the following analysis, the overall geographic distribution of the bank’s HMDA-reportable and commercial loans reflects reasonable dispersion throughout the bank’s assessment area and does not reveal any unexplained gaps in lending patterns. Residential Real Estate (HMDA) Lending The following tables show the geographic distribution of Franklin Synergy Bank HMDA-reportable loans in 2013 and 2014 in the Nashville assessment area, and also include a comparison of the bank’s HMDA lending to the aggregate lenders within the assessment area. The aggregate lenders’ data are the combined total of lending activity reported by all HMDA reporters in the Nashville assessment area. Overall HMDA-reportable lending increased by 55.4 percent during the review period; home purchase loans represented the majority of HMDA-reportable lending followed by refinance loans. The geographic distribution of HMDA-reportable loans is reasonable. The bank originated 791 HMDA-reportable loans in 2013 with 42 loans (5.3 percent) in low-income tracts and 92 loans (11.6 percent) in moderate-income tracts. The percentage of bank loans in low- and moderate-income census tracts was below the percentage of owner-occupied units in these census tracts (6.4 percent in low-income tracts and 16.8 percent in moderate-income tracts). The bank’s total HMDA-reportable lending was similar to the aggregate in low-income tracts but less than aggregate lending in moderate-income tracts. In 2014, the bank originated 1,229 HMDA loans in the assessment area, with 70 (5.7 percent) in low-income tracts and 119 (9.7 percent) in moderate-income tracts. The percentage of loans in low-income tracts exceeded the percentage of owner-occupied units in these tracts (5.0 percent); the bank also out-performed aggregate
Lending Inside and Outside the Assessment Area
Analysis Year: 2014
Loan Types Inside Outside
# % $(000s) % # % $(000s) %
Home Improvement 22 100.0 $3,863 100.0 0 0.0 $0 0.0
Total Commercial related 289 87.6 $63,346 87.3 41 12.4 $9,252 12.7
TOTAL LOANS 1,520 86.1 $350,232 88.1 245 13.9 $47,495 11.9
Note: Affiliate loans not included
Franklin Synergy Bank CRA Public Evaluation Franklin, Tennessee February 22, 2016
15
lending in low-income tracts (4.9 percent). The bank’s lending in moderate-income census tracts was below the percentage of owner-occupied units in these tracts and below aggregate. In both years, the bank’s refinance lending in low- and moderate-income tracts exceeded the demographic and aggregate lending.
Total 1,231 100.0% $286,886 100.0% 100.0% 1,231 100.0% 100.0% $286,886 100.0% 100.0%Originations & Purchases2014 FFIEC Census Data and 2010 ACS Data
HM
DA
TO
TA
LS
HO
ME
PU
RC
HA
SE
RE
FIN
AN
CE
HO
ME
IM
PR
OV
EM
EN
TM
UL
TI F
AM
ILY
Multi-Family Units
Geographic Distribution of HMDA Loans
Assessment Area: Nashville 2014P
RO
DU
CT
TY
PE
Tract Income Levels
Bank Lending & Demographic Data Comparison
Bank & Aggregate Lending Comparison
2014 2014
Bank O wner O ccupied
Units
Count Dollar
Count Dollar Bank Bank
Franklin Synergy Bank CRA Public Evaluation Franklin, Tennessee February 22, 2016
17
Commercial Lending The following tables show the geographic distribution of commercial loans within the Nashville assessment area in 2013 and 2014. As shown, Franklin Synergy originated 140 commercial loans in 2013 and 289 loans in 2014. In 2013, the bank orignated 9 loans in low-income tracts (6.4 percent) and 31 loans in moderate income tracts (22.1 percent). By comparison, 11.0 percent of small businesses were located in low-income census tracts and 19.1 percent of small businesses were located in moderate-income tracts. In 2014, the bank originated 21 loans (7.3 percent) in low-income tracts where 9.6 percent of small business are located and 41 in moderate-income tracts (14.2 percent) where 16.3 percent of small businesses are located. The geographic distribution of the bank’s commercial lending is considered reasonable when competition and performance context factors are taken into consideration.
# % $ (000s) $ % %
Low 9 6.4% $2,035 7.0% 11.0%
Moderate 31 22.1% $6,371 21.9% 19.1%
Middle 18 12.9% $2,559 8.8% 22.2%
Upper 81 57.9% $17,912 61.6% 47.0%
Unknown 1 0.7% $200 0.7% 0.8%
Tr Unknown 0 0.0% $0 0.0%
Total 140 100.0% $29,078 100.0% 100.0%
Originations & Purchases2013 FFIEC Census Data, 2010 ACS Data, and 2013 D&B Information
Tract Income Levels
Bank Lending & Demographic Data Comparison
2013
Bank Small BusinessesCount Dollar
Geographic Distribution of Commercial Loans
Assessment Area: Nashville 2013
Franklin Synergy Bank CRA Public Evaluation Franklin, Tennessee February 22, 2016
18
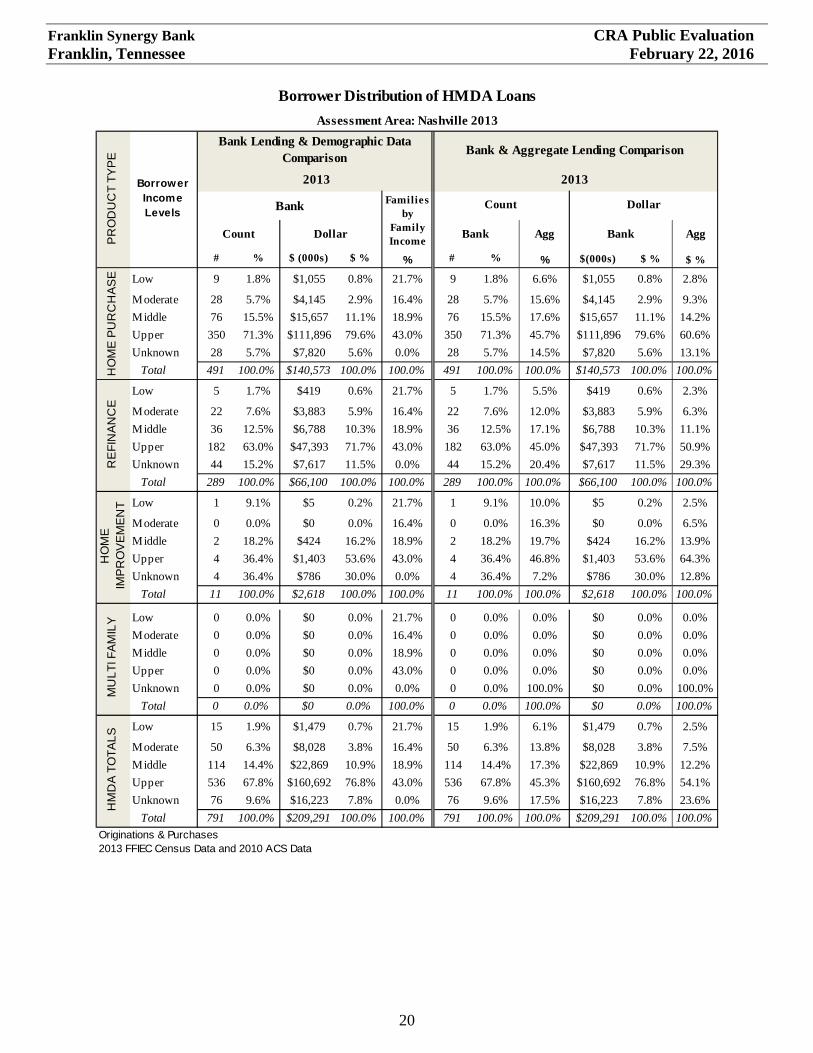
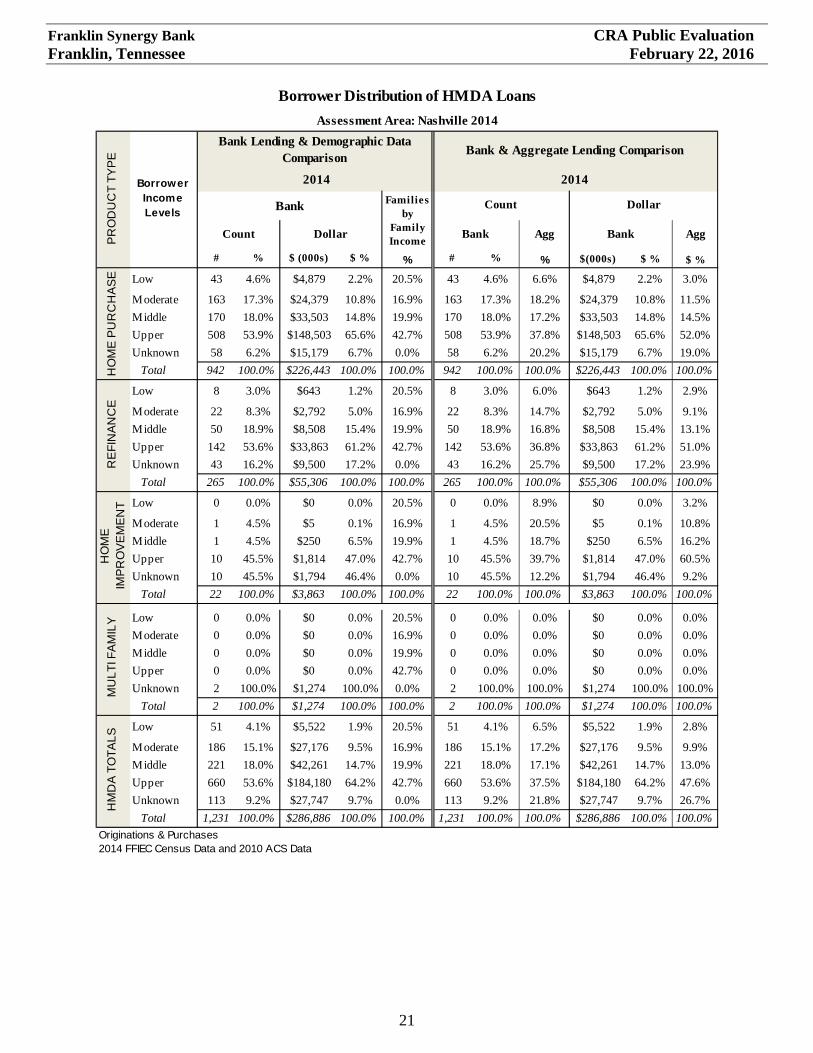
Lending to Borrowers of Different Incomes and Businesses of Different Sizes For this analysis, the distribution of HMDA-reportable lending across borrower income levels and small business lending across business revenue sizes was compared to available demographic information. Performance context issues and the performance of other banks in the assessment area were also considered. Considering all of these factors, the bank’s distribution of loans reflects reasonable penetration among borrowers of different income levels and to businesses of different sizes. Residential Real Estate (HMDA) Lending The following tables show the distribution of the bank’s HMDA-reportable loans by the income level of the borrowers, which is poor. In 2013, 1.9 percent of HMDA-reportable loans were originated to low-income borrowers, which is far less than both the percentage of families considered low-income (21.7 percent of total families) and aggregate lending performance (6.1 percent). The bank originated 6.3 percent of HMDA-reportable loans to moderate-income borrowers; the bank’s performance compares poorly to the demographic (16.4 percent of families considered moderate-income) and aggregate (13.8 percent of total loans to moderate-income borrowers). In 2014, 4.1 percent of the bank’s total HMDA-reportable loans were made to low-income borrowers, which was significantly less than the percentage of families in the assessment area classified as low-income (20.5 percent) and weak compared to aggregate performance (6.5 percent). The bank’s lending to moderate-income borrowers improved in 2014, with 15.1 percent of total HMDA-reportable loans to moderate-income borrowers, compared to 16.9 percent of families considered moderate-income in the assessment area. The percentage of the bank’s loans to moderate-income borrowers was slightly less than the percentage of aggregate loans to these borrowers. There are a number of performance context factors impacting home purchase lending performance to low- and moderate-income households. As discussed earlier, affordable housing is a significant concern in the assessment area. There is an insufficient supply of affordable housing throughout the assessment area, but specifically in Williamson County and the other high growth submarkets where the bank has a branch presence.
# % $ (000s) $ % %
Low 21 7.3% $4,616 7.3% 9.6%
Moderate 41 14.2% $9,208 14.5% 16.3%
Middle 57 19.7% $12,395 19.6% 29.6%
Upper 170 58.8% $37,126 58.6% 43.9%
Unknown 0 0.0% $0 0.0% 0.7%
Tr Unknown 0 0.0% $0 0.0%
Total 289 100.0% $63,346 100.0% 100.0%
Originations & Purchases2014 FFIEC Census Data, 2010 ACS Data, and 2014 D&B Information
Tract Income Levels
Bank Lending & Demographic Data Comparison
2014
Bank Small BusinessesCount Dollar
Geographic Distribution of Commercial Loans
Assessment Area: Nashville 2014
Franklin Synergy Bank CRA Public Evaluation Franklin, Tennessee February 22, 2016
19
Additionally, there is a mismatch between incomes and housing affordability in the assessment area. For example, census data shows that 22.8 percent of the families are considered low-income and 16.4 percent are considered moderate-income in the assessment area. Using the assumption that a borrower can afford a home for approximately three times annual income, based on the 2014 FFIEC estimated median family income for the Nashville-Davidson-Franklin-Murfreesboro MSA, a family at the top of the low-income bracket ($32,799) can afford a $98,397 home; a family at the top of the moderate-income bracket ($52,479) could afford a home priced at $157,387. The median home sales price in the assessment area in the fourth quarter of 2015 ranged from $190,000 in Rutherford County to $410,998 in Williamson County. While there may be pockets of more affordable housing across the assessment area, home prices generally exceed what low- and moderate-income families can afford to purchase without significant assistance.
Franklin Synergy Bank CRA Public Evaluation Franklin, Tennessee February 22, 2016
Originations & Purchases2014 FFIEC Census Data and 2010 ACS Data
MU
LT
I FA
MIL
YH
MD
A T
OT
AL
SBorrower Distribution of HMDA Loans
Assessment Area: Nashville 2014P
RO
DU
CT
TY
PE
Borrower Income Levels
Bank Lending & Demographic Data Comparison
Bank & Aggregate Lending Comparison
2014 2014
Bank Families by
Family Income
Count Dollar
Count Dollar Bank Bank
HO
ME
IM
PR
OV
EM
EN
TR
EF
INA
NC
EH
OM
E P
UR
CH
AS
E
Franklin Synergy Bank CRA Public Evaluation Franklin, Tennessee February 22, 2016
22
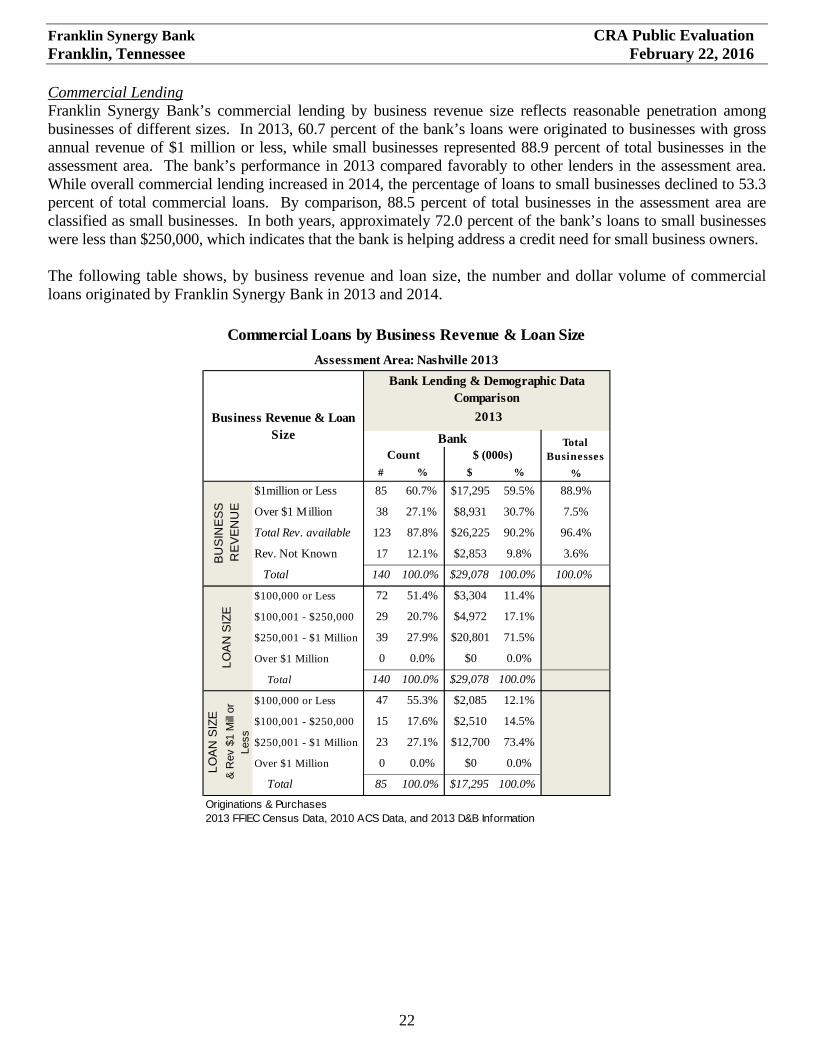
Commercial Lending Franklin Synergy Bank’s commercial lending by business revenue size reflects reasonable penetration among businesses of different sizes. In 2013, 60.7 percent of the bank’s loans were originated to businesses with gross annual revenue of $1 million or less, while small businesses represented 88.9 percent of total businesses in the assessment area. The bank’s performance in 2013 compared favorably to other lenders in the assessment area. While overall commercial lending increased in 2014, the percentage of loans to small businesses declined to 53.3 percent of total commercial loans. By comparison, 88.5 percent of total businesses in the assessment area are classified as small businesses. In both years, approximately 72.0 percent of the bank’s loans to small businesses were less than $250,000, which indicates that the bank is helping address a credit need for small business owners. The following table shows, by business revenue and loan size, the number and dollar volume of commercial loans originated by Franklin Synergy Bank in 2013 and 2014.
# % $ %
$1million or Less 85 60.7% $17,295 59.5%
Over $1 Million 38 27.1% $8,931 30.7%
Total Rev. available 123 87.8% $26,225 90.2%
Rev. Not Known 17 12.1% $2,853 9.8%
Total 140 100.0% $29,078 100.0%
$100,000 or Less 72 51.4% $3,304 11.4%
$100,001 - $250,000 29 20.7% $4,972 17.1%
$250,001 - $1 Million 39 27.9% $20,801 71.5%
Over $1 Million 0 0.0% $0 0.0%
Total 140 100.0% $29,078 100.0%
$100,000 or Less 47 55.3% $2,085 12.1%
$100,001 - $250,000 15 17.6% $2,510 14.5%
$250,001 - $1 Million 23 27.1% $12,700 73.4%
Over $1 Million 0 0.0% $0 0.0%
Total 85 100.0% $17,295 100.0%
Originations & Purchases2013 FFIEC Census Data, 2010 ACS Data, and 2013 D&B Information
BU
SIN
ES
S
RE
VE
NU
E
88.9%
7.5%
96.4%
3.6%
100.0%
LO
AN
SIZ
EL
OA
N S
IZE
& R
ev $
1 M
ill or
Le
ss
Assessment Area: Nashville 2013
Business Revenue & Loan Size
Bank Lending & Demographic Data Comparison
2013
Bank Total BusinessesCount $ (000s)
%
Commercial Loans by Business Revenue & Loan Size
Franklin Synergy Bank CRA Public Evaluation Franklin, Tennessee February 22, 2016
Franklin Synergy Bank’s community development performance is adequate considering the bank’s asset size, capacity, service area, and competition. The bank provides a combination of community development loans, investments and services; these activities demonstrate adequate responsiveness to the community development needs of the assessment area. During the review period, Franklin Synergy Bank made 21 qualifying community development loans totaling $18.9 million. Specifically, the bank made six SBA 504 and 7A loans to small businesses totaling $7.1 million. The bank also made 10 loans totaling $8.1 million to support affordable housing, primarily in Nashville and Murfreesboro. These loans helped preserve affordable rental housing, which is a critical need in the assessment area.
# % $ %
$1million or Less 154 53.3% $33,703 53.2%
Over $1 Million 83 28.7% $18,680 29.5%
Total Rev. available 237 82.0% $52,383 82.7%
Rev. Not Known 52 18.0% $10,963 17.3%
Total 289 100.0% $63,346 100.0%
$100,000 or Less 133 46.0% $6,377 10.1%
$100,001 - $250,000 73 25.3% $13,791 21.8%
$250,001 - $1 Million 83 28.7% $43,178 68.2%
Over $1 Million 0 0.0% $0 0.0%
Total 289 100.0% $63,346 100.0%
$100,000 or Less 67 43.5% $2,971 8.8%
$100,001 - $250,000 44 28.6% $8,350 24.8%
$250,001 - $1 Million 43 27.9% $22,382 66.4%
Over $1 Million 0 0.0% $0 0.0%
Total 154 100.0% $33,703 100.0%
Originations & Purchases2014 FFIEC Census Data, 2010 ACS Data, and 2014 D&B Information
BU
SIN
ES
S
RE
VE
NU
E
88.5%
7.9%
96.4%
3.6%
100.0%
LO
AN
SIZ
EL
OA
N S
IZE
& R
ev $
1 M
ill or
Le
ss
Assessment Area: Nashville 2014
Business Revenue & Loan Size
Bank Lending & Demographic Data Comparison
2014
Bank Total BusinessesCount $ (000s)
%
Commercial Loans by Business Revenue & Loan Size
Franklin Synergy Bank CRA Public Evaluation Franklin, Tennessee February 22, 2016
24
The bank made three qualified community development investments totaling $5.0 million during the review period; the bank also had seven investments purchased prior to the review period with a December 31, 2015 book value of $5.7 million. All of the current period investments were securities backed by mortgages to low- and moderate-income borrowers or in low- and moderate-income tracts. In addition, the bank had 63 contributions for approximately $65,000. The majority of the contributions supported organizations providing community services to low- and moderate-income individuals and to schools with more than 51.0 percent of the students receiving free and reduced price lunch. Notably, the bank provided financial support to a local housing authority to offer a variety of services to public housing residents. Lastly, the bank contributed 966 hours of qualified community development service hours; most of the hours were service on the board of directors of nonprofit organizations that provide community services targeted to low- and moderate-income individuals.
FAIR LENDING OR OTHER ILLEGAL CREDIT PRACTICES REVIEW No evidence of prohibited discrimination or the use of other illegal credit practices was noted during the examination. The bank is in compliance with the substantive provisions of antidiscrimination laws and regulations.
Franklin Synergy Bank CRA Public Evaluation Franklin, Tennessee February 22, 2016
25
APPENDIX A
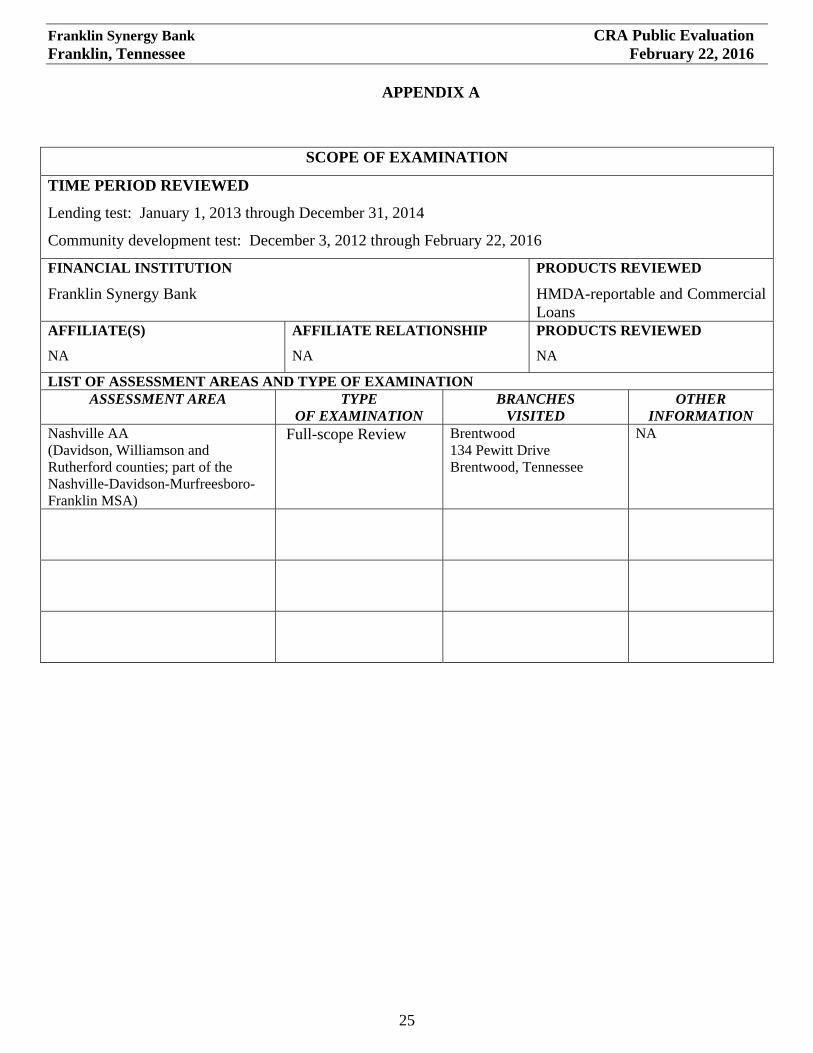
SCOPE OF EXAMINATION
TIME PERIOD REVIEWED
Lending test: January 1, 2013 through December 31, 2014
Community development test: December 3, 2012 through February 22, 2016
FINANCIAL INSTITUTION
Franklin Synergy Bank
PRODUCTS REVIEWED
HMDA-reportable and Commercial Loans
AFFILIATE(S)
NA
AFFILIATE RELATIONSHIP
NA
PRODUCTS REVIEWED
NA
LIST OF ASSESSMENT AREAS AND TYPE OF EXAMINATION ASSESSMENT AREA TYPE
OF EXAMINATION BRANCHES
VISITED OTHER
INFORMATION Nashville AA (Davidson, Williamson and Rutherford counties; part of the Nashville-Davidson-Murfreesboro-Franklin MSA)
Franklin Synergy Bank CRA Public Evaluation Franklin, Tennessee February 22, 2016
26
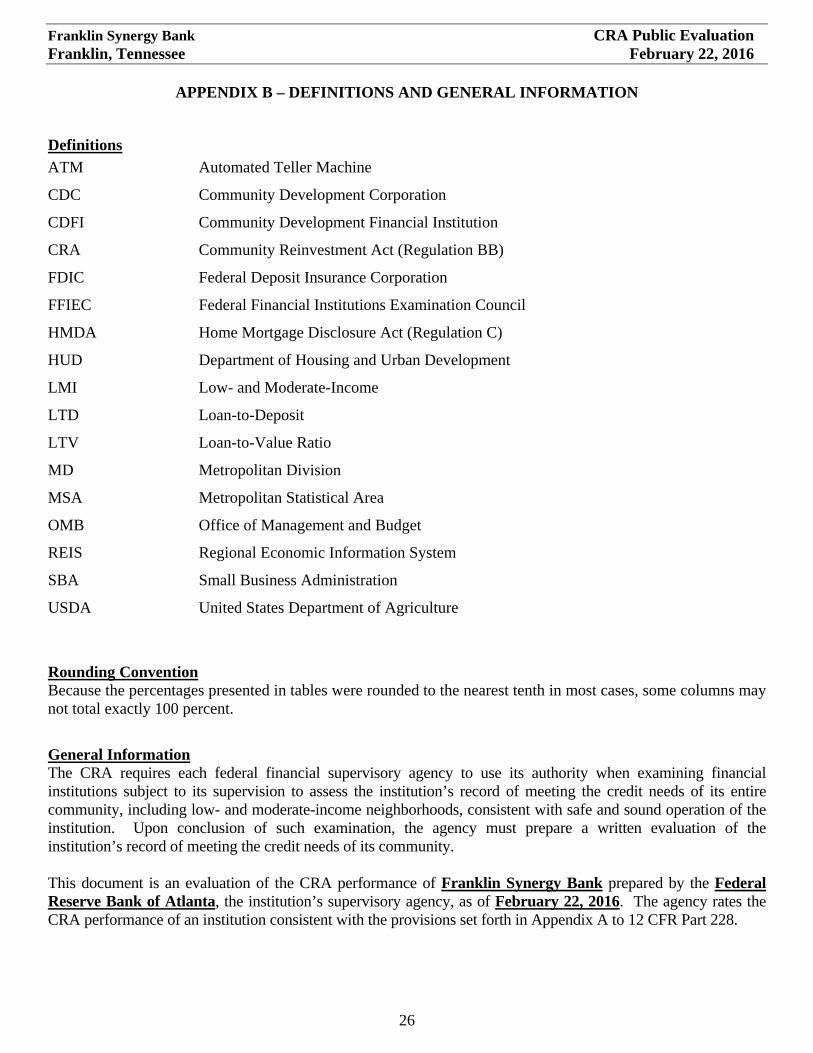
APPENDIX B – DEFINITIONS AND GENERAL INFORMATION
Definitions
ATM Automated Teller Machine
CDC Community Development Corporation
CDFI Community Development Financial Institution
CRA Community Reinvestment Act (Regulation BB)
FDIC Federal Deposit Insurance Corporation
FFIEC Federal Financial Institutions Examination Council
HMDA Home Mortgage Disclosure Act (Regulation C)
HUD Department of Housing and Urban Development
LMI Low- and Moderate-Income
LTD Loan-to-Deposit
LTV Loan-to-Value Ratio
MD Metropolitan Division
MSA Metropolitan Statistical Area
OMB Office of Management and Budget
REIS Regional Economic Information System
SBA Small Business Administration
USDA United States Department of Agriculture
Rounding Convention Because the percentages presented in tables were rounded to the nearest tenth in most cases, some columns may not total exactly 100 percent.
General Information The CRA requires each federal financial supervisory agency to use its authority when examining financial institutions subject to its supervision to assess the institution’s record of meeting the credit needs of its entire community, including low- and moderate-income neighborhoods, consistent with safe and sound operation of the institution. Upon conclusion of such examination, the agency must prepare a written evaluation of the institution’s record of meeting the credit needs of its community. This document is an evaluation of the CRA performance of Franklin Synergy Bank prepared by the Federal Reserve Bank of Atlanta, the institution’s supervisory agency, as of February 22, 2016. The agency rates the CRA performance of an institution consistent with the provisions set forth in Appendix A to 12 CFR Part 228.
Franklin Synergy Bank CRA Public Evaluation Franklin, Tennessee February 22, 2016
27
APPENDIX C – GLOSSARY Aggregate lending: The number of loans originated and purchased by all reporting lenders in specified income categories as a percentage of the aggregate number of loans originated and purchased by all reporting lenders in the metropolitan area/assessment area. Census tract: A small subdivision of metropolitan and other densely populated counties. Census tract boundaries do not cross county lines; however, they may cross the boundaries of metropolitan statistical areas. Census tracts usually have between 2,500 and 8,000 persons, and their physical size varies widely depending upon population density. Census tracts are designed to be homogeneous with respect to population characteristics, economic status, and living conditions to allow for statistical comparisons. Community development: All Agencies have adopted the following language. Affordable housing (including multi-family rental housing) for low- or moderate-income individuals; community services targeted to low- or moderate-income individuals; activities that promote economic development by financing businesses or farms that meet the size eligibility standards of the Small Business Administration’s Development Company or Small Business Investment Company programs (13 CFR 121.301) or have gross annual revenues of $1 million or less; or, activities that revitalize or stabilize low- or moderate-income geographies. Effective September 1, 2005, the Board of Governors of the Federal Reserve System, Office of the Comptroller of the Currency, and the Federal Deposit Insurance Corporation have adopted the following additional language as part of the revitalize or stabilize definition of community development. Activities that revitalize or stabilize-
I. Low-or moderate-income geographies; II. Designated disaster areas; or
III. Distressed or underserved nonmetropolitan middle-income geographies designated by the Board, Federal Deposit Insurance Corporation, and Office of the Comptroller of the Currency, based on-
a. Rates of poverty, unemployment, and population loss; or b. Population size, density, and dispersion. Activities that revitalize and stabilize
geographies designated based on population size, density, and dispersion if they help to meet essential community needs, including needs of low- and moderate-income individuals.
Effective January 19, 2010, the Board of Governors of the Federal Reserve System, the Office of the Comptroller of the Currency, and the Federal Deposit Insurance Corporation revised the definition of community development to include loans, investments, and services by financial institutions that-
I. Support, enable or facilitate projects or activities that meet the “eligible uses” criteria described in Section 2301(c) of the Housing and Economic Recovery Act of 2008 (HERA), Public Law 110-289, 122 Stat. 2654, as amended, and are conducted in designated target areas identified in plans approved by the United States Department of Housing and Urban Development in accordance with the Neighborhood Stabilization Program (NSP);
II. Are provided no later than two years after the last date funds appropriated for the NSP are required to be spent by grantees; and
III. Benefit low-, moderate-, and middle-income individuals and geographies in the bank's assessment area(s) or areas outside the bank's assessment area(s) provided the bank has adequately addressed the community development needs of its assessment area(s).
Consumer loan(s): A loan(s) to one or more individuals for household, family, or other personal expenditures. A consumer loan does not include a home mortgage, small business, or small farm loan. This definition includes the following categories: motor vehicle loans, credit card loans, home equity loans, other secured consumer loans, and other unsecured consumer loans.
Franklin Synergy Bank CRA Public Evaluation Franklin, Tennessee February 22, 2016
28
APPENDIX C – GLOSSARY (Continued) Family: Includes a householder and one or more other persons living in the same household who are related to the householder by birth, marriage, or adoption. The number of family households always equals the number of families; however, a family household may also include nonrelatives living with the family. Families are classified by type as either a married-couple family or other family, which is further classified into ‘male householder’ (a family with a male householder and no wife present) or ‘female householder’ (a family with a female householder and no husband present). Full-scope review: Performance under the Lending, Investment, and Service Tests is analyzed considering performance context, quantitative factors (for example, geographic distribution, borrower distribution, and total number and dollar amount of investments), and qualitative factors (for example, innovativeness, complexity, and responsiveness). Geography: A census tract delineated by the United States Bureau of the Census in the most recent decennial census. Home Mortgage Disclosure Act (HMDA): The statute that requires certain mortgage lenders that do business or have banking offices in a metropolitan statistical area to file annual summary reports of their mortgage lending activity. The reports include such data as the race, gender, and the income of applications, the amount of loan requested, and the disposition of the application (for example, approved, denied, and withdrawn). Home mortgage loans: Includes home purchase and home improvement loans as defined in the HMDA regulation. This definition also includes multi-family (five or more families) dwelling loans, loans for the purchase of manufactured homes and refinancings of home improvement and home purchase loans. Household: Includes all persons occupying a housing unit. Persons not living in households are classified as living in group quarters. In 100 percent tabulations, the count of households always equals the count of occupied housing units. Limited-scope review: Performance under the Lending, Investment, and Service Tests is analyzed using only quantitative factors (for example, geographic distribution, borrower distribution, total number and dollar amount of investments, and branch distribution). Low-income: Individual income that is less than 50 percent of the area median income, or a median family income that is less than 50 percent, in the case of a geography. Market share: The number of loans originated and purchased by the institution as a percentage of the aggregate number of loans originated and purchased by all reporting lenders in the metropolitan area/assessment area. Metropolitan area (MA): A metropolitan statistical area (MSA) or a metropolitan division (MD) as defined by the Office of Management and Budget. An MSA is a core area containing at least one urbanized area of 50,000 or more inhabitants, together with adjacent communities having a high degree of economic and social integration with that core. An MD is a division of an MSA based on specific criteria including commuting patterns. Only an MSA that has a population of at least 2.5 million may be divided into MDs. Middle-income: Individual income that is at least 80 percent and less than 120 percent of the area median income, or a median family income that is at least 80 percent and less than 120 percent, in the case of a geography.
Franklin Synergy Bank CRA Public Evaluation Franklin, Tennessee February 22, 2016
29
APPENDIX C – GLOSSARY (Continued) Moderate-income: Individual income that is at least 50 percent and less than 80 percent of the area median income, or a median family income that is at least 50 percent and less than 80 percent, in the case of a geography. Multi-family: Refers to a residential structure that contains five or more units. Other products: Includes any unreported optional category of loans for which the institution collects and maintains data for consideration during a CRA examination. Examples of such activity include consumer loans and other loan data an institution may provide concerning its lending performance. Owner-occupied units: Includes units occupied by the owner or co-owner, even if the unit has not been fully paid for or is mortgaged. Qualified investment: A qualified investment is defined as any lawful investment, deposit, membership share, or grant that has as its primary purpose community development. Rated area: A rated area is a state or multistate metropolitan area. For an institution with domestic branches in only one state, the institution’s CRA rating would be the state rating. If an institution maintains domestic branches in more than one state, the institution will receive a rating for each state in which those branches are located. If an institution maintains domestic branches in two or more states within a multistate metropolitan area, the institution will receive a rating for the multistate metropolitan area. Small loan(s) to business(es): A loan included in 'loans to small businesses' as defined in the Consolidated Report of Condition and Income (Call Report) and the Thrift Financial Reporting (TFR) instructions. These loans have original amounts of $1 million or less and typically are either secured by nonfarm or nonresidential real estate or are classified as commercial and industrial loans. However, thrift institutions may also exercise the option to report loans secured by nonfarm residential real estate as "small business loans" if the loans are reported on the TFR as nonmortgage, commercial loans. Small loan(s) to farm(s): A loan included in ‘loans to small farms’ as defined in the instructions for preparation of the Call Report. These loans have original amounts of $500,000 or less and are either secured by farmland, or are classified as loans to finance agricultural production and other loans to farmers. Upper-income: Individual income that is more than 120 percent of the area median income, or a median family income that is more than 120 percent, in the case of a geography.