+ All Categories
Home > Documents > FSC 630 Forensic Science Internship MU Topic Advisor: Dr ...

FSC 630 Forensic Science Internship MU Topic Advisor: Dr ...

Date post: 13-Mar-2022
Category:
Upload: others
View: 3 times
Download: 0 times
Share this document with a friend
63
1 NAME: Michelle Elizabeth Ball 901642420 FSC 630 Forensic Science Internship Marshall University Forensic Science Program MU Topic Advisor: Dr. Rankin (Reviewer) Internship Agency Supervisor Carolyn Trader-Moore, Forensic Chemist II, (606) 929-9142, [email protected] (Reviewer) Internship Agency Kentucky State Police Eastern Regional Forensic Laboratory, 1550 Wolohan Dr. STE#2 Ashland KY, 41102, (606) 929-9364 Technical Assistant: Larry Boggs (Reviewer) Inclusive Dates of Internship: May 20 – August 9, 2013
Transcript

1

NAME: Michelle Elizabeth Ball

901642420

FSC 630 Forensic Science Internship Marshall University Forensic Science Program

MU Topic Advisor: Dr. Rankin (Reviewer) Internship Agency Supervisor Carolyn Trader-Moore, Forensic Chemist II, (606) 929-9142, [email protected] (Reviewer) Internship Agency Kentucky State Police Eastern Regional Forensic Laboratory, 1550 Wolohan Dr. STE#2 Ashland KY, 41102, (606) 929-9364 Technical Assistant: Larry Boggs (Reviewer) Inclusive Dates of Internship: May 20 – August 9, 2013

2

Development of an Identification and Derivatization Method for Synthetic Cathinones by GC-MS using

Perfluoroacyl Anhydrides

Michelle Balla, B.S.; Carolyn Trader-Mooreb, M.S; Larry Boggsb, B.S.; Graham Rankina, PhD; Lauren Richards-Waugha , PhD

aMarshall University Forensic Science Program bKentucky State Police Eastern Regional Forensic Laboratory (KSP) Abstract

Synthetic cathinones have become increasingly popular in the past decade. Three synthetic

cathinones, Mephedrone, Methylone, and MDPV have been placed into Schedule I of the

Controlled Substances Act. The Analog Act was created to allow substances to be scheduled if

they were similar to an already scheduled compound. Synthetic cathinones have the potential

for positional isomers, which produce ambiguous mass spectra. Derivatization has been

proven useful for determining differences in the mass spectra of similar compounds. The

effect of three perfluoroacyl derivatizing agents on synthetic cathinone standards was tested

along with the ability to differentiate positional isomers within a mixture. Compounds

containing a primary or secondary nitrogen readily derivatized; the compounds containing a

tertiary nitrogen, however, were not able to be derivatized. When placed into mixtures, the

positional isomers were distinguished nearly every time. Future studies include the

determination of a method to derivatize synthetic cathinones containing a tertiary nitrogen.

Introduction

Synthetic cathinones, more commonly referred to as bath salts, are becoming

increasingly abused in the United States. As a result, forensic drug laboratories are receiving

an increasing number of samples believed to contain these compounds. Bath salts are gaining

popularity due to their psychoactive and stimulant properties, which are similar to those of

amphetamine and cocaine. Because these are synthetic compounds, their molecular structure

can be slightly altered to circumvent scheduling under the United States Drug Enforcement

3

Administration’s (DEA’s) Controlled Substances Act. In most states, and federally, a drug is

scheduled based on its exact structure; therefore, an alteration of a single position in the

molecule could yield a new, legal drug that would theoretically have the same effects as the

original scheduled drug. However, the Federal Analog Act of 1986 states that any compound

that is “substantially similar” to a Schedule I or II controlled substance, has similar

pharmacological effects, and is intended for human consumption is to be treated as if it were

also scheduled (1). Most of the packaging for bath salts contains the disclaimer “not for

human consumption” in an effort to avoid the Federal Analog Act. Most states require that

only two conditions of the Analog Act are met to identify the substance as an analog. In

October 2011, the DEA placed an emergency ban on Methylone and the Synthetic Drug Abuse

Prevention Act of 2012 (S.3187 Subtitle D) of the Food, Drug, and Cosmetic Act added two

new methcathinones to Schedule I, 4-Methylmethcathinone (mephedrone) and 3,4-

Methylenedioxypyrovalerone (MDPV) (2).

Due to the minor structural variations and legal ramifications associated with synthetic

cathinones, identification of the exact structure is imperative. Not only must the presence of a

cathinone be documented, but the exact compound must be identified to know if it is

scheduled, which often means differentiating between positional isomers. Gas

chromatography-mass spectrometry (GC-MS) is the primary method used in a forensic

laboratory to confirm the identity of a drug. Generally, cathinones differ due to varying

functional groups on the benzene ring. When the underivatized compound is fragmented in

the electron source of the MS, the benzene ring is neutralized, and therefore not recognized by

the detector, yielding mass spectra with the same ions in the same relative ratios.

Perfluoro acyl anhydrides have been used in the past to differentiate cathinones and

similar compounds, like the amphetamines, by GC-MS (3,4). The addition of an acyl group to

an amine lowers the basicity of the compound, favoring alternative fragmentation pathways to

produce more diagnostic mass spectra (5). Further, perfluoro acyl anhydrides help to

4

withdraw electron groups from the benzene ring, making it less stable and a better candidate

for ionization. Trifluoroacetic anhydride (TFAA), heptafluorobutyric anhydride (HFBA), and

pentafluoropropionic anhydride (PFPA) are common perfluoroacyl derivatizing agents and

were used in this research to derivatize 23 synthetic cathinones. The perfluoro acyl

anhydrides bond with nitrogen atoms contained in each of the synthetic cathinones. Some

contain a pyrrolidine ring which makes the nitrogen tertiary, lacking the hydrogen necessary

for the reaction with the perfluoroacyl anhydride (6). Pyridine was used in an attempt to open

the ring allowing the anhydride to bond with the nitrogen. The effects of the derivatizing

agents on each compound and several mixtures of multiple cathinones were compared to

determine which agent performed the best for each compound and the best overall by

examining the GC retention times, the amount of breakdown products present, and the mass

spectra. If the derivatizing agents are able to bond to the nitrogen of the synthetic cathinones,

then the mass spectra of the cathinones will be differentiated.

Materials and Methods

Reagents, Standards, Equipment, and Instrumentation

Methanol was purchased from Fisher Scientific (Pittsburgh, PA). Ethyl Acetate and

Pyridine were purchased from Sigma-Aldrich (St Louis, MO). TFAA, HFBA, and PFPA were

purchased from Fluka Analytical, which is now owned by Sigma-Aldrich. Hydrochloride

standards of Butylone, Methedrone, 2-Fluoromethcathinone, 3-Fluoromethcathinone, 4-

Fluoromethcathinone, Pentedrone, 2-Methylmethcathinone, 3-Methylmethcathinone, 3,4-

Dimethylmethcathinone, 2,3-Methylenedioxymethcathinone, 2-Methoxymethcathinone, 3-

Methoxymethcathinone, α-Pyrrolidinopropiophenone, 2-Methylpyrrolidinopropiophenone, 3-

Methylpyrrolidinopropiophenone, 4-Methylpyrrolidinopropiophenone, 4-

Methoxypyrrolidinopropiophenone, and 3,4-Methylenedioxypyrrolidinopropiophenone,

Methylone, Cathinone, Mephedrone, Pyrovalerone, and Methylenedioxypyrovalerone were

5

purchased from Cayman Chemical (Ann Arbor, MI). The gas chromatograph/mass

spectrometer with quadrupole ion trap was purchased from Agilent Technologies (Santa Clara,

CA). The column is a Zebron ZB-DRUG-1 column from Phenomenex (Torrance, CA).

Sample Preparation

Each synthetic cathinone standard was analyzed by GC-MS in four different ways: as a

standard in methanol, derivatized with TFAA, with HFBA, and with PFPA. The structures for

each standard and derivatizing agent are shown in Figs. 1 and 2, respectively. Mixtures were

also prepared and analyzed by GC-MS. The standard solutions for analysis were all prepared

as follows. Using a Pasteur pipette, approximately 1.0 mg (ranging from 0.4 mg to 2.2 mg)

was taken from the Cayman Chemical vial and added to a 350 µL vial insert inside of a labeled

GC vial. Methanol was then flushed down the pipette to ensure the entire standard was inside

the insert, which was then filled with methanol and the vial capped.

Fig. 1: Structures of the Synthetic Cathinones.

6

Fig. 2: Structures of TFAA, HFBA, PFPA, and Pyridine.

Derivatizations were performed with the same method for all three derivatizing agents.

Work was performed under a hood because the reagents have a strong smell and can be

harmful if inhaled. The derivatization procedure was adapted from that used by Abdel-Hay et

al (5) and Lum (7). A Pasteur pipette was used to sample approximately 1.0 mg of standard.

The pipette was placed in a labeled GC vial and 25 µL of ethyl acetate was used to flush the

sample into the vial and serve as the solvent. TFAA, HFBA, or PFPA at a volume of 100 µL was

also added to the vial. The vial was capped and allowed to react for 15 minutes at room

temperature. During this time, the vial was placed on top of the GC to add a small amount of

heat to aid the derivatization process. The sample was then transferred to a larger, labeled vial

under the hood for evaporation. The sample vial was placed on a hot plate on low to facilitate

the evaporation process. The resulting residue was reconstituted with 300 µL of ethyl acetate

and the resulting solution transferred into an insert in a labeled GC vial and capped.

Eight of the twenty-three standards were tertiary amines containing a pyrrolidine ring.

Derivatization of tertiary amines is not possible using perfluoroacyl anhydrides. Two methods

were attempted to derivatize these compounds. Pyridine was used in this process to possibly

enolize the carbonyl and create a point of attachment for the perfluoroacyl anhydrides. In the

first method, approximately 1.0 mg of cathinone standard was added to a GC vial using a

7

Pasteur pipette and 25 µL of ethyl acetate as described previously. Pyridine (300 µL) was then

added to the mixture in the GC vial, followed by 100 µL of TFAA. The solution turned a dark

orange and smoked due to the addition of the acid. The vial was capped and incubated at

room temperature for 15 minutes. The liquid was then transferred to a larger, open vial and

evaporated under the hood. After a small amount of solvent evaporated, an orange gel had

formed. Two solvent washes of 300 µL each of ethyl acetate were unsuccessfully used to

eliminate the gel. This sample was not analyzed on the GC-MS. The second method tested was

a slight variation on the first method. After the addition of 300 µL of pyridine, the vial was

capped and incubated at room temperature for 15 minutes and then transferred to a larger vial

for evaporation. The residue was reconstituted with 50 µL of ethyl acetate and the resulting

solution was transferred to a new GC vial. TFAA or HFBA (derivatization with PFPA was not

attempted) were added to the vial at a volume of 100 µL. The vial was capped and incubated

at room temperature for 15 minutes. The reaction mixture was transferred to a larger vial for

evaporation to dryness. The remaining residue was reconstituted with 300 µL ethyl acetate

and the resulting solution transferred to a vial insert in a labeled GC vial and capped.

Mixture samples containing positional isomers were prepared by combining standards

previously analyzed to a final volume of 300 µL depending on the number of possible

positional isomers. Four mixture groupings were prepared: 2-, 3-, and 4-

Fluoromethcathinone; 2- and 3-Methoxymethcathinone and Methedrone; 2- and 3-

Methylmethcathinone and Mephedrone; and 2,3-Methylenedioxymethcathinone and

Methylone. Compounds that contain a methylenedioxy substitution have only two positional

isomers. Each mixture was prepared in quadruple to be analyzed as a standard mixture and

TFAA, HFBA, and PFPA derivative mixtures.

Sample Analysis

All samples were analyzed on an Agilent Technologies 6890N Network GC System

coupled to a 5973Network Mass Selective Detector equipped with a 7683 Series Injector

8

autosampler. Separation was achieved using a ZB-DRUG-1 capillary column

(10m×0.18mm×0.18µm). The method parameters are a combination of those used at KSP

and parameters in a study by Davies, Ramsey, and Archer (2009).

Table 1: GC-MS Parameters Carrier Gas Helium Flow Rate 0.6 mL/min Split Ratio 20:1; 35:1; 50:1*

Injector Temperature 250 °C Transfer Line Temperature 290 °C

Solvent Delay 0.42 min Ionization Voltage 0 eV

Mass Range 40 – 550 m/z *The split ratio was chosen according to the concentration of each sample.

Table 2: Oven Temperature Program Rate Starting Temperature Final Temperature Hold Time Final Time

- 140 ºC 140 °C 6.1 min 6.1 min 20 °C/min 140 ºC 200 °C 0.0 min 9.1 min 40 °C/min 200 ºC 300 °C 14.1 min 25.7 min

Results & Discussion

Fluoromethcathinones

The total ion chromatograms (TICs) of 2-Fluoromethcathinone (2-FMC), 3-

Fluoromethcathinone (3-FMC), 4-Fluoromethcathinone (4-FMC), and the

Fluoromethcathinone mixture (Fluoro Standard Mix) are shown in Fig. 3. All mass spectral

results were library searched using the three libraries available at KSP: SWGDRUG, Cayman

Chemical, and Cerilliant. The TIC for 2-FMC contains five labeled peaks (Fig. 3A). 2-FMC is

known to decompose during GC-MS analysis (8). The peaks at 0.940 and 1.041 minutes are

precursors of 2-FMC (the mass spectra of which can be seen in Appendix A Figs. A1 and A2,

respectively) that were matched with data in the SWGDRUG Monograph (8). The peak at

1.422 minutes is 2-FMC, while the peak at 1.590 minutes is the 2-FMC enamine (mass

spectrum in Fig. A3). An enamine occurs when there is ring closure between the benzene ring

substitution and the methyl group on the side chain, resulting in the loss of two hydrogens.

9

The base peak for the enamine is two m/z units lower than the base peak of the synthetic

cathinone. Using the base peak value allows for identification of the enamine. Lastly, the peak

at 3.94 minutes is the result of ring closure after the loss of HF, the mass spectrum of which

can be found in Fig. A4, also consistent with SWGDRUG results. The TIC for 3-FMC also has

five peaks (Fig. 3B). An expanded view of the chromatogram for 3-FMC can be seen in Fig.

A5. The peaks at 0.825 and 1.177 minutes are precursors of 3-FMC (the mass spectra of

which can be seen in Figs. A6 and A7, respectively). The mass spectra of these are consistent

with the mass spectra of the 2-FMC precursors. The mass spectrum of the peak at 1.577

minutes is breakdown of 3-FMC (mass spectrum in Fig. A8). The peak at 1.518 minutes is 3-

FMC and the peak at 1.636 minutes is the 3-FMC enamine (Fig. A9). The chromatogram for

4-FMC has only one peak, which is the actual 4-FMC (Fig. 3C). Fig. 3D shows the

chromatogram of the mixture of the three Fluoromethcathinone standards. Appendix A shows

an expanded view of the chromatogram (Fig. A10). There are several peaks in this mass

spectrum. The peaks at 1.000, 1.791, 3.471 minutes, and all the peaks afterward are all

column bleed and due to low sample concentration you can see this column bleed. The peaks

at 0.830, 0.935, 1.039, and 1.178 minutes are all breakdown or rearrangements that were

seen when the standards were run on their own. 2-FMC elutes at 1.423 minutes, 3-FMC

elutes at 1.499 minutes, and 4-FMC elutes at 1.572 minutes (mass spectra in Figs. A11-A13,

respectively). The similarity between the mass spectra of the Fluoromethcathinone standards

can be observed in Fig. 4. Table 3 summarizes the data for the Fluoromethcathinone isomers

including the base peak for each mass spectrum and the ion ratios of the base peak abundance

to the abundance of the major ions. 2-FMC shows the most difference with the change in ratio

of the 75, 95, and 123 m/z ions compared that of the 3-FMC and 4-FMC mass spectra. 3-

FMC and 4-FMC show little difference. Comparing between these mass spectra, it would be

difficult to match an unknown compound present in a forensic sample to a known standard.

10

Fig. 3: Total Ion Chromatograms of Fluoromethcathinone Standards. A: 2-FMC; B: 3-FMC; C: 4-FMC; D: Fluoro Standard Mix.

Fig. 4: Mass spectra of Fluoromethcathinone Standards. A: 2-FMC; B: 3-FMC; C: 4-FMC.

A B

C D

A

C

B

11

Table 3: Fluoromethcathinone Data Compound Retention

Time Base Peak

(Abundance) Major Ions in m/z (Base Peak

Abundance/Ion Abundance Ratio) 2-FMC 1.42 min 58 m/z

(305856) 42(20), 69(63), 75(12), 95(10), 123(11), 161(55), 181(495)

3-FMC 1.51 min 58 m/z (1217932)

42(23), 69(60), 75(11), 95(6.7), 123(15), 166(71), 181(1030)

4-FMC 1.56 min 58 m/z (227685)

42(23), 69(63), 75(11), 95(6.7), 123(11), 166(101), 181(135)

2-FMC-TFAA 2.75 min 154 m/z (950464)

42(9.1), 56(23), 69(264), 95(8.1), 110(3.8), 123(2.4), 155(17), 164(51), 277(381)

3-FMC-TFAA 2.31 min 154 m/z (1491968)

42(10), 56(26), 69(13), 95(6.4), 110(3.8), 123(4.3), 155(17), 164(55), 277(73)

4-FMC-TFAA 2.27 min 154 m/z (169095)

42(8.9), 56(23), 69(11), 95(4.3), 110(3.7), 123(1.3), 155(16), 164(44), 277(41)

2-FMC-HFBA 2.49 min 254 m/z (1324032)

42(13), 56(24), 69(20), 95(12), 109(110), 123(4.1), 169(16), 210(3.9), 255(12), 377(2085)

3-FMC-HFBA 2.19 min 254 m/z (2651648)

42(15), 56(27), 69(21), 95(6.0), 109(83), 123(4.2), 169(9.7), 210(2.2), 255(7.8), 377(136)

4-FMC-HFBA 2.09 min 254 m/z (591360)

42(12), 56(23), 69(17), 95(6.9), 109(86), 123(2.2), 169(16), 210(4.0), 255(12), 377(154)

2-FMC-PFPA 2.39 min 204 m/z (1313792)

42(11), 56(23), 69(41), 75(20), 95(10), 109(135), 123(3.4), 160(3.6), 205(15), 327(838)

3-FMC-PFPA 2.07 min 204 m/z (899732)

42(11), 56(24), 69(40), 75(20), 95(7.7), 109(158), 123(5.4), 160(3.5), 205(14), 327(139)

4-FMC-PFPA 2.00 min 204 m/z (1170944)

42(11), 56(25), 69(38), 75(17), 95(5.8), 109(127), 123(1.8), 160(3.7), 205(15), 327(81)

Fig. 5 displays the TICs for the TFAA derivatives of the Fluoromethcathinones, each of

which contains one peak that is the derivative itself. The retention times for each TFAA

derivatized Fluoromethcathinone along with the major ions and their ratios are given in Table

3. The TIC in Fig. 5D displays the TFAA derivative mixture (Fluoro TFAA Mix) of the

Fluoromethcathinones. 3-FMC-TFAA and 4-FMC-TFAA co-eluted at 2.316 minutes as

demonstrated by the mass spectrum in Fig. A14. The co-elution is due to the similarity of the

retention times between the two compounds. The mass spectrum for 2-FMC-TFAA, which

12

elutes at 2.750 minutes in the mixture, is in Fig. A15. The mass spectra of the TFAA derivatives

of the Fluoromethcathinones are shown in Fig. 6. The major ions present in all three mass

spectra were the same, but in different relative abundances, which allowed for differentiation.

Fig. 5: Total Ion Chromatograms of TFAA Derivatives of the Fluoromethcathinones. A: 2-FMC-TFAA; B: 3-FMC-TFAA; C: 4-FMC-TFAA; D: Fluoro TFAA Mix.

Fig. 6: Mass spectra of TFAA Derivatives of the Fluoromethcathinones. A: 2-FMC-TFAA; B: 3-FMC-TFAA; C: 4-FMC-TFAA.

A B

B

D

C

C

A

13

The TICs for the HFBA derivatives of the Fluoromethcathinones are presented in Fig. 7.

2-FMC-HFBA elutes at 2.498 minutes (Fig. 7A). The chromatogram in Fig. 7B contains three

peaks. The peak at 1.498 minutes is a small amount of underivatized 3-FMC (mass spectrum

in Fig. A16). The peaks at 2.099 and 2.197 are both 3-FMC-HFBA. The concentration of 3-

FMC-HFBA is high in this sample and this can lead to peak fronting. 4-FMC-HFBA elutes at

2.096 minutes (Fig. 7C). The TIC of the Fluoromethcathinone HFBA mixture (Fluoro HFBA

Mix) can be seen in Fig. 7D; an expanded chromatogram can be seen in Fig. A17. A small

amount of underivatized 3-FMC can be seen at 1.498 minutes in the mixture. 4-FMC-HFBA

elutes at 2.095 minutes, 3-FMC-HFBA elutes at 2.177 minutes, and 2-FMC-HFBA elutes at

2.484 minutes (mass spectra in Figs. A18-A20, respectively). As with the TFAA derivatives,

mass spectra of the HFBA derivatives (Fig. 8) all have the same major ions, but in different

relative ratios; making them easier to distinguish from one another in comparison to the

underivatized mass spectra. The ions and their ion ratios compared to the base peak are given

in Table 3.

Fig. 7: Total Ion Chromatograms of HFBA Derivatives of the Fluoromethcathinones. A: 2-FMC-HFBA; B: 3-FMC-HFBA; C: 4-FMC-HFBA; D: Fluoro HFBA Mix.

A B

C D

14

Fig. 8: Mass spectra of HFBA Derivatives of the Fluoromethcathinones. A: 2-FMC-HFBA; B: 3-FMC-HFBA; C: 4-FMC-HFBA.

Fig. 9 shows the total ion chromatograms for the PFPA derivatives of the

Fluoromethcathinones. 2-FMC-PFPA (Fig. 9A) has two peaks. The peak at 2.393 minutes is 2-

FMC-PFPA and the peak at 11.179 minutes is either air or vial cap bleed due to the low

molecular ion and simple mass spectrum. 3-FMC-PFPA (Fig. 9B) contains two peaks. The peak

at 1.496 minutes is a small amount of underivatized 3-FMC (mass spectrum in Fig. A21) and

the peak at 2.073 is 3-FMC-PFPA. 4-FMC-PFPA (Fig. 9C) includes one peak at 2.004 minutes,

the PFPA derivative of 4-FMC. Fig. 9D shows the TIC of the mixture of the PFPA derivatives

(Fluoro PFPA Mix). An expanded chromatogram can be seen in Fig. A22. 4-FMC-PFPA elutes

at 1.997 minutes, 3-FMC-PFPA elutes at 2.054 minutes, and 2-FMC-PFPA elutes at 2.376

minutes (mass spectra in Figs. A23-A25, respectively). The mass spectra for the PFPA

derivatives are found in Fig. 10. The three mass spectra contain the same major ions, but, like

the TFAA and HFBA derivatives, the ions are in different relative ratios. This difference in

ratios allows the isomers to be easily differentiated and identified. The major ions and their ion

ratios compared to the base peak can be found in Table 3

B

C

A

15

Fig. 9: Total Ion Chromatograms of PFPA Derivatives of the Fluoromethcathinones. A: 2-FMC-PFPA; B: 3-FMC-PFPA; C: 4-FMC-PFPA; D: Fluoro PFPA Mix.

Fig. 10: Mass spectra of PFPA Derivatives of the Fluoromethcathinones. A: 2-FMC-PFPA; B: 3-FMC-PFPA; C: 4-FMC-PFPA.

While the Fluoromethcathinones can be easily distinguished on their own by retention

time, the same is not true of their mass spectra. 2-FMC is differentiable from 3-FMC and 4-

A B

C D

A B

C

16

FMC. However, the mass spectra of 3- and 4-FMC are nearly identical with only a small

amount of difference in the low abundance ions. Derivatization using TFAA was successful in

differentiating the mass spectral results, but 3-FMC and 4-FMC co-eluted with TFAA

derivatization. Both TFAA and HFBA were able to eliminate all breakdown compounds. HFBA

was successful in achieving both chromatographic separation of the isomers and in

differentiating the mass spectra so that all three isomers can be identified. PFPA also succeeded

in chromatographically separating the isomer and differentiating the mass spectra making

identification possible. On the other hand, PFPA was not able to eliminate all breakdown

products. Because HFBA was successful in all three categories, it is considered the best choice

for derivatizing the Fluoromethcathinones.

Methoxymethcathinones

The TICs for 2-Methoxymethcathinone (2-MOMC), 3-Methoxymethcathinone (3-

MOMC), Methedrone (4-MOMC), and the Methoxymethcathinone mixture (Methoxy

Standard Mix) are shown in Fig. 11. The TIC for 2-MOMC (Fig. 11A) includes four peaks. 2-

MOMC decomposes in the GC-MS like 2-FMC. The peak at 2.904 minutes is breakdown

(mass spectrum in Appendix B Fig. B1). 2-MOMC elutes at 4.454 minutes. The peaks at

4.622 and 4.643 minutes have nearly identical mass spectra, both of which correspond with

the 2-MOMC enamine (Figs. B2 and B3, respectively). The 3-MOMC chromatogram (Fig.

11B) shows only one peak, at 5.125 minutes, that of 3-MOMC. Similarly, the Methedrone TIC

(Fig. 11C) also only shows Methedrone eluting at 6.866 minutes. Fig. 11D presents the TIC for

the Methoxy standard mixture, and an expanded view of this chromatogram can be seen in

Fig. B4. Figs. B5-B7 show the mass spectra for this mixture; 2-MOMC elutes at 4.415 minutes,

3-MOMC elutes at 5.104 minutes, and Methedrone elutes at 6.841 minutes. The peaks at

2.358, 2.580, and 2.897 minutes are all breakdown and rearrangement compounds observed

when the standards were run. The mass spectra for the Methoxymethcathinone standards are

in Fig. 12. Table 4 gives the major ions found in each mass spectrum along with the ion ratios.

17

The mass spectra for the positional isomers of the MOMC compounds are more easily

differentiated than the three Fluoromethcathinone positional isomers, but are still substantially

similar enough that it would be difficult to differentiate between them by GC-MS alone.

Fig. 11: Total Ion Chromatograms of the Methoxymethcathinone Standards. A: 2-MOMC; B: 3-MOMC; C: Methedrone; D: Methoxy Standard Mix.

Fig. 12: Mass spectra of the Methoxymethcathinone Standards. A: 2-MOMC; B: 3-MOMC; C: Methedrone.

A B

C D

A B

C

18

Table 4: Methoxymethcathinone Data Compound Retention

Time Base Peak

(Abundance) Major Ions in m/z (Base Peak

Abundance/Ion Abundance Ratio) 2-MOMC 4.54 min 58 m/z

(312725) 42(38), 77(10), 92(21), 105(125), 121(92), 135(14), 193(164)

3-MOMC 5.12 min 58 m/z (133386)

42(36), 77(15), 92(16), 107(30), 135(23), 193(745)

Methedrone 6.86 min 58 m/z (325985)

42(40), 77(15), 92(16), 107(48), 135(11), 193319()

2-MOMC-TFAA 6.66 min 135 m/z (610816)

42(32), 56(57), 77(9.7), 92(91), 110(20), 136(11), 154(13), 289(270)

3-MOMC-TFAA 6.76 min 135 m/z (474112)

42(16), 56(36), 77(10), 92(12), 107(6.7), 110(7.9), 136(11), 154(2.4), 289(21)

Methedrone-TFAA 7.99 min 135 m/z (1077248)

42(15), 56(72), 77(13), 92(16), 107(21), 110(22), 136(11), 154(14), 289(95)

2-MOMC-HFBA 5.94 min 135 m/z (755968)

42(31), 56(44), 66(1578), 77(10), 92(22), 105(104), 120(90), 136(11), 169(34), 210(15), 254(8.3), 389(1035)

3-MOMC-HFBA 6.39 min 135 m/z (719616)

42(15), 56(24), 66(658), 77(10), 92(13), 107(7.6), 119(97), 136(11), 169(16), 210(4.6), 254(1.4), 389(25)

Methedrone-HFBA 7.59min 135 m/z (1620992)

42(33), 56(55), 66(808), 77(14), 92(18), 107(24), 119(179), 136(11), 169(36), 210(16), 254(8.5), 389(230)

2-MOMC-PFPA 5.79 min 135 m/z (1085952)

42(29), 56(47), 64(77), 77(9.9), 92(20), 105(103), 119(24), 136(11), 160(15), 176(59), 204(10), 339(692)

3-MOMC-PFPA 6.10 min 135 m/z (631872)

42(14), 56(28), 64(27), 77(10), 92(12), 107(7.3), 119(13), 136(11), 160(5.1), 176(35), 204(1.7), 339(24)

Methedrone-PFPA 7.54 min 135 m/z (2530304)

42(31), 56(58), 64(44), 77(13), 92(16), 107(21), 119(25), 136(10), 160(16), 176(53), 204(9.7), 339(156)

The TICs for the TFAA derivatives of the Methoxymethcathinones are displayed in Fig.

13. The retention times for the TFAA derivatives of the Methoxymethcathinones can be found

in Table 4. Fig. 13D gives the TIC for the Methoxy TFAA mixture (Methoxy TFAA Mix). An

expanded view of this chromatogram is shown in Fig. B8. 2-MOMC-TFAA elutes at 6.652

minutes, 3-MOMC-TFAA elutes at 6.754 minutes, and Methedrone-TFAA elutes at 7.991

minutes (mass spectra in Figs. B9-B11, respectively). Fig. 14 presents the mass spectra of the

TFAA derivatives of the Methoxymethcathinones. The major ions of the derivatives and their

ion ratios can be seen in Table 4.

19

Fig. 13: Total Ion Chromatograms of TFAA Derivatives of the Methoxymethcathinones. A: 2-MOMC-TFAA; B: 3-MOMC-TFAA; C: Methedrone-TFAA; D: Methoxy TFAA Mix.

Fig. 14: Mass spectra of TFAA Derivatives of the Methoxymethcathinones. A: 2-MOMC-TFAA; B: 3-MOMC-TFAA; C: Methedrone-TFAA.

Fig. 15 presents the TICs for the HFBA derivatives of the Methoxymethcathinones. The

retention times of the HFBA derivatives are found in Table 4. The mixture of these derivatives

is displayed in Fig. 15D (Methoxy HFBA Mix). 2-MOMC-HFBA elutes at 5.897 minutes, 3-

A B

C D

A B

C

20

MOMC-HFBA elutes at 6.350 minutes, and Methedrone-HFBA elutes at 7.579 minutes (mass

spectra in Figs. B12-B14, respectively). The mass spectra for the HFBA derivatives are given in

Fig. 16. The major ions of the Methoxymethcathinone HFBA derivatives and their ion ratios

are given in Table 4.

Fig. 15: Total Ion Chromatograms of HFBA Derivatives of the Methoxymethcathinones. A: 2-MOMC-HFBA; B: 3-MOMC-HFBA; C: Methedrone-HFBA; D: Methoxy HFBA Mix.

A B

C D

21

Fig. 16: Mass spectra of HFBA Derivatives of the Methoxymethcathinones. A: 2-MOMC-HFBA; B: 3-MOMC-HFBA; C: Methedrone-HFBA.

The TICs for the PFPA derivatives of the Methoxymethcathinones are shown in Fig. 17.

Fig. 17A contains 2 peaks; the peak at 5.795 minutes is 2-MOMC-PFPA, and the peak at

10.624 minutes is the enamine of the derivative (mass spectrum shown in Fig. B15). Fig. 17B

shows one peak at 6.104 minutes which corresponds to 3-MOMC-PFPA. Fig. 17C contains

two peaks. The first peak at 7.542 minutes is Methedrone-PFPA. The second peak at 9.892

minutes is breakdown of the compound in the GC (mass spectrum can in Fig. B16). The

mixture of these derivatives is seen in Fig. 17D (Methoxy PFPA Mix). 2-MOMC-PFPA elutes at

5.727 minutes, 3-MOMC-PFPA elutes at 6.041 minutes, and Methedrone-PFPA elutes at 7.501

minutes (mass spectra in Figs. B17-B19, respectively). Fig. 18 displays the mass spectra of the

PFPA derivatives of the Methoxymethcathinones. Table 4 gives the major ions of these PFPA

derivatives and their ion ratios.

A B

C

22

Fig. 17: Total Ion Chromatograms of PFPA Derivatives of the Methoxymethcathinones. A: 2-MOMC-PFPA; B: 3-MOMC-PFPA; C: Methedrone-PFPA; D: Methoxy PFPA Mix.

Fig. 18: Mass spectra of PFPA Derivatives of the Methoxymethcathinones. A: 2-MOMC-PFPA; B: 3-MOMC-PFPA; C: Methedrone-PFPA.

The Methoxymethcathinones are identifiable by their retention times. The mass

spectrum of 2-MOMC is easily differentiated from 3-MOMC and Methedrone. The mass

spectra of 3-MOMC and Methedrone contain the same ions, with only one difference, in

A B

C D

A B

C

23

almost the same ratios. TFAA was once again successful in differentiating the mass spectra of

the isomers and in preventing breakdown compounds. However, TFAA was not able to

completely resolve 2-MOMC and 3-MOMC in the mixture. HFBA was successful in all three

categories: the compounds are easily separated when in a mixture, all breakdown products

were prevented, and the mass spectra are easily differentiated. PFPA was able to separate the

compounds chromatographically and in creating mass spectra that could be differentiated.

However, PFPA was not successful in preventing all breakdown products. Given that HFBA

was successful in all three areas, it would be the best choice for derivatization of the

Methoxymethcathinones.

Methylmethcathinones

The TICs of 2-Methylmethcathinone (2-MMC), 3-Methylmethcathinone (3-MMC),

Mephedrone (4-MMC), and the Methylmethcathinone mixture (Methyl Standard Mix) are

displayed in Fig. 19. The TIC for 2-MMC (Fig. 19A) contains four peaks. The peaks at 1.228

and 1.380 minutes are either breakdown or rearrangements (their respective mass spectra are

found in Appendix C Figs. C1 and C2). The peaks at 2.073 and 2.353 minutes are 2-MMC;

the high sample concentration leads to some 2-MMC eluting later. Fig. 19B shows the

chromatogram for 3-MMC with one peak at 2.532 identified as 3-MMC. Mephedrone’s

chromatogram is seen in Fig. 19C and has two peaks. The first peak at 2.843 minutes is that of

Mephedrone and the peak at 3.155 minutes is the enamine of Mephedrone (mass spectrum in

Fig. C3). Fig 19D gives the TIC for the Methyl standard mixture. An expanded chromatogram

of this mix can be seen in Fig. C4. Due to the low concentration of the sample, column bleed is

observed at 0.901, 0.999, 1.706, and 11.870 minutes. The peaks at 1.224 and 1.312 minutes

are breakdown that were seen when the standards were run. The peak at 2.070 minutes is 2-

MMC, the peak at 2.518 minutes is 3-MMC, and the peak at 2.812 minutes is Mephedrone

(mass spectra in Figs. C5-C7, respectively). The similarity of the Methylmethcathinone mass

spectra can be observed in Fig. 20. All three mass spectra contain the same major ions in the

24

same relative abundance. Table 5 gives the major ions of the Methylmethcathinones and their

ion ratios compared to their base peaks.

Fig. 19: Total Ion Chromatograms of the Methylmethcathinone Standards. A: 2-MMC; B: 3-MMC; C: Mephedrone; D: Methyl Standard Mix

Fig. 20: Mass spectra of the Methylmethcathinone Standards. A: 2-MMC; B: 3-MMC; C: Mephedrone.

A B

C D

B

C

A

25

Table 5: Methylmethcathinone Data Compound Retention

Time Base Peak

(Abundance) Major Ions in m/z (Base Peak

Abundance/Ion Abundance Ratio) 2-MMC 2.07 min 58 m/z

(236262) 42(33), 65(14), 77(105), 91(9.4), 105(127), 119(21), 177(865)

2-MMC 2.53 min 58 m/z (248056)

42(35), 65(15), 77(138), 91(10), 105(160), 119(24), 177(515)

Mephedrone 2.84 min 58 m/z (1434624)

42(37), 65(15), 77(139), 91(10), 105(142), 119(19), 177(346)

2-MMC-TFAA 3.58 min 119 m/z (233728)

42(21), 56(40), 65(14), 91(3.8), 110(11), 120(11), 154(5.1), 273(237)

3-MMC-TFAA 3.83 min 119 m/z (1119232)

42(18), 56(38), 65(14), 91(4.1), 110(8.6), 120(11), 154(2.9), 273(62)

Mephedrone-TFAA 4.27 min 119 m/z (625280)

42(22), 56(50), 65(16), 91(4.7), 110(12), 120(11), 154(5.1), 273(97)

2-MMC-HFBA 3.24 min 119 m/z (1110016)

42(21), 56(35), 65(16), 77(181), 91(83), 120(11), 169(23), 210(8.4), 254(3.0), 373(421)

3-MMC-HFBA 3.32 min 119 m/z (1284608)

42(17), 56(28), 65(15), 77(197), 91(4.4), 120(11), 169(17), 210(5.4), 254(1.6), 373(118)

Mephedrone-HFBA 3.77 min 119 m/z (1111040)

42(20), 56(35), 65(18), 77(254), 91(5.5), 120(11), 169(22), 210(8.1), 254(2.8), 373(229)

2-MMC-PFPA 3.12 min 119 m/z (1461832)

42(20), 56(40), 65(16), 77(185), 91(4.3), 120(11), 160(7.6), 204(3.9), 323(333)

3-MMC-PFPA 3.15 min 119 m/z (1423360)

42(16), 56(33), 65(16), 77(199), 91(4.5), 120(12), 160(5.7), 204(2.2), 323(91)

Mephedrone-PFPA 3.63 min 119 m/z (1849856)

42(21), 56(40), 65(17), 77(254), 91(5.4), 120(11), 160(7.6), 204(3.6), 323(171)

The TICs of the TFAA derivatives of the Methylmethcathinones are provided in Fig. 21.

The retention times for the TFAA derivatives are seen in Table 5. The TIC for the

Methylmethcathinone TFAA mixture (Methyl TFAA Mix) is provided in Fig. 21D. This mixture

contains only two peaks. The first peak at 3.169 minutes is the co-elution of 2-MMC-TFAA

and 3-MMC-TFAA (mass spectrum in Fig. C8) and the second peak at 4.261 minutes is

Mephedrone-TFAA (mass spectrum in Fig. C9). The mass spectra of the TFAA derivatives of the

Methylmethcathinones are presented in Fig. 22. Table 4 provides the major ions and their ion

ratios.

26

Fig. 21: Total Ion Chromatograms of TFAA Derivatives of the Methylmethcathinones. A: 2-MMC-TFAA; B: 3-MMC-TFAA; C: Mephedrone-TFAA; D: Methyl TFAA Mix.

Fig. 22: Mass spectra of TFAA Derivatives of the Methylmethcathinones. A: 2-MMC-TFAA; B: 3-MMC-TFAA; C: Mephedrone-TFAA.

The TICs of the HFBA derivatives of the Methylmethcathinones are shown in Fig. 23. 2-

MMC-HFBA elutes at 3.247 minutes (Fig. 23A) and is the only compound observed in that

chromatogram. Conversely, Fig. 23B shows two peaks at 2.525 and 3.325 which are a small

D C

B A

C

A B

27

amount of underivatized 3-MMC (mass spectrum in Fig. C10), and 3-MMC-HFBA,

respectively. Mephedrone-HFBA elutes at 3.776 minutes and is the only peak in its

chromatogram (Fig. 23C). Fig. 23D shows the TIC for the HFBA mixture of the Methyls

(Methyl HFBA Mix). Fig. C11 shows an expanded chromatogram of the mixture. 2-MMC-

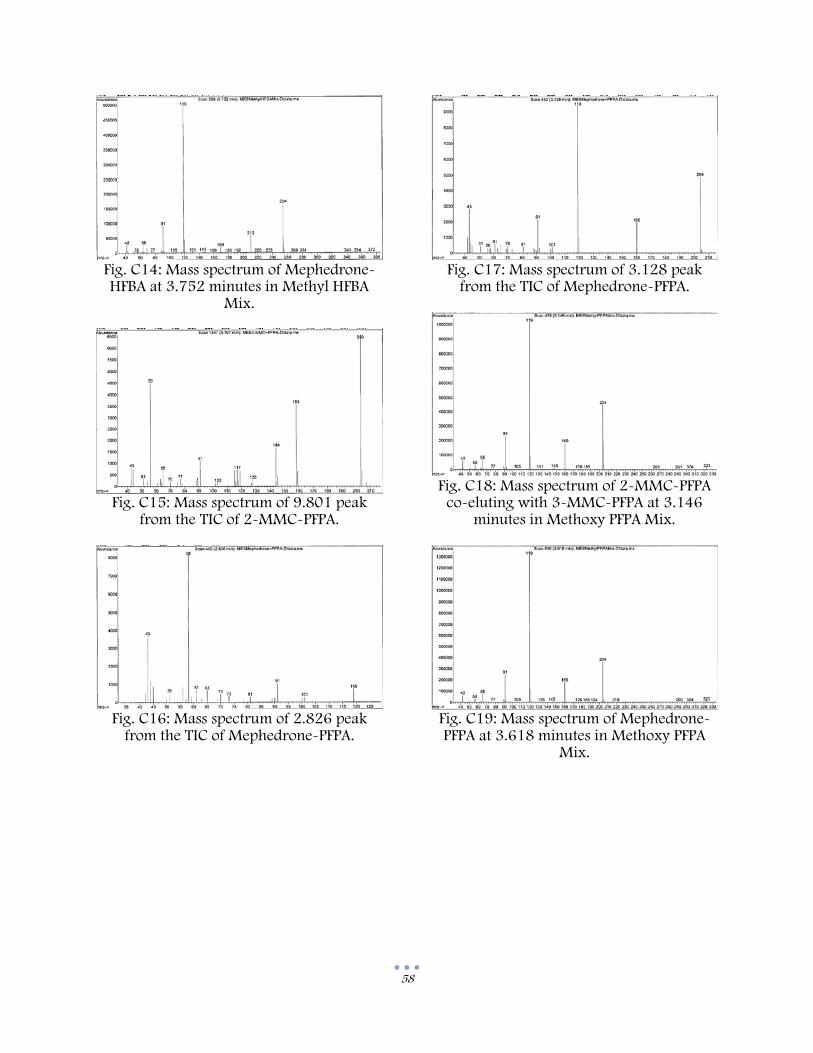
HFBA elutes at 3.239 minutes, 3-MMC-HFBA elutes at 3.313 minutes, and Mephedrone-HFBA

elutes at 3.752 minutes (mass spectra in Figs. C12-C14, respectively). The mass spectra of the

Methyl HFBA derivatives are seen in Fig. 24. The major ions and their ratios are found in Table

5.

Fig. 23: Total Ion Chromatograms of HFBA Derivatives of the Methylmethcathinones. A: 2-MMC-HFBA; B: 3-MMC-HFBA; C: Mephedrone-HFBA; D: Methyl HFBA Mix.

A B

C D

28

Fig. 24: Mass spectra of HFBA Derivatives of the Methylmethcathinones. A: 2-MMC-HFBA; B: 3-MMC-HFBA; C: Mephedrone-HFBA.

Fig. 25 gives the TICs for the PFPA derivatives of the Methylmethcathinones. Fig. 25A

shows the TIC for 2-MMC-PFPA; 2-MMC-PFPA elutes at 3.123 minutes and the peak at 9.801

minutes is column breakdown (mass spectrum in Fig. C15). 3-MMC-PFPA elutes at 3.155

minutes and is the only compound in the corresponding TIC (Fig. 25B). The chromatogram in

Fig. 25C contains three peaks. The first two peaks at 2.826 and 3.128 minutes are breakdown

and their mass spectra can be seen in Figs. C16 and C17. The peak at 3.635 minutes is

Mephedrone-PFPA. The TIC for the PFPA Methyl mixture (Methyl PFPA Mix) is seen in Fig.

25D. This chromatogram has two peaks even though there should be three separate

compounds. The first peak, at 3.146 minutes, is the co-elution of 2-MMC-PFPA and 3-MMC-

PFPA. The second peak at 3.618 minutes is Mephedrone-PFPA. Mass spectra of the PFPA

derivatives are displayed in Fig. 26. The major ions and their rations can be found in Table 5.

C

B A

29

Fig. 25: Total Ion Chromatograms of PFPA Derivatives of the Methylmethcathinones. A: 2-MMC-PFPA; B: 3-MMC-PFPA; C: Mephedrone-PFPA; D: Methyl PFPA Mix.

Fig. 26: Mass spectra of PFPA Derivatives of the Methylmethcathinones. A: 2-MMC-PFPA; B: 3-MMC-PFPA; C: Mephedrone-PFPA.

The Methylmethcathinones are differentiated by their retention times. The major ions

seen are the same for the isomers with some difference seen amongst the low abundance ions.

The use of TFAA was successful in eliminating breakdown product, but chromatographic

A B

C D

A B

C

30

separation of the compounds was not achieved. Further, the mass spectra showed only slight

differences in the relative abundance of the various ions. The use of HFBA was successful in

partially eliminating breakdown products. HFBA derivatives of the isomers separated

chromatographically and showed better mass spectral results. 3-MMC is easily distinguishable

when not derivatized, but 2-MMC and Mephedrone are better distinguished when derivatized

with HFBA. Derivatization with PFPA, like TFAA, did not result in chromatographic separation

of the isomers and, like HFBA, did not eliminate breakdown products. PFPA derivatization

allowed for the easy differentiation of 3-MMC from 2-MMC and Mephedrone. While

underivatized 2-MMC and Mephedrone can be distinguished from one another, it is much

more difficult than with 3-MMC. None of the derivatizing agents were successful in all three

areas, but as HFBA was the only agent to lead to separation of the isomers and would be the

best choice for derivatization of the Methylmethcathinones.

Methylenedioxymethcathinones

The TICs of 2,3-Methylenedioxymethcathinone (2,3-MDMC), Methylone (3,4-

MDMC), and the Methylenedioxy standard mixture (MD Standard Mix) are shown in Fig. 27.

The TIC in Fig. 27A contains three peaks. The first peak at 7.549 minutes is 2,3-MDMC; the

peak at 7.878 minutes is the enamine of 2,3-MDMC and the mass spectrum is located in

Appendix D Fig. D1; the final peak at 17.513 minutes is either air or cap bleed (mass spectrum

not shown). Fig. 27B is the TIC for Methylone showing two peaks. The peak at 8.175 minutes

is Methylone and the peak at 8.472 minutes is the enamine of Methylone, whose mass

spectrum is found in Fig. D2. The TIC of the MD Standard mix is shown in Fig. 27C. Many

peaks are observed in this chromatogram. Due to the low sample concentration in the

mixture, the amount of column and/or vial cap bleed seen is much higher and more

noticeable. Peaks at 0.999, 1.788, 30465, 6.692, 8.348 minutes, and later are column bleed

or cap bleed and are not relevant. An expanded TIC can be viewed in Fig. D3. The peaks at

5.031 and 7.878 are breakdown components of 2,3-MDMC and Methylone. 2,3-MDMC

31

elutes at 7.524 minutes (mass spectrum in Fig. D4) and Methylone elutes at 8.164 minutes

(mass spectrum in Fig. D5). The similarity between the mass spectra of 2,3-MDMC and

Methylone is seen in Fig. 28. The major ions of the Methylenedioxymethcathinones and their

ion ratios are found in Table 6.

Fig. 27: Total Ion Chromatograms of the Methylenedioxymethcathinone Standards. A: 2,3-MDMC; B: Methylone; C: MD Standard Mix

Fig. 28: Mass spectra of the Methylenedioxymethcathinone Standards. A: 2,3-MDMC; B: Methylone.

A B

B A

C

32

Table 6: Methylenedioxymethcathinone Data Compound Retention

Time Base Peak

(Abundance) Major Ions in m/z (Base Peak

Abundance/Ion Abundance Ratio) 2,3-MDMC 7.54 min 58 m/z

(778368) 42(33), 65(13), 91(34), 121(30), 135(108), 149(16), 207(134)

Methylone 8.17 min 58 m/z (623232)

42(43), 64(17), 91(35), 121(17), 135(107), 149(13), 207(262)

2,3-MDMC-TFAA 8.71 min 149 m/z (2281472)

42(17), 56(35), 65(9.8), 91(25), 110(7.6), 121(37), 150(10), 152(2962), 160(65), 178(60), 303(8.1)

Methylone-TFAA 8.97 min 149 m/z (2083840)

42(27), 56(55), 65(17), 91(35), 110(14), 121(9.3), 150(11), 152(729), 160(164), 178(529), 303(16)

2,3-MDMC-HFBA 8.34 min 149 m/z (2391552)

42(16), 56(24), 65(10), 91(24), 121(38), 150(10), 169(15), 210(4.1), 254(1.3), 403(7.9)

Methylone-HFBA 8.68 min 149 m/z (3383808)

42(28), 56(42), 65(177), 91(34), 121(10), 150(11), 169(26), 210(9.5), 254(4.1), 403(20)

2,3-MDMC-PFPA 8.28 min 149 m/z (1756160)

42(15), 56(27), 65(10), 91(26), 119(12), 150(11), 160(4.5), 178(50), 204(1.8), 353(7.6)

Methylone-PFPA 8.63 min 149 m/z (3144192)

42(25), 56(45), 65(17), 91(34), 121(9.8), 150(11), 160(9.4), 178(401), 204(5.2), 353(16)

Fig. 29 shows the TICs of the Methylenedioxy standards derivatized with TFAA. 2,3-

MDMC-TFAA is seen in Fig. 29A at 8.716 minutes. This chromatogram contains another peak

at 10.289 minutes; this is a breakdown or rearrangement product, the mass spectrum of which

can be seen in Fig. D6. Methylone-TFAA elutes at 8.977 minutes and can be seen in Fig. 29B.

The Methylenedioxy mixture of these derivatives (MD TFAA Mix) is seen in Fig. 29C. There

are three peaks within the chromatogram. The peaks at 8.712 and 8.978 minutes are 2,3-

MDMC-TFAA and Methylone-TFAA, respectively. The mass spectra of these can be seen in

Figs. D7 and D8. The peak at 10.286 minutes is the breakdown/rearrangement product of

2,3-MDMC-TFAA. The mass spectra of the TFAA derivatives can be seen in Fig. 30. The major

ions and their ion ratios can be seen in Table 6.

33

Fig. 29: Total Ion Chromatograms of TFAA Derivatives of the Methylenedioxymethcathinones. A: 2,3-MDMC-TFAA; B: Methylone-TFAA; C: MD TFAA Mix.

Fig. 30: Mass spectra of TFAA Derivatives of the Methylenedioxymethcathinones. A: 2.3-MDMC+TFAA; B: Methylone-TFAA.

The TICs of the HFBA derivatives of the Methylenedioxy compounds are shown in Fig.

31. Fig. 31A shows a chromatogram with two peaks. The first is 2,3-MDMC-HFBA at 8.346

minutes and the second, at 10.056 minutes, is a breakdown product (mass spectrum in Fig.

D9). Fig. 31B shows the chromatogram of Methylone-HFBA which elutes at 8.686 minutes

and a breakdown product at 11.559 minutes (mass spectrum in Fig. D10). The TIC for the

mixture of the HFBA derivatives (MD HFBA Mix) is found in Fig. 31C. This chromatogram

contains four peaks. At 8.341 minutes is 2,3-MDMC-HFBA and at 8.674 minutes is

Methylone-HFBA (mass spectra in Fig. D11 and D12, respectively). At 10.057 minutes is the

A B

C

A B

34

breakdown from 2,3-MDMC-HFBA and at 11.332 minutes is the breakdown from Methylone-

HFBA. Fig. 32 displays the mass spectra of the HFBA derivatives of the Methylenedioxy

positional isomers. The major ions of the HFBA derivatives and their ratios can be found in

Table 6.

Fig. 31: Total Ion Chromatograms of HFBA Derivatives of the Methylenedioxymethcathinones. A: 2,3-MDMC-HFBA; B: Methylone-HFBA; C: MD HFBA Mix.

Fig. 32: Mass spectra of HFBA Derivatives of the Methylenedioxymethcathinones. A: 2.3-MDMC+HFBA; B: Methylone-HFBA

Total ion chromatograms of the PFPA derivatives of the methylenedioxy isomers are

shown in Fig. 33. The TIC of 2,3-MDMC-PFPA is found in Fig. 33A. This TIC contains two

peaks: the one at 8.282 minutes is 2,3-MDMC-PFPA and at 10.075 minutes is a breakdown

product (mass spectrum in Fig. D13). Methylone-PFPA elutes at 8.633 minutes and is seen in

A B

C

A B

35

Fig. 33B. The TIC of the mixture of the PFPA derivatives (MD PFPA Mix) is in Fig. 33C. An

expanded view of this chromatogram is in Fig. D14. The peak at 8.277 minutes is 2,3-

MDMC-PFPA (mass spectrum in Fig. D15), the peak at 8.619 minutes is Methylone-PFPA

(mass spectrum in Fig. D16), and the peaks at 10.076 and 11.333 minutes are both

breakdown products of 2,3-MDMC and Methylone. The mass spectra of the PFPA derivatives

are shown in Fig. 34. The major ions of each spectrum and their ion ratios compared to the

base peak of the PFPA derivatives are given in Table 6.

Fig. 33: Total Ion Chromatograms of PFPA Derivatives of the Methylenedioxymethcathinones. A: 2,3-MDMC-PFPA; B: Methylone-PFPA; C: MD PFPA Mix.

Fig. 34: Mass spectra of PFPA Derivatives of the Methylenedioxymethcathinones. A: 2.3-MDMC+PFPA; B: Methylone-PFPA.

A B

C

A B

36

Differentiation of the Methylenedioxymethcathinones is possible based on retention

times. However, with the exception of the abundance of one ion, the mass spectra are nearly

identical. Derivatization with TFAA was allowed for the separation of the compounds within a

mixture, but not prevent breakdown. TFAA derivatization made differentiation of the mass

spectral results possible. HFBA derivatization led to separation of the isomers and provided

differentiation between the mass spectra, but did not prevent breakdown from occurring.

PFPA derivatization allowed for chromatographic separation but did not prevent breakdown of

the Methylenedioxymethcathinones. An advantage to using PFPA for derivatization was that it

led to different relative abundance ratios and an identifying ion for each of the isomers. All

three derivatizing agents led to the successful separation of the isomers and their successful

differentiation, but did not prevent breakdown. Because PFPA was the only derivatizing agent

to lead to a difference between the major ions, it would likely be the best option for the

derivatization of the Methylenedioxymethcathinones; although, HFBA and TFAA would also

lead to the successful differentiation of the MDMCs. Table 7 demonstrates the advantages and

disadvantages of each perfluoroacyl anhydride when used to derivatize the synthetic

cathinones with positional isomers.

Table 7: Advantages and Disadvantages of TFAA, HFBA, and PFPA Group TFAA HFBA PFPA Fluoro-

methcathinones Co-elution in a mixture; prevented breakdown; differentiated MS

Compounds separated in a mixture; prevented breakdown; differentiated MS

Compounds separated in a mixture; some breakdown seen; differentiated MS

Methoxy- methcathinones

Compounds not fully resolved in a mixture; prevented breakdown; differentiated MS

Compounds separated in a mixture; prevented breakdown; differentiated MS

Compounds separated in a mixture; some breakdown seen; differentiated MS

Methyl- Methcathinones

Co-elution in a mixture; prevented breakdown; slight differences in MS

Compounds separated in a mixture; some breakdown seen; 3-MMC MS easily distinguishable, slight

Co-elution in a mixture; some breakdown seen; 3-MMC MS easily distinguishable, slight difference between 2-

37

difference between 2-MMC and Mephedrone MS

MMC and Mephedrone MS

Methylenedioxy- methcathinones

Compounds separated in a mixture; some breakdown seen; differentiated MS

Compounds separated in a mixture; some breakdown seen; differentiated MS

Compounds separated in a mixture; some breakdown seen; differentiated MS with 2,3-MDMC having an ion at 119 m/z and Methylone having an ion @ 121 m/z

Cathinones Containing a Pyrrolidine

The total ion chromatograms of the Pyrrolidinopropiophenone standards are presented

in Fig. 35. Alpha-Pyrrolidinopropiophenone (PPP) elutes at 6.317 minutes (Fig. 35A). The peak

observed at 7.282 minutes is either air or cap bleed (mass spectrum not shown). 2-Methyl-α-

pyrrolidinopropiophenone (2-MPPP) elutes at 7.314 minutes (Fig. 35B). There are also three

other peaks observed in this TIC: the peaks at 0.899 and 1.233 minutes are both breakdown

(mass spectrum in Appendix E Fig. E1 and E2). The peak observed at 8.595 minutes is the

enamine of 2-MPPP (mass spectrum in Fig. E3). 3-Methyl-α-pyrrolidinopropiophenone (3-

MPPP) elutes at 7.880 minutes (Fig. 35C) and its enamine at 9.036 minutes (mass spectrum in

Fig. E4). 4-Methyl-α-pyrrolidinopropiophenone (4-MPPP) elutes at 8.233 minutes (Fig. 35D).

There are two additional peaks in this mass spectrum; the peak at 7.845 minutes is breakdown

(mass spectrum in Fig. E5) and the peak at 9.285 minutes is the enamine of 4-MPPP (mass

spectrum in Fig. E6). 4-Methoxy-α-pyrrolidinopropiophenone (4-MOPPP) elutes at 9.795

minutes (Fig. 35E) and its enamine at 10.332 minutes (mass spectrum in Fig. E7). 3,4-

Methylenedioxy-α-pyrrolidinopropiophenone (3,4-MDPPP) elutes at 10.265 minutes (Fig. 35F)

and its enamine at 10.710 minutes (mass spectrum in Fig. E8). Derivatization of these

compounds was unsuccessful due to the presence of a tertiary nitrogen and subsequently no

38

mixture analysis was performed on these compounds. The mass spectra of the

Pyrrolidinopropiophenones are shown in Fig. 36. They each contain the base peak of 98 m/z.

The mass spectra of 2-MPPP, 3-MPPP, and 4-MPPP are nearly identical, as they are positional

isomers, making differentiation difficult. However, it is possible to distinguish the mass spectra

of the Methyl-PPPs from PPP, 4-MOPPP, and 3,4-MDPPP.

Fig. 35: Total Ion Chromatograms of the Pyrrolidinopropiophenone Standards. A: α-PPP; B: 2-MPPP; C: 3-MPPP; D: 4-MPPP; E: 4-MOPPP; F: 3,4-MDPPP.

A B

C D

F E

39

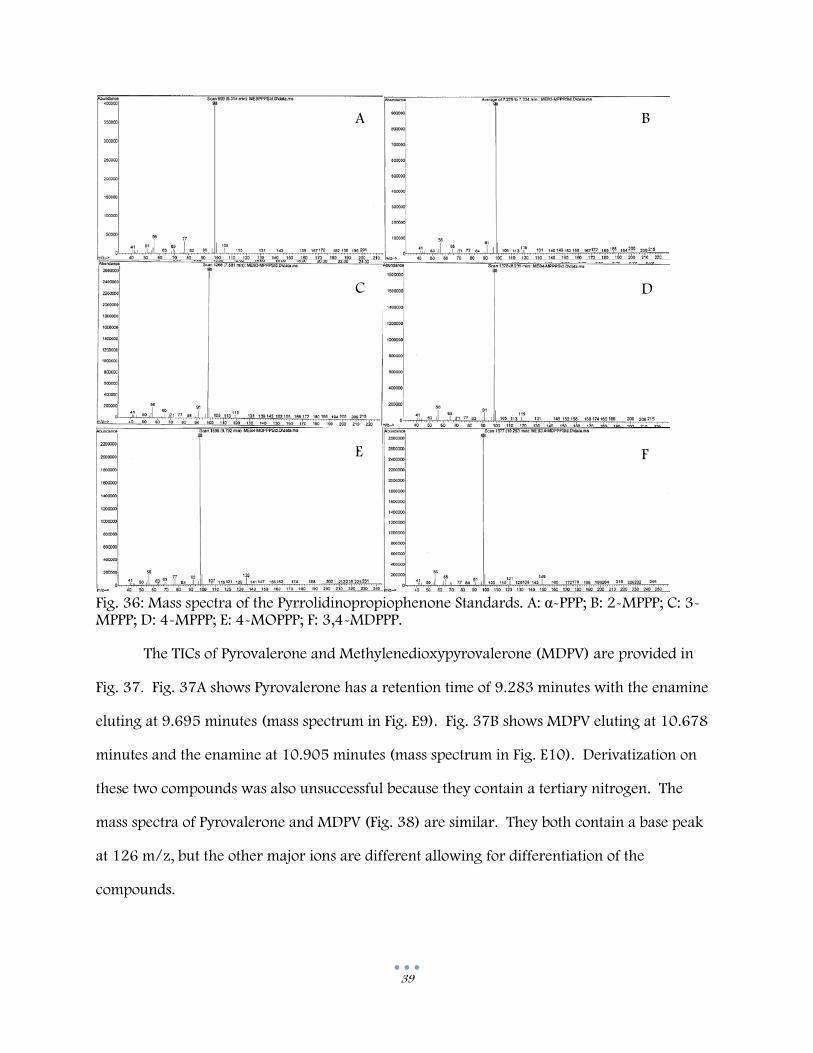
Fig. 36: Mass spectra of the Pyrrolidinopropiophenone Standards. A: α-PPP; B: 2-MPPP; C: 3-MPPP; D: 4-MPPP; E: 4-MOPPP; F: 3,4-MDPPP.

The TICs of Pyrovalerone and Methylenedioxypyrovalerone (MDPV) are provided in

Fig. 37. Fig. 37A shows Pyrovalerone has a retention time of 9.283 minutes with the enamine

eluting at 9.695 minutes (mass spectrum in Fig. E9). Fig. 37B shows MDPV eluting at 10.678

minutes and the enamine at 10.905 minutes (mass spectrum in Fig. E10). Derivatization on

these two compounds was also unsuccessful because they contain a tertiary nitrogen. The

mass spectra of Pyrovalerone and MDPV (Fig. 38) are similar. They both contain a base peak

at 126 m/z, but the other major ions are different allowing for differentiation of the

compounds.

A B

C D

E F

40

Fig. 37: Total Ion Chromatograms of the Pyrovalerone Standards. A: Pyrovalerone; B: MDPV.

Fig. 38: Mass spectra of the Pyrovalerone Standards. A: Pyrovalerone; B: MDPV. Other Cathinones

Cathinone, Pentedrone, Butylone, and 3,4-Dimethylmethcathinone do not have any

positional isomers that were tested in this study; however, the data for these four compounds is

presented in the event that an isomer is developed or becomes abused on the illicit market. The

TICs for Cathinone and its perfluoroacyl anhydrides are shown in Fig. 39. Cathinone has a

retention time of 1.655 minutes (Fig. 39A), Cathinone-TFAA of 2.159 minutes (Fig. 39B),

Cathinone-HFBA of 2.019 minutes (Fig. 39C), and Cathinone-PFPA of 1.897 minutes (Fig.

39D). The mass spectra for the Cathinones can be seen in Fig. 40. Cathinone has a base peak

of 44 m/z, while all the derivatized Cathinone compounds have a base peak of 105 m/z. The

mass spectra are easily distinguished when the other ions are considered.

A B

A B

41

Fig. 39: Total Ion Chromatograms of the Cathinone Standards. A: Cathinone; B: Cathinone-TFAA; C: Cathinone-HFBA; D: Cathinone-PFPA.

Fig. 40: Mass spectra of the Cathinone Standards. A: Cathinone; B: Cathinone-TFAA; C: Cathinone-HFBA; D: PFPA.

The chromatograms for Pentedrone and its derivatives are found in Fig. 41. Pentedrone

elutes at 3.048 minutes (Fig. 41A), Pentedrone-TFAA at 4.306 minutes (Fig. 41B), Pentedrone-

HFBA at 3.783 minutes (Fig. 41C), and Pentedrone-PFPA at 3.596 minutes (Fig. 41D). The

A B

C D

A B

C D

42

mass spectra for the Pentedrones are in shown in Fig. 42. Pentedrone has a base peak at 86

m/z; Pentedrone-TFAA at 182 m/z; Pentedrone-HFBA at 282 m/z; and Pentedrone-PFPA at

232 m/z. These are all easily distinguished from one another having different base peaks and

different ions.

Fig. 41: Total Ion Chromatograms of the Pentedrone Standards. A: Pentedrone; B: Pentedrone-TFAA; C: Pentedrone-HFBA; D: Pentedrone-PFPA.

A B

C D

43

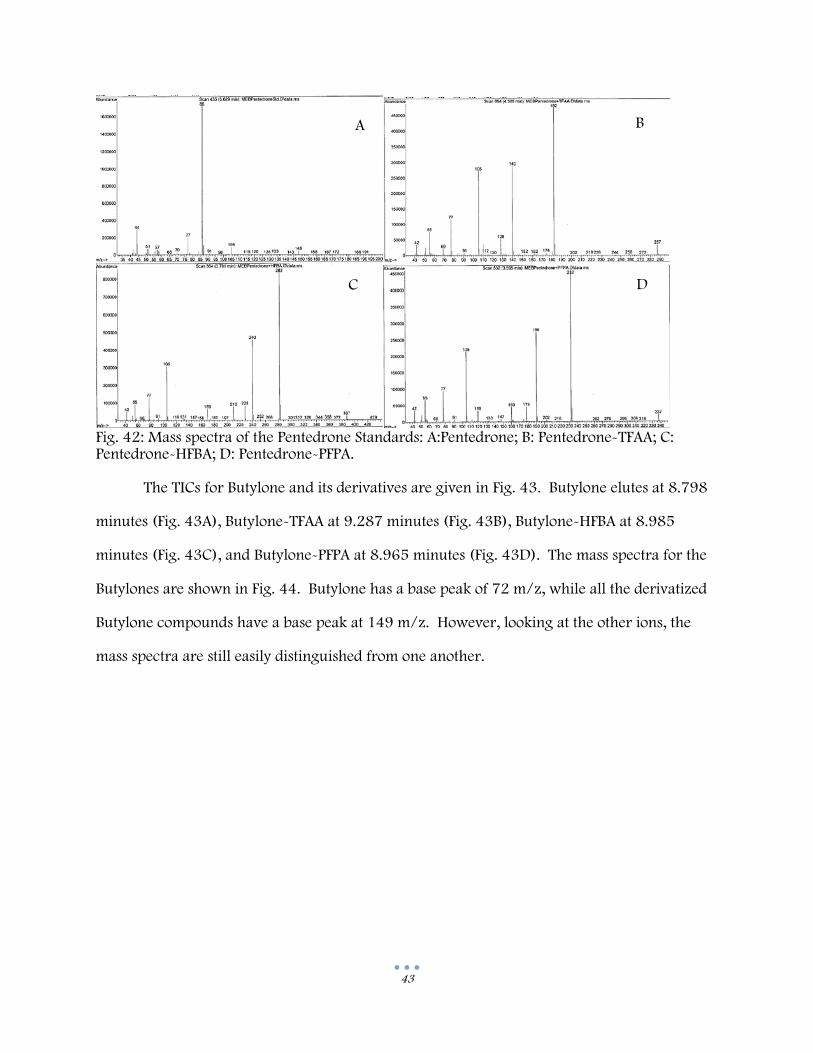
Fig. 42: Mass spectra of the Pentedrone Standards: A:Pentedrone; B: Pentedrone-TFAA; C: Pentedrone-HFBA; D: Pentedrone-PFPA.

The TICs for Butylone and its derivatives are given in Fig. 43. Butylone elutes at 8.798

minutes (Fig. 43A), Butylone-TFAA at 9.287 minutes (Fig. 43B), Butylone-HFBA at 8.985

minutes (Fig. 43C), and Butylone-PFPA at 8.965 minutes (Fig. 43D). The mass spectra for the

Butylones are shown in Fig. 44. Butylone has a base peak of 72 m/z, while all the derivatized

Butylone compounds have a base peak at 149 m/z. However, looking at the other ions, the

mass spectra are still easily distinguished from one another.

A B

C D

44

Fig. 43: Total Ion Chromatograms of the Butylone Standards. A: Butylone; B: Butylone-TFAA; C: Butylone-HFBA; D: Butylone-PFPA.

Fig. 44: Mass spectra of the Butylone Standards: A:Butylone; B: Butylone-TFAA; C: Butylone-HFBA; D: Butylone-PFPA.

The chromatograms for 3,4-Dimethylmethcathinone (3,4-diMMC) and its derivatives

are displayed in Fig. 45. 3,4-diMMC at 5.099 minutes (Fig. 45A), 3,4-diMMC-TFAA at 6.863

minutes (Fig. 45B), 3,4-diMMC-HFBA at 6.309 minutes (Fig. 45C), and 3,4-diMMC-PFPA at

D C

A B

D C

B A

45

6.039 minutes (Fig. 45D). The mass spectra of 3,4-diMMC and its derivatives can be seen in

Fig. 46. 3,4-diMMC has a base peak of 58 m/z, while the derivatives of 3,4-diMMC contain a

base peak of 133 m/z. The other ions in the mass spectra are sufficiently different that

differentiation is possible.

Fig. 45: Total Ion Chromatograms of the 3,4-diMMC Standards. A: 3,4-diMMC; B: 3,4-diMMC-TFAA; C: 3,4-diMMC-HFBA; D: 3,4-diMMC-PFPA.

D C

A B

46

Fig. 46: Mass spectra of the 3,4-diMMC Standards: A: 3,4-diMMC; B: 3,4-diMMC-TFAA; C: 3,4-diMMC-HFBA; D: 3,4-diMMC-PFPA. Conclusions

The mass spectra of the TFAA, HFBA, and PFPA derivatives of 15 synthetic cathinones

were studied and compared to one another and those of the underivatized compounds. The

presence of a tertiary nitrogen prevented the derivatization of eight standards because

perfluoroacyl anhydrides can only derivatize primary and secondary nitrogens. Pyridine was

used in an attempt to enolize the carbonyl and open the pyrrolidine ring for derivatization, but

this method was unsuccessful. HFBA derivatization allowed for the differentiation between the

mass spectra of positional isomers better than TFAA or PFPA, overall. PFPA was more successful

than HFBA or TFAA for the derivatization of the Methylenedioxymethcathinones isomers.

When choosing between the three derivatizing agents studied, HFBA would give the best

overall results as it was successful in differentiating all of the positional isomers. The Future

studies will include the reproduction of the current results, analysis of more complex

cathinone mixtures, and development of a derivatization method for the compounds

containing tertiary nitrogens.

A

C D

B

47

Acknowledgements

Thank you to the Kentucky State Police Eastern Regional Forensic Laboratory for

providing the reagents and some of the cathinone standards, the instrumentation to analyze

the samples, and the time commitment of the analysts in their assistance of the research work.

A thank you also goes to the Marshall University Forensic Science Program for providing the

rest of the cathinone standards.

References

1. Federal Analogue Act 21 U.S.C. § 813. 2. S3187 amendment of the Federal Food, Drug, and Cosmetic Act (21U.S.C. 301)

Enacted July 9, 2012 http://www.gpo.gov/fdsys/pkg/BILLS-112s3187enr/pdf/BILLS-112s3187enr.pdf.

3. Archer RP. Fluoromethcathinone, a new substance. Forensic Science International. 2009; 185: 10-20.

4. LaGrone E, Kiyak C, Rodriguez G, Rankin JG. Trifluoroacetyl Derivatization of Amphetamine, Methamphetamine, MDMA and Other Controlled Substances with Similar Mass spectra. American Academy of Forensic Science: Proceedings. 2011; 17(A3): 23.

5. Clark CR, Abdel-Hay KM, Awad T, DeRuiter J. Differentiation of methylenedioxybenzylpiperazines (MDBPs) and methoxymethylbenzylpiperazines (MMBPs) by GC-IRD and GC-MS. Forensic Science International. 2011; 210: 122-128.

6. Lum BJ, Hibbert DB, Brophy J. Identification of Substituted Cathinones (β-keto phenethylamines) by Heptafluorobutyric Anhydride (HFBA) Chemical Derivatization and Gas Chromatography Mass Spectrometry. SWAFS Journal. 2013; 34: 7-30.

7. Lum B. Distinguishing Isomers of 3-Fluoromethcathinone (3-FMC) from 4- Fluoromethcathinone (4-FMC) using Heptafluorobutyric anhydride (HFBA) chemical derivatization. SWAFS Journal. 2012; 33: 6-17.

8. SWGDRUG. Monographs: 2-Fluoromethcathinone. Retrieved from http://www.swgdrug.org/monographs.htm. 2013.

48

Appendix A: Additional Fluoromethcathinone Data

Fig. A1: Mass spectrum of 0.940 peak from

the TIC of2-FMC.

Fig. A2: Mass spectrum of 1.041 peak from

the TIC of 2-FMC.

Fig. A3: Mass spectrum of 1.590 peak from

the TIC of 2-FMC.

Fig. A4: Mass spectrum of 3.894 peak from

the TIC of 2-FMC.

Fig. A5: Expanded Chromatogram for 3-

FMC.

Fig. A6: Mass spectrum of 0.825 peak from

the TIC of 3-FMC.

49

Fig. A7: Mass spectrum of 1.177 peak from

the TIC of 3-FMC.

Fig. A8: Mass spectrum of 1.577 peak from

the TIC of 3-FMC.

Fig. A9: Mass spectrum of 1.636 peak from

the TIC of 3-FMC.

Fig. A10: Expanded Chromatogram for

Fluoro Standard Mix.

Fig. A11: Mass spectrum of 2-FMC in

Fluoro Standard Mix at 1.423 minutes.

Fig. A12: Mass spectrum of 3-FMC in

Fluoro Standard Mix at 1.499 minutes.

Fig. A13: Mass spectrum of 4-FMC in

Fluoro Standard Mix at 1.572 minutes.

50

Fig. A14: Mass spectrum of 3-FMC-TFAA

and 4-FMC-TFAA co-eluting at 2.316 minutes in FluoroTFAAMix.

Fig. A15: Mass spectrum of 2-FMC-TFAA at

2.750 minutes in FluoroTFAAMix.

Fig. A16: Mass spectrum of 1.498 peak

from the TIC of 3-FMC-HFBA.

Fig. A17: Expanded Chromatogram of

Fluoro HFBA Mix.

Fig. A18: Mass spectrum of 4-FMC-HFBA at

2.095 minutes in FluoroHFBAMix.

Fig. A19: Mass spectrum of 3-FMC-HFBA at

2.177 minutes in FluoroHFBAMix.

Fig. A20: Mass spectrum of 2-FMC-HFBA at

2.484 minutes in FluoroHFBAMix.

51

Fig. A21: Mass spectrum of 1.496 peak

from the TIC of 3-FMC-PFPA.

Fig. A22: Expanded Chromatogram of

Fluoro PFPA Mix.

Fig. A23: Mass spectrum of 4-FMC-PFPA at

1.997 minutes in FluoroPFPAMix.

Fig. A24: Mass spectrum of 3-FMC-PFPA at

2.054 minutes in FluoroPFPAMix.

Fig. A25: Mass spectrum of 2-FMC-PFPA at

2.376 minutes in FluoroPFPAMix.

52

Appendix B: Additional Methoxymethcathinone Data

Fig. B1: Mass spectrum of 2.904 peak from

the TIC of 2-MOMC.

Fig. B2: Mass spectrum of 4.622 peak from

the TIC of 2-MOMC.

Fig. B3: Mass spectrum of 4.643 peak from

the TIC of 2-MOMC.

Fig. B4: Expanded Chromatogram for

Methoxy Std Mix.

Fig. B5: Mass spectrum of 2-MOMC at

4.415 minutes in Methoxy Std Mix.

Fig. B6: Mass spectrum of 3-MOMC at

5.104 minutes in Methoxy Std Mix.

53

Fig. B7: Mass spectrum of Methedrone at

6.841 minutes in Methoxy Std Mix.

Fig. B8: Expanded Chromatogram for

Methoxy TFAA Mix.

Fig. B9: Mass spectrum for 2-MOMC-TFAA

at 6.652 minutes in Methoxy TFAA Mix.

Fig. B10: Mass spectrum for 3-MOMC-

TFAA at 6.754 minutes in Methoxy TFAA Mix.

Fig. B11: Mass spectrum for Methedrone-TFAA at 7.991 minutes in Methoxy TFAA

Mix.

Fig. B12: Mass spectrum of 2-MOMC-

HFBA at 5.897 minutes in Methoxy HFBA Mix.

54

Fig. B13: Mass spectrum of 3-MOMC-

HFBA at 6.350 minutes in Methoxy HFBA Mix.

Fig. B14: Mass spectrum of Methedrone-HFBA at 7.579 minutes in Methoxy HFBA

Mix.

Fig. B15: Mass spectrum of 10.624 peak

from the TIC of 2-MOMC-PFPA.

Fig. B16: Mass spectrum of 9.892 peak

from the TIC of Methedrone-PFPA.

Fig. B17: Mass spectrum for 2-MOMC-PFPA at 5.727 minutes in Methoxy PFPA

Mix.

Fig. B18: Mass spectrum for 3-MOMC-PFPA at 6.041 minutes in Methoxy PFPA

Mix.

55

Fig. B19: Mass spectrum for Methedrone-PFPA at 7.501 minutes in Methoxy PFPA

Mix.

56

Appendix C: Additional Methylmethcathinone Data

Fig. C1: Mass spectrum of 1.228 peak from

the TIC of 2-MMC Std.

Fig. C2: Mass spectrum of 1.380 peak from

the TIC of 2-MMC Std.

Fig. C3: Mass spectrum of 3.155 peak from

the TIC of Mephedrone.

Fig. C4: Expanded Chromatogram of

Methyl Std Mix.

Fig. C5: Mass spectrum of 2-MMC at 2.070

minutes in Methyl Std Mix.

Fig. C6: Mass spectrum of 3-MMC at 2.518

minutes in Methyl Std Mix.

57

Fig. C7: Mass spectrum of Mephedrone at

2.812 minutes in Methyl Std Mix.

Fig. C8: Mass spectrum of 2-MMC-TFAA co-eluting with 3-MMC-TFAA at 3.619

minutes in Methyl TFAA Mix.

Fig. C9: Mass spectrum of Mephedrone-TFAA at 4.261 minutes in Methyl TFAA

Mix.

Fig. C10: Mass spectrum of 2.525 peak

from the TIC of 3-MMC-HFBA.

Fig. C11: Expanded Chromatogram of

Methyl HFBA Mix.

Fig. C12: Mass spectrum of 2-MMC-HFBA

at 3.239 minutes in Methyl HFBA Mix.

Fig. C13: Mass spectrum of 3-MMC-HFBA

at 3.313 minutes in Methyl HFBA Mix.

58

Fig. C14: Mass spectrum of Mephedrone-HFBA at 3.752 minutes in Methyl HFBA

Mix.

Fig. C15: Mass spectrum of 9.801 peak

from the TIC of 2-MMC-PFPA.

Fig. C16: Mass spectrum of 2.826 peak

from the TIC of Mephedrone-PFPA.

Fig. C17: Mass spectrum of 3.128 peak

from the TIC of Mephedrone-PFPA.

Fig. C18: Mass spectrum of 2-MMC-PFPA

co-eluting with 3-MMC-PFPA at 3.146 minutes in Methoxy PFPA Mix.

Fig. C19: Mass spectrum of Mephedrone-PFPA at 3.618 minutes in Methoxy PFPA

Mix.

59

Appendix D: Additional Methylenedioxymethcathinone Data

Fig. D1: Mass spectrum of 7.878 peak from

the TIC of 2,3-MDMC.

Fig. D2: Mass spectrum of 8.472 peak from

the TIC of Methylone.

Fig. D3: Expanded Chromatogram of

Methylenedioxy Std Mix.

Fig. D4: Mass spectrum for 2,3-MDMC at 7.524 minutes in Methylenedioxy Std Mix.

Fig. D5: Mass spectrum for Methylone at

8.164 minutes in Methylenedioxy Std Mix.

Fig. D6: Mass spectrum of 10.289 peak

from the TIC of 2,3-MDMC-TFAA.

60

Fig. D7: Mass spectrum of 2,3-MDMC-

TFAA at 8.712 minutes in Methylenedioxy TFAA Mix.

Fig. D8: Mass spectrum of Methylone-TFAA at 8.978 minutes in Methylenedioxy TFAA

Mix.

Fig. D9: Mass spectrum of 10.056 peak

from the TIC of 2,3-MDMC-HFBA.

Fig. D10: Mass spectrum of 11.559 peak

from the TIC of Methylone-HFBA.

Fig. D11: Mass spectrum of 2,3-MDMC-

HFBA at 8.341 minutes in Methylenedioxy HFBA Mix.

Fig. D12: Mass spectrum of Methylone-

HFBA at 8.674 minutes in Methylenedioxy HFBA Mix.

61

Fig. D13: Mass spectrum of 10.075 peak

from the TIC of 2,3-MDMC-PFPA.

Fig. D14: Expanded Chromatogram of

Methylenedioxy PFPA Mix.

Fig. D15: Mass spectrum of 2,3-MDMC-PFPA at 8.277 minutes in Methylenedioxy

PFPA Mix.

Fig. D16: Mass spectrum of Methylone-

PFPA at 8.619 minutes in Methylenedioxy PFPA Mix.

62

Appendix E: Additional Pyrrolidine Cathinone Data

Fig. E1: Mass spectrum of 0.899 peak from

the TIC of 2-MPPP.

Fig. E2: Mass spectrum of 1.233 peak from

the TIC of 2-MPPP.

Fig. E3: Mass spectrum of 8.595 peak from

the TIC of 2-MPPP.

Fig. E4: Mass spectrum of 9.036 peak from

the TIC of 3-MPPP.

Fig. E5: Mass spectrum of 7.845 peak from

the TIC of 4-MPPP.

Fig. E6: Mass spectrum of 9.285 peak from

the TIC of 4-MPPP.

63

Fig. E7: Mass spectrum of 10.332 peak

from the TIC of 4-MOPPP.

Fig. E8: Mass spectrum of 10.710 peak

from the TIC of 3,4-MDPPP.

Fig. E9: Mass spectrum of 9.695 peak from

the TIC of Pyrovalerone.

Fig. E10: Mass spectrum of 10.905 peak

from the TIC of MDPV.


Recommended