Report 2.3 Overview Assessment of Fish Passage at Stream Crossings within Selected Watersheds Prepared by: S. Wilson, Fish Biologist Intern R. McCleary, Fish Biologist and C. Bambrick, Fish Technician Fish and Watershed Research Program Foothills Model Forest May 15, 2003
Transcript
Report 2.3
Overview Assessment of Fish Passage at
Stream Crossings within Selected Watersheds
Prepared by: S. Wilson, Fish Biologist Intern R. McCleary, Fish Biologist
and C. Bambrick, Fish Technician Fish and Watershed Research Program
Foothills Model Forest May 15, 2003
Overview Assessment of Fish Passage at Stream Crossings in Selected Watersheds
Foothills Model Forest Publication Disclaimer The views, statements and conclusions expressed, and the recommendations made
in this report are entirely those of the author(s) and should not be construed as statements
or conclusions of, or as expressing the opinions of the Foothills Model Forest, or the
partners or sponsors of the Foothills Model Forest. The exclusion of certain manufactured
products does not necessarily imply disapproval, nor does the mention of other products
necessarily imply endorsement by the Foothills Model Forest or any of its partners or
sponsors.
Foothills Model Forest i
Overview Assessment of Fish Passage at Stream Crossings in Selected Watersheds
Acknowledgements In 2002, this project was funded through a partnership that included the Alberta
Conservation Association (ACA), Weldwood of Canada Ltd. (Hinton Division), and the
Canadian Forest Service. The funding from Weldwood was made available through the
Forest Resources Improvement Program. Additional support for this Foothills Model
Forest project was received through Alberta Sustainable Resource Development and
Jasper National Park.
The methodology for this assessment was developed in consultation with Chris
Spytz, Biologist, with Weldwood of Canada Ltd. (Hinton Division). Rick Bonar, also
with Weldwood, provided review of our study design and draft reports. The 2002 field
crew included Jason Blackburn, Scott Wilson and Chad Sherburne, under the direction of
Richard McCleary. Prior to 2002, Craig Johnson oversaw the stream crossing project.
The 2001 field crew was comprised of Mike Blackburn, Chantelle Bambrick, Jason
Blackburn and Cameron Nelin. The 2000 field crew included Cam Davis, Jill Collyer
and Mike Blackburn. The 1999 field crew included Cam Davis, Mike Blackburn, Jason
Cooper, Chantelle Fourny and Twila Arsenault.
Foothills Model Forest ii
Overview Assessment of Fish Passage at Stream Crossings in Selected Watersheds
Abstract
For our purposes, a stream crossing was defined as the intersection of a stream with a road or railway. Within the study area, many historic crossings were designed based on water conveyance and fish passage. Hanging outfalls have evolved at some of these crossings and therefore, some structures were known to prevent upstream fish migration.
The Foothills Model Forest had several goals for this overview assessment. We recognized that considerable investment will be required to modify the existing road and railway infrastructure, and therefore we selected a watershed perspective to establish priorities for future engineering and biological assessments. These more detailed assessments will be required to identify options and establish budgets for remediation. Our study area included 14 watersheds and we included the intersection points of all mapped streams with mapped roads and railways within these watersheds.
We assessed a total of 302 crossings and identified four structures that currently present a full barrier to upstream fish migration within known fish bearing streams. If these crossings were repaired, access to a total of 6.2 km of known upstream habitat would be created. We also identified 18 crossings that present potential partial barriers to upstream fish migration in known fish bearing streams. Detailed assessments are required to determine the degree to which each of these crossings poses a barrier to upstream fish migration. If these crossings are all found to present some type of barrier and repairs are subsequently made, access to a total of 94.1 km of known fish habitat would be created. A total of 49 other crossings that would present either a full barrier or a potential partial barrier are located in streams with unknown fish bearing status and additional fish inventory is recommended prior to assessing these crossings for fish passage.
There are two main recommendations from this report. First, the findings from this report should be communicated to the crossing owners. Identification of the specific owners will require some effort, particularly for the oil & gas sector crossings. Second, a protocol should be developed for completing a detailed fish passage assessment. The Foothills Model Forest is willing to assist, where possible, with additional assessments. Ultimately, the crossing owner remains responsible for completing any detailed assessments and completing repairs to improve passage. Our goal is to increase awareness of fish passage issues and to provide practical tools for moving forward with remediation.
Foothills Model Forest iii
Overview Assessment of Fish Passage at Stream Crossings in Selected Watersheds
Table of Contents Foothills Model Forest Publication Disclaimer ................................................................... i Acknowledgements............................................................................................................. ii Abstract .............................................................................................................................. iii Table of Contents............................................................................................................... iv List of Figures .................................................................................................................... iv List of Tables ...................................................................................................................... v 1. Introduction.................................................................................................................... 1 2. Methods.......................................................................................................................... 4
2.1. Site Selection ............................................................................................................ 4 2.2. Field Methods .......................................................................................................... 4 2.3. Assessment of Fish Passage Status .......................................................................... 5 2.4. Determination of Fish-bearing Status ..................................................................... 6 2.5. Summary of Findings .............................................................................................. 8
3. Results............................................................................................................................ 9 3.1. Summary by Watershed............................................................................................ 9
3.1.1 Anderson Creek Watershed .............................................................................. 9 3.1.2 Antler Creek Watershed.................................................................................. 12 3.1.3 Emerson Creek Watershed.............................................................................. 13 3.1.4 Erith Creek Watershed.................................................................................... 15 3.1.5 Fish Creek Watershed ..................................................................................... 16 3.1.6 Lambert Creek Watershed .............................................................................. 17 3.1.7 Lynx Creek Watershed ................................................................................... 18 3.1.8 Moon Creek Watershed .................................................................................. 20 3.1.9 Pinto Creek Watershed ................................................................................... 21 3.1.10 Solomon Creek Watershed ........................................................................... 23 3.1.11 Teepee Creek Watershed .............................................................................. 25 3.1.12 Tri-Creeks Watersheds.................................................................................. 27
4. Summary of Crossings in all Watersheds by Follow-up Assessment Type ................. 29 5. Recommendations........................................................................................................ 32
5.1 Communication of Findings to LOC Holders ......................................................... 32 5.2 Development of a Protocol for Completing Detailed Fish Passage Assessment for Restoration Purposes .................................................................................................... 32 5.3 Identification of Future Roles of the Foothills Model Forest ................................. 33
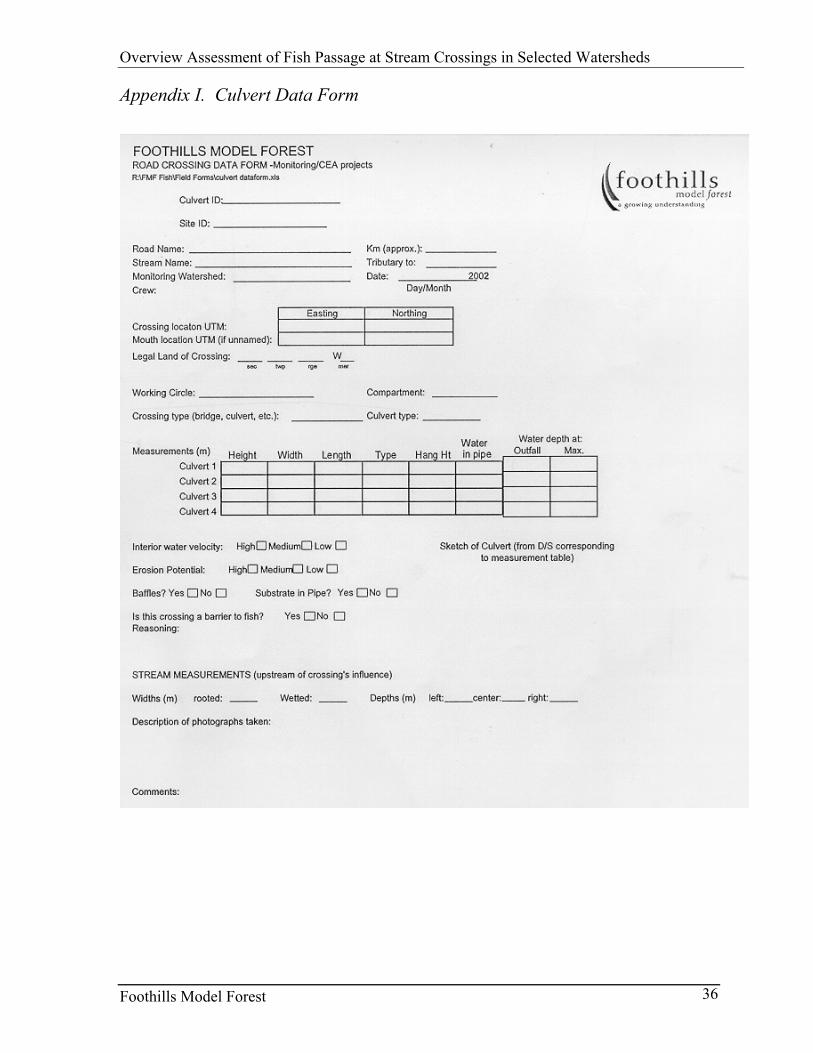
6. Glossary ....................................................................................................................... 34 7. Literature Cited ............................................................................................................ 35 Appendix I. Culvert Data Form ....................................................................................... 36 List of Figures Figure 1. Monitoring Watersheds within the Foothills Model Forest ............................... 4 Figure 2. Stream channel measurements taken upstream of each crossing included;
rooted width (A), wetted width (B), and three water depths across the channel (C).. 4 Figure 3. Typical measurements taken from a culvert-type stream crossing, where; (D)
hang height, (E) culvert diameter, (F) pool depth, and (G) culvert length. ................ 5
Foothills Model Forest iv
Overview Assessment of Fish Passage at Stream Crossings in Selected Watersheds
Figure 4. Percentage of sites where fish were captured within the Foothills Model Forest according to stream reach slope class. ........................................................................ 8
Figure 5. Location and status of stream crossings within Anderson Creek Watershed... 11 Figure 6. Location and status of stream crossings within Antler Creek Watershed. ....... 12 Figure 7. Location and status of stream crossings within Emerson Creek Watershed. ... 14 Figure 8. Location and status of stream crossings within Erith Creek Watershed. ......... 15 Figure 9. Location and status of stream crossings within Fish Creek Watershed. .......... 16 Figure 10. Location and status of stream crossings within Lambert Creek Watershed... 17 Figure 11. Location and status of stream crossings within Lynx Creek Watershed........ 19 Figure 12. Location and status of stream crossings within Moon Creek Watershed....... 20 Figure 13. Location and status of stream crossings within Pinto Creek Watershed........ 22 Figure 14. Location and status of stream crossings within Solomon Creek Watershed.. 24 Figure 15. Location and status of stream crossings within Teepee Creek Watershed..... 26 Figure 16. Location and status of stream crossings within Tri-Creeks Watersheds........ 28 List of Tables Table 1. Stream crossing barrier classification .................................................................. 6 Table 2. Determination of probability of fish capture. ...................................................... 7 Table 3. Detailed fish passage assessment sites in Anderson Creek Watershed ............. 10 Table 4. Future inventory sites in Anderson Creek Watershed. ...................................... 10 Table 5. Future inventory sites in Antler Creek Watershed............................................. 12 Table 6. Detailed fish passage assessment sites in Emerson Creek Watershed............... 13 Table 7. Future inventory sites in Emerson Creek Watershed......................................... 13 Table 8. Remediation candidate sites in Erith Creek Watershed..................................... 15 Table 9. Detailed fish passage assessment sites in Erith Creek Watershed..................... 15 Table 10. Future inventory sites in Erith Creek Watershed............................................. 15 Table 11. Detailed fish passage assessment sites in Fish Creek Watershed.................... 16 Table 12. Future inventory sites in Fish Creek Watershed.............................................. 16 Table 13. Future inventory sites in Lambert Creek Watershed. ...................................... 17 Table 14. Detailed fish passage assessment sites in Lynx Creek Watershed. ................. 18 Table 15. Future inventory sites in Lynx Creek Watershed. ........................................... 18 Table 16. Future inventory sites in Moon Creek Watershed. .......................................... 20 Table 17. Remediation candidate sites in Pinto Creek Watershed. ................................. 21 Table 18. Detailed fish passage assessment sites in Pinto Creek Watershed. ................. 21 Table 19. Future inventory sites in Pinto Creek Watershed. ........................................... 21 Table 20. Future inventory sites in Solomon Creek Watershed. ..................................... 23 Table 21. Detailed fish passage assessment sites in Teepee Creek Watershed. .............. 25 Table 22. Future inventory sites in Teepee Creek Watershed. ........................................ 25 Table 23. Detailed fish passage assessment sites in Deerlick Creek Watershed. ............ 27 Table 24. Future inventory sites in Eunice Creek Watershed.......................................... 27 Table 25. All remediation candidate sites in the Monitoring Watersheds. ...................... 29 Table 26. All detailed fish passage assessment sites in the Monitoring Watersheds. ..... 30 Table 27. All future inventory sites in the Monitoring Watersheds. ............................... 30
Foothills Model Forest v
Overview Assessment of Fish Passage at Stream Crossings in Selected Watersheds
1. Introduction Fish migrate to different locations in a watershed in order to meet a variety of life
history requirements. This includes both adult fish returning upstream to spawn, juvenile
fish dispersing throughout watersheds to access suitable rearing habitat and all life stages
as they move towards suitable over-wintering areas (Whyte et. al 1997). Stream
crossings occur wherever roads or railways intersect streams. Structures designed to
convey water under roads and railways have the potential to block upstream fish
migration. Over the long-term, stream crossings that block upstream fish migration have
the potential to reduce the productivity and distribution of the various fish species that
inhabit an impacted area.
Within the Foothills Model Forest (FMF), native fish including Bull Trout
(Prosopium williamsoni), Arctic Grayling (Thymallus arcticus) and Long Nosed Sucker
(Catastomus catastomus) have been observed making the seasonal upstream migration
for spawning (FMF 1999 - 2001). Juveniles of these species have significantly reduced
swimming capabilities (Katopodis 1994) and have also been observed widely distributed
throughout the region. Other species including Spoonhead Sculpin (Cottus ricei),
Northern Pike (Esox lucius) and Burbot (Lota lota), which have reduced swimming
capabilities in moving water due to their mode of swimming (Katopodis 1994), also
inhabit small streams in the region (FMF 1999 - 2002).
Barriers typically occur when upstream fish migration was not identified as an
objective during the stream crossing design and engineering phase. Current standards for
stream crossings include maintaining fish passage at man-made structures (Fisheries Act
1985). Fish passage on older roads and crossings may not have been identified as an
objective at the time of construction. Or, due to scour at a culvert outlet, structures that
initially met fish passage requirements may now present a migration barrier. Both the
federal and provincial governments have more recently established approval processes to
ensure that long-term fish passage requirements are addressed in the project design phase
(Fisheries and Oceans Canada 1991 and Alberta Government 2001).
Following the recognition of the amount of productive fish habitat that was not
accessible, many jurisdictions have initiated programs to restore fish passage. Such
Foothills Model Forest 1
Overview Assessment of Fish Passage at Stream Crossings in Selected Watersheds
efforts include the British Columbia Watershed Restoration Program (Parker 2000), US
Forest Service restoration programs (Love & Firor 2001) and the Weldwood Stream
Crossing Remediation Program (R. Bonar, Weldwood Chief Biologist, pers. comm.
2002). The Weldwood program for stream crossing remediation involves all crossings
that the company is responsible for within their FMA. Their program is based on a
comprehensive assessment that includes safety, sedimentation, as well as fish passage
concerns. Our study is intended to augment their ongoing program by providing a
watershed perspective that may assist the company in determining priority sites for fish
passage remediation.
Determining the fish-bearing status and fish migration barrier status at all 302
crossings within the monitoring watersheds was beyond the scope of this project.
Therefore, the first objective of this preliminary assessment was to identify crossings that
may require one of the three more detailed assessments. First, we identified crossings
that presented a fish migration barrier within a known fish-bearing stream. These
crossings would be suited to a remediation design assessment. Second, we identified
potential fish migration barriers that are present in known fish-bearing streams. These
crossings would be candidates for a more detailed crossing assessment to determine the
severity of the barrier and the priority for remediation. Third, we identified barriers and
potential barriers in streams with unknown fish-bearing status. These crossings would be
candidates for future assessment in the ongoing FMF fish and fish habitat inventory
program. The reader should be aware that our preliminary assessment was not intended
to be definite in all cases but to serve as a tool to establish priorities for further work in an
ongoing remediation program.
A second objective was to develop a methodology that could be useful to guide
other remediation efforts outside of the project study area. Our project may also provide
some of the background for the terms of reference for the development of a more detailed
fish passage assessment as part of Weldwood’s remediation program.
A third objective was to determine the extent of upstream habitat that may have
been isolated due to migration barriers within each of the monitoring watersheds.
Foothills Model Forest 2
Overview Assessment of Fish Passage at Stream Crossings in Selected Watersheds
The final objective was to increase awareness and encourage the companies and
government agencies responsible for stream crossings to develop and implement plans to
upgrade existing structures in order to satisfy fish passage requirements.
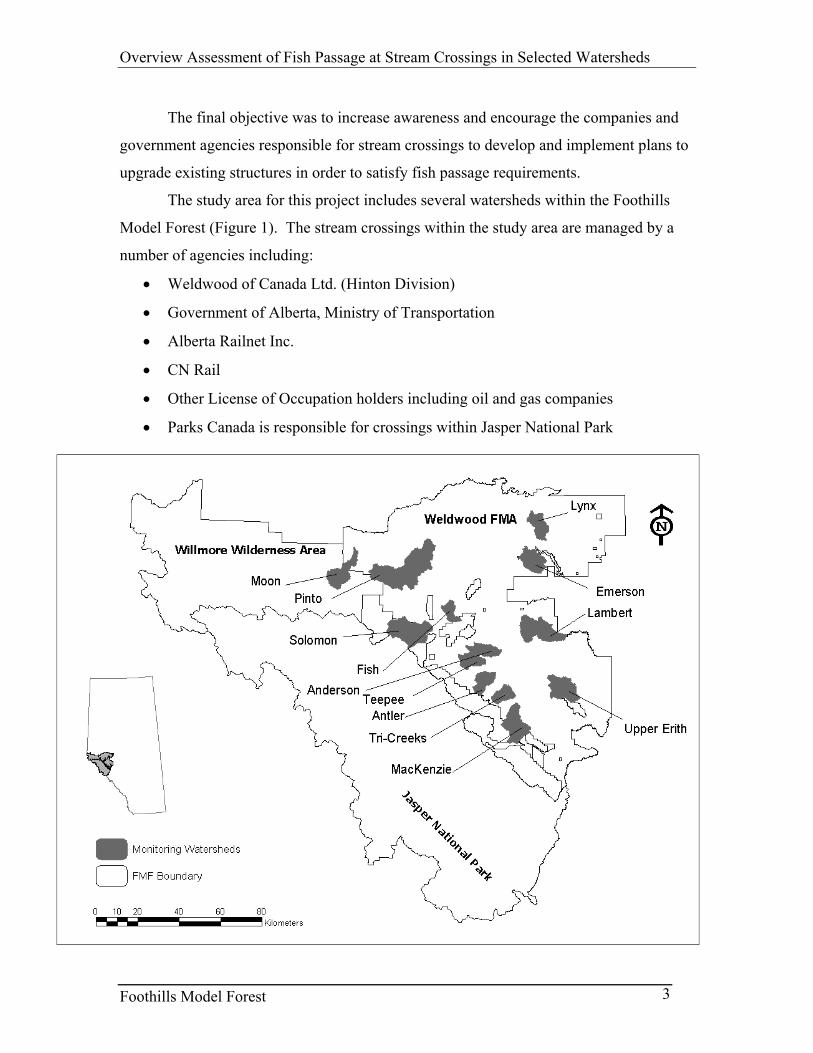
The study area for this project includes several watersheds within the Foothills
Model Forest (Figure 1). The stream crossings within the study area are managed by a
number of agencies including:
• Weldwood of Canada Ltd. (Hinton Division)
• Government of Alberta, Ministry of Transportation
• Alberta Railnet Inc.
• CN Rail
• Other License of Occupation holders including oil and gas companies
• Parks Canada is responsible for crossings within Jasper National Park
Foothills Model Forest 3
Overview Assessment of Fish Passage at Stream Crossings in Selected Watersheds
Figure 1. Monitoring Watersheds within the Foothills Model Forest
2. Methods
2.1. Site Selection
To identify field survey sites within the monitoring watersheds, maps were
produced showing all streams along with highways, railways, and industrial roads. All
road-stream intersections and railroad-stream intersections were numbered and field
maps were created.
2.2. Field Methods
All field data were recorded on a crossing data form (Appendix I). This data
included location description, structure type, stream channel measurements, and crossing
details. Along with a general description of the site location, GPS coordinates were taken
at each site. Photographs of each inflow, outflow and any other important features were
also taken.
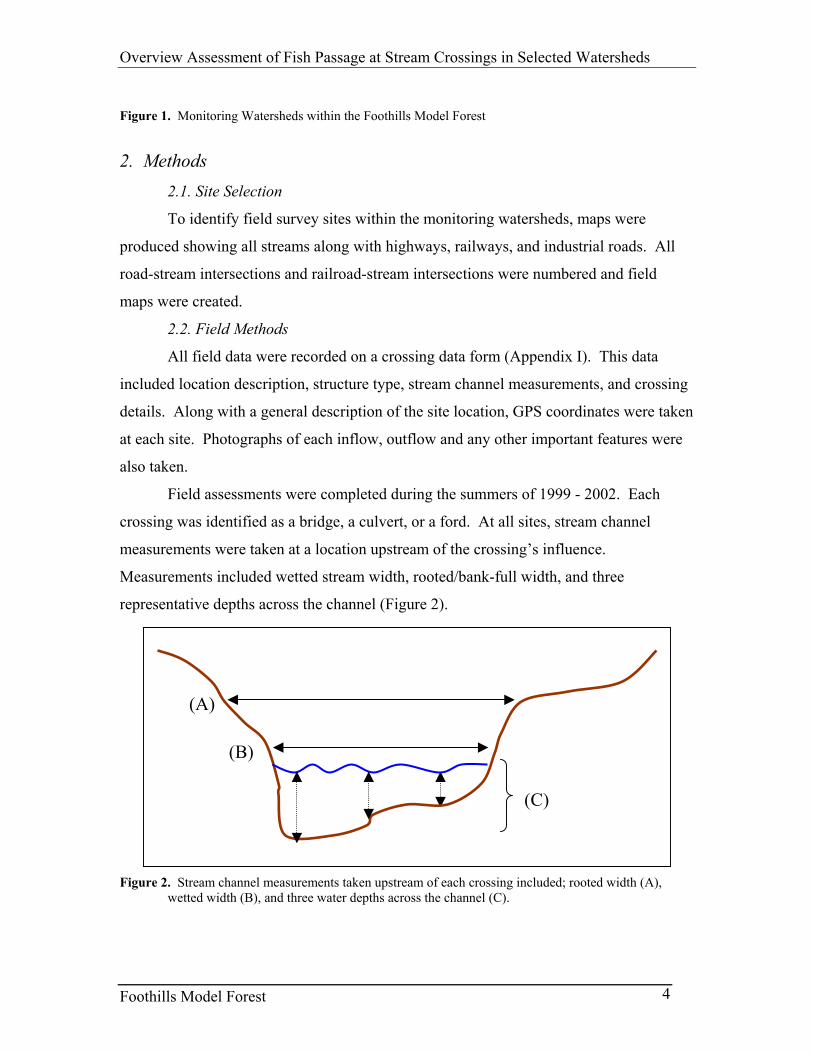
Field assessments were completed during the summers of 1999 - 2002. Each
crossing was identified as a bridge, a culvert, or a ford. At all sites, stream channel
measurements were taken at a location upstream of the crossing’s influence.
Measurements included wetted stream width, rooted/bank-full width, and three
representative depths across the channel (Figure 2).
(A)
(C)
(B)
Figure 2. Stream channel measurements taken upstream of each crossing included; rooted width (A), wetted width (B), and three water depths across the channel (C).
Foothills Model Forest 4
Overview Assessment of Fish Passage at Stream Crossings in Selected Watersheds
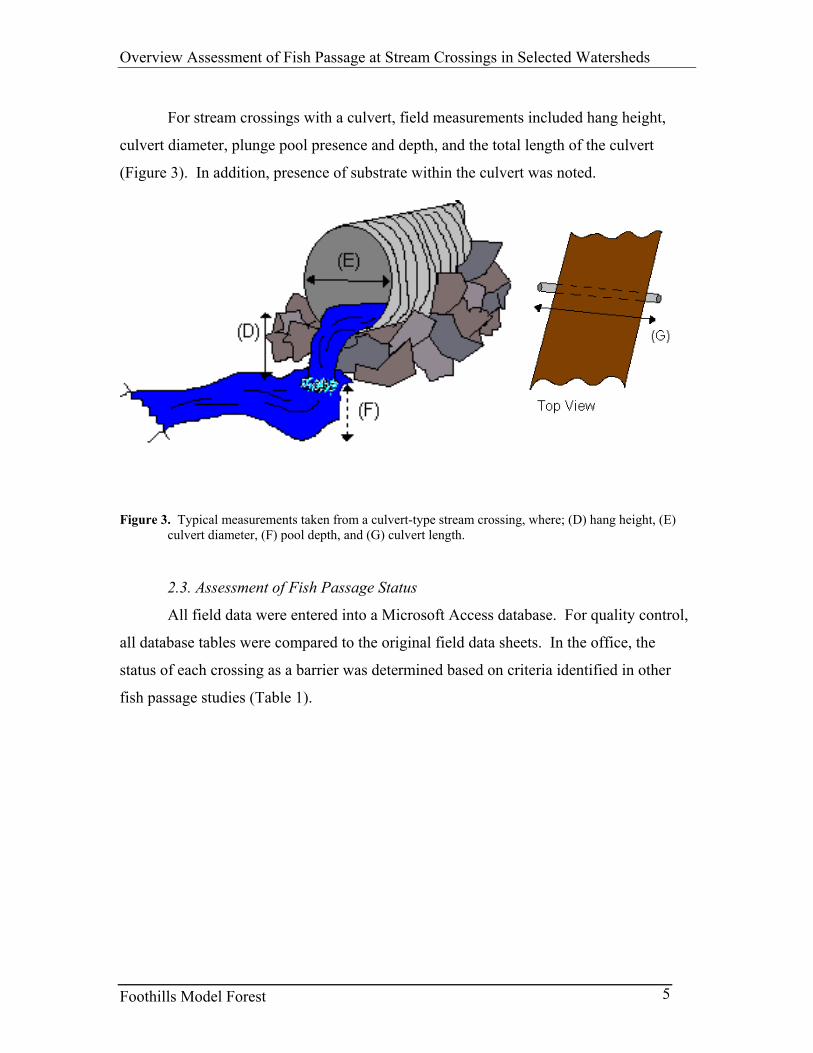
For stream crossings with a culvert, field measurements included hang height,
culvert diameter, plunge pool presence and depth, and the total length of the culvert
(Figure 3). In addition, presence of substrate within the culvert was noted.
Figure 3. Typical measurements taken from a culvert-type stream crossing, where; (D) hang height, (E) culvert diameter, (F) pool depth, and (G) culvert length.
2.3. Assessment of Fish Passage Status
All field data were entered into a Microsoft Access database. For quality control,
all database tables were compared to the original field data sheets. In the office, the
status of each crossing as a barrier was determined based on criteria identified in other
fish passage studies (Table 1).
Foothills Model Forest 5
Overview Assessment of Fish Passage at Stream Crossings in Selected Watersheds
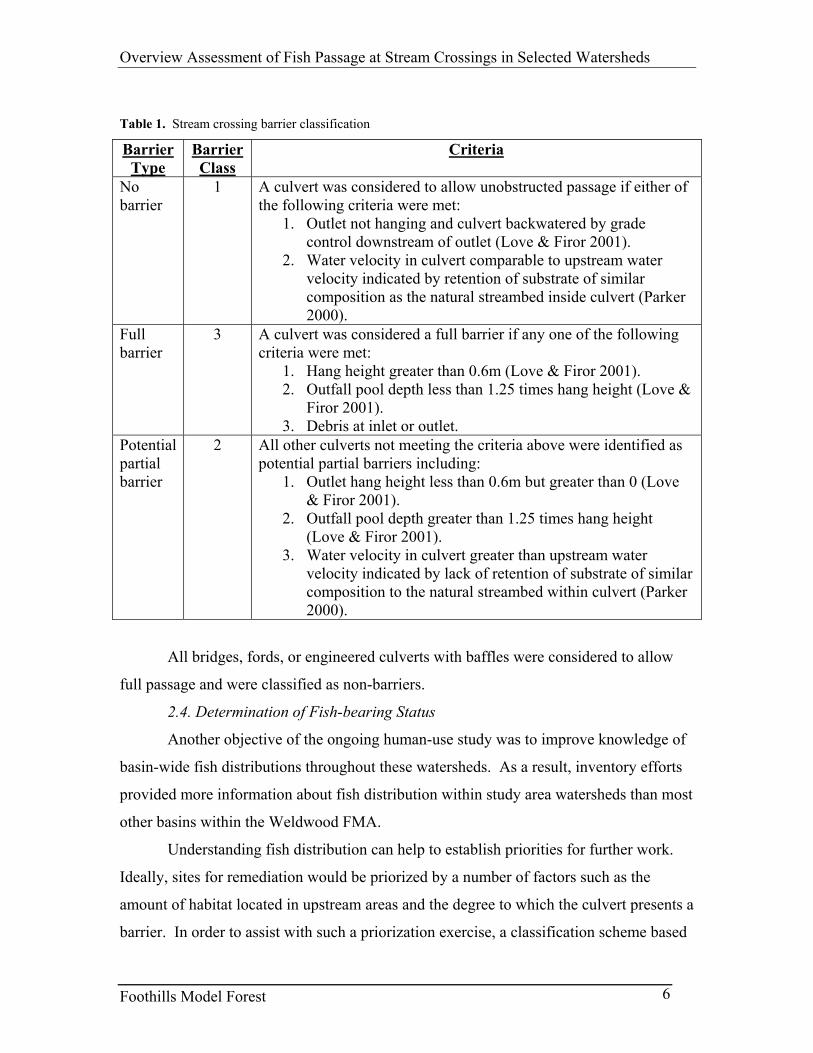
Table 1. Stream crossing barrier classification
Barrier Type
Barrier Class
Criteria
No barrier
1 A culvert was considered to allow unobstructed passage if either of the following criteria were met:
1. Outlet not hanging and culvert backwatered by grade control downstream of outlet (Love & Firor 2001).
2. Water velocity in culvert comparable to upstream water velocity indicated by retention of substrate of similar composition as the natural streambed inside culvert (Parker 2000).
Full barrier
3 A culvert was considered a full barrier if any one of the following criteria were met:
1. Hang height greater than 0.6m (Love & Firor 2001). 2. Outfall pool depth less than 1.25 times hang height (Love &
Firor 2001). 3. Debris at inlet or outlet.
Potential partial barrier
2 All other culverts not meeting the criteria above were identified as potential partial barriers including:
1. Outlet hang height less than 0.6m but greater than 0 (Love & Firor 2001).
2. Outfall pool depth greater than 1.25 times hang height (Love & Firor 2001).
3. Water velocity in culvert greater than upstream water velocity indicated by lack of retention of substrate of similar composition to the natural streambed within culvert (Parker 2000).
All bridges, fords, or engineered culverts with baffles were considered to allow
full passage and were classified as non-barriers.
2.4. Determination of Fish-bearing Status
Another objective of the ongoing human-use study was to improve knowledge of
basin-wide fish distributions throughout these watersheds. As a result, inventory efforts
provided more information about fish distribution within study area watersheds than most
other basins within the Weldwood FMA.
Understanding fish distribution can help to establish priorities for further work.
Ideally, sites for remediation would be priorized by a number of factors such as the
amount of habitat located in upstream areas and the degree to which the culvert presents a
barrier. In order to assist with such a priorization exercise, a classification scheme based
Foothills Model Forest 6
Overview Assessment of Fish Passage at Stream Crossings in Selected Watersheds
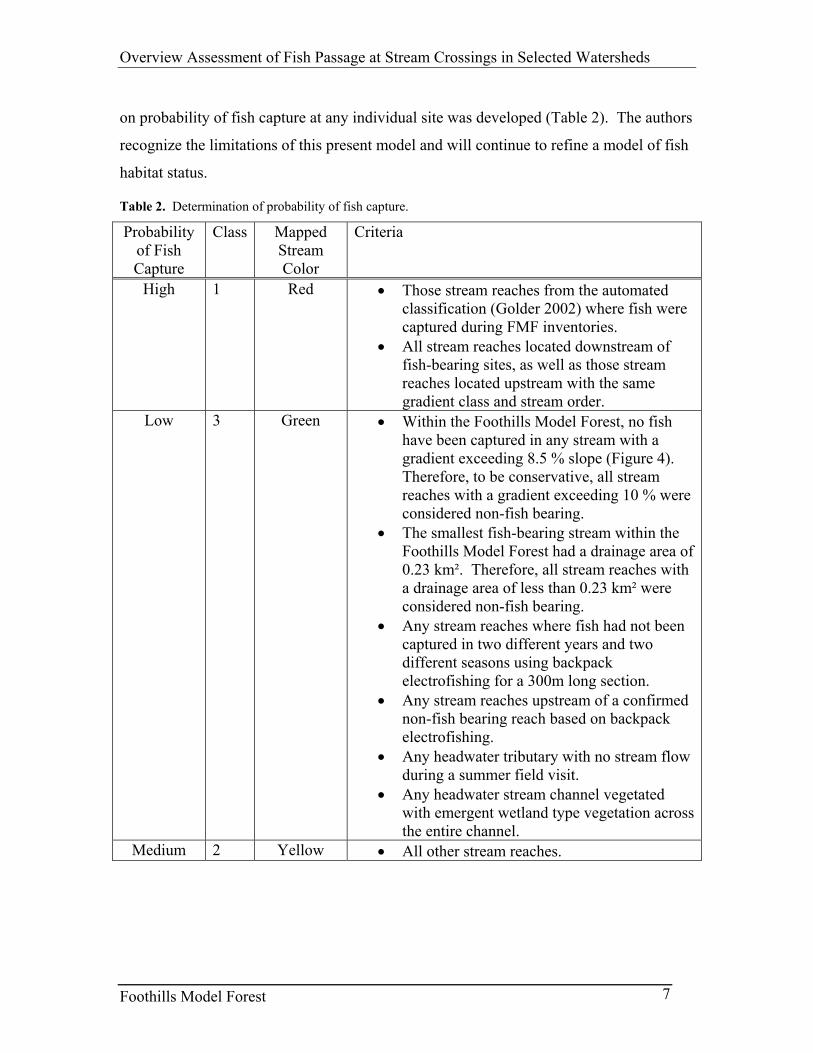
on probability of fish capture at any individual site was developed (Table 2). The authors
recognize the limitations of this present model and will continue to refine a model of fish
habitat status.
Table 2. Determination of probability of fish capture.
Probability of Fish Capture
Class Mapped Stream Color
Criteria
High 1 Red • Those stream reaches from the automated classification (Golder 2002) where fish were captured during FMF inventories.
• All stream reaches located downstream of fish-bearing sites, as well as those stream reaches located upstream with the same gradient class and stream order.
Low 3 Green • Within the Foothills Model Forest, no fish have been captured in any stream with a gradient exceeding 8.5 % slope (Figure 4). Therefore, to be conservative, all stream reaches with a gradient exceeding 10 % were considered non-fish bearing.
• The smallest fish-bearing stream within the Foothills Model Forest had a drainage area of 0.23 km². Therefore, all stream reaches with a drainage area of less than 0.23 km² were considered non-fish bearing.
• Any stream reaches where fish had not been captured in two different years and two different seasons using backpack electrofishing for a 300m long section.
• Any stream reaches upstream of a confirmed non-fish bearing reach based on backpack electrofishing.
• Any headwater tributary with no stream flow during a summer field visit.
• Any headwater stream channel vegetated with emergent wetland type vegetation across the entire channel.
Medium 2 Yellow • All other stream reaches.
Foothills Model Forest 7
Overview Assessment of Fish Passage at Stream Crossings in Selected Watersheds
Table 4. Future inventory sites in Anderson Creek Watershed.
Inspection Km of Medium Probability of Barrier Crossing # Year Fish Capture Stream Upstream Status
C20203 2002 5.7 Full C99005 1999 1.4 Full C99011 1999 1.0 Full C99015 1999 0.9 Full C99004 1999 0.7 Full C99009 1999 0.7 Full C99020 1999 0.3 Potential partial
Foothills Model Forest 10
Overview Assessment of Fish Passage at Stream Crossings in Selected Watersheds
Figure 5. Location and status of stream crossings within Anderson Creek Watershed.
%a
%a
$T%a
(X%a
$T
(X
(X
%a $T$T
(X$T
(X
$T$T
(X
(X
(X
%a%a(X
$T
%a
$T
$T
$T$T
$T
%a$T
%a%a$T%a$T
$T$T
$T%a
%a
%a
$T
$T
%a
%a
$T
%a$T
C99012
C99013
C99018
C99019
C99020
C99021
C99022
C99024
C99026
C99028C99030
C99032
C20203
C20204
C99004C99005
C99008 C99009
C99010
C99011 C99014
C99015C20205
Watershed boundaryAnderson roads
Probability of fish tureHighMediumLow
Crossing status$T Passable(X Potential partial barrier%a Not passableö Not assessed
Legend
3 0 3 6 9 12 Kilometers
N
EW
S
cap
Foothills Model Forest 11
Overview Assessment of Fish Passage at Stream Crossings in Selected Watersheds
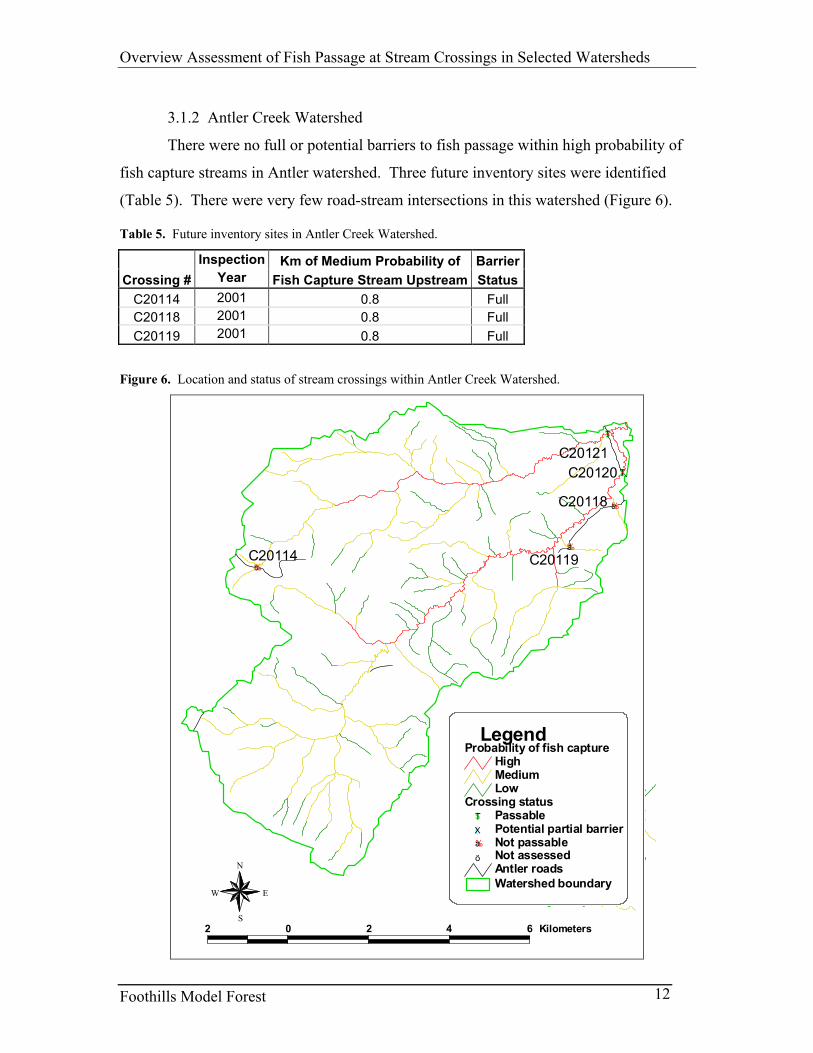
3.1.2 Antler Creek Watershed
There were no full or potential barriers to fish passage within high probability of
fish capture streams in Antler watershed. Three future inventory sites were identified
(Table 5). There were very few road-stream intersections in this watershed (Figure 6).
Table 5. Future inventory sites in Antler Creek Watershed.
Inspection Km of Medium Probability of BarrierCrossing # Year Fish Capture Stream Upstream Status
C20114 2001 0.8 Full C20118 2001 0.8 Full C20119 2001 0.8 Full
Figure 6. Location and status of stream crossings within Antler Creek Watershed.
%a
%a
%a
$T
$T
C20114
C20118
C20119
C20120C20121
2 0 2 4 6 Kilometers
Watershed boundaryAntler roads
Crossing status$T Passable(X Potential partial barrier%a Not passableö Not assessed
Probability of fish captureHighMediumLow
Legend
N
EW
S
Foothills Model Forest 12
Overview Assessment of Fish Passage at Stream Crossings in Selected Watersheds
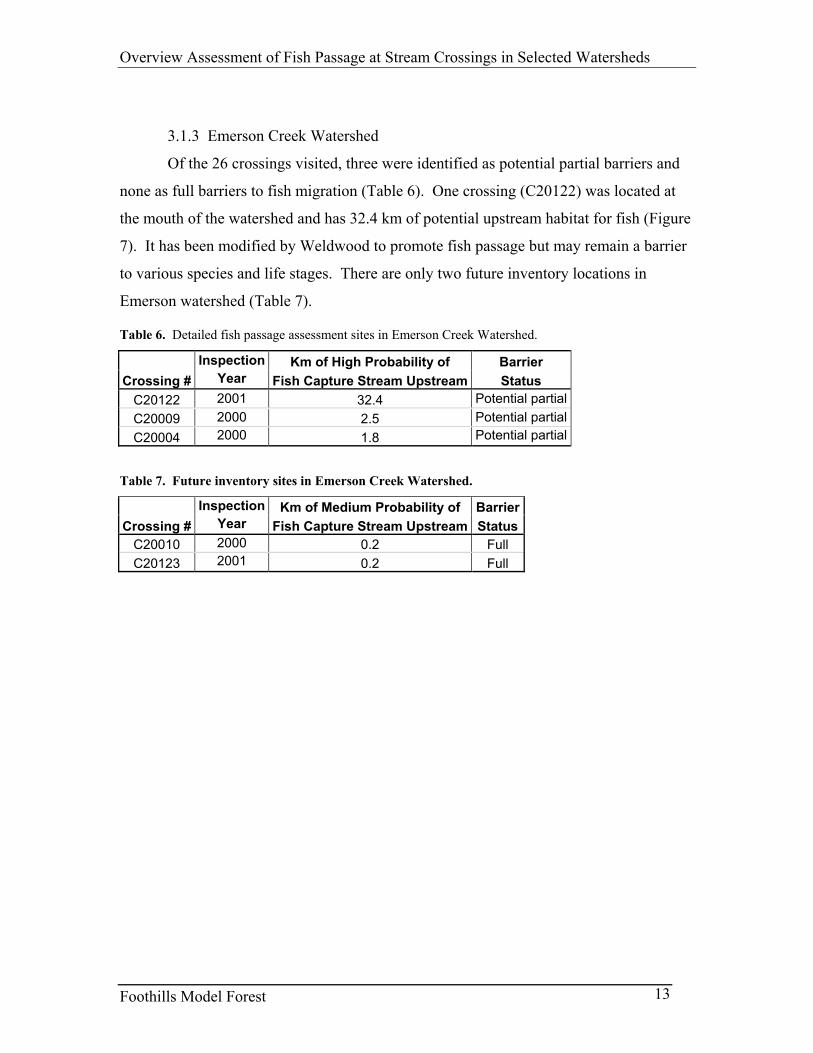
3.1.3 Emerson Creek Watershed
Of the 26 crossings visited, three were identified as potential partial barriers and
none as full barriers to fish migration (Table 6). One crossing (C20122) was located at
the mouth of the watershed and has 32.4 km of potential upstream habitat for fish (Figure
7). It has been modified by Weldwood to promote fish passage but may remain a barrier
to various species and life stages. There are only two future inventory locations in
Emerson watershed (Table 7).
Table 6. Detailed fish passage assessment sites in Emerson Creek Watershed.
Inspection Km of High Probability of Barrier Crossing # Year Fish Capture Stream Upstream Status
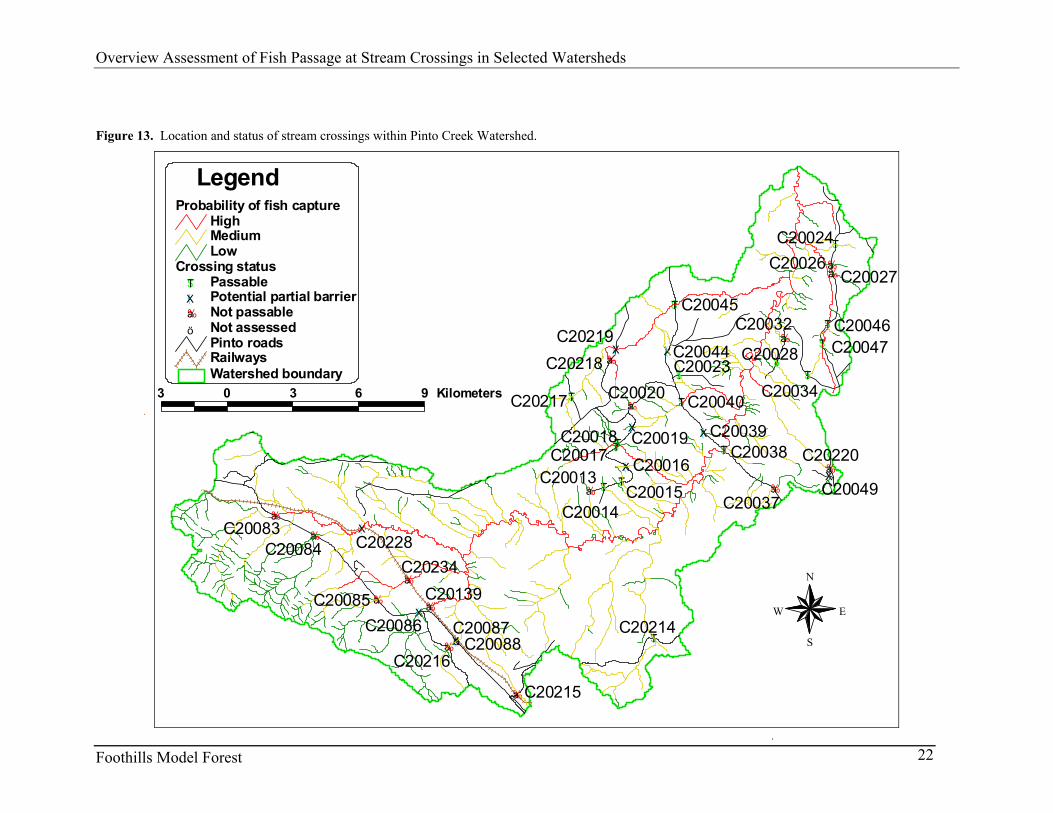
Table 19. Future inventory sites in Pinto Creek Watershed.
Inspection Km of Medium Probability of Barrier Crossing # Year Fish Capture Stream Upstream Status
C20215 2002 0.8 Full C20087 2000 0.7 Potential partialC20016 2000 0.6 Potential partialC20044 2000 0.3 Potential partialC20216 2002 0.2 Full
Foothills Model Forest 21
Overview Assessment of Fish Passage at Stream Crossings in Selected Watersheds
Figure 13. Location and status of stream crossings within Pinto Creek Watershed.
Foothills Model Forest 22
%a $T $T(X
$T$T(X
%a
$T
$T
%a%a
$T
%a
$T
%a
$T(X
$T
(X
$T
$T
$T
(X
%a
%a
%a(X
(X
%a
ö
%a
%a$T
%a
$T
(X%a
%a
(X
C20013
C20014
C20016C20017
C20020C20023
C20024C20026
C20027
C20028
C20032
C20034
C20037
C20038
C20040
C20044
C20045C20046C20047
C20049
C20083C20084
C20085C20086 C20087
C20139
C20088
C20215
C20216
C20214
C20220
C20217
C20219C20218
C20234C20228
C20039
C20015
C20018 C20019
Watershed boundaryRailwaysPinto roads
Crossing status$T Passable(X Potential partial barrier%a Not passableö Not assessed
Probability of fish captureHighMediumLow
Legend
3 0 3 6 9 Kilometers
N
EW
S
Overview Assessment of Fish Passage at Stream Crossings in Selected Watersheds
3.1.10 Solomon Creek Watershed
Most crossings in Solomon were bridges, and did not affect fish passage (Figure 14).
Four sites were identified as barriers on potentially fish bearing streams and require additional
inventory to confirm fish bearing status (Table 20).
Table 20. Future inventory sites in Solomon Creek Watershed.
Inspection Km of Medium Probability of BarrierCrossing # Year Fish Capture Stream Upstream Status
C20222 2002 2.9 Full C20225 2002 2.4 Full C20224 2002 0.5 Full C20221 2002 0.4 Full
Foothills Model Forest 23
Overview Assessment of Fish Passage at Stream Crossings in Selected Watersheds
Figure 14. Location and status of stream crossings within Solomon Creek Watershed.
$T
$T$T
%a%a
$T
%a
%a
C20137C20138
C20141
C20224C20225
C20223
C20222
C 0221
Watershed boundaryRailwaysSolomon roads
Crossing status$T Passable(X Potential partial barrier%a Not passableö Not assessed
Probability of fish captureHighMediumLow
Legend
3 0 3 6 9 12 Kilometers
N
EW
S
2
Foothills Model Forest 24
Overview Assessment of Fish Passage at Stream Crossings in Selected Watersheds
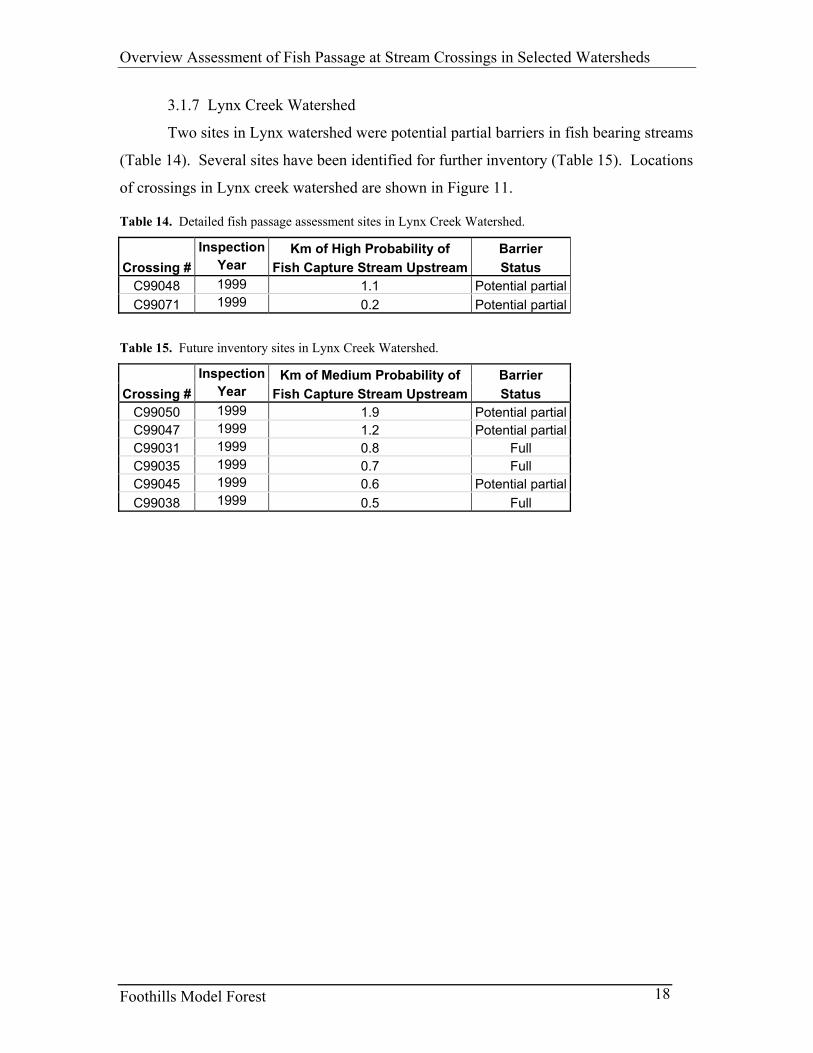
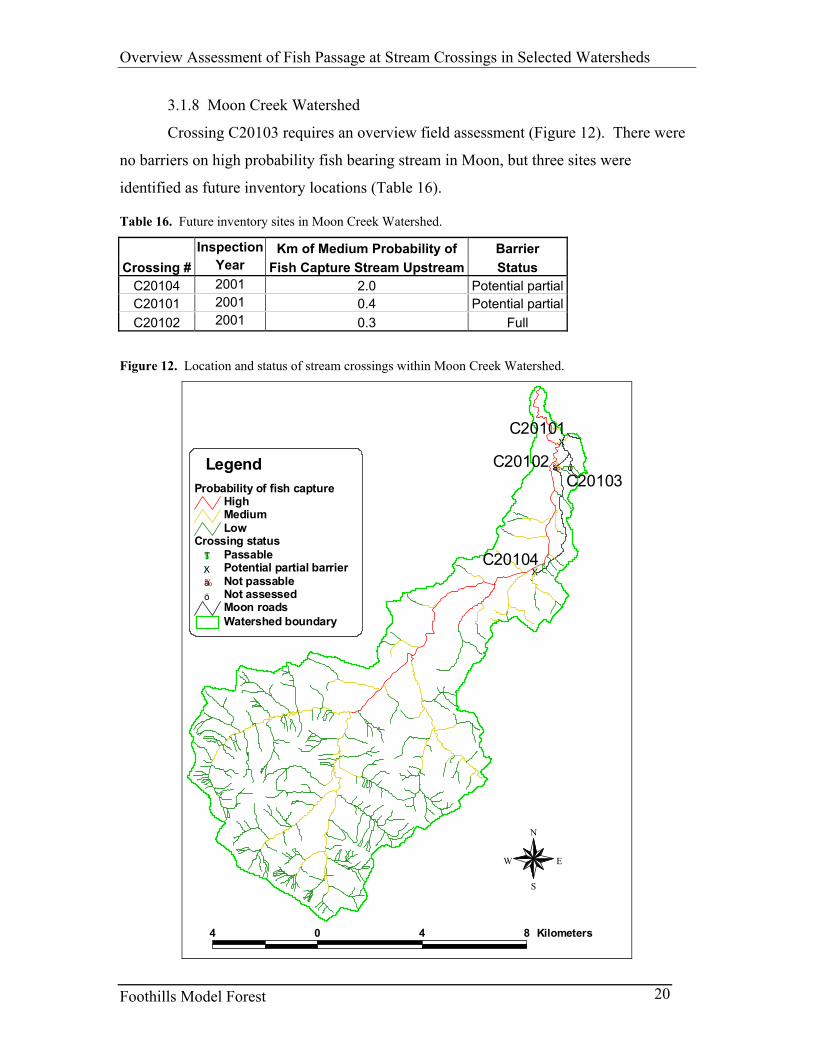
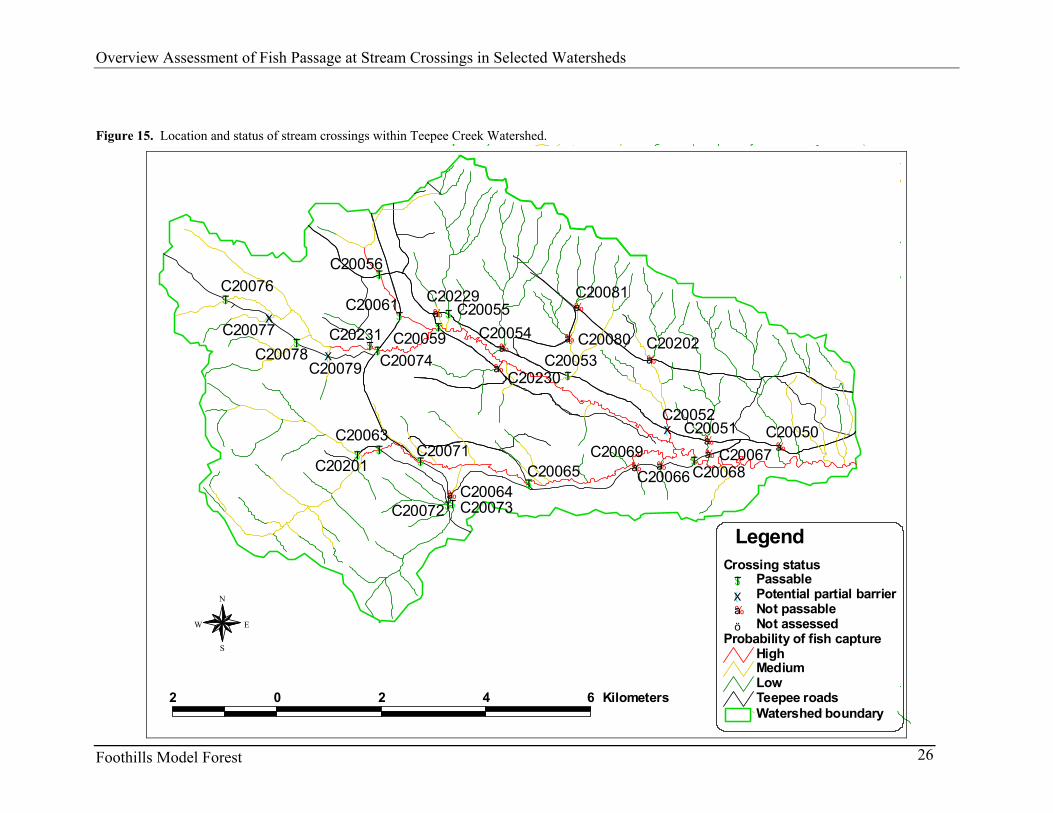
3.1.11 Teepee Creek Watershed
There were a high number of crossings in Teepee watershed (Figure 15), but only one site
was a partial barrier in a fish-bearing stream (Table 21). Five sites were barriers in medium
probability of fish capture streams (Table 22).
Table 21. Detailed fish passage assessment sites in Teepee Creek Watershed.
Inspection Km of High Probability of Barrier Crossing # Year Fish Capture Stream Upstream Status
C20052 2000 0.4 Potential partial Table 22. Future inventory sites in Teepee Creek Watershed.
Inspection Km of Medium Probability of Barrier Crossing # Year Fish Capture Stream Upstream Status
C20077 2000 0.8 Potential partialC20079 2000 0.5 Potential partialC20064 2000 0.2 Full C20081 2000 0.1 Full C20229 2002 0.1 Full
Foothills Model Forest 25
Overview Assessment of Fish Passage at Stream Crossings in Selected Watersheds
Figure 15. Location and status of stream crossings within Teepee Creek Watershed.
%a
%a
$T
%a
(X%a
%a%a(X
$T
%a
$T
$T
$T$T
$T
%a$T
%a%a$T%a$T
$T$T
$T
$T(X
$T(X
%a
%a%a
%a
$T
%a$T
C20050C20051C20052
C20053
C20054C20055
C20056
C20059
C20061
C20063
C20064C20065 C2 66
C20067C20068
C20069C20071
C20072 C20073
C20074
C20076
C20077C20078
C20079
C20080
C20081
C20230
C20201
C20202C20231
C20229
Watershed boundaryTeepee roads
Probability of fish captureHighMediumLow
Crossing status$T Passable(X Potential partial barrier%a Not passableö Not assessed
Legend
2 0 2 4 6 Kilometers
N
EW
S
00
Foothills Model Forest 26
Overview Assessment of Fish Passage at Stream Crossings in Selected Watersheds
Foothills Model Forest 26
Overview Assessment of Fish Passage at Stream Crossings in Selected Watersheds
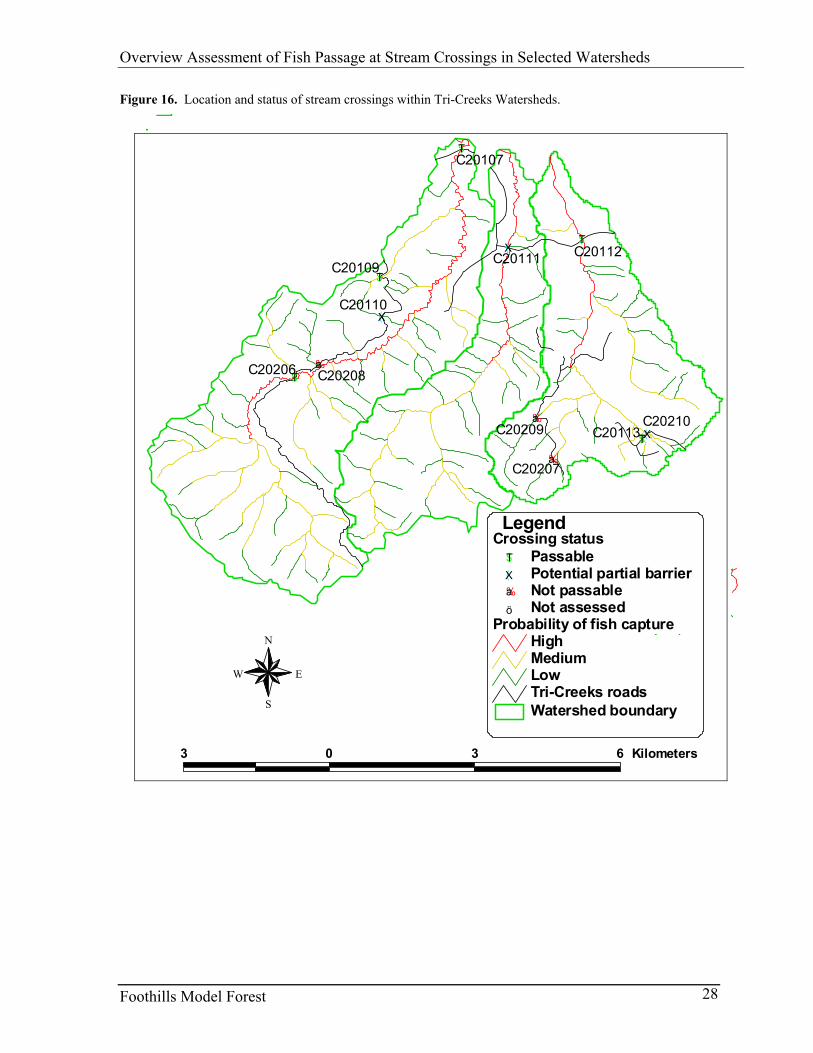
3.1.12 Tri-Creeks Watersheds
Tri-creeks is an amalgamation of three adjacent watersheds; Wampus to the West,
Deerlick in the center, and Eunice to the East (Figure 16). The only sites of interest were a
potential partial barrier on Deerlick creek (Table 23), and two locations in Eunice watershed that
need further fish inventory (Table 24).
Table 23. Detailed fish passage assessment sites in Deerlick Creek Watershed.
Inspection Km of High Probability of Barrier Crossing # Year Fish Capture Stream Upstream Status
C20111 2001 3.0 Potential partial Table 24. Future inventory sites in Eunice Creek Watershed.
Inspection Km of Medium Probability of Barrier Crossing # Year Fish Capture Stream Upstream Status
C20210 2002 0.8 Potential partialC20207 2002 0.1 Full
Foothills Model Forest 27
Overview Assessment of Fish Passage at Stream Crossings in Selected Watersheds
Figure 16. Location and status of stream crossings within Tri-Creeks Watersheds.
$T
$T
(X
(X$T
$T(X%a
%a
%a$T
C20107
C20109
C20110
C20111 C20112
C20113C20210C20209
C20207
C20208C20206
3 0 3 6 Kilometers
Watershed boundaryTri-Creeks roads
Probability of fish captureHighMediumLow
Crossing status$T Passable(X Potential partial barrier%a Not passableö Not assessed
Legend
N
EW
S
Foothills Model Forest 28
Overview Assessment of Fish Passage at Stream Crossings in Selected Watersheds
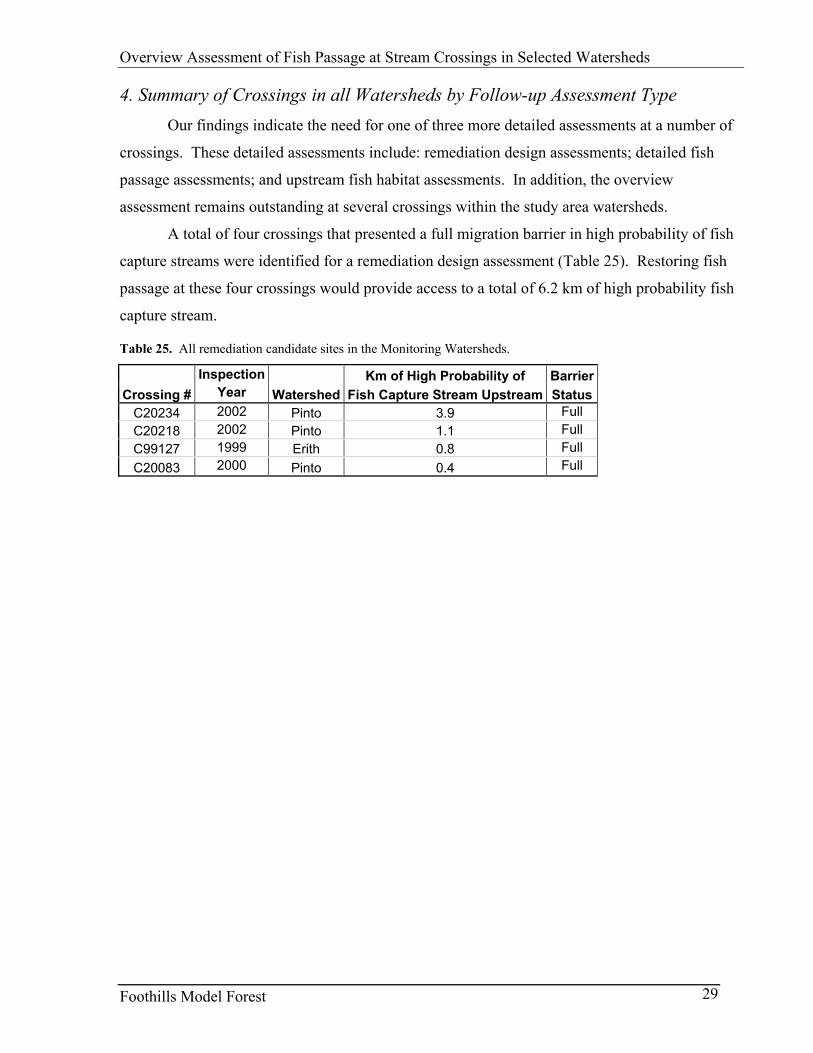
4. Summary of Crossings in all Watersheds by Follow-up Assessment Type Our findings indicate the need for one of three more detailed assessments at a number of
crossings. These detailed assessments include: remediation design assessments; detailed fish
passage assessments; and upstream fish habitat assessments. In addition, the overview
assessment remains outstanding at several crossings within the study area watersheds.
A total of four crossings that presented a full migration barrier in high probability of fish
capture streams were identified for a remediation design assessment (Table 25). Restoring fish
passage at these four crossings would provide access to a total of 6.2 km of high probability fish
capture stream.
Table 25. All remediation candidate sites in the Monitoring Watersheds.
Inspection Km of High Probability of Barrier Crossing # Year Watershed Fish Capture Stream Upstream Status
C20234 2002 Pinto 3.9 Full C20218 2002 Pinto 1.1 Full C99127 1999 Erith 0.8 Full C20083 2000 Pinto 0.4 Full
Foothills Model Forest 29
Overview Assessment of Fish Passage at Stream Crossings in Selected Watersheds
A total of 18 crossings that presented a potential partial barrier in high probability of fish
capture streams were identified for a detailed fish passage assessment (Table 26). Priority for
these assessments should be based on the length of high probability fish capture stream located
upstream from each crossing.
Table 26. All detailed fish passage assessment sites in the Monitoring Watersheds.
Inspection Km of High Probability of Barrier Crossing # Year Watershed Fish Capture Stream Upstream Status
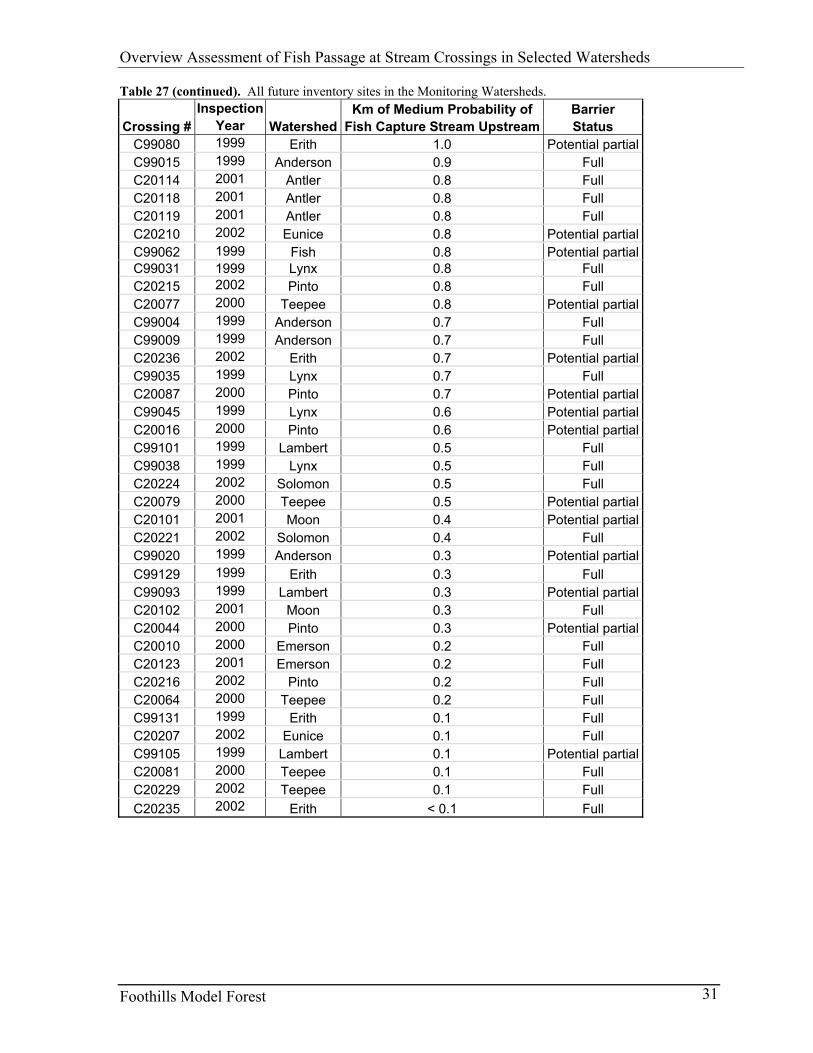
A total of 49 crossings that may present a full or partial barrier in streams with unknown
fish habitat value were identified (Table 27). Inventory priority should be based on the amount
of potential upstream fish habitat.
Table 27. All future inventory sites in the Monitoring Watersheds.
Inspection Km of Medium Probability of Barrier Crossing # Year Watershed Fish Capture Stream Upstream Status
C20203 2002 Anderson 5.7 Full C20222 2002 Solomon 2.9 Full C20225 2002 Solomon 2.4 Full C20104 2001 Moon 2.0 Potential partial C99050 1999 Lynx 1.9 Potential partial C99005 1999 Anderson 1.4 Full C99095 1999 Lambert 1.4 Potential partial C20237 2002 Erith 1.3 Potential partial C99082 1999 Erith 1.2 Potential partial C99047 1999 Lynx 1.2 Potential partial C99011 1999 Anderson 1.0 Full
Foothills Model Forest 30
Overview Assessment of Fish Passage at Stream Crossings in Selected Watersheds
Table 27 (continued). All future inventory sites in the Monitoring Watersheds. Inspection Km of Medium Probability of Barrier
Crossing # Year Watershed Fish Capture Stream Upstream Status C99080 1999 Erith 1.0 Potential partial C99015 1999 Anderson 0.9 Full C20114 2001 Antler 0.8 Full C20118 2001 Antler 0.8 Full C20119 2001 Antler 0.8 Full C20210 2002 Eunice 0.8 Potential partial C99062 1999 Fish 0.8 Potential partial C99031 1999 Lynx 0.8 Full C20215 2002 Pinto 0.8 Full C20077 2000 Teepee 0.8 Potential partial C99004 1999 Anderson 0.7 Full C99009 1999 Anderson 0.7 Full C20236 2002 Erith 0.7 Potential partial C99035 1999 Lynx 0.7 Full C20087 2000 Pinto 0.7 Potential partial C99045 1999 Lynx 0.6 Potential partial C20016 2000 Pinto 0.6 Potential partial C99101 1999 Lambert 0.5 Full C99038 1999 Lynx 0.5 Full C20224 2002 Solomon 0.5 Full C20079 2000 Teepee 0.5 Potential partial C20101 2001 Moon 0.4 Potential partial C20221 2002 Solomon 0.4 Full C99020 1999 Anderson 0.3 Potential partial C99129 1999 Erith 0.3 Full C99093 1999 Lambert 0.3 Potential partial C20102 2001 Moon 0.3 Full C20044 2000 Pinto 0.3 Potential partial C20010 2000 Emerson 0.2 Full C20123 2001 Emerson 0.2 Full C20216 2002 Pinto 0.2 Full C20064 2000 Teepee 0.2 Full C99131 1999 Erith 0.1 Full C20207 2002 Eunice 0.1 Full C99105 1999 Lambert 0.1 Potential partial C20081 2000 Teepee 0.1 Full C20229 2002 Teepee 0.1 Full C20235 2002 Erith < 0.1 Full
Foothills Model Forest 31
Overview Assessment of Fish Passage at Stream Crossings in Selected Watersheds
Four sites within the study area were not assessed or had insufficient data collected
(Table 28). These sites cannot be assessed without a complete overview crossing assessment.
Table 28. Sites that require completion of overview assessment.
Inventory Barrier Crossing # Year Watershed Status
C20062 2000 Teepee Not AssessedC20103 2001 Moon Not AssessedC20140 2001 Erith Not AssessedC20088 2000 Pinto Not Assessed
5. Recommendations 5.1 Communication of Findings to LOC Holders
The actual undertaking of detailed assessments is ultimately the responsibility of the
crossing owner, therefore additional work is required to identify the License of Occupation
(LOC) holder or responsible agency for each crossing that requires additional study. Once the
LOC holders are identified, they can be provided with the information contained within this
report, at which time they could consider how to incorporate our recommendations into their
infrastructure maintenance process. As of March, 2003, Weldwood noted that findings from this
assessment for individual culverts would be utilized in their culvert remediation and road
maintenance activities.
5.2 Development of a Protocol for Completing Detailed Fish Passage Assessment for
Restoration Purposes
Like almost all management activities, the task of restoring fish habitat at stream
crossings involves establishing priorities based on measurable benefits. With limited resources,
a focused approach that provides the greatest short and long term benefits to our fish and fish
habitat resources is required. At all new crossings, current policy requires that in all fish bearing
streams, all life stages of all species are permitted upstream migration. However, this approach
is not well suited for establishing remediation priorities. Therefore, a system for rating the
degree that an existing crossing may impede migration may be worth considering. Such a
system may require consideration of culvert hydraulics, seasonal stream discharge and peak
flows, as well as fish life history and swimming capability information. Ultimately, the costs of
developing such a protocol compared to crossing replacement of removal value should be
considered by the crossing owner.
Foothills Model Forest 32
Overview Assessment of Fish Passage at Stream Crossings in Selected Watersheds
5.3 Identification of Future Roles of the Foothills Model Forest
1. Over the long-term, the Foothills Model Forest hopes to facilitate the restoration of
fish passage at all crossings on fish bearing streams.
2. As a follow-up to this assessment, the Foothills Model Forest could work with those
agencies responsible for stream crossings in the study area to explore options for proceeding with
the remediation process.
Foothills Model Forest 33
Overview Assessment of Fish Passage at Stream Crossings in Selected Watersheds
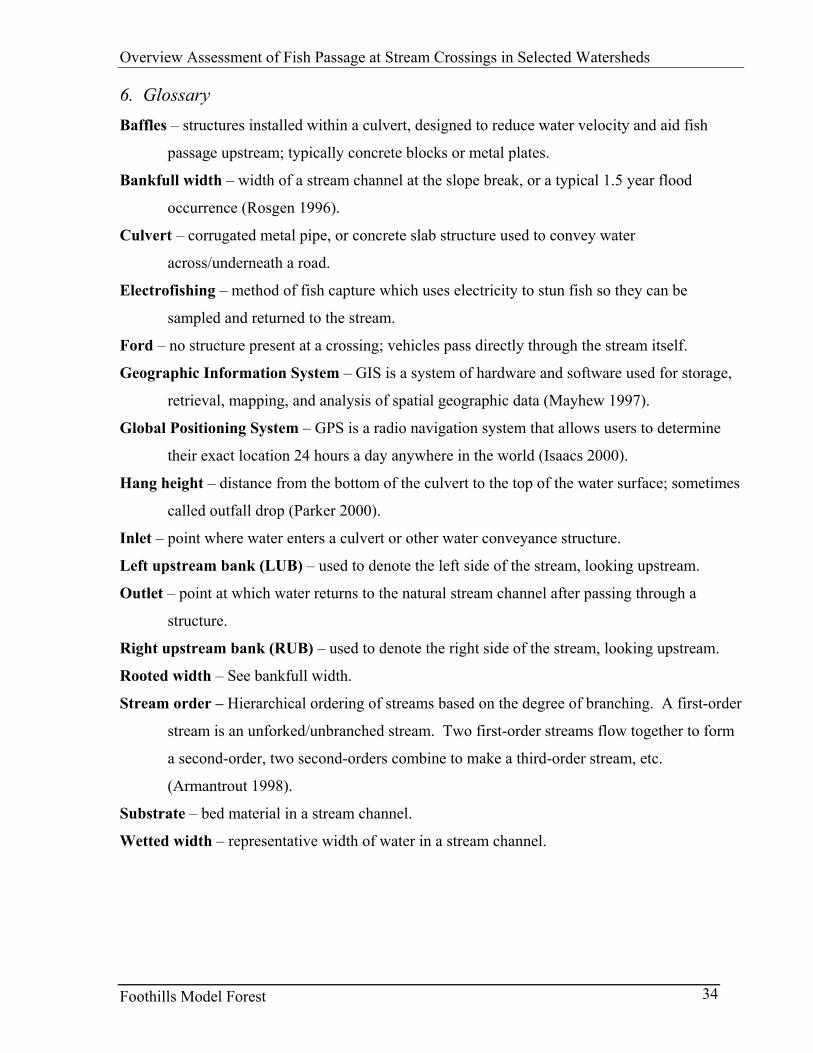
6. Glossary Baffles – structures installed within a culvert, designed to reduce water velocity and aid fish
passage upstream; typically concrete blocks or metal plates.
Bankfull width – width of a stream channel at the slope break, or a typical 1.5 year flood
occurrence (Rosgen 1996).
Culvert – corrugated metal pipe, or concrete slab structure used to convey water
across/underneath a road.
Electrofishing – method of fish capture which uses electricity to stun fish so they can be
sampled and returned to the stream.
Ford – no structure present at a crossing; vehicles pass directly through the stream itself.
Geographic Information System – GIS is a system of hardware and software used for storage,
retrieval, mapping, and analysis of spatial geographic data (Mayhew 1997).
Global Positioning System – GPS is a radio navigation system that allows users to determine
their exact location 24 hours a day anywhere in the world (Isaacs 2000).
Hang height – distance from the bottom of the culvert to the top of the water surface; sometimes
called outfall drop (Parker 2000).
Inlet – point where water enters a culvert or other water conveyance structure.
Left upstream bank (LUB) – used to denote the left side of the stream, looking upstream.
Outlet – point at which water returns to the natural stream channel after passing through a
structure.
Right upstream bank (RUB) – used to denote the right side of the stream, looking upstream.
Rooted width – See bankfull width.
Stream order – Hierarchical ordering of streams based on the degree of branching. A first-order
stream is an unforked/unbranched stream. Two first-order streams flow together to form
a second-order, two second-orders combine to make a third-order stream, etc.
(Armantrout 1998).
Substrate – bed material in a stream channel.
Wetted width – representative width of water in a stream channel.
Foothills Model Forest 34
Overview Assessment of Fish Passage at Stream Crossings in Selected Watersheds
7. Literature Cited Alberta Government. 2001. Administrative Guide for Approvals to Protect Surface Water Bodies
under the Water Act. Environmental Assurance, Regulatory Assurance Division. Armantrout, N.B., compiler. 1998. Glossary of aquatic habitat inventory terminology.
American Fisheries Society, Bethesda, Maryland. Fisheries Act. 1985. Fisheries Act, Federal Statutes Chapter F-14. Fisheries and Oceans Canada. 1991. Policy for the Management of Fish Habitat.
Communications Directorate, Department of Fisheries and Oceans. Ottawa, Ontario. FMF (Foothills Model Forest). 1999. 1999 Fish and stream inventory-site summaries. Prepared
for the ACA, Weldwood of Canada (Hinton Division), and the NRS. FMF, Hinton, Alberta.
FMF (Foothills Model Forest). 2000. 2000 Fish and stream inventory-site summaries. Prepared
for the ACA, Weldwood of Canada (Hinton Division), and the NRS. FMF, Hinton, Alberta.
FMF (Foothills Model Forest). 2001. 2001 Fish and stream inventory-site summaries. Prepared
for the ACA, Weldwood of Canada (Hinton Division), and the NRS. FMF, Hinton, Alberta.
FMF (Foothills Model Forest). 2002. 2002 Fish and stream inventory-site summaries. Prepared
for the ACA, Weldwood of Canada (Hinton Division), and the NRS. FMF, Hinton, Alberta.
Isaacs, A., ed. 2000. The Macmillan encyclopedia 2001. Market House Books Ltd. 1400pp. Katopodis, C. 1994. Analysis of icthyomechanical data for fish passage or exclusion system
design, in American Fisheries Society and Fish Physiology Association symposium proceedings, pp 318-323. Department of Fisheries and Oceans, Winnipeg, Manitoba.
Love, M. and S. Firor. 2001. FishXing v2.2 (software). Available Online @ http://
www.stream.fs.fed.us/fishxing/ Last visited 10/18/02. Mayhew, S., ed. 1997. A dictionary of geography. Oxford University Press, England. 451pp. Parker, M.A. 2000. Fish passage – culvert inspection procedures; in Watershed Restoration
Technical Circular no. 11. Ministry of Environment, Lands and Parks, Vancouver, British Columbia.
Rosgen, D. 1996. Applied river morphology. Wildland Hydrology, Pagosa Springs, Colorado. Whyte, I.W., S. Babakaiff, M.A. Adams, and P.A. Giroux. 1997. Restoring fish access and
rehabilitation of spawning sites. Chapter 5 in Watershed Restoration Technical Circular no. 9. Ministry of Environment, Lands and Parks, Vancouver, British Columbia.