40
March 2015 Franklin Templeton Investments Monthly Fact Sheet
| Date post: | 18-Jul-2015 |
| Category: |
Economy & Finance |
| Upload: | association-of-masonic-arts-vausa |
| View: | 82 times |
| Download: | 1 times |

March 2015
Franklin Templeton Investments
Monthly Fact Sheet

ContentsMarket Update . . . . . . . . . . . . . . . . . . . . . . . . . . . . . . . . . . . . . . . . . . . . . . . . . . . . . . . . . . . . . . . . . . . . . . . . . . . . . . . . . . . . . . . . . . . 3
EQUITY
HYBRID
INCOME & LIQUID
Franklin India Bluechip Fund (FIBCF) . . . . . . . . . . . . . . . . . . . . . . . . . . . . . . . . . . . . . . . . . . . . . . . . . . . . . . . . . . . . . . . . . . . . . 5
Templeton India Growth Fund (TIGF). . . . . . . . . . . . . . . . . . . . . . . . . . . . . . . . . . . . . . . . . . . . . . . . . . . . . . . . . . . . . . . . . . . . . . 6
Franklin India Prima Plus (FIPP) . . . . . . . . . . . . . . . . . . . . . . . . . . . . . . . . . . . . . . . . . . . . . . . . . . . . . . . . . . . . . . . . . . . . . . . . . 7
Franklin India Prima Fund (FIPF) . . . . . . . . . . . . . . . . . . . . . . . . . . . . . . . . . . . . . . . . . . . . . . . . . . . . . . . . . . . . . . . . . . . . . . . . . 8
Franklin India Flexi Cap Fund (FIFCF) . . . . . . . . . . . . . . . . . . . . . . . . . . . . . . . . . . . . . . . . . . . . . . . . . . . . . . . . . . . . . . . . . . . . . 9
Franklin India High Growth Companies Fund (FIHGCF) . . . . . . . . . . . . . . . . . . . . . . . . . . . . . . . . . . . . . . . . . . . . . . . . . . . . . . . 10
Franklin Asian Equity Fund (FAEF) . . . . . . . . . . . . . . . . . . . . . . . . . . . . . . . . . . . . . . . . . . . . . . . . . . . . . . . . . . . . . . . . . . . . . . 11
Franklin India Opportunities Fund (FIOF) . . . . . . . . . . . . . . . . . . . . . . . . . . . . . . . . . . . . . . . . . . . . . . . . . . . . . . . . . . . . . . . . . 12
Franklin Build India Fund (FBIF) . . . . . . . . . . . . . . . . . . . . . . . . . . . . . . . . . . . . . . . . . . . . . . . . . . . . . . . . . . . . . . . . . . . . . . . . 12
Templeton India Equity Income Fund (TIEIF) . . . . . . . . . . . . . . . . . . . . . . . . . . . . . . . . . . . . . . . . . . . . . . . . . . . . . . . . . . . . . . 13
Franklin India Taxshield (FIT) . . . . . . . . . . . . . . . . . . . . . . . . . . . . . . . . . . . . . . . . . . . . . . . . . . . . . . . . . . . . . . . . . . . . . . . . . . 14
Franklin India Smaller Companies Fund (FISCF) . . . . . . . . . . . . . . . . . . . . . . . . . . . . . . . . . . . . . . . . . . . . . . . . . . . . . . . . . . . . 15
Franklin India Index Fund - NSE Nifty Plan (FIIF) . . . . . . . . . . . . . . . . . . . . . . . . . . . . . . . . . . . . . . . . . . . . . . . . . . . . . . . . . . . 16
Franklin Infotech Fund (FIF) . . . . . . . . . . . . . . . . . . . . . . . . . . . . . . . . . . . . . . . . . . . . . . . . . . . . . . . . . . . . . . . . . . . . . . . . . . . 16
Franklin India Feeder - Franklin U.S. Opportunities Fund (FIF-FUSOF) . . . . . . . . . . . . . . . . . . . . . . . . . . . . . . . . . . . . . . . . . . . 17
Franklin India Feeder - Franklin European Growth Fund (FIF-FEGF) . . . . . . . . . . . . . . . . . . . . . . . . . . . . . . . . . . . . . . . . . . . . . . 17
Franklin India Dynamic PE Ratio Fund of Funds (FIDPEF) . . . . . . . . . . . . . . . . . . . . . . . . . . . . . . . . . . . . . . . . . . . . . . . . . . . . . 18
Franklin India Multi – Asset Solution Fund (FIMAS). . . . . . . . . . . . . . . . . . . . . . . . . . . . . . . . . . . . . . . . . . . . . . . . . . . . . . . . . 18
Franklin India Life Stage Fund of Funds (FILSF) . . . . . . . . . . . . . . . . . . . . . . . . . . . . . . . . . . . . . . . . . . . . . . . . . . . . . . . . . . . . 19
Franklin India Balanced Fund (FIBF) . . . . . . . . . . . . . . . . . . . . . . . . . . . . . . . . . . . . . . . . . . . . . . . . . . . . . . . . . . . . . . . . . . . . . 19
Franklin India Pension Plan (FIPEP) . . . . . . . . . . . . . . . . . . . . . . . . . . . . . . . . . . . . . . . . . . . . . . . . . . . . . . . . . . . . . . . . . . . . . 20
Franklin India Monthly Income Plan (FIMIP) . . . . . . . . . . . . . . . . . . . . . . . . . . . . . . . . . . . . . . . . . . . . . . . . . . . . . . . . . . . . . . . 21
Franklin India Corporate Bond Opportunities Fund (FICBOF) . . . . . . . . . . . . . . . . . . . . . . . . . . . . . . . . . . . . . . . . . . . . . . . . . . 22
Franklin India Income Opportunities Fund (FIIOF) . . . . . . . . . . . . . . . . . . . . . . . . . . . . . . . . . . . . . . . . . . . . . . . . . . . . . . . . . . . 23
Franklin India Dynamic Accrual Fund (FIDA)
(Fund name change w.e.f. 01 December 2014, Erstwhile Franklin India Income Fund ) . . . . . . . . . . . . . . . . . . . . . . . . . . . . . . 24
Franklin India Treasury Management Account (FITMA) . . . . . . . . . . . . . . . . . . . . . . . . . . . . . . . . . . . . . . . . . . . . . . . . . . . . . . 24
Franklin India Income Builder Account (FIIBA) . . . . . . . . . . . . . . . . . . . . . . . . . . . . . . . . . . . . . . . . . . . . . . . . . . . . . . . . . . . . . 25
Franklin India Ultra Short Bond Fund (FIUBF) . . . . . . . . . . . . . . . . . . . . . . . . . . . . . . . . . . . . . . . . . . . . . . . . . . . . . . . . . . . . . . 25
Franklin India Government Securities Fund (FIGSF) . . . . . . . . . . . . . . . . . . . . . . . . . . . . . . . . . . . . . . . . . . . . . . . . . . . . . . . . . 26
Franklin India Banking & PSU Debt Fund (FIBPDF) . . . . . . . . . . . . . . . . . . . . . . . . . . . . . . . . . . . . . . . . . . . . . . . . . . . . . . . . . . 26
Franklin India Short Term Income Plan (FISTIP) . . . . . . . . . . . . . . . . . . . . . . . . . . . . . . . . . . . . . . . . . . . . . . . . . . . . . . . . . . . . 27
Franklin India Savings Plus Fund (FISPF) . . . . . . . . . . . . . . . . . . . . . . . . . . . . . . . . . . . . . . . . . . . . . . . . . . . . . . . . . . . . . . . . . 28
Franklin India Low Duration Fund (FILDF) . . . . . . . . . . . . . . . . . . . . . . . . . . . . . . . . . . . . . . . . . . . . . . . . . . . . . . . . . . . . . . . . . 28
Annexure . . . . . . . . . . . . . . . . . . . . . . . . . . . . . . . . . . . . . . . . . . . . . . . . . . . . . . . . . . . . . . . . . . . . . . . . . . . . . . . . . . . . . . . . . 29
Scheme Performance. . . . . . . . . . . . . . . . . . . . . . . . . . . . . . . . . . . . . . . . . . . . . . . . . . . . . . . . . . . . . . . . . . . . . . . . . . . . . 29
SIP Returns. . . . . . . . . . . . . . . . . . . . . . . . . . . . . . . . . . . . . . . . . . . . . . . . . . . . . . . . . . . . . . . . . . . . . . . . . . . . . . . . . . . . . 35
Dividend/Bonus History/Fund Managers Industry Experience . . . . . . . . . . . . . . . . . . . . . . . . . . . . . . . . . . . . . . . . . . . . . 39
2Franklin Templeton Investmentswww.franklintempletonindia.com

Equity Market Snap Shot
Anand Radhakrishnan, CIO – Franklin Equity
Global
INDIAIndian equity markets began 2015 on a strong note (up ~6% and ~1% in Jan and Feb
respectively), but ended the quarter with moderate gains. The uptrend in first two
months was led by improvement in macroeconomic variables, an out of policy 'surprise
rate cut' in January and expectations of significant reforms in budget. However, geo-
political tensions coupled with expectations of subdued earnings results for 4QFY15
weighed on the markets and led to monthly losses in March. Sectors like pharma, capital
goods and technology topped the charts, registering substantial gains. Healthcare stocks
gained as investors preferred taking defensive bets. Capital goods sector benefitted as
some key players bagged large sized project awards, indicating improvement in business
sentiment. While metal stocks underperformed due to fragile global metal prices,
sustained weakness in crude oil prices along with weak quarterly results (due to subsidy
burden) reported by some of the key players weighed on stocks in oil & gas sector.
Banking stocks showed a clear divergence in performance. Asset quality concerns
regarding most of the PSU banks and concerns on unseasonal rains, its subsequent
impact on the inflation impacted stocks in that space. FII flows into Indian equities
were robust at a net $6.0 bn during the quarter.
Macro/Policy: India's Balance of Payments (BoP) recorded a net accretion of $13.2 bn
to India's foreign exchange reserves in 3QFY15, almost double the accretion in the
preceding quarter. Current Account Deficit (CAD) for 3QFY15 came in at 1.6% of
GDP lower than 2% of GDP for 2QFY15, mainly due to improvement in net invisibles
i.e. improvement in net earnings through travel and software services, and lower net
outflows under primary income viz. profit, dividend and interest. The trade data for February showed that India's trade deficit fell to a 17 month low,
primarily due to decline in oil imports. Trade deficit for February stood at $6.85 bn.
Though exports fell and stood at $21.54 bn, the imports registered a sharper decline and
stood at $28.39 bn. However, the trade deficit for Apr '14-Feb '15 at $125.22 bn was
higher than $124.84 bn for corresponding period last year.
On the economic front, the new GDP series based on 'market prices' suggested higher
economic growth in recent years, primarily due to a more recent base and much wider
coverage. The improvement was driven largely by efficiency gains due to higher value
added in manufacturing which was not being captured by the old series. Nominal GDP,
however, remained unchanged. Meanwhile, India's Index of Industrial Production (IIP)
continued in the positive territory and grew by 2.6% in January. While manufacturing
(with weightage of 75.5%) and electricity expanded by 3.3% and 2.7% respectively,
mining contracted by 2.8%. The cumulative growth for Apr '14-Jan '15 came in at 2.5%
as against 0.1% growth in the same period last year.
RBI did two out of policy rate cuts of 25 bps each during the quarter: one in January and
one post the Union Budget. While continued moderation in inflation was the reason for
3
January rate cut; Union Budget and agreement on the monetary policy framework
appeared to be the triggers for the second rate cut.
The first 'full' budget presented by the government was perceived to be progressive and
balanced by market participants. Though it extended the fiscal consolidation roadmap
to 3 years from 2 years, yet this came with an effort to raise investment spend. Other
incentives included staggered rate cut for corporates, merging of FDI/FII ownership
limit and some minor tax breaks for individual investors. Further, clarity was given on
GST and GAAR and there was significant emphasis on the socio-economic programs.
Towards the end of the quarter three key reform bills viz. insurance, coal mines and
mines & mineral regulation were passed by the parliament. The government also
completed a very successful telecom spectrum auction where they garnered $17.5bn.
OUTLOOKIndian equity markets have benefitted from the build-up of 'optimism' and some meaningful steps taken by the government in last few quarters. However, lack of any significant 'on ground action' along with expectations of muted corporate earnings growth for FY15 could limit the positive sentiment in near term. RBI in its first bi-monthly policy for FY16 maintained 'status quo'; however, it indicated that transmission of its front-loaded rate cuts is yet to happen. Hence, any further softening of interest rates is likely to be contingent on banks passing on rate cuts to the end consumers.
Government capex which had seen pick up in the previous quarters declined in quarter ending Mar '14 on the back of anticipated decline in government spending towards the fiscal year-end to meet fiscal targets. However, given government's thrust on infrastructure, union budget highlighted measures to provide impetus to this sector; we believe the same is likely to improve in coming quarters.
Corporate earnings are likely to be subdued for FY15 as 3QFY15 earnings have been disappointing and there are muted expectations for 4QFY15 earnings. However, we believe that post transmission of interest rate cuts; we could see improvement in corporate health and subsequently its trickle-down effect in earnings growth towards the second half of FY16.
While earlier than expected rise in interest rates by Fed, spike in crude oil prices, slowdown in rural demand and an uptick in inflation (due to unseasonal rains, impact is yet to be seen) could limit the upside, any positive cues on corporate earnings growth, further recovery in economic growth and progress on GST & land acquisition bill could bode well for market movement in near to medium term. With markets trading at valuations higher than the long term average, some consolidation could happen. Moreover, we believe that valuations have run ahead of fundamentals with respect to certain sector/stocks. Hence, it is important to focus on companies with good fundamentals, strong cash flows with reasonable visibility of earnings. We believe that though returns in the current year could be tempered as compared to last year, long term growth prospects remain attractive. At this stage, investors could consider systematic equity participation in diversified equity funds with a large cap bias.
Chetan Sehgal, CIO - India, Emerging MarketsOver the past 6 months there has been a remarkable adjustment in currencies driven
by macroeconomic factors, commodity prices, expectations of interest rates and a
host of other factors. During that period we had seen a lot of decoupling occur and
the stock markets were driven by individual country company dynamics, as some of
these were not forecasted prior to the events. It is interesting to note that in some
markets the devaluation has been taken as a positive, whereas in others the markets
have reacted negatively. However, now it appears that the markets have got adjusted
to a new normal. To that extent one should expect more coupling and in some ways
some sort of mean reversion till another piece of event which is not forecasted
occurs. The strength in the Indian currency is not unreasonable even though many
argue it hurts export competitiveness. If the current account is counterbalanced and
contained by lower energy prices then India has the ability to improve its growth
trajectory by taking advantage of a cheaper commodity prices. The strength of the
US economy may also get mitigated with the strength in the Dollar and thus the
interest rates increases may still take more time to materialize.
Franklin Templeton Investmentswww.franklintempletonindia.com
Most of the global equity markets registered decent quarterly gains. The emerging
markets marginally outperformed their developed market peers with MSCI EM Index
and MSCI AC World Index recording quarterly gains of 1.9% and 1.8% respectively.
German equity market was the top performer on account of European Central Bank's
quantitative easing and significant depreciation in Euro (Germany's Xetra DAX closed
the quarter with gains of 22%). Chinese equity market also recorded strong gains on
hopes of further monetary easing measures to prop up the Chinese economy.
Reuters/Jefferies CRB Index emerged as the worst performer falling 8%, due to
weakening outlook for global commodities. US markets remained flat during the
quarter.
Crude prices saw a spike due to news regarding supply outages and airstrikes in Yemen
(raising concerns regarding crude supplies). However, anticipation of increase in crude
supplies amidst talks for a potential nuclear deal in Iran towards the end of quarter led
to slide in crude prices. Gold prices which strengthened in the beginning of quarter
due to geopolitical tensions, finally weakened on account of stronger dollar towards the
end of quarter, recording marginal quarterly loss.
Quarterly Change (%) Quarterly Change (%)
MSCI AC World Index 1.83
FTSE Eurotop 100 15.15
MSCI AC Asia Pacific 6.12
Dow Jones -0.26
Nasdaq 3.48
S&P 500 0.44
Xetra DAX 22.03
CAC 40 17.81
FTSE 100 3.15
Hang Seng 5.49
Nikkei 10.06
KOSPI 6.55
Quarterly Change (%)
Templeton Equity View : After the Currency Adjustment
S&P BSE Sensex 1.67
CNX Nifty 2.51
CNX 500 3.02
CNX Midcap 3.32
S&P BSE Smallcap -1.77

Fixed Income Market Snap ShotSantosh Kamath, CIO - Fixed Income
Globally, bond yields eased during the quarter, helped by monetary easing by central banks, and on the back of economic growth concerns in the Eurozone and in other countries like Japan, China and Russia. In January, the European Central Bank (ECB) unveiled a massive quantitative easing program aggregating to around 1 trillion euros, with monthly purchases of 60 billion euros of sovereign debt every month from March 2015 to September 2016. A number of other central banks around the world also followed with their own monetary easing. The US Fed dropped the word “patient” from its March FOMC meeting statement. However, it mentioned in the statement that even though inflation and employment are near mandate-consistent levels, economic conditions may for some time warrant keeping the target fed funds rate below levels the Committee views as normal in the longer run. The market interpreted this to mean that the Fed may wait for economic growth/activity to also pick-up, before starting to normalize rates. The 10 year US treasury yield and 10 year German bond yield finally closed the quarter down 25 bps and 38 bps respectively. In the currencies space, the US dollar continued to garner strength, with the US dollar index gaining a hefty 9% during the quarter.
In India too bond yields fell during the quarter, helped by change in monetary policy stance and rate-cuts by the RBI, softening crude oil prices, and strong foreign portfolio inflows. In the Union Budget FY16 announced at the end of February, the government outlined some changes to the fiscal consolidation roadmap, stating that the 3% fiscal deficit target would now be achieved by FY18, instead of by FY17, as earlier. The RBI announced two inter-meeting policy rate cuts aggregating to 50 bps during the quarter, and also signed a monetary policy framework with the government, which will help to formalize the inflation targeting regime in India. Post the close of the quarter, the RBI left policy rates unchanged in its bi-monthly policy review on April 7, 2015. The central bank said that future monetary policy action would depend on transmission of the earlier rate cuts by banks to lending rates, movement in food prices especially, strength of monsoons, supply side factors, and signs of normalization of the US monetary policy. Foreign portfolio inflows into the debt markets continued to be healthy, and came in at a net $ 6.9 bn during the quarter.
Domestic Market Scenario
Yields: Bond yields fell across the curve during the quarter. The 1-year gilt yield closed the quarter down 40 bps. At the longer end, the 10 year and 30-year gilt yields closed the quarter down 15 bps and 16 bps respectively. The 5-year AAA corporate bond yield also closed the quarter down 25 bps.
Forex: Despite the global strength in the dollar, the rupee continued to remain resilient compared to other peer emerging market currencies during the quarter. The rupee was up almost 1% versus the US dollar, and up a robust 14% against the euro during the quarter. Continuing healthy foreign portfolio inflows and improving macro-economic fundamentals helped to support the rupee.
Liquidity: Liquidity conditions remained broadly comfortable during the quarter, but tightened a bit in March due to seasonal factors like advance tax outflows and fiscal year closing. The overnight call money rate finally closed the quarter at 9.50%, compared to last quarter's close of 9.00%. During the quarter, there was an average daily net injection of Rs. 165.31 bn by the RBI as part of its liquidity operations, compared to an average daily net injection of Rs. 136.90 bn in the previous quarter.
Macro: Inflation trend continued to be benign, with Consumer price index (CPI) headline inflation rising marginally to 5.2%YoY in February 2015 compared to previous month's CPI inflation print of 5.4%YoY. On sequential terms, the index was flat at 0.2%MoM in February 2015. Meanwhile, Wholesale price index (WPI) inflation surprised positively and dropped further to -2.0%YoY in February 2015 compared to -0.4%YoY in the previous month.
Data released at the end of March showed that fiscal deficit for the first eleven months of FY15 (April – February 2015) stands at 114.3% of the full year target. The deficit was 97.4% of the estimate in the corresponding period in the previous fiscal year. Although the fiscal deficit has already
4Franklin Templeton Investmentswww.franklintempletonindia.com
10 Year Gilt
Call rates
Exchange rate (Rs./$)
31-Dec-14
7.94
8.95/9.00%
63.03/04
31-Mar-15
7.79
9.00/9.50%
62.4950/5050
breached the target for the full year, the month of March usually improves things, as there is a rise in tax collections and also a cut in expenditure. Besides that, the recent telecom spectrum auctions are also expected to boost revenues for the government. The government had earlier committed to meet the FY15 fiscal deficit target of 4.1% during the Union Budget.
OUTLOOK
The RBI has said in its April 7 policy review that future monetary policy action would be dependent on data, monetary transmission and also Fed's future course of action. The inflation genie is presently in the bottle, but the 4% (with band of +/-2%) inflation targeting regime in the coming fiscal years will prompt the central bank to be stringent in tracking its progress, and this may even reduce the elbow room for monetary easing to some extent. That being said, we expect the RBI to further ease policy rates during the course of the year, although it may wait and watch for some time to see the lagged impact of last two rate cuts.
Yields have continued to trend down this year on the back of benign inflationary trends, global monetary easing, and a stable rupee. However, the key risk that lies is action by the Fed, and how it plays through the currency route. The rupee has been resilient so far, but the hike in Fed rate (when it eventually happens), may once again lead to some volatility in emerging market currencies and also the rupee. This in turn may have some collateral impact on the bond markets as well.
We have also seen large foreign inflows into the debt markets over the past year, with them outstripping the flows in the equity markets during this period. Therefore, considering the copious volume of foreign inflows, any disruption or reversal of flows in the short term can once again lead to volatility in the bond markets, and put pressure on the currency as well. However, India now appears to be in a much better place to deal with the possible Fed rate hikes, than in mid-2013, when the Fed taper concerns had ignited.
The credit environment is also improving, making it more conducive for Indian companies to raise capital. With the equity markets also faring well, companies are now finding it easier to raise capital through other means, and thereby reduce their leverage or debt component. We also think that the cash flow at Indian companies will improve, and that along with selling of assets and raising of equity, have ensured that the overall credit risk within the system has decreased.
This has further increased our conviction on corporate bonds, and therefore we continue to be positive on accrual strategies. Duration strategies also continue to be favourably placed with interest rates poised to come down gradually over time. However, investors should note that although we expect bond yields to soften over time, the next leg maybe a bit more muted than the sharp fall in yields we have witnessed since September-last year.

5
Franklin India Bluechip Fund FIBCF
INVESTMENT STYLE
TYPE OF SCHEME / INVESTMENT OBJECTIVE
DATE OF ALLOTMENT
December 1, 1993
FUND MANAGER
Anand Radhakrishnan &
Anand Vasudevan
FUND SIZE
` 6178.37 crores
TURNOVER
Portfolio Turnover 37.74%
VOLATILITY MEASURES (3 YEARS)Standard Deviation 4.10R-squared 0.85Beta 0.96Sharpe Ratio* 0.74
* Annualised. Risk-free rate assumed to be 8.08% (based on average of 3 month T-BillRate “during last 3 months”)
#EXPENSE RATIO : 2.21%#EXPENSE RATIO (DIRECT) : 1.33%
MINIMUM INVESTMENT/MULTIPLES FOR NEW INVESTORS
` 5000/1
ADDITIONAL INVESTMENT/MULTIPLES FOR EXISTING INVESTORS
` 1000/1
LOAD STRUCTURE
ENTRY LOAD NilEXIT LOAD In respect of each purchase of Units - 1% if the Units are redeemed/switched-out within one year of allotment
PORTFOLIO
Company Name No. ofshares
Market Value` Lakhs
% ofassets
Company Name No. ofshares
Market Value` Lakhs
% ofassets
1 Year 3 Year 5 Year 7 Year 10 Year Since jan 97
Past performance may or may not be sustained in the future. Returns greater than 1 year period are compounded annualized. Dividends are assumed to be reinvested and
bonus is adjusted. Load is not taken in to consideration. For SIP returns, monthly investment of equal amounts invested on the 1st day of every month has been considered.
For scheme performance refer pages 29-36.
*B: Benchmark, AB: Additional Benchmark
Sector Allocation - Total Assets Product Label
This product is suitable for investors who are seeking*
•Long term capital appreciation
•A fund that invests in large cap stocks
* Investors should consult their financial advisers if in doubtabout whether the product is suitable for them.
**Please refer back cover for Product Label Guidelines
(BROWN)HIGH RISK**
* Top 10 holdings
SIP - If you had invested 5000 every month in FIBCF ... `
As on March 31, 2015
Total Equity Holding
Total Debt Holding
Call, Cash and other current asset
Total Asset
577917.10
0.00
39919.92
617837.02
93.54
0.00
6.46
100.00
An open-end growth scheme with anobjective primarily to provide medium tolong-term capital appreciation.
The fund manager seeks steady andconsistent growth by focusing on wellest-ablished, large size companies
NAV
Growth PlanDividend PlanDirect - Growth PlanDirect - Dividend Plan
Franklin Templeton Investmentswww.franklintempletonindia.com
Auto
Mahindra & Mahindra Ltd 1040000 12353.12 2.00
Hero Motocorp Ltd 430000 11351.14 1.84
Tata Motors Ltd 1950000 10728.90 1.74
Bajaj Auto Ltd 370000 7461.42 1.21
Tata Motors Ltd 900000 2983.95 0.48
Auto Ancillaries
Exide Industries Ltd 3300000 5865.75 0.95
Banks
HDFC Bank Ltd* 4550000 46532.85 7.53
ICICI Bank Ltd* 10800000 34074.00 5.52
Indusind Bank Ltd* 3200000 28352.00 4.59
Yes Bank Ltd* 2840600 23172.19 3.75
Kotak Mahindra Bank Ltd* 1550000 20355.38 3.29
Axis Bank Ltd 2500000 14005.00 2.27
Bank Of Baroda 4000000 6540.00 1.06
Punjab National Bank Ltd 4000000 5776.00 0.93
Cement
Grasim Industries Ltd 370000 13402.70 2.17
ACC Ltd 830000 12970.83 2.10
Ultratech Cement Ltd 280000 8058.12 1.30
Construction Project
Larsen And Toubro Ltd* 1200000 20635.80 3.34
Consumer Non Durables
Marico Ltd 3550000 13694.13 2.22
Asian Paints Ltd 1100000 8924.30 1.44
ITC Ltd 2000000 6517.00 1.05
Ferrous Metals
Jindal Steel & Power Ltd 1500000 2352.00 0.38
Tata Steel Ltd 500000 1583.75 0.26
Industrial Products
Cummins India Ltd 1300000 11448.45 1.85
Minerals/Mining
Coal India Ltd 2000000 7258.00 1.17
Oil
` 355.4964` 41.6461
` 361.8550` 42.5133
Total Amount Invested (Rs.) 60,000 180,000 300,000 420,000 600,000 1,095,000
Total Value as on Mar 31, 2015 (Rs) 68,593 258,007 463,585 781,380 1,381,246 13,195,727
Returns 27.75% 24.90% 17.46% 17.44% 15.92% 23.48%
Total Value of B:S&P BSE Sensex 64,098 240,947 427,226 681,166 1,134,174 4,713,078
B:S&P BSE Sensex Returns 12.98% 19.94% 14.13% 13.58% 12.24% 14.28%
Total Value of AB:CNX Nifty 64,955 243,309 431,690 687,753 1,148,839 4,700,270
AB:CNX Nifty returns 15.75% 20.64% 14.55% 13.85% 12.48% 14.25%
Oil & Natural Gas Corp Ltd 2600000 7965.10 1.29
Petroleum Products
Reliance Industries Ltd 2100000 17346.00 2.81
Bharat Petroleum Corporation Ltd 2000000 16216.00 2.62
Indian Oil Corp Ltd 630268 2323.48 0.38
Pharmaceuticals
Dr Reddy'S Laboratories Ltd* 600000 20932.50 3.39
Cadila Healthcare Ltd 800000 13934.40 2.26
Lupin Ltd 150000 3012.60 0.49
Sun Pharmaceutical Industries Ltd 200000 2047.80 0.33
Power
Torrent Power Ltd 2300000 3761.65 0.61
Power Grid Corp Of India Ltd 2500000 3631.25 0.59
Services
Aditya Birla Nuvo Ltd 410000 6821.99 1.10
Software
Infosys Ltd* 1950000 43257.83 7.00
Cognizant Technology (USA)* 760000 30117.79 4.87
Wipro Ltd 2500000 15721.25 2.54
HCL Technologies Ltd 1100000 10784.40 1.75
Tata Consultancy Services Ltd 400000 10215.80 1.65
Telecom - Services
Bharti Airtel Ltd* 8500000 33430.50 5.41
Total Equity Holding 577917.10 93.54
# The rates specified are the actual average expenses charged for the month of March 2015. The above ratio includes the Service tax on Investment Management Fees. The above ratio also includes, proportionate charge in respect sales beyond T-15 cities subject to maximum of 30 bps on daily net assets, wherever applicable
28.94%
17.82%
7.26%
6.46%
5.81%
5.57%
5.41%
4.72%
3.34%
1.85%
12.81%
BANKS
SOFTWARE
AUTO
PHARMACEUTICALS
PETROLEUM PRODUCTS
CEMENT
TELECOM ‐ SERVICES
CONSUMER NON DURABLES
CONSTRUCTION PROJECT
INDUSTRIAL PRODUCTS
REST

Auto
Maruti Suzuki India Ltd.* 70000 2588.15 4.87
Tata Motors Ltd., A 401365 1330.73 2.50
Auto Ancillaries
Balkrishna Industries Ltd. 80000 519.24 0.98
Banks
ICICI Bank Ltd.* 1600000 5048.00 9.49
HDFC Bank Ltd.* 350000 3579.45 6.73
Federal Bank Ltd.* 2036775 2689.56 5.06
Cement
Grasim Industries Ltd. 50000 1811.18 3.41
JK Cement Ltd. 152398 1015.12 1.91
Chemicals
Tata Chemicals Ltd.* 1877987 8329.81 15.66
Consumer Non Durables
EID Parry India Ltd. 217347 380.68 0.72
Ferrous Metals
MOIL Ltd. 55000 152.13 0.29
Finance
Bajaj Holdings and Investment Ltd.* 518407 6719.85 12.64
Tata Investment Corp. Ltd.* 559785 3206.45 6.03
Sundaram Finance Ltd. 108627 1648.31 3.10
6
Templeton India Growth Fund TIGF
INVESTMENT STYLE
TYPE OF SCHEME / INVESTMENT OBJECTIVE
DATE OF ALLOTMENT
September 10, 1996
FUND MANAGER
Chetan Sehgal
FUND SIZE
` 531.75 crores
TURNOVER
Portfolio Turnover 9.58%
* Annualised. Risk-free rate assumed to be 8.08% (based on average of 3 month T-BillRate “during last 3 months”)
#EXPENSE RATIO : 2.66%#EXPENSE RATIO (DIRECT) : 2.00%
MINIMUM INVESTMENT/MULTIPLES FOR NEW INVESTORS
` 5000/1
ADDITIONAL INVESTMENT/MULTIPLES FOR EXISTING INVESTORS
` 1000/1
LOAD STRUCTURE
ENTRY LOAD NilEXIT LOAD In respect of each purchase of Units - 1% if the Units are redeemed/switched-out within one year of allotment
PORTFOLIO
Company Name No. ofshares
Market Value` Lakhs
% ofassets
Company Name No. ofshares
Market Value` Lakhs
% ofassets
1 Year 3 Year 5 Year 7 Year 10 Year Since Inception
Past performance may or may not be sustained in the future. Returns greater than 1 year period are compounded annualized. Dividends are assumed to be reinvested andbonus is adjusted. Load is not taken in to consideration. For SIP returns, monthly investment of equal amounts invested on the 1st day of every month has been considered. For scheme performance refer pages 29-36.*B: Benchmark, AB: Additional Benchmark
Sector Allocation - Total Assets Product Label
This product is suitable for investors who are seeking*
•Long term capital appreciation
•A fund that invests predominantly in large cap stocks – a value fund
* Investors should consult their financial advisers if in doubtabout whether the product is suitable for them.
**Please refer back cover for Product Label Guidelines
* Top 10 holdings
SIP - If you had invested 5000 every month in TIGF …`
**S&P BSE Sensex #MSCI India Value
Total Equity Holding
Total Debt Holding
Call, Cash and other current asset
Total asset
52333.54
0.00
841.21
53174.75
98.42
0.00
1.58
100.00
As on March 31, 2015
An open-end growth scheme withtheobjective to provide long-term capitalgrowth to its unitholders
Templeton Equity Portfolio Managersadopt a long term disciplined approachto investing and use the widely knownphilosophy of ‘value investing’
NAV
Franklin Templeton Investmentswww.franklintempletonindia.com
(BROWN)HIGH RISK**
Total Amount Invested (Rs.) 60,000 180,000 300,000 420,000 600,000 1,115,000
Total Value as on Mar 31, 2015 (Rs) 66,565 259,117 453,105 752,776 1,332,345 9,537,509
Returns 21.02% 25.22% 16.53% 16.39% 15.25% 20.04%
Total Value of B:S&P BSE Sensex 64,098 240,947 427,226 681,166 1,134,174 4,892,404
B:S&P BSE Sensex Returns 12.98% 19.94% 14.13% 13.58% 12.24% 14.18%
Total Value of B:MSCI India Value 60,979 216,747 360,796 561,588 965,480 N.A
B:MSCI India Value Returns 3.06% 12.48% 7.32% 8.17% 9.20% N.A
Total Value of AB:CNX Nifty 64,955 243,309 431,690 687,753 1,148,839 4,888,493
AB:CNX Nifty returns 15.75% 20.64% 14.55% 13.85% 12.48% 14.17%
VOLATILITY MEASURES (3 YEARS)Standard Deviation 4.77 4.77R-squared 0.75** 0.73#Beta 1.06** 0.84#Sharpe Ratio* 0.64 0.64
Gas
GAIL India Ltd. 25000 96.95 0.18
Oil
Oil & Natural Gas Corp. Ltd. 465995 1427.58 2.68
Cairn India Ltd. 295000 630.86 1.19
Petroleum Products
Reliance Industries Ltd.* 260000 2147.60 4.04
Pharmaceuticals
Dr. Reddy's Laboratories Ltd.* 115000 4012.06 7.55
Software
Infosys Ltd.* 225000 4991.29 9.39
Unlisted
Nirvikara Paper Mills Ltd. 8888 8.56 0.02
Total Equity Holding 52333.54 98.42
# The rates specified are the actual average expenses charged for the month of March 2015. The above ratio includes the Service tax on Investment Management Fees. The above ratio also includes, proportionate charge in respect sales beyond T-15 cities subject to maximum of 30 bps on daily net assets, wherever applicable
Growth Plan ` 184.2780Dividend Plan ` 63.0585Direct - Growth Plan ` 186.8137Direct - Dividend Plan ` 64.0431
21.77%
21.28%
15.66%
9.39%
7.55%
7.37%
5.32%
4.04%
3.87%
0.98%
2.78%
FINANCE
BANKS
CHEMICALS
SOFTWARE
PHARMACEUTICALS
AUTO
CEMENT
PETROLEUM PRODUCTS
OIL
AUTO ANCILLARIES
REST
7
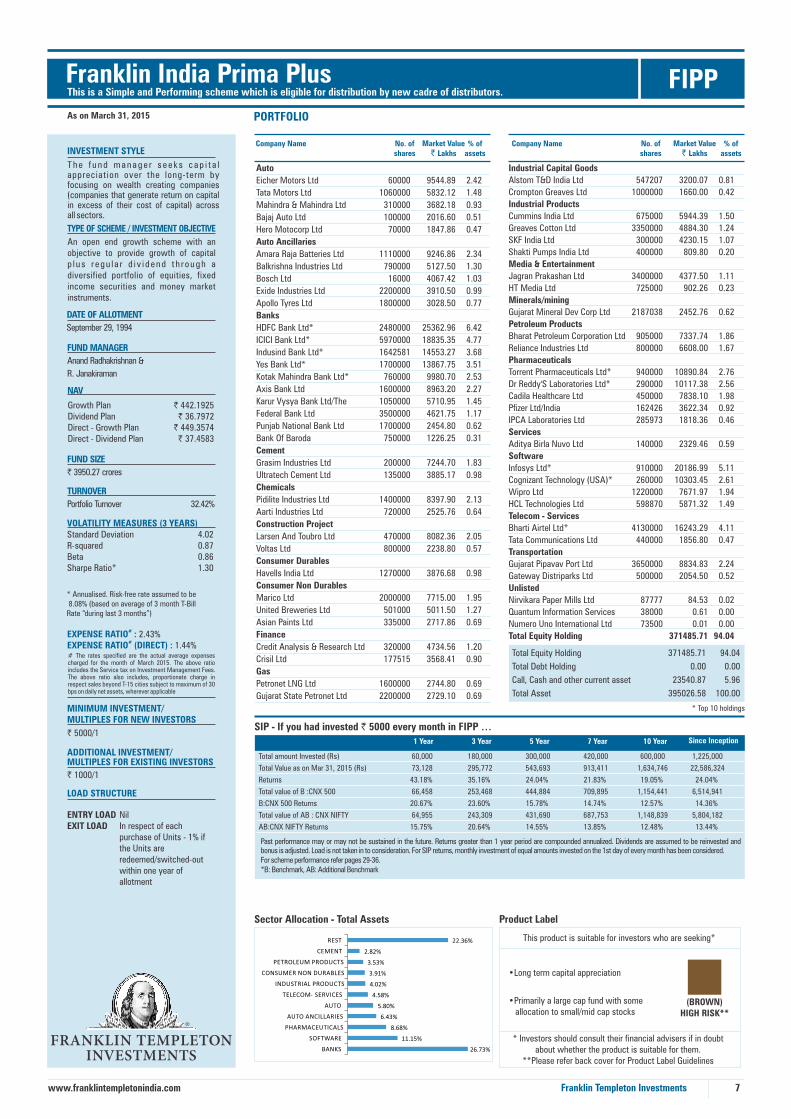
Franklin India Prima Plus FIPP
INVESTMENT STYLE
TYPE OF SCHEME / INVESTMENT OBJECTIVE
DATE OF ALLOTMENT
September 29, 1994
FUND MANAGER
Anand Radhakrishnan &
R. Janakiraman
FUND SIZE
` 3950.27 crores
TURNOVER
Portfolio Turnover 32.42%
VOLATILITY MEASURES (3 YEARS)Standard Deviation 4.02R-squared 0.87Beta 0.86Sharpe Ratio* 1.30
* Annualised. Risk-free rate assumed to be 8.08% (based on average of 3 month T-BillRate “during last 3 months”)
#EXPENSE RATIO : 2.43%#EXPENSE RATIO (DIRECT) : 1.44%
MINIMUM INVESTMENT/MULTIPLES FOR NEW INVESTORS
` 5000/1
ADDITIONAL INVESTMENT/MULTIPLES FOR EXISTING INVESTORS
` 1000/1
LOAD STRUCTURE
ENTRY LOAD NilEXIT LOAD In respect of each purchase of Units - 1% if the Units are redeemed/switched-out within one year of allotment
PORTFOLIO
Company Name No. ofshares
Market Value` Lakhs
% ofassets
Company Name No. ofshares
Market Value` Lakhs
% ofassets
1 Year 3 Year 5 Year 7 Year 10 Year Since Inception
Past performance may or may not be sustained in the future. Returns greater than 1 year period are compounded annualized. Dividends are assumed to be reinvested andbonus is adjusted. Load is not taken in to consideration. For SIP returns, monthly investment of equal amounts invested on the 1st day of every month has been considered. For scheme performance refer pages 29-36.*B: Benchmark, AB: Additional Benchmark
Sector Allocation - Total Assets Product Label
This product is suitable for investors who are seeking*
•Long term capital appreciation
•Primarily a large cap fund with some allocation to small/mid cap stocks
* Investors should consult their financial advisers if in doubtabout whether the product is suitable for them.
**Please refer back cover for Product Label Guidelines
Total Equity Holding
Total Debt Holding
Call, Cash and other current asset
Total Asset
* Top 10 holdings
SIP - If you had invested 5000 every month in FIPP …`
This is a Simple and Performing scheme which is eligible for distribution by new cadre of distributors.
371485.71
0.00
23540.87
395026.58
94.04
0.00
5.96
100.00
As on March 31, 2015
An open end growth scheme with an objective to provide growth of capitalp l u s r e g u l a r d i v i d e n d t h r o u g h adiversified portfolio of equities, fixedincome securities and money marketinstruments.
T h e f u n d m a n a g e r s e e k s c a p i t a l appreciation over the long-term byfocusing on wealth creating companies(companies that generate return on capital in excess of their cost of capital) across all sectors.
NAV
Franklin Templeton Investmentswww.franklintempletonindia.com
(BROWN)HIGH RISK**
Auto
Eicher Motors Ltd 60000 9544.89 2.42
Tata Motors Ltd 1060000 5832.12 1.48
Mahindra & Mahindra Ltd 310000 3682.18 0.93
Bajaj Auto Ltd 100000 2016.60 0.51
Hero Motocorp Ltd 70000 1847.86 0.47
Auto Ancillaries
Amara Raja Batteries Ltd 1110000 9246.86 2.34
Balkrishna Industries Ltd 790000 5127.50 1.30
Bosch Ltd 16000 4067.42 1.03
Exide Industries Ltd 2200000 3910.50 0.99
Apollo Tyres Ltd 1800000 3028.50 0.77
Banks
HDFC Bank Ltd* 2480000 25362.96 6.42
ICICI Bank Ltd* 5970000 18835.35 4.77
Indusind Bank Ltd* 1642581 14553.27 3.68
Yes Bank Ltd* 1700000 13867.75 3.51
Kotak Mahindra Bank Ltd* 760000 9980.70 2.53
Axis Bank Ltd 1600000 8963.20 2.27
Karur Vysya Bank Ltd/The 1050000 5710.95 1.45
Federal Bank Ltd 3500000 4621.75 1.17
Punjab National Bank Ltd 1700000 2454.80 0.62
Bank Of Baroda 750000 1226.25 0.31
Cement
Grasim Industries Ltd 200000 7244.70 1.83
Ultratech Cement Ltd 135000 3885.17 0.98
Chemicals
Pidilite Industries Ltd 1400000 8397.90 2.13
Aarti Industries Ltd 720000 2525.76 0.64
Construction Project
Larsen And Toubro Ltd 470000 8082.36 2.05
Voltas Ltd 800000 2238.80 0.57
Consumer Durables
Havells India Ltd 1270000 3876.68 0.98
Consumer Non Durables
Marico Ltd 2000000 7715.00 1.95
United Breweries Ltd 501000 5011.50 1.27
Asian Paints Ltd 335000 2717.86 0.69
Finance
Credit Analysis & Research Ltd 320000 4734.56 1.20
Crisil Ltd 177515 3568.41 0.90
Gas
Petronet LNG Ltd 1600000 2744.80 0.69
Gujarat State Petronet Ltd 2200000 2729.10 0.69
Total amount Invested (Rs) 60,000 180,000 300,000 420,000 600,000 1,225,000
Total Value as on Mar 31, 2015 (Rs) 73,128 295,772 543,693 913,411 1,634,746 22,586,324
Returns 43.18% 35.16% 24.04% 21.83% 19.05% 24.04%
Total value of B :CNX 500 66,458 253,468 444,884 709,895 1,154,441 6,514,941
B:CNX 500 Returns 20.67% 23.60% 15.78% 14.74% 12.57% 14.36%
Total value of AB : CNX NIFTY 64,955 243,309 431,690 687,753 1,148,839 5,804,182
AB:CNX NIFTY Returns 15.75% 20.64% 14.55% 13.85% 12.48% 13.44%
Industrial Capital Goods
Alstom T&D India Ltd 547207 3200.07 0.81
Crompton Greaves Ltd 1000000 1660.00 0.42
Industrial Products
Cummins India Ltd 675000 5944.39 1.50
Greaves Cotton Ltd 3350000 4884.30 1.24
SKF India Ltd 300000 4230.15 1.07
Shakti Pumps India Ltd 400000 809.80 0.20
Media & Entertainment
Jagran Prakashan Ltd 3400000 4377.50 1.11
HT Media Ltd 725000 902.26 0.23
Minerals/mining
Gujarat Mineral Dev Corp Ltd 2187038 2452.76 0.62
Petroleum Products
Bharat Petroleum Corporation Ltd 905000 7337.74 1.86
Reliance Industries Ltd 800000 6608.00 1.67
Pharmaceuticals
Torrent Pharmaceuticals Ltd* 940000 10890.84 2.76
Dr Reddy'S Laboratories Ltd* 290000 10117.38 2.56
Cadila Healthcare Ltd 450000 7838.10 1.98
Pfizer Ltd/India 162426 3622.34 0.92
IPCA Laboratories Ltd 285973 1818.36 0.46
Services
Aditya Birla Nuvo Ltd 140000 2329.46 0.59
Software
Infosys Ltd* 910000 20186.99 5.11
Cognizant Technology (USA)* 260000 10303.45 2.61
Wipro Ltd 1220000 7671.97 1.94
HCL Technologies Ltd 598870 5871.32 1.49
Telecom - Services
Bharti Airtel Ltd* 4130000 16243.29 4.11
Tata Communications Ltd 440000 1856.80 0.47
Transportation
Gujarat Pipavav Port Ltd 3650000 8834.83 2.24
Gateway Distriparks Ltd 500000 2054.50 0.52
Unlisted
Nirvikara Paper Mills Ltd 87777 84.53 0.02
Quantum Information Services 38000 0.61 0.00
Numero Uno International Ltd 73500 0.01 0.00
Total Equity Holding 371485.71 94.04
# The rates specified are the actual average expenses charged for the month of March 2015. The above ratio includes the Service tax on Investment Management Fees. The above ratio also includes, proportionate charge in respect sales beyond T-15 cities subject to maximum of 30 bps on daily net assets, wherever applicable
Growth Plan ` 442.1925Dividend Plan ` 36.7972Direct - Growth Plan ` 449.3574Direct - Dividend Plan ` 37.4583
26.73%
11.15%
8.68%
6.43%
5.80%
4.58%
4.02%
3.91%
3.53%
2.82%
22.36%
BANKS
SOFTWARE
PHARMACEUTICALS
AUTO ANCILLARIES
AUTO
TELECOM ‐ SERVICES
INDUSTRIAL PRODUCTS
CONSUMER NON DURABLES
PETROLEUM PRODUCTS
CEMENT
REST

8
Franklin India Prima Fund FIPFPORTFOLIO
Company Name No. ofshares
Market Value` Lakhs
% ofassets
Company Name No. ofshares
Market Value` Lakhs
% ofassets
Past performance may or may not be sustained in the future. Returns greater than 1 year period are compounded annualized. Dividends are assumed to be reinvested andbonus is adjusted. Load is not taken in to consideration. For SIP returns, monthly investment of equal amounts invested on the 1st day of every month has been considered. For scheme performance refer pages 29-36.
Sector Allocation - Total Assets Product Label
This product is suitable for investors who are seeking*
•Long term capital appreciation
•A fund that invests in mid and small cap stocks
* Investors should consult their financial advisers if in doubtabout whether the product is suitable for them.
**Please refer back cover for Product Label Guidelines
SIP - If you had invested 5000 every month in FIPF…`
INVESTMENT STYLE
TYPE OF SCHEME / INVESTMENT OBJECTIVE
An open-end growth scheme with anobjective to provide medium to long termcapital appreciation as a primaryobjective and income as a secondaryobjective.
The fund manager seeks aggressivegrowth by focusing primarily on mid andsmall cap companies.
DATE OF ALLOTMENT
December 1, 1993
FUND MANAGER
R. Janakiraman & Roshi Jain
FUND SIZE
` 3430.26 crores
TURNOVER
Portfolio Turnover 25.79%
VOLATILITY MEASURES (3 YEARS)Standard Deviation 4.56 R-squared 0.77Beta 0.92Sharpe Ratio* 1.70
* Annualised. Risk-free rate assumed to be 8.08% (based on average of 3 month T-BillRate “during last 3 months”)
#EXPENSE RATIO :
2.35%#EXPENSE RATIO (DIRECT) : 0.97%
MINIMUM INVESTMENT/MULTIPLES FOR NEW INVESTORS
` 5000/1
ADDITIONAL INVESTMENT/MULTIPLES FOR EXISTING INVESTORS
` 1000/1
LOAD STRUCTURE
ENTRY LOAD NilEXIT LOAD In respect of each purchase of Units - 1% if the Units are redeemed/switched-out within one year of allotment
# CNX Midcap index has been included as additional benchmark for Franklin India Prima Fund (FIPF) effective May 20, 2013*B: Benchmark, AB: Additional Benchmark
As on March 31, 2015
NAV
Franklin Templeton Investmentswww.franklintempletonindia.com
(BROWN)HIGH RISK**
1 Year 3 Year 5 Year 7 Year 10 Year Since Inception
Total Amount Invested (Rs.) 60,000 180,000 300,000 420,000 600,000 1,280,000
Total Value as on Mar 31, 2015 (Rs) 75,589 336,938 635,266 1,119,090 1,769,847 27,456,697
Returns 51.76% 45.40% 30.58% 27.58% 20.52% 24.00%
Total Value of B:CNX 500 66,458 253,468 444,884 709,895 1,154,441 6,843,225
B:CNX 500 Returns 20.67% 23.60% 15.78% 14.74% 12.57% 13.74%
Total Value of CNX Midcap 70,167 276,480 474,948 784,541 1,293,738 N.A
CNX Midcap Returns 33.05% 30.04% 18.45% 17.55% 14.70% N.A
Total Value of AB:CNX Nifty 64,955 243,309 431,690 687,753 1,148,839 6,183,878
AB:CNX Nifty returns 15.75% 20.64% 14.55% 13.85% 12.48% 12.98%
Industrial Capital Goods Bharat Electronics Ltd. 150000 5025.75 1.47Thermax Ltd. 298744 3192.53 0.93Crompton Greaves Ltd. 1604235 2663.03 0.78Industrial Products Finolex Cables Ltd.* 3862831 10999.41 3.21FAG Bearings (India) Ltd.* 228865 9551.11 2.78SKF India Ltd. 393181 5544.05 1.62Greaves Cotton Ltd. 3409231 4970.66 1.45Media & Entertainment Jagran Prakashan Ltd. 1840992 2370.28 0.69Minerals/mining Gujarat Mineral Development Corp. Ltd. 2037453 2285.00 0.67Pesticides Bayer Cropscience Ltd. 132628 4407.36 1.28PI Industries Ltd. 725670 4399.01 1.28Rallis India Ltd. 887310 2014.64 0.59Petroleum Products Bharat Petroleum Corp. Ltd. 645444 5233.26 1.53Mangalore Refinery and Petrochemicals Ltd. 2330681 1570.88 0.46Pharmaceuticals Torrent Pharmaceuticals Ltd.* 824461 9552.21 2.78IPCA Laboratories Ltd. 696986 4431.79 1.29Cadila Healthcare Ltd. 230000 4006.14 1.17Ajanta Pharma Ltd. 173825 2136.31 0.62Power JSW Energy Ltd. 4353255 5189.08 1.51Software Mindtree Ltd.* 640158 8345.42 2.43Cyient Ltd.* 1588297 7971.66 2.32Eclerx Services Ltd. 292000 4629.81 1.35HCL Technologies Ltd. 460000 4509.84 1.31Telecom - Services Bharti Airtel Ltd. 912167 3587.55 1.05Textile Products Himatsingka Seide Ltd. 2694294 2163.52 0.63Transportation Gujarat Pipavav Port Ltd. 2923637 7076.66 2.06Gateway Distriparks Ltd. 1106861 4548.09 1.33Unlisted Nirvikara Paper Mills Ltd. 47601 45.84 0.01Him Techno 170000 0.02 0.00Total Equity Holding 313776.03 91.47
Auto
TVS Motor Co. Ltd. 1575000 4155.64 1.21
Eicher Motors Ltd. 25000 3977.04 1.16
Auto Ancillaries
Amara Raja Batteries Ltd.* 1216260 10132.05 2.95
Apollo Tyres Ltd. 3050000 5131.63 1.50
Balkrishna Industries Ltd. 428418 2780.65 0.81
Banks
Yes Bank Ltd.* 1998564 16303.29 4.75
IndusInd Bank Ltd.* 1015138 8994.12 2.62
Axis Bank Ltd.* 1449000 8117.30 2.37
HDFC Bank Ltd. 760000 7772.52 2.27
ING Vysya Bank Ltd. 685225 6410.62 1.87
Karur Vysya Bank Ltd. 1087184 5913.19 1.72
City Union Bank Ltd. 4724717 4578.25 1.33
ICICI Bank Ltd. 200000 631.00 0.18
Cement
JK Cement Ltd. 927757 6179.79 1.80
ACC Ltd. 300000 4688.25 1.37
Chemicals
Pidilite Industries Ltd.* 1499642 8995.60 2.62
Construction
Sobha Ltd. 912437 3668.45 1.07
Construction Project
Voltas Ltd. 2450983 6859.08 2.00
Larsen & Toubro Ltd. 170000 2923.41 0.85
Consumer Durables
Havell's India Ltd. 1600000 4884.00 1.42
Bata India Ltd. 371269 4049.99 1.18
Consumer Non Durables
Kansai Nerolac Paints Ltd. 3110660 6720.58 1.96
Engineering
Engineers India Ltd. 352319 680.50 0.20
Fertilisers
Coromandel International Ltd. 1629852 4375.34 1.28
Finance
Repco Home Finance Ltd. 1206318 7701.74 2.25
Sundaram Finance Ltd. 467642 7096.00 2.07
LIC Housing Finance Ltd. 1262995 5526.87 1.61
Credit Analysis and Research Ltd. 276833 4095.88 1.19
Crisil Ltd. 122708 2466.68 0.72
Gas
Gujarat State Petronet Ltd. 5920592 7344.49 2.14
Petronet LNG Ltd. 2164960 3713.99 1.08
Hotels/resorts & Other Recreational Acti
Indian Hotels Co. Ltd. 3838503 4487.21 1.31
* Top 10 holdings
Total Equity Holding
Total Debt Holding
Call, Cash and other current asset
Total Asset
313776.03
0.00
29249.74
343025.77
91.47
0.00
8.53
100.00
# The rates specified are the actual average expenses charged for the month of March 2015. The above ratio includes the Service tax on Investment Management Fees. The above ratio also includes, proportionate charge in respect sales beyond T-15 cities subject to maximum of 30 bps on daily net assets, wherever applicable
Growth Plan ` 662.5217Dividend Plan ` 61.7781Direct - Growth Plan ` 677.2494Direct - Dividend Plan ` 63.2443
17.12%
9.06%
7.84%
7.42%
5.87%
5.26%
3.39%
3.22%
3.17%
3.17%
34.49%
BANKS
INDUSTRIAL PRODUCTS
FINANCE
SOFTWARE
PHARMACEUTICALS
AUTO ANCILLARIES
TRANSPORTATION
GAS
INDUSTRIAL CAPITAL GOODS
CEMENT
REST

9
Franklin India Flexi Cap Fund FIFCFPORTFOLIO
Company Name No. ofshares
Market Value` Lakhs
% ofassets
Company Name No. ofshares
Market Value` Lakhs
% ofassets
Sector Allocation - Total Assets Product Label
This product is suitable for investors who are seeking*
•Long term capital appreciation
•A fund that invests in stocks of companies across the market cap range
* Investors should consult their financial advisers if in doubtabout whether the product is suitable for them.
**Please refer back cover for Product Label Guidelines
SIP - If you had invested 5000 every month in FIFCF …`
INVESTMENT STYLE
TYPE OF SCHEME / INVESTMENT OBJECTIVE
DATE OF ALLOTMENT
March 2, 2005
FUND MANAGER
Anand Vasudevan, Roshi Jain
& R. Janakiraman
FUND SIZE
` 2562.95 crores
TURNOVER
Portfolio Turnover 31.68%
VOLATILITY MEASURES (3 YEARS)Standard Deviation 4.31R-squared 0.87Beta 0.92Sharpe Ratio* 1.23
* Annualised. Risk-free rate assumed to be 8.08% (based on average of 3 month T-BillRate “during last 3 months”)
#EXPENSE RATIO : 2.33%#EXPENSE RATIO (DIRECT) : 1.73%
MINIMUM INVESTMENT/MULTIPLES FOR NEW INVESTORS
` 5000/1
ADDITIONAL INVESTMENT/MULTIPLES FOR EXISTING INVESTORS
` 1000/1
LOAD STRUCTURE
ENTRY LOAD NilEXIT LOAD In respect of each purchase of Units - 1% if the Units are redeemed/switched-out within one year of allotment
This is a Simple and Performing scheme which is eligible for distribution by new cadre of distributors.
Total Equity Holding
Total Debt Holding
Call, Cash and other current asset
Total Asset
* Top 10 holdings
Past performance may or may not be sustained in the future. Returns greater than 1 year period are compounded annualized. Dividends are assumed to be reinvested andbonus is adjusted. Load is not taken in to consideration. For SIP returns, monthly investment of equal amounts invested on the 1st day of every month has been considered. For scheme performance refer pages 29-36.*B: Benchmark, AB: Additional Benchmark
247214.54
0.00
9080.95
256295.49
96.46
0.00
3.54
100.00
As on March 31, 2015
NAV
The fund manager will invest in companies based on a research driven, bottom-up stock selection process, irrespective of their market capitalization and sectors.
An open-end diversified equity fundthat seeks to provide medium to long term capital appreciation by investing ins tocks ac ross the ent i re marketcapitalization range.
Franklin Templeton Investmentswww.franklintempletonindia.com
(BROWN)HIGH RISK**
Auto
Maruti Suzuki India Ltd 118036 4364.20 1.70
Mahindra & Mahindra Ltd 350000 4157.30 1.62
Hero Motocorp Ltd 125000 3299.75 1.29
Tata Motors Ltd 950000 3149.73 1.23
TVS Motor Co Ltd 1049436 2768.94 1.08
Auto Ancillaries
Amara Raja Batteries Ltd* 1050000 8747.03 3.41
Balkrishna Industries Ltd 516132 3349.95 1.31
Banks
HDFC Bank Ltd* 1885000 19277.90 7.52
Yes Bank Ltd* 1997192 16292.09 6.36
ICICI Bank Ltd* 4500000 14197.50 5.54
Axis Bank Ltd 1100000 6162.20 2.40
Kotak Mahindra Bank Ltd 425000 5581.31 2.18
State Bank Of India 1860000 4967.13 1.94
Indusind Bank Ltd 405698 3594.48 1.40
Cement
Grasim Industries Ltd 175000 6339.11 2.47
ACC Ltd 255000 3985.01 1.55
Construction Project
Larsen And Toubro Ltd* 734000 12622.23 4.92
Consumer Durables
Titan Co Ltd 600000 2349.60 0.92
Consumer Non Durables
Glaxosmithkline Consumer Healthcare Ltd 110244 6945.37 2.71
United Spirits Ltd 90000 3291.57 1.28
Kansai Nerolac Paints Ltd 1250000 2700.63 1.05
Kaveri Seed Co Ltd 220655 2173.12 0.85
Ferrous Metals
Jindal Steel & Power Ltd 696007 1091.34 0.43
Finance
Credit Analysis & Research Ltd 200000 2959.10 1.15
Repco Home Finance Ltd 455000 2904.95 1.13
Gas
Gujarat State Petronet Ltd 3215883 3989.30 1.56
Petronet Lng Ltd 1475100 2530.53 0.99
Industrial Products
Greaves Cotton Ltd 1852049 2700.29 1.05
Skf India Ltd 170387 2402.54 0.94
Petroleum Products
Bharat Petroleum Corporation Ltd* 950000 7702.60 3.01
Pharmaceuticals
Torrent Pharmaceuticals Ltd* 1127638 13064.81 5.10
Dr Reddy'S Laboratories Ltd* 227880 7950.16 3.10
Cipla Ltd 650798 4636.61 1.81
Cadila Healthcare Ltd 257500 4485.14 1.75
Power
Torrent Power Ltd 1605963 2626.55 1.02
Kec International Ltd 500000 400.25 0.16
Software
Cognizant Technology (USA)* 260000 10303.45 4.02
Hcl Technologies Ltd* 760000 7451.04 2.91
Infosys Ltd 303094 6723.69 2.62
Wipro Ltd 475000 2987.04 1.17
Mindtree Ltd 223510 2913.79 1.14
Cyient Ltd 450000 2258.55 0.88
Telecom - Services
Bharti Airtel Ltd 1800000 7079.40 2.76
Idea Cellular Ltd 927754 1707.07 0.67
Transportation
Gujarat Pipavav Port Ltd 2468480 5974.96 2.33
Unlisted
Nirvikara Paper Mills Ltd 57347 55.23 0.02
Total Equity Holding 247214.54 96.46
# The rates specified are the actual average expenses charged for the month of March 2015. The above ratio includes the Service tax on Investment Management Fees. The above ratio also includes, proportionate charge in respect sales beyond T-15 cities subject to maximum of 30 bps on daily net assets, wherever applicable
Growth Plan ` 62.3907Dividend Plan ` 17.5835Direct - Growth Plan ` 63.2911Direct - Dividend Plan ` 17.8784
27.34%
12.73%
11.76%
6.92%
5.90%
4.92%
4.72%
4.03%
3.43%
3.01%
15.24%
BANKS
SOFTWARE
PHARMACEUTICALS
AUTO
CONSUMER NON DURABLES
CONSTRUCTION PROJECT
AUTO ANCILLARIES
CEMENT
TELECOM ‐ SERVICES
PETROLEUM PRODUCTS
REST
1 Year 3 Year 5 Year 7 Year 10 Year Since Inception
Total amount Invested (Rs) 60,000 180,000 300,000 420,000 600,000 600,000
Total Value as on Mar 31, 2015 (Rs) 71,961 296,118 535,659 908,908 1,566,884 1,566,884
Returns 39.16% 35.25% 23.42% 21.69% 18.26% 18.26%
Total value of B : CNX 500 66,458 253,468 444,884 709,895 1,154,441 1,154,441
B:CNX 500 Returns 20.67% 23.60% 15.78% 14.74% 12.57% 12.57%
Total value of AB :CNX Nifty 64,955 243,309 431,690 687,753 1,148,839 1,148,839
AB:CNX Nifty returns 15.75% 20.64% 14.55% 13.85% 12.48% 12.48%
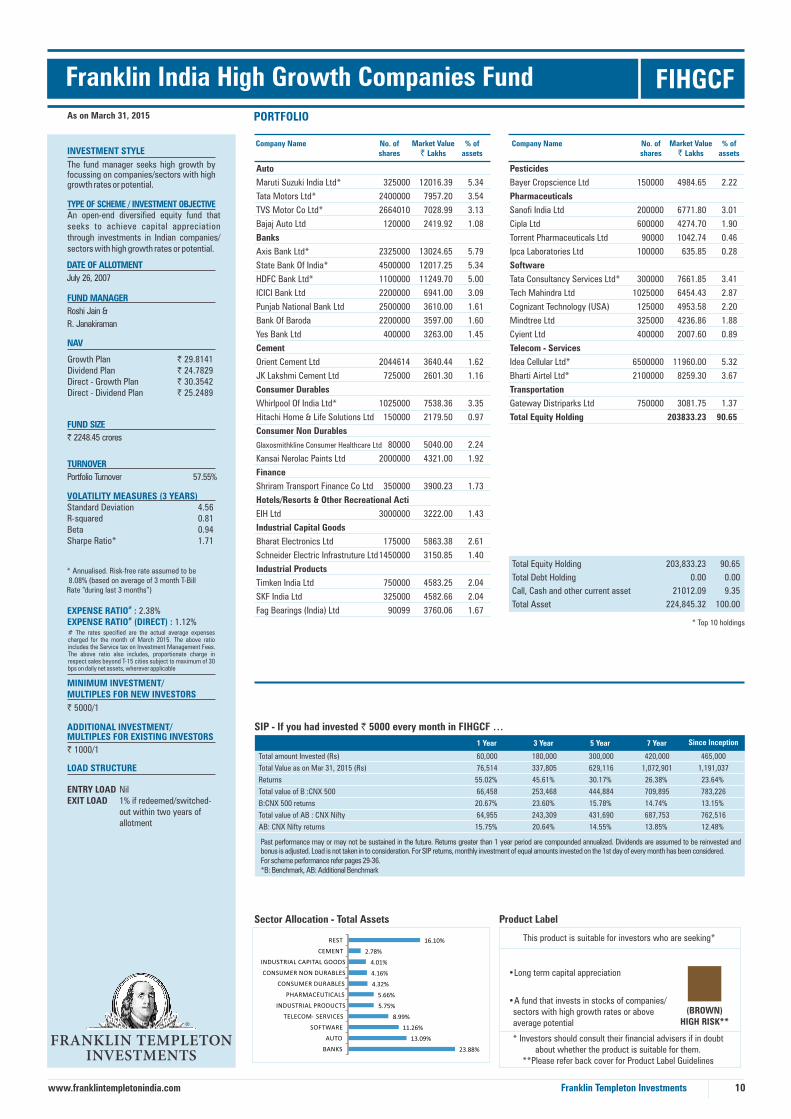
Franklin India High Growth Companies Fund FIHGCFPORTFOLIO
Company Name No. ofshares
Market Value` Lakhs
% ofassets
Company Name No. ofshares
Market Value` Lakhs
% ofassets
Sector Allocation - Total Assets Product Label
This product is suitable for investors who are seeking*
•Long term capital appreciation
•A fund that invests in stocks of companies/ sectors with high growth rates or above average potential
* Investors should consult their financial advisers if in doubtabout whether the product is suitable for them.
**Please refer back cover for Product Label Guidelines
SIP - If you had invested 5000 every month in FIHGCF …`
Total Equity Holding
Total Debt Holding
Call, Cash and other current asset
Total Asset
* Top 10 holdings
Past performance may or may not be sustained in the future. Returns greater than 1 year period are compounded annualized. Dividends are assumed to be reinvested andbonus is adjusted. Load is not taken in to consideration. For SIP returns, monthly investment of equal amounts invested on the 1st day of every month has been considered. For scheme performance refer pages 29-36.*B: Benchmark, AB: Additional Benchmark
INVESTMENT STYLE
TYPE OF SCHEME / INVESTMENT OBJECTIVE
DATE OF ALLOTMENT
July 26, 2007
FUND MANAGER
Roshi Jain &
R. Janakiraman
FUND SIZE
` 2248.45 crores
TURNOVER
Portfolio Turnover 57.55%
VOLATILITY MEASURES (3 YEARS)Standard Deviation 4.56R-squared 0.81Beta 0.94Sharpe Ratio* 1.71
* Annualised. Risk-free rate assumed to be 8.08% (based on average of 3 month T-BillRate “during last 3 months”)
#EXPENSE RATIO : 2.38%#EXPENSE RATIO (DIRECT) : 1.12%
MINIMUM INVESTMENT/MULTIPLES FOR NEW INVESTORS
` 5000/1
ADDITIONAL INVESTMENT/MULTIPLES FOR EXISTING INVESTORS
` 1000/1
LOAD STRUCTURE
ENTRY LOAD NilEXIT LOAD 1% if redeemed/switched- out within two years of allotment
10
203,833.23
0.00
21012.09
224,845.32
90.65
0.00
9.35
100.00
As on March 31, 2015
NAV
An open-end diversified equity fund that seeks to achieve capital appreciation through investments in Indian companies/ sectors with high growth rates or potential.
The fund manager seeks high growth by focussing on companies/sectors with high growth rates or potential.
Franklin Templeton Investmentswww.franklintempletonindia.com
(BROWN)HIGH RISK**
Auto
Maruti Suzuki India Ltd* 325000 12016.39 5.34
Tata Motors Ltd* 2400000 7957.20 3.54
TVS Motor Co Ltd* 2664010 7028.99 3.13
Bajaj Auto Ltd 120000 2419.92 1.08
Banks
Axis Bank Ltd* 2325000 13024.65 5.79
State Bank Of India* 4500000 12017.25 5.34
HDFC Bank Ltd* 1100000 11249.70 5.00
ICICI Bank Ltd 2200000 6941.00 3.09
Punjab National Bank Ltd 2500000 3610.00 1.61
Bank Of Baroda 2200000 3597.00 1.60
Yes Bank Ltd 400000 3263.00 1.45
Cement
Orient Cement Ltd 2044614 3640.44 1.62
JK Lakshmi Cement Ltd 725000 2601.30 1.16
Consumer Durables
Whirlpool Of India Ltd* 1025000 7538.36 3.35
Hitachi Home & Life Solutions Ltd 150000 2179.50 0.97
Consumer Non Durables
Glaxosmithkline Consumer Healthcare Ltd 80000 5040.00 2.24
Kansai Nerolac Paints Ltd 2000000 4321.00 1.92
Finance
Shriram Transport Finance Co Ltd 350000 3900.23 1.73
Hotels/Resorts & Other Recreational Acti
EIH Ltd 3000000 3222.00 1.43
Industrial Capital Goods
Bharat Electronics Ltd 175000 5863.38 2.61
Schneider Electric Infrastruture Ltd 1450000 3150.85 1.40
Industrial Products
Timken India Ltd 750000 4583.25 2.04
SKF India Ltd 325000 4582.66 2.04
Fag Bearings (India) Ltd 90099 3760.06 1.67
Pesticides
Bayer Cropscience Ltd 150000 4984.65 2.22
Pharmaceuticals
Sanofi India Ltd 200000 6771.80 3.01
Cipla Ltd 600000 4274.70 1.90
Torrent Pharmaceuticals Ltd 90000 1042.74 0.46
Ipca Laboratories Ltd 100000 635.85 0.28
Software
Tata Consultancy Services Ltd* 300000 7661.85 3.41
Tech Mahindra Ltd 1025000 6454.43 2.87
Cognizant Technology (USA) 125000 4953.58 2.20
Mindtree Ltd 325000 4236.86 1.88
Cyient Ltd 400000 2007.60 0.89
Telecom - Services
Idea Cellular Ltd* 6500000 11960.00 5.32
Bharti Airtel Ltd* 2100000 8259.30 3.67
Transportation
Gateway Distriparks Ltd 750000 3081.75 1.37
Total Equity Holding 203833.23 90.65
1 Year 3 Year 5 Year 7 Year Since Inception
Total amount Invested (Rs) 60,000 180,000 300,000 420,000 465,000
Total Value as on Mar 31, 2015 (Rs) 76,514 337,805 629,116 1,072,901 1,191,037
Returns 55.02% 45.61% 30.17% 26.38% 23.64%
Total value of B :CNX 500 66,458 253,468 444,884 709,895 783,226
B:CNX 500 returns 20.67% 23.60% 15.78% 14.74% 13.15%
Total value of AB : CNX Nifty 64,955 243,309 431,690 687,753 762,516
AB: CNX Nifty returns 15.75% 20.64% 14.55% 13.85% 12.48%
# The rates specified are the actual average expenses charged for the month of March 2015. The above ratio includes the Service tax on Investment Management Fees. The above ratio also includes, proportionate charge in respect sales beyond T-15 cities subject to maximum of 30 bps on daily net assets, wherever applicable
Growth Plan ` 29.8141Dividend Plan ` 24.7829Direct - Growth Plan ` 30.3542Direct - Dividend Plan ` 25.2489
23.88%
13.09%
11.26%
8.99%
5.75%
5.66%
4.32%
4.16%
4.01%
2.78%
16.10%
BANKS
AUTO
SOFTWARE
TELECOM ‐ SERVICES
INDUSTRIAL PRODUCTS
PHARMACEUTICALS
CONSUMER DURABLES
CONSUMER NON DURABLES
INDUSTRIAL CAPITAL GOODS
CEMENT
REST

Franklin Asian Equity Fund FAEFPORTFOLIO
Company Name No. ofshares
Market Value` Lakhs
% ofassets
Company Name No. ofshares
Market Value` Lakhs
% ofassets
Sector Allocation - Total Assets
SIP - If you had invested 5000 every month in FAEF …`
Product Label
This product is suitable for investors who are seeking*
•Long term capital appreciation
•A fund that invests in stocks of Asian companies /sectors (excluding Japan)
* Investors should consult their financial advisers if in doubtabout whether the product is suitable for them.
**Please refer back cover for Product Label Guidelines
Past performance may or may not be sustained in the future. Returns greater than 1 year period are compounded annualized. Dividends are assumed to be reinvested andbonus is adjusted. Load is not taken in to consideration. For SIP returns, monthly investment of equal amounts invested on the 1st day of every month has been considered. For scheme performance refer pages 29-36.*B: Benchmark, AB: Additional Benchmark
INVESTMENT STYLE
TYPE OF SCHEME / INVESTMENT OBJECTIVE
DATE OF ALLOTMENT
January 16, 2008
FUND MANAGER
Roshi Jain & Neeraj Gaurh (dedicated
foreign securities fund manager)
FUND SIZE
` 122.13 crores
TURNOVER
Portfolio Turnover 43.02%
VOLATILITY MEASURES (3 YEARS)Standard Deviation 2.44R-squared 0.80Beta 0.85Sharpe Ratio* 0.44
* Annualised. Risk-free rate assumed to be8.08% (based on average of 3 month T-BillRate “during last 3 months”)
#EXPENSE RATIO : 2.90%#EXPENSE RATIO (DIRECT) : 2.32%
MINIMUM INVESTMENT/MULTIPLES FOR NEW INVESTORS
` 5000/1
ADDITIONAL INVESTMENT/MULTIPLES FOR EXISTING INVESTORS
` 1000/1
LOAD STRUCTURE
ENTRY LOAD NilEXIT LOAD 1% if redeemed/switched- out within three years of allotment
11
* Top 10 holdings
As on March 31, 2015
*Includes service tax on investment management fees
An open-end diversified equity fund that seeks to provide medium to long term appreciation through investments primarily in Asian Companies / sectors (excluding Japan) with long term potential across market capitalisation.
The fund manager seeks long term appre-ciation by focussing on Asian Companies/Sectors (excluding Japan) with long term growth potential.
NAV
Franklin Templeton Investmentswww.franklintempletonindia.com
(BROWN)HIGH RISK**
Auto Hyundai Motor Co (South Korea) 2669 253.57 2.08Dongfeng Motor Group (China) 95000 95.20 0.78Tata Motors Ltd 15000 82.53 0.68Eicher Motors Ltd 500 79.54 0.65Brilliance China Automotive (Hong Kong) 25700 30.85 0.25Auto Ancillaries Cheng Shin Rubber Industry (Indonesia) 54252 77.95 0.64Nexen Tire Corporation (South Korea) 4500 32.98 0.27Minth Group (Hong Kong) 24000 29.67 0.24Banks Shinhan Financial (South Korea)* 12694 300.25 2.46Kasikornbank Pcl (Thailand) 55500 245.51 2.01Chinatrust Financial Holding Co (Taiwan) 551071 229.04 1.88DBS Group Holdings (Singapore) 16253 150.60 1.23China Merchants Bank (Hong Kong) 98035 149.65 1.23Bank Mandiri (Thailand) 237500 141.77 1.16Yes Bank Ltd 15500 126.44 1.04China Construction Bank (Hong Kong) 238000 123.47 1.01Siam Commercial Bank (Thailand) 32100 109.89 0.90ICICI Bank Ltd 30000 94.65 0.77BK Central Asia (Indonesia) 84000 59.59 0.49Punjab National Bank Ltd 25000 36.10 0.30Cement Siam Cement (Thailand)* 30500 299.17 2.45JK Lakshmi Cement Ltd 26000 93.29 0.76Construction China Overseas Land & Investment (Hong Kong)* 168696 338.91 2.77Cheil Industries (South Korea) 2150 181.23 1.48GS Engineering & Construction (South Korea) 4755 80.97 0.66Sands China (Hong Kong) 14400 37.35 0.31China Resources Land (Hong Kong) 18000 31.88 0.26AP Thailand (Thailand) 22000 3.05 0.02Construction Project Samsung C&T Corp (South Korea) 2163 72.44 0.59Consumer Durables Nestle Lanka (Sri Lanka) 11400 122.66 1.00Giant Manufacturing Co (Taiwan) 14255 86.02 0.70Osim International (Singapore) 80000 71.36 0.58Titan Co Ltd 8000 31.33 0.26Fuyao Glass (Hong Kong) 6800 10.44 0.09Consumer Non Durables Samsonite (Hong Kong) 72600 158.45 1.30L'Occitane International Sa (Hong Kong) 83890 149.59 1.22Dairy Farm International Holdings (Singapore) 24000 141.00 1.15Nestle (Malaysia) 10609 132.09 1.08MK Restaurant (Thailand) 32700 36.16 0.30Mayora Indah (Indonesia) 20100 27.80 0.23Finance Aia Group (Hong Kong)* 150024 590.09 4.83Hong Kong Exchanges & Clearing (Hong Kong) 15239 233.49 1.91Meritz Fire & Marine Insurance (South Korea) 34595 222.36 1.82Singapore Exchange (Singapore) 27548 102.05 0.84Motilal Oswal Financial Services Ltd 25000 70.83 0.58Mahindra & Mahindra Financial Services Ltd 15000 38.09 0.31Ping An Insurance (Hong Kong) 5000 37.70 0.31Hardware Taiwan Semiconductor Manufacturing (Taiwan)* 296198 861.18 7.05Samsung Electronics (South Korea)* 948 770.23 6.31Silergy Corp (Taiwan) 21570 102.80 0.84Simm Tech Co (South Korea) 15297 93.58 0.77
Sapphire Technology (South Korea) 6898 63.98 0.52Samsung Sdi (South Korea) 730 56.18 0.46Flexium Interconnect (Taiwan) 24246 43.65 0.36Healthcare Services Bumrungrad Hospital (Thailand) 26700 78.06 0.64Hotels Indian Hotels Co Ltd 6750 7.27 0.06Indian Hotels Co Ltd 60000 70.14 0.57Industrial Capital Goods Singapore Technologies Engineering (Singapore) 76570 121.27 0.99Industrial Products Carborundum Universal Ltd 40000 76.08 0.62Grindwell Norton Ltd 10042 70.24 0.58Media & Entertainment Surya Citra (Indonesia) 702800 114.17 0.93Jagran Prakashan Ltd 84000 108.15 0.89Bec World (Thailand) 131000 103.30 0.85Major Cineplex (Thailand) 141700 89.25 0.73Minerals/Mining Gujarat Mineral Dev Corp Ltd 65000 72.90 0.60Non - Ferrous Metals Hindalco Industries Ltd 35000 45.15 0.37Petroleum Products Ptt Pcl (Thailand) 36220 225.01 1.84Petrochina (Hong Kong) 261000 180.47 1.48Formosa Plastic Corp. (Taiwan) 35313 53.56 0.44Pharmaceuticals Pt Kalbe Farma (Indonesia) 1619500 144.53 1.18Lupin Ltd 4000 80.34 0.66Sun Pharmaceutical Industries Ltd 7500 76.79 0.63Cadila Healthcare Ltd 3500 60.96 0.50Torrent Pharmaceuticals Ltd 5000 57.93 0.47Power China Shenhua Energy (Hong Kong) 105540 168.43 1.38Retailing Alibaba Group (USA)* 5809 304.93 2.50Hyundai Dept Stores (South Korea) 1115 93.67 0.77Cp All Pcl (Thailand) 118100 93.13 0.76Techtronics Industries (Hong Kong) 34000 72.15 0.59Software Tencent Holdings (Hong Kong)* 36500 433.79 3.55Baidu Inc (Adr)* 3190 420.20 3.44Cognizant Technology (USA)* 8793 348.45 2.85Vipshop Holdings (Adr) 3730 67.02 0.55JD.Com (Adr) 3400 63.28 0.52Telecom - Services Bharti Airtel Ltd 26000 102.26 0.84Singapore Telecommunications (Singapore) 18620 37.12 0.30Textile Products Shenzhou International (Hong Kong) 15000 42.48 0.35Transportation Citrip.Com (USA) 3547 130.70 1.07Total Equity Holding 12053.81 98.69
# The rates specified are the actual average expenses charged for the month of March 2015. The above ratio includes the Service tax on Investment Management Fees. The above ratio also includes, proportionate charge in respect sales beyond T-15 cities subject to maximum of 30 bps on daily net assets, wherever applicable
Total Equity Holding
Total Debt Holding
Call, Cash and other current asset
Total Asset
12053.81
0.00
159.48
12213.29
98.69
0.00
1.31
100.00
Growth Plan ` 16.3593Dividend Plan ` 13.7252Direct - Growth Plan ` 16.5554Direct - Dividend Plan ` 13.9098
16.31%
14.47%
10.91%
10.60%
5.51%
5.28%
4.62%
3.76%
4.44%
3.40%
20.70%
HARDWARE
BANKS
SOFTWARE
FINANCE
CONSTRUCTION
CONSUMER NON DURABLES
RETAILING
PETROLEUM PRODUCTS
AUTO
MEDIA & ENTERTAINMENT
REST
1 Year 3 Year 5 Year 7 Year Since Inception
Total amount Invested (Rs) 60,000 180,000 300,000 420,000 435,000
Total Value as on Mar 31, 2015 (Rs) 63,384 213,158 395,653 629,150 654,868
Returns 10.68% 11.32% 11.03% 11.36% 11.09%
Total value of B :MSCI Asia (ex Japan) 63,227 211,342 395,324 638,257 663,451
B:MSCI Asia (ex Japan) Returns 10.18% 10.73% 10.99% 11.76% 11.44%
Total value of AB :CNX NIFTY 64,955 243,309 431,690 687,753 711,462
AB:CNX NIFTY retuns 15.75% 20.64% 14.55% 13.85% 13.32%

Franklin India Opportunities Fund FIOF
Franklin Build India Fund FBIF
12
PORTFOLIO - TOP 10 HOLDINGS
Company Name No. ofshares
Market Value` Lakhs
% ofassets
Company Name No. ofshares
Market Value` Lakhs
% ofassets
INVESTMENT STYLE
TYPE OF SCHEME / INVESTMENT OBJECTIVE
DATE OF ALLOTMENT
February 21, 2000
FUND MANAGER
Mr R. Janakiraman & Mr Anil Prabhudas
#EXPENSE RATIO : 2.90%#EXPENSE RATIO (DIRECT) : 2.36%
FUND SIZE
` 380.90 croresTURNOVER
Portfolio Turnover 17.77%
` 5000/1
MINIMUM INVESTMENT/MULTIPLES FOR NEW INVESTORS
ADDITIONAL INVESTMENT/MULTIPLES FOR EXISTING INVESTORS
` 1000/1
ENTRY LOAD NilEXIT LOAD In respect of each purchase of Units - 1% if the Units are redeemed/switched-out within one year of allotment
LOAD STRUCTURE
Total Equity Holding
Total Debt Holding
Call, Cash and other current asset
Total Asset
VOLATILITY MEASURES (3 YEARS)Standard Deviation 4.63R-squared 0.88Beta 1.02Sharpe Ratio* 1.08* Annualised. Risk-free rate assumed to be 8.08% (based on average of 3 month T-Bill Rate “during last 3 months”)
Product Label
This product is suitable for investors who are seeking*
•Long term capital appreciation
•A fund that take concentrated stock or sectorexposures based on four themes
* Investors should consult their financial advisers if in doubt about whether the product is suitable for them.
**Please refer back cover for Product Label Guidelines
INVESTMENT STYLE
DATE OF ALLOTMENT
September 4, 2009
FUND MANAGER
Anand Radhakrishnan & Roshi Jain #EXPENSE RATIO : 2.91%#EXPENSE RATIO (DIRECT) : 1.65%FUND SIZE
` 415.47 crores
TURNOVER
Portfolio Turnover 56.26%
` 5000/1
MINIMUM INVESTMENT/MULTIPLES FOR NEW INVESTORS
ADDITIONAL INVESTMENT/MULTIPLES FOR EXISTING INVESTORS` 1000/1
ENTRY LOAD NilEXIT LOAD 1% if redeemed/switched- out within two years of allotment
LOAD STRUCTURE
Total Equity Holding
Total Debt Holding
Call, Cash and other current asset
Total Asset
Company Name No. ofshares
Market Value` Lakhs
% ofassets
Company Name No. ofshares
Market Value` Lakhs
% ofassets
34714.41
0.00
3375.84
38090.25
91.14
0.00
8.86
100.00
37,933.58
0.00
3613.68
41547.26
91.30
0.00
8.70
100.00
As on March 31, 2015
PORTFOLIO - TOP 10 HOLDINGSAs on March 31, 2015
TYPE OF SCHEME / INVESTMENT OBJECTIVE
An open-end equity fund which seeks to achievecapital appreciation through investments in companies engaged either directly or indirectly in infrastructure-related activities.
An open-end diversified growth scheme, with an objective to generate capital appreciation by capitalizing on long - term growth opportunities in the Indian economy.
The fund manager seeks long term capitalappreciation by focusing on companies that o p e r a t e i n t h e s p a c e w h e r e I n d i a h a sa strong competitive advantage, companies that are globally competitive and those that are grossly undervalued or have high growth potential
Sector allocation - Total assets
* Top 10 holdings
* Top 10 holdings
Franklin Templeton Investmentswww.franklintempletonindia.com
(BROWN)HIGH RISK**
Product Label
This product is suitable for investors who are seeking*
•Long term capital appreciation
•A fund that invests in Infrastructure and allied sectors
* Investors should consult their financial advisers if in doubt about whether the product is suitable for them.
**Please refer back cover for Product Label Guidelines
Sector Allocation - Total Assets
(BROWN)HIGH RISK**
VOLATILITY MEASURES (3 YEARS)Standard Deviation 5.31R-squared 0.80Beta 1.08Sharpe Ratio* 1.56* Annualised. Risk-free rate assumed to be 8.08% (based on average of 3 month T-Bill Rate “during last 3 months”)
# The rates specified are the actual average expenses charged for the month of March 2015. The above ratio includes the Service tax on Investment Management Fees. The above ratio also includes, proportionate charge in respect sales beyond T-15 cities subject to maximum of 30 bps on daily net assets, wherever applicable
# The rates specified are the actual average expenses charged for the month of March 2015. The above ratio includes the Service tax on Investment Management Fees. The above ratio also includes, proportionate charge in respect sales beyond T-15 cities subject to maximum of 30 bps on daily net assets, wherever applicable
Growth Plan ` 57.8824Dividend Plan ` 21.0242Direct - Growth Plan ` 58.4264Direct - Dividend Plan ` 21.2354
Growth Plan ` 29.4194Dividend Plan ` 22.0434Direct - Growth Plan ` 29.9783Direct - Dividend Plan ` 22.5073
NAV
Auto Ancillaries
Amara Raja Batteries Ltd.* 180000 1499.49 3.94
Banks
HDFC Bank Ltd.* 241393 2468.73 6.48
ICICI Bank Ltd.* 778495 2456.15 6.45
Yes Bank Ltd.* 276818 2258.14 5.93
Axis Bank Ltd.* 300000 1680.60 4.41
Construction Project
Larsen & Toubro Ltd.* 126500 2175.36 5.71
Petroleum Products
Bharat Petroleum Corp. Ltd.* 195105 1581.91 4.15
Pharmaceuticals
Lupin Ltd.* 83000 1666.97 4.38
Software
Infosys Ltd.* 54862 1217.03 3.20
Telecom - Services
Bharti Airtel Ltd.* 422366 1661.17 4.36
Auto
Maruti Suzuki India Ltd.* 60000 2218.41 5.34
Banks
Axis Bank Ltd.* 450000 2520.90 6.07
State Bank of India* 800000 2136.40 5.14
HDFC Bank Ltd.* 190000 1943.13 4.68
ICICI Bank Ltd.* 450000 1419.75 3.42
Consumer Durables
Whirlpool of India Ltd.* 182352 1341.11 3.23
Industrial Capital Goods
Bharat Electronics Ltd.* 40000 1340.20 3.23
Pharmaceuticals
Sanofi India Ltd.* 40000 1354.36 3.26
Telecom - Services
Idea Cellular Ltd.* 1250000 2300.00 5.54
Bharti Airtel Ltd.* 450000 1769.85 4.26
30.45%
11.59%
8.63%
7.26%
5.46%
5.30%
4.77%
4.36%
4.15%
3.94%
14.08%
BANKS
SOFTWARE
PHARMACEUTICALS
CONSTRUCTION PROJECT
INDUSTRIAL PRODUCTS
CEMENT
AUTO
TELECOM ‐ SERVICES
PETROLEUM PRODUCTS
AUTO ANCILLARIES
REST
24.66%
11.31%
9.80%
8.14%
6.83%
4.98%
4.93%
4.61%
4.39%
2.24%
18.13%
BANKS
AUTO
TELECOM ‐ SERVICES
INDUSTRIAL PRODUCTS
PHARMACEUTICALS
CONSUMER DURABLES
INDUSTRIAL CAPITAL GOODS
CONSUMER NON DURABLES
CEMENT
GAS
REST
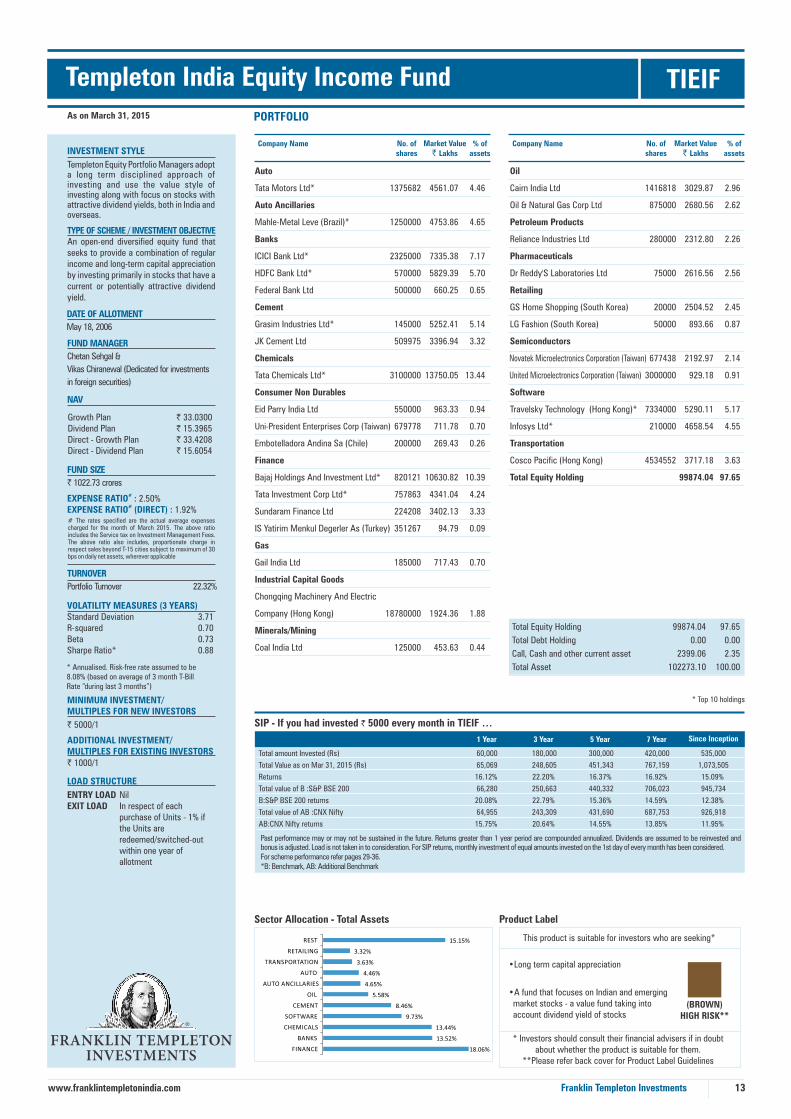
Templeton India Equity Income Fund TIEIFPORTFOLIO
Company Name No. ofshares
Market Value` Lakhs
% ofassets
Company Name No. ofshares
Market Value` Lakhs
% ofassets
Sector Allocation - Total Assets
SIP - If you had invested 5000 every month in TIEIF …`
Product Label
This product is suitable for investors who are seeking*
•Long term capital appreciation
•A fund that focuses on Indian and emerging market stocks - a value fund taking into account dividend yield of stocks
* Investors should consult their financial advisers if in doubtabout whether the product is suitable for them.
**Please refer back cover for Product Label Guidelines
Past performance may or may not be sustained in the future. Returns greater than 1 year period are compounded annualized. Dividends are assumed to be reinvested andbonus is adjusted. Load is not taken in to consideration. For SIP returns, monthly investment of equal amounts invested on the 1st day of every month has been considered. For scheme performance refer pages 29-36.*B: Benchmark, AB: Additional Benchmark
INVESTMENT STYLE
TYPE OF SCHEME / INVESTMENT OBJECTIVE
DATE OF ALLOTMENT
May 18, 2006
FUND MANAGER
Chetan Sehgal &
Vikas Chiranewal (Dedicated for investments
in foreign securities)
FUND SIZE
` 1022.73 crores
TURNOVER
Portfolio Turnover 22.32%
VOLATILITY MEASURES (3 YEARS)Standard Deviation 3.71R-squared 0.70Beta 0.73Sharpe Ratio* 0.88
* Annualised. Risk-free rate assumed to be8.08% (based on average of 3 month T-BillRate “during last 3 months”)
#EXPENSE RATIO : 2.50%#EXPENSE RATIO (DIRECT) : 1.92%
MINIMUM INVESTMENT/MULTIPLES FOR NEW INVESTORS
` 5000/1
ADDITIONAL INVESTMENT/MULTIPLES FOR EXISTING INVESTORS` 1000/1
LOAD STRUCTURE
ENTRY LOAD NilEXIT LOAD In respect of each purchase of Units - 1% if the Units are redeemed/switched-out within one year of allotment
13
* Top 10 holdings
Total Equity Holding
Total Debt Holding
Call, Cash and other current asset
Total Asset
1 Year 3 Year 5 Year 7 Year Since Inception
99874.04
0.00
2399.06
102273.10
97.65
0.00
2.35
100.00
As on March 31, 2015
An open-end diversified equity fund that seeks to provide a combination of regular income and long-term capital appreciation by investing primarily in stocks that have a current or potentially attractive dividend yield.
Templeton Equity Portfolio Managers adopt a long term disciplined approach of investing and use the value style of investing along with focus on stocks with attractive dividend yields, both in India and overseas.
Franklin Templeton Investmentswww.franklintempletonindia.com
(BROWN)HIGH RISK**
Total amount Invested (Rs) 60,000 180,000 300,000 420,000 535,000
Total Value as on Mar 31, 2015 (Rs) 65,069 248,605 451,343 767,159 1,073,505
Returns 16.12% 22.20% 16.37% 16.92% 15.09%
Total value of B :S&P BSE 200 66,280 250,663 440,332 706,023 945,734
B:S&P BSE 200 returns 20.08% 22.79% 15.36% 14.59% 12.38%
Total value of AB :CNX Nifty 64,955 243,309 431,690 687,753 926,918
AB:CNX Nifty returns 15.75% 20.64% 14.55% 13.85% 11.95%
Auto
Tata Motors Ltd* 1375682 4561.07 4.46
Auto Ancillaries
Mahle-Metal Leve (Brazil)* 1250000 4753.86 4.65
Banks
ICICI Bank Ltd* 2325000 7335.38 7.17
HDFC Bank Ltd* 570000 5829.39 5.70
Federal Bank Ltd 500000 660.25 0.65
Cement
Grasim Industries Ltd* 145000 5252.41 5.14
JK Cement Ltd 509975 3396.94 3.32
Chemicals
Tata Chemicals Ltd* 3100000 13750.05 13.44
Consumer Non Durables
Eid Parry India Ltd 550000 963.33 0.94
Uni-President Enterprises Corp (Taiwan) 679778 711.78 0.70
Embotelladora Andina Sa (Chile) 200000 269.43 0.26
Finance
Bajaj Holdings And Investment Ltd* 820121 10630.82 10.39
Tata Investment Corp Ltd* 757863 4341.04 4.24
Sundaram Finance Ltd 224208 3402.13 3.33
IS Yatirim Menkul Degerler As (Turkey) 351267 94.79 0.09
Gas
Gail India Ltd 185000 717.43 0.70
Industrial Capital Goods
Chongqing Machinery And Electric
Company (Hong Kong) 18780000 1924.36 1.88
Minerals/Mining
Coal India Ltd 125000 453.63 0.44
Oil
Cairn India Ltd 1416818 3029.87 2.96
Oil & Natural Gas Corp Ltd 875000 2680.56 2.62
Petroleum Products
Reliance Industries Ltd 280000 2312.80 2.26
Pharmaceuticals
Dr Reddy'S Laboratories Ltd 75000 2616.56 2.56
Retailing
GS Home Shopping (South Korea) 20000 2504.52 2.45
LG Fashion (South Korea) 50000 893.66 0.87
Semiconductors
677438 2192.97 2.14
3000000 929.18 0.91
Software
Travelsky Technology (Hong Kong)* 7334000 5290.11 5.17
Infosys Ltd* 210000 4658.54 4.55
Transportation
Cosco Pacific (Hong Kong) 4534552 3717.18 3.63
Total Equity Holding 99874.04 97.65
# The rates specified are the actual average expenses charged for the month of March 2015. The above ratio includes the Service tax on Investment Management Fees. The above ratio also includes, proportionate charge in respect sales beyond T-15 cities subject to maximum of 30 bps on daily net assets, wherever applicable
Growth Plan ` 33.0300Dividend Plan ` 15.3965Direct - Growth Plan ` 33.4208Direct - Dividend Plan ` 15.6054
Novatek Microelectronics Corporation (Taiwan)
United Microelectronics Corporation (Taiwan)
18.06%
13.52%
13.44%
9.73%
8.46%
5.58%
4.65%
4.46%
3.63%
3.32%
15.15%
FINANCE
BANKS
CHEMICALS
SOFTWARE
CEMENT
OIL
AUTO ANCILLARIES
AUTO
TRANSPORTATION
RETAILING
REST
Industrial Capital Goods
Alstom T&D India Ltd. 198603 1161.43 0.67
Crompton Greaves Ltd. 500000 830.00 0.48
Industrial Products
Cummins India Ltd. 300000 2641.95 1.53
Greaves Cotton Ltd. 1715000 2500.47 1.45
SKF India Ltd. 120000 1692.06 0.98
Shakti Pumps India Ltd. 100000 202.45 0.12
Media & Entertainment
Jagran Prakashan Ltd. 1600000 2060.00 1.20
HT Media Ltd. 375000 466.69 0.27
Minerals/Mining
Gujarat Mineral Development Corp. Ltd. 1069110 1199.01 0.70
Petroleum Products
Bharat Petroleum Corp. Ltd. 400000 3243.20 1.88
Reliance Industries Ltd. 350000 2891.00 1.68
Pharmaceuticals
Torrent Pharmaceuticals Ltd.* 430000 4981.98 2.89
Dr. Reddy's Laboratories Ltd.* 133000 4640.04 2.69
Cadila Healthcare Ltd. 205000 3570.69 2.07
IPCA Laboratories Ltd. 142986 909.18 0.53
Services
Aditya Birla Nuvo Ltd. 75000 1247.93 0.72
Software
Infosys Ltd.* 410000 9095.24 5.28
Wipro Ltd. 665000 4181.85 2.43
HCL Technologies Ltd. 272220 2668.84 1.55
Telecom - Services
Bharti Airtel Ltd.* 1770000 6961.41 4.04
Tata Communications Ltd. 190000 801.80 0.47
Transportation
Gujarat Pipavav Port Ltd. 1600000 3872.80 2.25
Gateway Distriparks Ltd. 300000 1232.70 0.72
Unlisted
Nirvikara Paper Mills Ltd. 36666 35.31 0.02
Quantum Information Services 3500 0.06 0.00
Total Equity Holding 161098.98 93.55
FITPORTFOLIO
Company Name No. ofshares
Market Value` Lakhs
% ofassets
Company Name No. ofshares
Market Value` Lakhs
% ofassets
Sector Allocation - Total Assets
SIP - If you had invested 5000 every month in FIT …`
Product Label
This product is suitable for investors who are seeking*
•Long term capital appreciation
•An ELSS fund offering tax benefits under Section 80C of the Income Tax Act
* Investors should consult their financial advisers if in doubtabout whether the product is suitable for them.
**Please refer back cover for Product Label Guidelines
Past performance may or may not be sustained in the future. Returns greater than 1 year period are compounded annualized. Dividends are assumed to be reinvested andbonus is adjusted. Load is not taken in to consideration. For SIP returns, monthly investment of equal amounts invested on the 1st day of every month has been considered. For scheme performance refer pages 29-36.*B: Benchmark, AB: Additional Benchmark
14
* Top 10 holdings
Total Equity HoldingTotal Debt HoldingCall, Cash and other current assetTotal Asset
Franklin India TaxshieldThis is a Simple and Performing scheme which is eligible for distribution by new cadre of distributors.
INVESTMENT STYLE
TYPE OF SCHEME / INVESTMENT OBJECTIVE
The fund manager seeks steady growth by maintaining a diversified portfolio of equities across sectors and market cap ranges.
DATE OF ALLOTMENT
April 10, 1999
FUND MANAGER
Anand Radhakrishnan & Anil Prabhudas
FUND SIZE
` 1722.01 crores
TURNOVER
Portfolio Turnover 39.81%
VOLATILITY MEASURES (3 YEARS)Standard Deviation 3.89R-squared 0.86Beta 0.82Sharpe Ratio* 1.31
* Annualised. Risk-free rate assumed to be8.08% (based on average of 3 month T-BillRate “during last 3 months”)
#EXPENSE RATIO : 2.54%#EXPENSE RATIO (DIRECT) : 1.70%
MINIMUM INVESTMENT/MULTIPLES FOR NEW INVESTORS
` 500/500
ADDITIONAL INVESTMENT/MULTIPLES FOR EXISTING INVESTORS
` 500/500
LOAD STRUCTURE
ENTRY LOAD NilEXIT LOAD Nil
TAX BENEFITS
LOCK-IN-PERIOD
1 Year 3 Year 5 Year 7 Year 10 Year Since Inception
161098.980.00
11101.95172200.93
93.550.006.45
100.00
As on March 31, 2015
An open end Equity Linked Savings scheme with an objective to provide medium to long-term growth of capital along with income tax rebate.
Franklin Templeton Investmentswww.franklintempletonindia.com
(BROWN)HIGH RISK**
Auto
Eicher Motors Ltd. 25000 3977.04 2.31
Tata Motors Ltd. 450000 2475.90 1.44
Mahindra & Mahindra Ltd. 120000 1425.36 0.83
Bajaj Auto Ltd. 50000 1008.30 0.59
Hero Motocorp Ltd. 30000 791.94 0.46
Auto Ancillaries
Amara Raja Batteries Ltd.* 530000 4415.17 2.56
Balkrishna Industries Ltd. 330000 2141.87 1.24
Exide Industries Ltd. 1100000 1955.25 1.14
Bosch Ltd. 7000 1779.49 1.03
Apollo Tyres Ltd. 800000 1346.00 0.78
Banks
HDFC Bank Ltd.* 1080000 11045.16 6.41
ICICI Bank Ltd.* 2600000 8203.00 4.76
IndusInd Bank Ltd.* 810000 7176.60 4.17
Yes Bank Ltd.* 770000 6281.28 3.65
Kotak Mahindra Bank Ltd.* 350000 4596.38 2.67
Axis Bank Ltd. 700000 3921.40 2.28
Karur Vysya Bank Ltd. 510000 2773.89 1.61
Federal Bank Ltd. 1600000 2112.80 1.23
Punjab National Bank Ltd. 750000 1083.00 0.63
Bank of Baroda 375000 613.13 0.36
Cement
Grasim Industries Ltd. 50000 1811.18 1.05
Ultra Tech Cement Ltd. 55000 1582.85 0.92
Chemicals
Pidilite Industries Ltd. 650000 3899.03 2.26
Aarti Industries Ltd. 350000 1227.80 0.71
Construction Project
Larsen & Toubro Ltd. 250000 4299.13 2.50
Voltas Ltd. 400000 1119.40 0.65
Consumer Durables
Havell's India Ltd. 600000 1831.50 1.06
Consumer Non Durables
Marico Ltd. 900000 3471.75 2.02
United Breweries Ltd. 201000 2010.60 1.17
Asian Paints Ltd. 150000 1216.95 0.71
Finance
Credit Analysis and Research Ltd. 160000 2367.28 1.37
Crisil Ltd. 80050 1609.17 0.93
Gas
Gujarat State Petronet Ltd. 1000000 1240.50 0.72
Petronet LNG Ltd. 700000 1200.85 0.70
Total amount Invested (Rs) 60,000 180,000 300,000 420,000 600,000 960,000
Total Value as on Mar 31, 2015 (Rs) 72,935 294,554 545,566 935,160 1,623,717 7,922,552
Returns 42.51% 34.85% 24.18% 22.49% 18.92% 23.25%
Total value of B :CNX 500 66,458 253,468 444,884 709,895 1,154,441 3,867,372
B:CNX 500 Returns 20.67% 23.60% 15.78% 14.74% 12.57% 15.73%
Total value of AB : CNX NIFTY 64,955 243,309 431,690 687,753 1,148,839 3,560,482
AB:CNX NIFTY returns 15.75% 20.64% 14.55% 13.85% 12.48% 14.86%
# The rates specified are the actual average expenses charged for the month of March 2015. The above ratio includes the Service tax on Investment Management Fees. The above ratio also includes, proportionate charge in respect sales beyond T-15 cities subject to maximum of 30 bps on daily net assets, wherever applicable
Growth Plan ` 424.6269Dividend Plan ` 44.0201Direct - Growth Plan ` 431.2271Direct - Dividend Plan ` 44.7822
NAV
27.76%
9.26%
8.19%
6.76%
5.62%
4.51%
4.09%
3.89%
3.56%
3.15%
23.22%
BANKS
SOFTWARE
PHARMACEUTICALS
AUTO ANCILLARIES
AUTO
TELECOM ‐ SERVICES
INDUSTRIAL PRODUCTS
CONSUMER NON DURABLES
PETROLEUM PRODUCTS
CONSTRUCTION PROJECT
REST
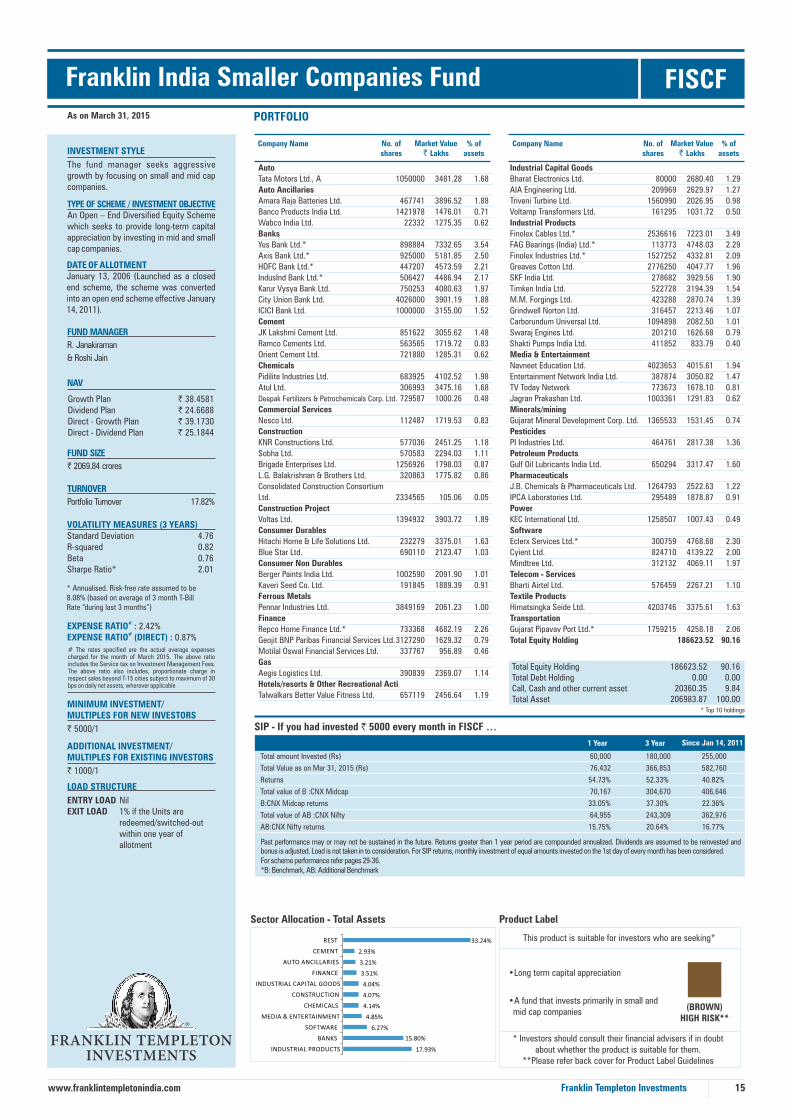
FISCFPORTFOLIO
Company Name No. ofshares
Market Value` Lakhs
% ofassets
Company Name No. ofshares
Market Value` Lakhs
% ofassets
Sector Allocation - Total Assets
SIP - If you had invested 5000 every month in FISCF …`
Product Label
This product is suitable for investors who are seeking*
•Long term capital appreciation
•A fund that invests primarily in small and mid cap companies
* Investors should consult their financial advisers if in doubtabout whether the product is suitable for them.
**Please refer back cover for Product Label Guidelines
Past performance may or may not be sustained in the future. Returns greater than 1 year period are compounded annualized. Dividends are assumed to be reinvested andbonus is adjusted. Load is not taken in to consideration. For SIP returns, monthly investment of equal amounts invested on the 1st day of every month has been considered. For scheme performance refer pages 29-36.*B: Benchmark, AB: Additional Benchmark
15
INVESTMENT STYLE
TYPE OF SCHEME / INVESTMENT OBJECTIVEAn Open – End Diversified Equity Scheme which seeks to provide long-term capital appreciation by investing in mid and small cap companies.
DATE OF ALLOTMENTJanuary 13, 2006 (Launched as a closed end scheme, the scheme was converted into an open end scheme effective January 14, 2011).
FUND MANAGER
R. Janakiraman
& Roshi Jain
FUND SIZE
` 2069.84 crores
TURNOVER
Portfolio Turnover 17.82%
VOLATILITY MEASURES (3 YEARS)Standard Deviation 4.76R-squared 0.82Beta 0.76Sharpe Ratio* 2.01
* Annualised. Risk-free rate assumed to be8.08% (based on average of 3 month T-BillRate “during last 3 months”)
#EXPENSE RATIO : 2.42%#EXPENSE RATIO (DIRECT) : 0.87%
MINIMUM INVESTMENT/MULTIPLES FOR NEW INVESTORS
` 5000/1
ADDITIONAL INVESTMENT/MULTIPLES FOR EXISTING INVESTORS
` 1000/1
Since Jan 14, 2011
Franklin India Smaller Companies Fund
LOAD STRUCTURE
ENTRY LOAD NilEXIT LOAD 1% if the Units are redeemed/switched-out within one year of allotment
As on March 31, 2015
1 Year 3 Year
Franklin Templeton Investmentswww.franklintempletonindia.com
(BROWN)HIGH RISK**
Auto
Tata Motors Ltd., A 1050000 3481.28 1.68
Auto Ancillaries
Amara Raja Batteries Ltd. 467741 3896.52 1.88
Banco Products India Ltd. 1421978 1476.01 0.71
Wabco India Ltd. 22332 1275.35 0.62
Banks
Yes Bank Ltd.* 898884 7332.65 3.54
Axis Bank Ltd.* 925000 5181.85 2.50
HDFC Bank Ltd.* 447207 4573.59 2.21
IndusInd Bank Ltd.* 506427 4486.94 2.17
Karur Vysya Bank Ltd. 750253 4080.63 1.97
City Union Bank Ltd. 4026000 3901.19 1.88
ICICI Bank Ltd. 1000000 3155.00 1.52
Cement
JK Lakshmi Cement Ltd. 851622 3055.62 1.48
Ramco Cements Ltd. 563565 1719.72 0.83
Orient Cement Ltd. 721880 1285.31 0.62
Chemicals
Pidilite Industries Ltd. 683925 4102.52 1.98
Atul Ltd. 306993 3475.16 1.68
Deepak Fertilizers & Petrochemicals Corp. Ltd. 729587 1000.26 0.48
Commercial Services
Nesco Ltd. 112487 1719.53 0.83
Construction
KNR Constructions Ltd. 577036 2451.25 1.18
Sobha Ltd. 570583 2294.03 1.11
Brigade Enterprises Ltd. 1256926 1798.03 0.87
L.G. Balakrishnan & Brothers Ltd. 320863 1775.82 0.86
Consolidated Construction Consortium
Ltd. 2334565 105.06 0.05
Construction Project
Voltas Ltd. 1394932 3903.72 1.89
Consumer Durables
Hitachi Home & Life Solutions Ltd. 232279 3375.01 1.63
Blue Star Ltd. 690110 2123.47 1.03
Consumer Non Durables
Berger Paints India Ltd. 1002590 2091.90 1.01
Kaveri Seed Co. Ltd. 191845 1889.39 0.91
Ferrous Metals
Pennar Industries Ltd. 3849169 2061.23 1.00
Finance
Repco Home Finance Ltd.* 733368 4682.19 2.26
Geojit BNP Paribas Financial Services Ltd. 3127290 1629.32 0.79
Motilal Oswal Financial Services Ltd. 337767 956.89 0.46
Gas
Aegis Logistics Ltd. 390839 2369.07 1.14
Hotels/resorts & Other Recreational Acti
Talwalkars Better Value Fitness Ltd. 657119 2456.64 1.19
Industrial Capital Goods
Bharat Electronics Ltd. 80000 2680.40 1.29
AIA Engineering Ltd. 209969 2629.97 1.27
Triveni Turbine Ltd. 1560990 2026.95 0.98
Voltamp Transformers Ltd. 161295 1031.72 0.50
Industrial Products
Finolex Cables Ltd.* 2536616 7223.01 3.49
FAG Bearings (India) Ltd.* 113773 4748.03 2.29
Finolex Industries Ltd.* 1527252 4332.81 2.09
Greaves Cotton Ltd. 2776250 4047.77 1.96
SKF India Ltd. 278682 3929.56 1.90
Timken India Ltd. 522728 3194.39 1.54
M.M. Forgings Ltd. 423288 2870.74 1.39
Grindwell Norton Ltd. 316457 2213.46 1.07
Carborundum Universal Ltd. 1094898 2082.50 1.01
Swaraj Engines Ltd. 201210 1626.68 0.79
Shakti Pumps India Ltd. 411852 833.79 0.40
Media & Entertainment
Navneet Education Ltd. 4023653 4015.61 1.94
Entertainment Network India Ltd. 387874 3050.82 1.47
TV Today Network 773673 1678.10 0.81
Jagran Prakashan Ltd. 1003361 1291.83 0.62
Minerals/mining
Gujarat Mineral Development Corp. Ltd. 1365533 1531.45 0.74
Pesticides
PI Industries Ltd. 464761 2817.38 1.36
Petroleum Products
Gulf Oil Lubricants India Ltd. 650294 3317.47 1.60
Pharmaceuticals
J.B. Chemicals & Pharmaceuticals Ltd. 1264793 2522.63 1.22
IPCA Laboratories Ltd. 295489 1878.87 0.91
Power
KEC International Ltd. 1258507 1007.43 0.49
Software
Eclerx Services Ltd.* 300759 4768.68 2.30
Cyient Ltd. 824710 4139.22 2.00
Mindtree Ltd. 312132 4069.11 1.97
Telecom - Services
Bharti Airtel Ltd. 576459 2267.21 1.10
Textile Products
Himatsingka Seide Ltd. 4203746 3375.61 1.63
Transportation
Gujarat Pipavav Port Ltd.* 1759215 4258.18 2.06
Total Equity Holding 186623.52 90.16
Total amount Invested (Rs) 60,000 180,000 255,000
Total Value as on Mar 31, 2015 (Rs) 76,432 366,853 582,760
Returns 54.73% 52.33% 40.82%
Total value of B :CNX Midcap 70,167 304,670 406,646
B:CNX Midcap returns 33.05% 37.30% 22.36%
Total value of AB :CNX Nifty 64,955 243,309 362,976
AB:CNX Nifty returns 15.75% 20.64% 16.77%
* Top 10 holdings
Total Equity HoldingTotal Debt HoldingCall, Cash and other current assetTotal Asset
186623.520.00
20360.35206983.87
90.160.009.84
100.00
# The rates specified are the actual average expenses charged for the month of March 2015. The above ratio includes the Service tax on Investment Management Fees. The above ratio also includes, proportionate charge in respect sales beyond T-15 cities subject to maximum of 30 bps on daily net assets, wherever applicable
Growth Plan ` 38.4581Dividend Plan ` 24.6688Direct - Growth Plan ` 39.1730Direct - Dividend Plan ` 25.1844
NAV
17.93%
15.80%
6.27%
4.85%
4.14%
4.07%
4.04%
3.51%
3.21%
2.93%
33.24%
INDUSTRIAL PRODUCTS
BANKS
SOFTWARE
MEDIA & ENTERTAINMENT
CHEMICALS
CONSTRUCTION
INDUSTRIAL CAPITAL GOODS
FINANCE
AUTO ANCILLARIES
CEMENT
REST

INVESTMENT STYLE
TYPE OF SCHEME / INVESTMENT OBJECTIVE
The fund manager follows a passive style of equity investing
DATE OF ALLOTMENTAugust 4, 2000
FUND MANAGER
Anil Prabhudas
FUND SIZE
` 205.66 crores
MINIMUM INVESTMENT/MULTIPLES FOR NEW INVESTORS
` 5000/1
ADDITIONAL INVESTMENT/MULTIPLES FOR EXISTING INVESTORS
` 1000/1
LOAD STRUCTURE
ENTRY LOAD NilEXIT LOAD 1% (if redeemed/switched- out within 30 days from date of allotment)
PORTFOLIO - TOP 10 HOLDINGS
Company Name No. ofshares
Market Value` Lakhs
% ofassets
Franklin India Index Fund - NSE NIFTY PLANThis is a Simple and Performing scheme which is eligible for distribution by new cadre of distributors.
FIIF
This product is suitable for investors who are seeking*
•Long term capital appreciation
•A fund that invests in stocks of companies in the Information Technology sector
* Investors should consult their financial advisers if in doubtabout whether the product is suitable for them.
**Please refer back cover for Product Label Guidelines
This product is suitable for investors who are seeking*
•Long term capital appreciation
•A passively managed index fund
* Investors should consult their financial advisers if in doubtabout whether the product is suitable for them.
**Please refer back cover for Product Label Guidelines
Franklin Infotech Fund FIF
16
INVESTMENT STYLE
TYPE OF SCHEME / INVESTMENT OBJECTIVE
The fund manager seeks growth of capital by focusing on companies in the information technology sector
DATE OF ALLOTMENTAugust 22, 1998
FUND MANAGER Anand Radhakrishnan
FUND SIZE` 175.27 crores
MINIMUM INVESTMENT/MULTIPLES FOR NEW INVESTORS ` 5000/1
ADDITIONAL INVESTMENT/MULTIPLES FOR EXISTING INVESTORS ` 1000/1
VOLATILITY MEASURES (3 YEARS)Standard Deviation 6.30R-squared 0.93Beta 0.89Sharpe Ratio* 0.61
PORTFOLIO TURNOVER 10.06%
* Annualised. Risk-free rate assumed to be 8.08% (based on average of 3 month T-Bill Rate “during last 3 months”)
#EXPENSE RATIO : 2.74%#EXPENSE RATIO (DIRECT) : 2.21%
LOAD STRUCTURE
Company Name No. ofshares
Market Value` Lakhs
% ofassets
As on March 31, 2015
As on March 31, 2015
* Top 10 Holdings
Product Label
Product Label
# EXPENSE RATIO : 1.05%#EXPENSE RATIO (DIRECT) : 0.70%
NAV
Software
Infosys Ltd.* 260000 5767.71 32.91
Tata Consultancy Services Ltd.* 190000 4852.51 27.69
Wipro Ltd.* 270000 1697.90 9.69
Cyient Ltd.* 200000 1003.80 5.73
HCL Technologies Ltd.* 70000 686.28 3.92
Tech Mahindra Ltd.* 104000 654.89 3.74
Oracle Financial Services Software Ltd.* 15000 489.01 2.79
Eclerx Services Ltd.* 30000 475.67 2.71
Mindtree Ltd.* 10000 130.37 0.74
Firstsource Solutions Ltd. 400000 123.40 0.70
Franklin Technology Fund, Class J* 127117.737 1185.02 6.76
Unlisted
Collabera Solutions Private Ltd. 970000 0.10 0.00
Total Equity Holding 17066.63 97.37
Franklin Templeton Investmentswww.franklintempletonindia.com
(BROWN)HIGH RISK**
(BROWN)HIGH RISK**
@Effective August 22, 2014 Franklin India Index Fund – BSE Sensex Plan (FIIF-Sensex) has been merged into Franklin India Index Fund – NSE Nifty Plan (FIIF-Nifty)
Company Name No. ofshares
Market Value` Lakhs
% ofassets
ENTRY LOAD NilEXIT LOAD 1% if redeemed/switched- out within two years of allotment
Total Equity HoldingTotal Debt HoldingCall, Cash and other current assetTotal Asset
17066.630.00
460.7917527.42
97.370.002.63
100.00
* Top 10 Holdings
Company Name No. ofshares
Market Value` Lakhs
% ofassets
Total Equity Holding
Total Debt Holding
Call, Cash and other current asset
Total Asset
20434.34
0.00
132.10
20566.44
99.36
0.00
0.64
100.00
Tata Consultancy Services Ltd.* 35649 910.46 4.43
Tata Motors Ltd.* 125035 687.94 3.34
Axis Bank Ltd.* 118180 662.04 3.22
An open-end growth scheme with an objective to provide long-term capital appreciation by investing primarily in the information technology industry.
PORTFOLIO
# The rates specified are the actual average expenses charged for the month of March 2015. The above ratio includes the Service tax on Investment Management Fees. The above ratio also includes, proportionate charge in respect sales beyond T-15 cities subject to maximum of 30 bps on daily net assets, wherever applicable
# The rates specified are the actual average expenses charged for the month of March 2015. The above ratio includes the Service tax on Investment Management Fees. The above ratio also includes, proportionate charge in respect sales beyond T-15 cities subject to maximum of 30 bps on daily net assets, wherever applicable
Growth Plan ` 66.8330Dividend Plan ` 66.8330Direct - Growth Plan ` 67.2888Direct - Dividend Plan ` 67.2888
Growth Plan ` 116.1432Dividend Plan ` 26.3461Direct - Growth Plan ` 117.3704Direct - Dividend Plan ` 26.6522
NAV
Infosys Ltd.* 69535 1542.53 7.50
109675 1442.99 7.02
HDFC Bank Ltd.* 130563 1335.27 6.49
ICICI Bank Ltd.* 403141 1271.91 6.18
ITC Ltd.* 388800 1266.90 6.16
Larsen & Toubro Ltd.* 56839 977.43 4.75
Reliance Industries Ltd.* 114432 945.21 4.60
Housing Development Finance Corp. Ltd.*
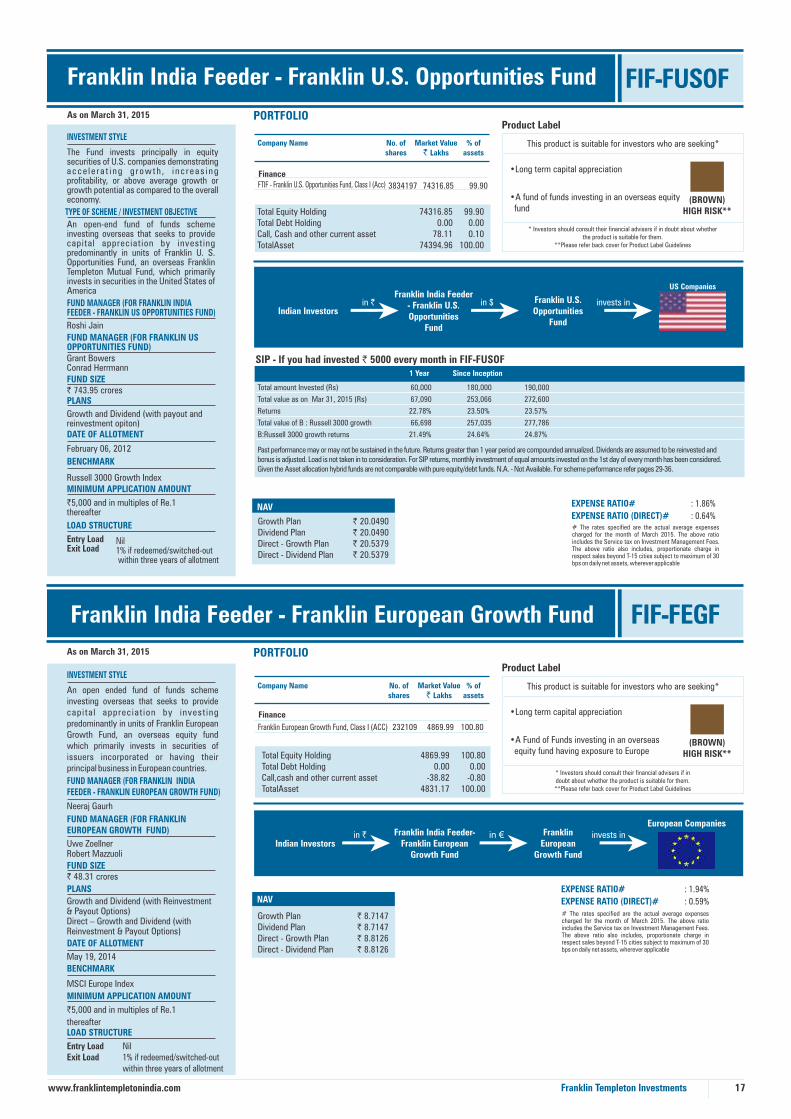
As on March 31, 2015 PORTFOLIO
An open ended fund of funds scheme investing overseas that seeks to provide capita l appreciat ion by invest ing predominantly in units of Franklin European Growth Fund, an overseas equity fund which primarily invests in securities of issuers incorporated or having their principal business in European countries.
Franklin India Feeder - Franklin European Growth Fund
FUND MANAGER (FOR FRANKLIN INDIA FEEDER - FRANKLIN EUROPEAN GROWTH FUND)
Neeraj Gaurh
FUND MANAGER (FOR FRANKLIN EUROPEAN GROWTH FUND)
Uwe Zoellner Robert Mazzuoli
FUND SIZE` 48.31 crores
PLANS
Growth and Dividend (with Reinvestment & Payout Options) Direct – Growth and Dividend (with Reinvestment & Payout Options)
DATE OF ALLOTMENT
May 19, 2014
BENCHMARK
MSCI Europe Index
MINIMUM APPLICATION AMOUNT
`5,000 and in multiples of Re.1
thereafterLOAD STRUCTURE
Entry LoadExit Load
Nil1% if redeemed/switched-out within three years of allotment
INVESTMENT STYLE
(BROWN)HIGH RISK**
This product is suitable for investors who are seeking*
•Long term capital appreciation
•A fund of funds investing in an overseas equity fund
* Investors should consult their financial advisers if in doubt about whether the product is suitable for them.
**Please refer back cover for Product Label Guidelines
Product Label As on March 31, 2015 PORTFOLIO
Company Name No. ofshares
Market Value` Lakhs
% ofassets
Past performance may or may not be sustained in the future. Returns greater than 1 year period are compounded annualized. Dividends are assumed to be reinvested andbonus is adjusted. Load is not taken in to consideration. For SIP returns, monthly investment of equal amounts invested on the 1st day of every month has been considered.Given the Asset allocation hybrid funds are not comparable with pure equity/debt funds. N.A. - Not Available. For scheme performance refer pages 29-36.
1 Year Since Inception
SIP - If you had invested 5000 every month in FIF-FUSOF`
The Fund invests principally in equity securities of U.S. companies demonstrating a c c e l e r a t i n g g r o w t h , i n c r e a s i n g profitability, or above average growth or growth potential as compared to the overall economy.
Franklin India Feeder - Franklin U.S. Opportunities Fund FIF-FUSOF
FUND MANAGER (FOR FRANKLIN INDIA FEEDER - FRANKLIN US OPPORTUNITIES FUND)
Roshi Jain
FUND MANAGER (FOR FRANKLIN USOPPORTUNITIES FUND)Grant Bowers Conrad HerrmannFUND SIZE` 743.95 croresPLANS
Growth and Dividend (with payout andreinvestment opiton)DATE OF ALLOTMENT
February 06, 2012
EXPENSE RATIO#
EXPENSE RATIO (DIRECT)#
: 1.86%
: 0.64%
BENCHMARK
Russell 3000 Growth IndexMINIMUM APPLICATION AMOUNT
`5,000 and in multiples of Re.1thereafter
LOAD STRUCTURE
Entry LoadExit Load
Nil1% if redeemed/switched-out within three years of allotment
INVESTMENT STYLE
17
FIF-FEGF
(BROWN)HIGH RISK**
This product is suitable for investors who are seeking*
•Long term capital appreciation
•A Fund of Funds investing in an overseas equity fund having exposure to Europe
* Investors should consult their financial advisers if in doubt about whether the product is suitable for them.**Please refer back cover for Product Label Guidelines
Product Label
Company Name No. ofshares
Market Value` Lakhs
% ofassets
Indian Investors in ` Franklin India Feeder-
Franklin EuropeanGrowth Fund
in € FranklinEuropean
Growth Fund
invests inEuropean Companies
4869.990.00
-38.824831.17
Indian Investorsin `
Franklin India Feeder - Franklin U.S. Opportunities
Fund
in $ Franklin U.S.Opportunities
Fund
invests in
US Companies
Franklin Templeton Investmentswww.franklintempletonindia.com
An open-end fund of funds scheme investing overseas that seeks to provide capital appreciation by investing predominantly in units of Franklin U. S. Opportunities Fund, an overseas Franklin Templeton Mutual Fund, which primarily invests in securities in the United States of America
TYPE OF SCHEME / INVESTMENT OBJECTIVE Total Equity HoldingTotal Debt HoldingCall, Cash and other current assetTotalAsset
74316.850.00
78.1174394.96
99.900.000.10
100.00
Total amount Invested (Rs) 60,000 180,000 190,000
Total value as on Mar 31, 2015 (Rs) 67,090 253,066 272,600
Returns 22.78% 23.50% 23.57%
Total value of B : Russell 3000 growth 66,698 257,035 277,786
B:Russell 3000 growth returns 21.49% 24.64% 24.87%
100.800.00
-0.80100.00
Total Equity HoldingTotal Debt HoldingCall,cash and other current assetTotalAsset
NAV
Finance
3834197 74316.85 99.90
Finance
232109 4869.99 100.80
# The rates specified are the actual average expenses charged for the month of March 2015. The above ratio includes the Service tax on Investment Management Fees. The above ratio also includes, proportionate charge in respect sales beyond T-15 cities subject to maximum of 30 bps on daily net assets, wherever applicable
EXPENSE RATIO#
EXPENSE RATIO (DIRECT)#
: 1.94%
: 0.59%# The rates specified are the actual average expenses charged for the month of March 2015. The above ratio includes the Service tax on Investment Management Fees. The above ratio also includes, proportionate charge in respect sales beyond T-15 cities subject to maximum of 30 bps on daily net assets, wherever applicable
Growth Plan ` 20.0490Dividend Plan ` 20.0490Direct - Growth Plan ` 20.5379Direct - Dividend Plan ` 20.5379
Growth Plan ` 8.7147Dividend Plan ` 8.7147Direct - Growth Plan ` 8.8126Direct - Dividend Plan ` 8.8126
NAV
Franklin European Growth Fund, Class I (ACC)
FTIF - Franklin U.S. Opportunities Fund, Class I (Acc)

FIMAS asset allocation as of March 31, 2015 is as follows.
The applicable date is April 7, 2015.
Comments : Increased equities by 1.3% while decreased fixed income by 1.2%.
Product Label
This product is suitable for investors who are seeking*
•Long term capital appreciation
•A hybrid fund of funds investing in equity and debt mutual funds
* Investors should consult their financial advisers if in doubtabout whether the product is suitable for them.
**Please refer back cover for Product Label Guidelines
(BROWN)HIGH RISK**
18
INVESTMENT STYLE
NAV
FUND SIZE` 805.66 crores
MINIMUM INVESTMENT/MULTIPLES FOR NEW INVESTORS
` 5000/1ADDITIONAL INVESTMENT/MULTIPLES FOR EXISTING INVESTORS` 1000/1LOAD STRUCTURE
ENTRY LOAD NilEXIT LOAD In respect of each purchase of Units -1% if redeemed within 1 year of allotment
DATE OF ALLOTMENTOctober 31, 2003FUND MANAGERAnand Radhakrishnan
PORTFOLIO COMPOSITION AND PERFORMANCE
How Does The Scheme Work?
The scheme changes its Asset allocation based on the weighted average PE ratio of the NSE NIFTY Index. At higher PE levels, it reduces allocation to equities in order to minimise downside risk. Similarly at lower PE levels, it increases allocation to equities to capitalise on their upside potential. Historically, such a strategy of varying the allocation of equity and debt/money market instruments based on the PE ratio has delivered superior risk-adjusted returns over the long term, although there is no guarantee that will be repeated in the future. The equity component of the scheme is invested in Franklin India Bluechip Fund (FIBCF), an open end diversified equity scheme investing predominantly in large cap stocks and the debt/money market component is invested in Franklin India Short Term Income Plan (FISTIP), an open end income scheme investing in government securities, PSU bonds and corporate debt.
An open end fund of funds which seeks to provide long-term capital appreciation with relatively lower volatil ity through a dynamically balanced portfolio of equity and income funds.
Asset Allocation for March 2014.
FIDPEFFranklin India Dynamic PE Ratio Fund of Funds
If weighted averagePE ratio of NSE
Nifty falls inthis band...
Upto 1212 - 1616 - 2020 - 2424 - 28
Above 28
...the equitycomponentwill be...(%)
90 - 10070 - 9050 - 7030 - 5010 - 300 - 10
0 - 1010 - 3030 - 5050 - 7070 - 9090 - 100
...and the debtcomponent
will be ... (%)
FIDPEF's Investment strategy
As on March 31, 2015
The weighted average PE ratio of NSE Nifty as on 31.03.2015 was 19.15. Hence, the asset allocation for the scheme in April 2015 will be...
Equity Fund : 55% Fixed Income Fund : 45%
The applicable date is March 31, 2015.
TYPE OF SCHEME / INVESTMENT OBJECTIVE
Franklin Templeton Investmentswww.franklintempletonindia.com
EXPENSE RATIO* : 1.86%EXPENSE RATIO* (DIRECT) : 0.92%# The rates specified are the actual average expenses charged for the month of March 2015. The above ratio includes the Service tax on Investment Management Fees. The above ratio also includes, proportionate charge in respect sales beyond T-15 cities subject to maximum of 30 bps on daily net assets, wherever applicable
The fund managers follow a dynamic Asset allocation strategy, determining the allocation to the underlying schemes based on the monthend weighted average PE ratio of the CNX NIFTY Index. Any change in Asset allocation due to change in the market PE ratio is done in the following month.
As on March 31, 2015
PORTFOLIO COMPOSITION AND PERFORMANCE
How Does The Scheme Work?
Franklin India Multi-Asset Solution Fund (FIMAS) is an open-end fund of fund scheme which seeks to provide an asset allocation solution to the investors. The asset allocation is dynamically managed across Equity, Debt, Gold and Money Market based on proprietary model. The fund proposes to primarily invest in Franklin Templeton's existing local equity, fixed income, liquid products and in domestic Gold ETFs. The proprietary model uses a mix of strategic and tactical allocation. The strategic allocation stems from a combination of quantitative and qualitative analysis and it determines long term allocation to different asset classes. In order to determine the tactical allocation, the model uses a combination of economic, valuation and momentum / sentiment indicators to determine the allocation towards a particular asset class/security. The fund dynamically changes its allocation to different asset classes on monthly basis.
FUND SIZE` 129.56 crores
MINIMUM INVESTMENT/MULTIPLES FOR NEW INVESTORS
` 5000
ADDITIONAL INVESTMENT/MULTIPLES FOR EXISTING INVESTORS
` 1000
LOAD STRUCTUREENTRY LOAD NilEXIT LOAD In respect of each purchase of Units -1% if redeemed within 3 year of allotment
DATE OF ALLOTMENT November 28, 2014
FUND MANAGERAnand Radhakrishnan(w.e.f. Feb 27, 2015)
An open end fund of funds which seeks to a c h i e v e c a p i t a l a p p r e c i a t i o n a n d diversification through a mix of strategic and tactical allocation to various asset classes such as equity, debt, gold and cash by investing in funds investing in these asset classes.
TYPE OF SCHEME / INVESTMENT OBJECTIVE
Product Label
This product is suitable for investors who are seeking*
•Long term capital appreciation
•A Fund of Funds investing in diversified asset classes through a mix of strategic and tactical allocation
* Investors should consult their financial advisers if in doubtabout whether the product is suitable for them.
**Please refer back cover for Product Label Guidelines
(BROWN)HIGH RISK**
EXPENSE RATIOEXPENSE RATIO (DIRECT)
: 1.85%: 0.15%
# The rates specified are the actual average expenses charged for the month of March 2015. The above ratio includes the Service tax on Investment Management Fees. The above ratio also includes, proportionate charge in respect sales beyond T-15 cities subject to maximum of 30 bps on daily net assets, wherever applicable
Franklin India Multi – Asset Solution Fund FIMAS
Past performance may or may not be sustained in the future. Returns greater than 1 year period are compounded annualized. Dividends are assumed to be reinvested andbonus is adjusted. Load is not taken in to consideration. For SIP returns, monthly investment of equal amounts invested on the 1st day of every month has been considered. For scheme performance refer pages 29-36.*B: Benchmark, AB: Additional Benchmark
1 year Since Inception3 year 5 year 7 year
SIP - If you had invested ` 5000 every month in FIDPEF …
10 Year
Total Amount Invested (Rs.) 60,000 180,000 300,000 420,000 600,000 685,000
Total Value as on Mar 31, 2015 (Rs) 65,918 232,312 419,434 674,663 1,193,617 1,631,501
Returns 18.91% 17.34% 13.39% 13.32% 13.20% 14.37%
Total Value of B:S&P BSE Sensex 64,000 240,755 426,832 679,529 1,132,027 1,555,434
B:S&P BSE Sensex Returns 12.67% 19.89% 14.10% 13.52% 12.20% 13.61%
Total Value of B:Crisil Balanced Fund Index 64,785 231,734 414,762 650,188 1,078,752 1,388,207
B:Crisil Balanced Fund Index Returns 15.22% 17.16% 12.94% 12.28% 11.30% 11.78%
Addl Benchmark Value/returns Not Applicable Not Applicable Not Applicable Not Applicable Not Applicable Not Applicable
Asset Allocation for February 2015.
Asset
Equity
Fixed Income
Gold
Cash
Instrument
Franklin India Bluechip Fund
Franklin India Short Term Income Plan
Goldman Sachs Gold ETF
Franklin India Treasury Management
Account
40.30%
38.50%
21.30%
0.00%
Total Portfolio Allocation
Growth Plan ` 61.5933Dividend Plan ` 39.5664Direct - Growth Plan ` 62.7536Direct - Dividend Plan ` 40.3727
NAV
Growth Plan ` 10.1921Dividend Plan ` 10.1921Direct - Growth Plan ` 10.2484Direct - Dividend Plan ` 10.2484
Company Name No. ofshares
Market Value` Lakhs
% ofassets
Finance
171158.33 5010.56 38.67
Franklin India Bluechip Fund, Class G* 1364398.56 4937.14 38.11
Goldman Sachs Gold Exchange Traded
Scheme-GS Gold BeES* 119164 2858.68 22.07
Total Equity Holding 12806.39 98.85
12806.390.00
149.6112956.00
98.850.001.15
100.00
Total Equity HoldingTotal Debt HoldingCall,cash and other current assetTotalAsset
PORTFOLIO
Franklin India Short Term Income Plan, Class G,*

FILSFFranklin India Life Stage Fund of Funds
19
INVESTMENT STYLE
TYPE OF SCHEME / INVESTMENT OBJECTIVE
PORTFOLIO COMPOSITION
How Does The Scheme Work?The scheme invests in a combination of Franklin Templeton India’s equity and
income schemes, with a steady state allocation as shown below. The debt and
equity allocation is automatically rebalanced every 6 months to revert to the
steady state levels.
FILSF's Investment strategy
Steady State Asset Allocation
The 20s Plan
The 30s Plan
The 40s Plan
The 50s Plus Plan
The 50s FloatingRate Plan
80%
55%
35%
20%
20%
Equity
20%
45%
65%
80%
80%
DebtUnderlying schemes
FIBCF
50%
35%
20%
10%
15%
FIPF
15%
10%
10%
0%
0%
TIGF
15%
10%
5%
10%
5%
FIDA
10%
25%
35%
50%
0%
FIIBA
10%
20%
30%
30%
0%
FISPF
-
-
-
-
80%
The 20s Plan:The 30s Plan:The 40s Plan:The 50s Plus Plan:The 50s Plus Floating Rate Plan
` 13.41 crores 7.59 crores`13.66 crores` 10.67 crores` 36.65 crores`
Fund size
Load structure
Entry Load
Exit Load:
20’s Plan
50’s Plus Plan And
50’s Plus Floating
Rate Plan
30’s Plan
40’s Plan
Nil for all the plans
In respect of each purchase of Units - 1%
if redeemed within 1 year of allotment
In respect of each purchase of Units – 0.75%if redeemed within 1 year of allotmentIn respect of each purchase of Units – 0.75%if redeemed within 1 year of allotment
In respect of each purchase of Units – 1%if redeemed within 1 year of allotment
(YELLOW)MEDIUM RISK**
Product Label - FILSF 40’s/50’s + & 50’s+ Floating rate Plan
This product is suitable for investors who are seeking*
•Long term capital appreciation
•A fund of funds investing in equity and debt mutual funds
* Investors should consult their financial advisers if in doubtabout whether the product is suitable for them.
**Please refer back cover for Product Label Guidelines
Product Label - FILSF 20’s/30’s Plan
(BROWN)HIGH RISK**
This product is suitable for investors who are seeking*
* Investors should consult their financial advisers if in doubtabout whether the product is suitable for them.
**Please refer back cover for Product Label Guidelines
•Long term capital appreciation
•A fund of funds investing in equity and debt mutual funds
As on March 31, 2015
DATE OF ALLOTMENT
December 1, 2003
July 9, 2004
(The 50s Plus
Floating Rate Plan)
FUND MANAGER
Anand Radhakrishnan, Sachin Padwal-Desai &Pallab Roy
EXPENSE RATIO*
MINIMUM INVESTMENT/MULTIPLES FOR NEW INVESTORS
` 5000/1
ADDITIONAL INVESTMENT/
MULTIPLES FOR EXISTING INVESTORS
` 1000/1
MINIMUM INVESTMENT FOR SYSTEMATIC INVESTMENT PLAN
Minimum of 12 cheques of ` 2000 or more each
Minimum of 6 cheques of ` 4000 or more each
The fund managers maintain the allocation to the underlying schemes by rebalancing the portfolio once in 6 months to the steady state levels. Moreover, based on market conditions, the portfolio managers can make a tactical allocation of 10% on either side of the steady state Asset allocation.
An open end fund of funds which seeks to generate superior risk adjusted returns to investors in line with their chosen Asset allocation.
As on March 31, 2015 PORTFOLIO - TOP 10 HOLDINGS
(BROWN)HIGH RISK**
This product is suitable for investors who are seeking*
•Long term capital appreciation with current income
•A fund that invests both in stocks and fixed income instruments offering a balanced exposure to the Asset classes
* Investors should consult their financial advisers if in doubt about whether the product is suitable for them.
**Please refer back cover for Product Label Guidelines
Product Label
Company Name No. ofshares
Market Value` Lakhs
% ofassets
Company Name No. ofshares
Market Value` Lakhs
% ofassets
FIBF
#EXPENSE RATIO : 3.00%#EXPENSE RATIO (DIRECT) : 2.18%
# The rates specified are the actual average expenses charged for the month of March 2015. The above ratio includes the Service tax on Investment Management Fees. The above ratio also includes, proportionate charge in respect sales beyond T-15 cities subject to maximum of 30 bps on daily net assets, wherever applicable
MINIMUM INVESTMENT/MULTIPLES FOR NEW INVESTORS
` 5000/1
ADDITIONAL INVESTMENT/MULTIPLES FOR EXISTING INVESTORS
` 1000/1
LOAD STRUCTUREENTRY LOAD NilEXIT LOAD In respect of each purchase of Units - 1% if the Units are redeemed/switched-out within one year of allotment
DATE OF ALLOTMENT
December 10, 1999
NAV
Growth Plan
Dividend Plan
Direct - Growth Plan
Direct - Dividend Plan
FUND MANAGER
Anand Radhakrishnan, Anil Prabhudas,Sachin Padwal-Desai & Umesh Sharma
* Top 10 holdings
FUND SIZE` 399.16 crores
TYPE OF SCHEME / INVESTMENT OBJECTIVE
An open-end balanced scheme with an objective to provide long term growth of capital and current income by investing in equity, equity related securities and fixed income instruments.
INVESTMENT STYLEThe fund manager seeks to strike an optimum balance between growth and stability, by maintaining a diversified portfolio of equities and managing interest rate movements and credit risk on the fixed income component
26263.9112887.92
764.4339916.26
` 90.3392
` 24.0157
` 91.5675
` 24.3646
Franklin Templeton Investmentswww.franklintempletonindia.com
YTM is the weighted average yield of portfolio based on the security level yield. Security level yield for securities with maturity greater than 60 days is the simple average of yield provided by AMFI designated agencies and for securities with maturity up to 60 days it is the last traded / valuation yield.
BOND PORTFOLIOAVERAGE MATURITY 12.05 Years
8.34%*YIELD TO MATURITYMODIFIED DURATION 6.74 Years**
* pre fund expenses
Franklin India Balanced Fund
65.8032.291.92
100.00
Total Equity HoldingTotal Debt HoldingCall,Cash and other current assetTotal Asset
**Modified duration of floating rate securities is calculated based on the next reset date.
@Effective August 8, 2014 Templeton India Children’s Asset Plan – Gift Plan has been merged into Franklin India Balanced Fund
The 20s Plan: 1.14%The 30s Plan: 1.61%The 40s Plan: 1.61%The 50s Plus Plan: 1.72%The 50s Plus FloatingRate Plan: 0.79%
(Direct) : 0.81%(Direct) : 1.16%(Direct) : 1.17%(Direct) : 1.24%
(Direct) : 0.41%
NAV
The 20s Plan
The 30s Plan
The 40s Plan
The 50s Plus Plan
The 50s Plus Floating
Rate Plan
Growth
` 62.2134
` 44.7475
` 35.8722
` 26.7568
` 28.2131
Dividend
` 31.6282
` 24.5077
` 15.6212
` 13.5769
` 14.4572
NAV (Direct)
The 20s PlanThe 30s PlanThe 40s PlanThe 50s Plus PlanThe 50s Plus FloatingRate Plan
Growth` 62.9196` 45.2086` 36.2052` 27.0340
` 28.4635
Dividend` 32.0422` 24.7955` 15.7840` 13.7366
` 14.5995
Auto
Eicher Motors Ltd.* 6800 1081.75 2.71
Banks
HDFC Bank Ltd.* 195000 1994.27 5.00
Yes Bank Ltd.* 148700 1213.02 3.04
ICICI Bank Ltd.* 360000 1135.80 2.85
Kotak Mahindra Bank Ltd.* 82400 1082.12 2.71
IndusInd Bank Ltd.* 119000 1054.34 2.64
Axis Bank Ltd.* 175000 980.35 2.46
Pharmaceuticals
Torrent Pharmaceuticals Ltd.* 91793 1063.51 2.66
Software
Infosys Ltd.* 57820 1282.65 3.21
Telecom - Services
Bharti Airtel Ltd.* 328000 1290.02 3.23
# The rates specified are the actual average expenses charged for the month of March 2015. The above ratio includes the Service tax on Investment Management Fees. The above ratio also includes, proportionate charge in respect sales beyond T-15 cities subject to maximum of 30 bps on daily net assets, wherever applicable

As on March 31, 2015 PORTFOLIO
Company Name No. ofshares
Market Value` Lakhs
% ofassets
Company Name No. ofshares
Market Value` Lakhs
% ofassets
Sector Allocation - Equity Holdings Product Label
This product is suitable for investors who are seeking*
•Long term capital appreciation
•A hybrid fund investing upto 40% in equities and the balance in high quality fixed income instruments
* Investors should consult their financial advisers if in doubtabout whether the product is suitable for them.
**Please refer back cover for Product Label Guidelines
(YELLOW)MEDIUM RISK**
20
* Top 10 holdings
INVESTMENT STYLE
TYPE OF SCHEME / INVESTMENT OBJECTIVEAn open-end tax saving scheme whose objective is to provide investors regular income under the Dividend Plan and capital appreciation under the Growth Plan.
DATE OF ALLOTMENTMarch 31, 1997
FUND MANAGER
Anand Radhakrishnan, Anil Prabhudas,
Sachin Padwal-Desai & Umesh Sharma
FUND SIZE
` 334.56 crores
#EXPENSE RATIO : 2.45%#EXPENSE RATIO (DIRECT) : 1.79%
MINIMUM INVESTMENT/MULTIPLES FOR NEW INVESTORS
` 500/1
ADDITIONAL INVESTMENT/MULTIPLES FOR EXISTING INVESTORS
` 500/1
SIP - If you had invested 5000 every month in FIPEP …`
Past performance may or may not be sustained in the future. Returns greater than 1 year period are compounded annualized. Dividends are assumed to be reinvested andbonus is adjusted. Load is not taken in to consideration. For SIP returns, monthly investment of equal amounts invested on the 1st day of every month has been considered. For scheme performance refer pages 29-36.*B: Benchmark, AB: Additional Benchmark## Benchmark: 40% CNX 50 + 60% Crisil Composite Bond Fund Index
10 Year Since Inception
Franklin India Pension Plan
LOAD STRUCTURE
ENTRY LOAD NilEXIT LOAD 3%, if redeemed before the age of 58 years (subject to lock-in period) and target amount Nil, if redeemed after the age of 58 years
TAX BENEFITS
LOCK-IN PERIOD & MINIMUM TARGET INVESTMENT
All subscriptions in FIPEP are locked in for a period of 3 full financial years. Minimum target investment ` 10,000 before the age of 60 years.
*Conditions Apply
1 Year 3 Year 5 Year 7 Year
Debt Holdings Rating Market Value
(Rs. in Lakhs)
% of
Assets
AVERAGE MATURITY YIELD TO MATURITY MODIFIED DURATION
12.47 years8.23%*7.10 years**
* pre fund expenses
**Modified duration of floating ratesecurities is calculated based on thenext reset date.
The fund manager seeks steady capital appreciation by maintaining a diversified portfolio of equities and seeks to earn regular income on the fixed income component by managing interest rate movements and credit risk.
Total Equity HoldingTotal Debt HoldingCall, cash and other current assetTotal Asset
Franklin Templeton Investmentswww.franklintempletonindia.com
YTM is the weighted average yield of portfolio based on the security level yield. Security level yield for securities with maturity greater than 60 days is the simple average of yield provided by AMFI designated agencies and for securities with maturity up to 60 days it is the last traded / valuation yield.
Auto
Eicher Motors Ltd.* 3300 524.97 1.57
Tata Motors Ltd. 62000 341.12 1.02
Mahindra & Mahindra Ltd. 13100 155.60 0.47
Hero Motocorp Ltd. 5000 131.99 0.39
Auto Ancillaries
Amara Raja Batteries Ltd. 45000 374.87 1.12
Balkrishna Industries Ltd. 34000 220.68 0.66
Banks
HDFC Bank Ltd.* 102000 1043.15 3.12
ICICI Bank Ltd.* 211500 667.28 1.99
IndusInd Bank Ltd.* 69400 614.88 1.84
Yes Bank Ltd.* 71700 584.89 1.75
Kotak Mahindra Bank Ltd.* 44500 584.40 1.75
Axis Bank Ltd.* 84000 470.57 1.41
Karur Vysya Bank Ltd. 47000 255.63 0.76
Bank of Baroda 75000 122.63 0.37
Cement
Ultra Tech Cement Ltd. 4400 126.63 0.38
Chemicals
Pidilite Industries Ltd. 57000 341.91 1.02
Construction Project
Larsen & Toubro Ltd. 21600 371.44 1.11
Consumer Non Durables
Marico Ltd. 71000 273.88 0.82
Asian Paints Ltd. 28000 227.16 0.68
United Breweries Ltd. 15000 150.05 0.45
Gas
Gujarat State Petronet Ltd. 143000 177.39 0.53
Industrial Products
Cummins India Ltd. 32100 282.69 0.84
Greaves Cotton Ltd. 130000 189.54 0.57
Media & Entertainment
Jagran Prakashan Ltd. 167000 215.01 0.64
Petroleum Products
Bharat Petroleum Corp. Ltd. 38000 308.10 0.92
Reliance Industries Ltd. 31000 256.06 0.77
Pharmaceuticals
Torrent Pharmaceuticals Ltd.* 40400 468.07 1.40
Dr. Reddy's Laboratories Ltd. 11600 404.70 1.21
Cadila Healthcare Ltd. 19500 339.65 1.02
FIPEP
Total Amount Invested (Rs.) 60,000 180,000 300,000 420,000 600,000 1,080,000Total Value as on Mar 31, 2015 (Rs) 68,783 245,596 448,589 697,358 1,131,574 4,038,289Returns 28.39% 21.32% 16.12% 14.24% 12.20% 13.18%Total Value of Benchmark## 65,285 226,988 406,415 628,274 1,023,343 N.ABenchmark## Returns 16.83% 15.70% 12.11% 11.32% 10.30% N.ATotal Value of AB:Crisil 10 Year Gilt Index 64,880 205,386 363,245 534,343 843,077 N.AAB:Crisil 10 Year Gilt Index returns 15.51% 8.78% 7.59% 6.78% 6.62% N.A
13306.7018677.481471.42
33455.60
39.7755.834.40
100.00
# The rates specified are the actual average expenses charged for the month of March 2015. The above ratio includes the Service tax on Investment Management Fees. The above ratio also includes, proportionate charge in respect sales beyond T-15 cities subject to maximum of 30 bps on daily net assets, wherever applicable
Growth Plan ` 98.0807Dividend Plan ` 17.8008Direct - Growth Plan ` 99.3763Direct - Dividend Plan ` 18.0547
NAV
Services
Aditya Birla Nuvo Ltd. 7000 116.47 0.35
Software
Infosys Ltd.* 31300 694.34 2.08
HCL Technologies Ltd. 36000 352.94 1.05
Wipro Ltd. 52400 329.52 0.98
Telecom - Services
Bharti Airtel Ltd.* 152000 597.82 1.79
Tata Communications Ltd. 50000 211.00 0.63
Transportation
Gujarat Pipavav Port Ltd. 178000 430.85 1.29
Gateway Distriparks Ltd. 84000 345.16 1.03
Unlisted
Nirvikara Paper Mills Ltd. 3777 3.64 0.01
Total Equity Holding 13306.70 39.77
8.60% GOI 2028 SOVEREIGN 5187.61 15.51
8.15% GOI 2026 SOVEREIGN 4540.87 13.57
9.23% GOI 2043 SOVEREIGN 2883.79 8.62
8.40% GOI 2024 SOVEREIGN 2399.48 7.17
HPCL-MITTAL PIPELINES LTD ICRA AA- 2798.84 8.37
ANDHRA PRADESH EXPRESSWAY LTD ICRA AAA(SO) 832.72 2.49
POWER GRID CORP OF INDIA LTD CRISIL AAA 34.17 0.10
Total Debt Holding 18677.48 55.83
32.64%
10.35%
9.11%
8.67%
6.08%
5.83%
4.89%
4.48%
4.24%
3.55%
10.16%
BANKS
SOFTWARE
PHARMACEUTICALS
AUTO
TELECOM ‐ SERVICES
TRANSPORTATION
CONSUMER NON DURABLES
AUTO ANCILLARIES
PETROLEUM PRODUCTS
INDUSTRIAL PRODUCTS
REST

Company Name No. ofshares
Market Value` Lakhs
% ofassets
Company Name No. ofshares
Market Value` Lakhs
% ofassets
FIMIPFranklin India Monthly Income Plan@
An open end income scheme. Income is not assured, and is subject to the availability of distributable surplus
This product is suitable for investors who are seeking*
•Medium term capital appreciation with current income
•An MIP investing predominantly in debt instruments with marginal equity exposure
Product Label
(YELLOW)MEDIUM RISK**
* Investors should consult their financial advisers if in doubtabout whether the product is suitable for them.
**Please refer back cover for Product Label Guidelines
AVERAGE MATURITY# 8.90 years
YIELD TO MATURITY 8.55%*
MODIFIED DURATION 6.15 years**
# based on debt portfolios only * Pre fund expenses
**Modified duration of floating rate securities is calculated based on the
next reset date.
21
# CBLO : 5.96%, Others (Cash/ Subscription/ Redmn/ Payable on purchase/ Recvble on sale/ Interest/ Expenses) : -0.08% Refer Annexure for PTC details * Top 10 holdings
INVESTMENT STYLE
TYPE OF SCHEME / INVESTMENT OBJECTIVE
An open end income fund which seeks to
provide regular income through a portfolio
of predominantly high quality fixed income
securities with a maximum exposure of
20% to equities.
DATE OF ALLOTMENT
September 28, 2000
FUND MANAGERS
NAV
FUND SIZE
` 390.71 crores#EXPENSE RATIO#EXPENSE RATIO (DIRECT)
: 2.28%
: 1.54%
MINIMUM INVESTMENT/
MULTIPLES FOR NEW INVESTORS
Plan A `10,000/1ADDITIONAL INVESTMENT/MULTIPLES FOR EXISTING INVESTORS
Plan A `1000/1
LOAD STRUCTURE
Plan AEntry Load:Exit Load
NilIn respect of each purchase of Units - 1% if the Units are redeemed/ switched-out within one year of allotment
Sales suspended in Plan B - All Options
As on March 31, 2015 PORTFOLIO
Debt Holdings Rating Market Value
` Lakhs
% of
assets
Composition by Rating
YTM is the weighted average yield of portfolio based on the security level yield. Security level yield for securities with maturity greater than 60 days is the simple average of yield provided by AMFI designated agencies and for securities with maturity up to 60 days it is the last traded / valuation yield.
Franklin Templeton Investmentswww.franklintempletonindia.com
# Call, Cash & Other Current Assets Net Assets
Greaves Cotton Ltd. 48500 70.71 0.18
Karur Vysya Bank Ltd. 12000 65.27 0.17
Aditya Birla Nuvo Ltd. 3820 63.56 0.16
Nirvikara Paper Mills Ltd. 2566 2.47 0.01
Total Equity Holding 7264.21 18.59
@ Effective August 8, 2014 Templeton India Children’s Asset Plan – Education Plan has been merged into Franklin India Monthly Income Plan
HDFC Bank Ltd. 54875 561.21 1.44
Infosys Ltd. 18420 408.62 1.05
ICICI Bank Ltd. 119000 375.45 0.96
Bharti Airtel Ltd. 83000 326.44 0.84
IndusInd Bank Ltd. 36100 319.85 0.82
Yes Bank Ltd. 38740 316.02 0.81
Pidilite Industries Ltd. 50982 305.82 0.78
Kotak Mahindra Bank Ltd. 23130 303.75 0.78
Eicher Motors Ltd. 1800 286.35 0.73
Dr. Reddy's Laboratories Ltd. 7540 263.05 0.67
Axis Bank Ltd. 45600 255.45 0.65
Torrent Pharmaceuticals Ltd. 21600 250.26 0.64
Gujarat Pipavav Port Ltd. 99000 239.63 0.61
Amara Raja Batteries Ltd. 27020 225.09 0.58
Cadila Healthcare Ltd. 12770 222.43 0.57
Larsen & Toubro Ltd. 11900 204.64 0.52
Wipro Ltd. 30300 190.54 0.49
Bharat Petroleum Corp. Ltd. 22830 185.11 0.47
Tata Motors Ltd. 33100 182.12 0.47
Cummins India Ltd. 20015 176.26 0.45
Asian Paints Ltd. 19310 156.66 0.40
Balkrishna Industries Ltd. 23100 149.93 0.38
Jagran Prakashan Ltd. 106600 137.25 0.35
Marico Ltd. 31680 122.21 0.31
HCL Technologies Ltd. 12080 118.43 0.30
Tata Communications Ltd. 27300 115.21 0.29
Gujarat State Petronet Ltd. 78000 96.76 0.25
Gateway Distriparks Ltd. 23000 94.51 0.24
Mahindra & Mahindra Ltd. 7200 85.52 0.22
Reliance Industries Ltd. 10160 83.92 0.21
Hero Motocorp Ltd. 3000 79.19 0.20
Apollo Tyres Ltd. 45000 75.71 0.19
Ultra Tech Cement Ltd. 2615 75.26 0.19
Bank of Baroda 45000 73.58 0.19 2300.3139071.33
5.89100.00
Composition by Assets
HPCL Mittal Pipelines Ltd* ICRA AA- 3816.61 9.77
HPCL-mittal Energy Ltd* ICRA AA- 3577.50 9.16
Reliance Utilities And Power Pvt Ltd.* CRISIL AAA 1870.49 4.79
CRISIL AAA 1047.47 2.68
Andhra Pradesh Expressway Ltd ICRA AAA(SO) 753.28 1.93
LIC Housing Finance Ltd CRISIL AAA 405.87 1.04
Total Corporate Debt 11471.21 29.36
Power Grid Corporation Of India Ltd.* CRISIL AAA 1024.93 2.62
Nuclear Power Coporation Of India Ltd CRISIL AAA 512.11 1.31
Nabard CRISIL AAA 500.35 1.28
Export Import Bank Of India CRISIL AAA 199.83 0.51
Total PSU/PFI Bonds 2237.22 5.73
8.40% Goi 2024* SOVEREIGN 4903.28 12.55
8.15% Goi 2026* SOVEREIGN 4644.07 11.89
8.60% Goi 2028* SOVEREIGN 4599.33 11.77
9.23% Goi 2043* SOVEREIGN 1153.52 2.95
Total Gilts 15300.19 39.16
Bank Of Baroda CRISIL A1+ 498.18 1.28
Total Money Market Instruments 498.18 1.28
# The rates specified are the actual average expenses charged for the month of March 2015. The above ratio includes the Service tax on Investment Management Fees. The above ratio also includes, proportionate charge in respect sales beyond T-15 cities subject to maximum of 30 bps on daily net assets, wherever applicable
Growth Plan ` 43.4074
Monthly Plan ` 14.3705
Quarterly Plan ` 13.8135
Bonus ̀ 12.8647
Direct - Growth Plan ` 44.0171
Direct - Monthly Plan ` 14.5909
Direct - Quarterly Plan ` 14.0253
Direct - Bonus ` 13.2114
Corporate Debt 29.36% PSU/PFI Bonds 5.73%
Gilts 39.16%
Other Assets 5.89% Equity 18.59%
CRISIL A1+/CRISIL AAA/ICRA AAA(SO)/SOVEREIGN (includes Call, Cash & Other Current Assets) 62.48%
18.92%ICRA AA- Money Market Instruments 1.28%
Reliance Gas Transportation Infrastr. Ltd.*
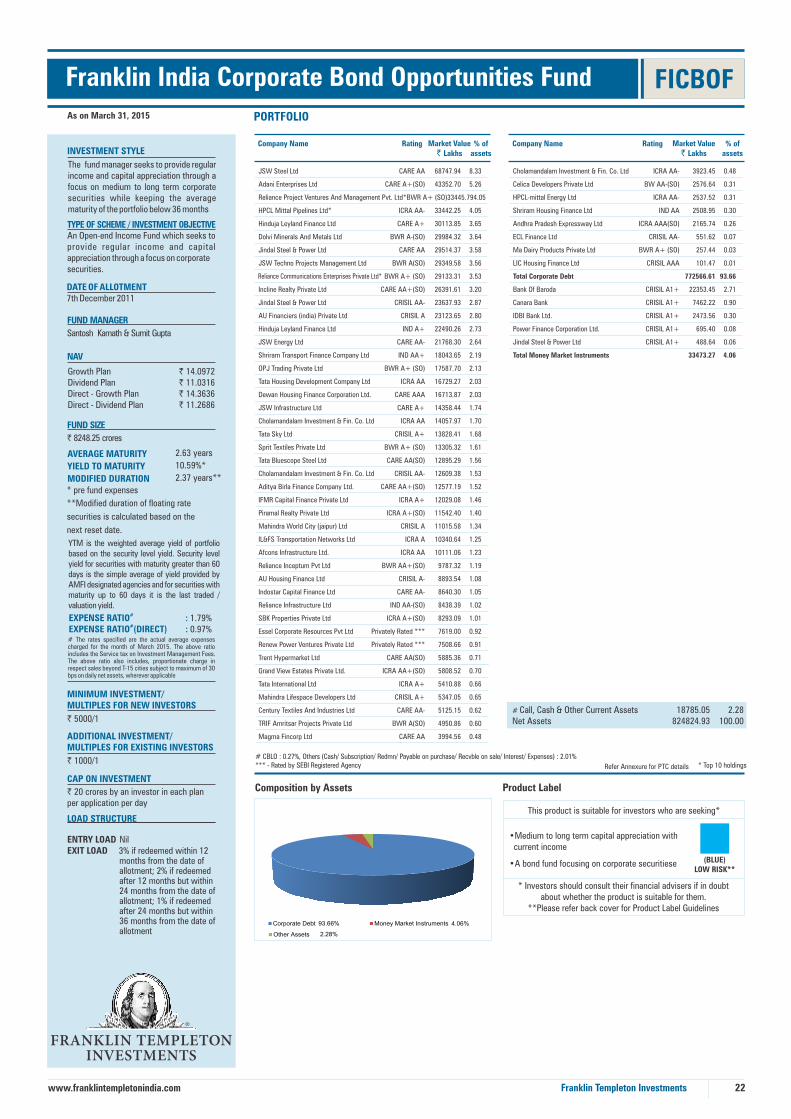
Company Name Rating Market Value` Lakhs
% ofassets
Company Name Rating Market Value` Lakhs
% ofassetsINVESTMENT STYLE
TYPE OF SCHEME / INVESTMENT OBJECTIVE
DATE OF ALLOTMENT7th December 2011
FUND MANAGER
Santosh Kamath & Sumit Gupta
FUND SIZE
` 8248.25 crores
#EXPENSE RATIO : 1.79%#EXPENSE RATIO (DIRECT) : 0.97%
MINIMUM INVESTMENT/MULTIPLES FOR NEW INVESTORS
` 5000/1
ADDITIONAL INVESTMENT/MULTIPLES FOR EXISTING INVESTORS
` 1000/1
LOAD STRUCTURE
FICBOF
22
As on March 31, 2015 PORTFOLIO
* pre fund expenses
**Modified duration of floating rate
securities is calculated based on the
next reset date.
CAP ON INVESTMENT
` 20 crores by an investor in each planper application per day
Product Label
This product is suitable for investors who are seeking*
•Medium to long term capital appreciation with current income
•A bond fund focusing on corporate securitiese (BLUE)LOW RISK**
* Investors should consult their financial advisers if in doubtabout whether the product is suitable for them.
**Please refer back cover for Product Label Guidelines
# CBLO : 0.27%, Others (Cash/ Subscription/ Redmn/ Payable on purchase/ Recvble on sale/ Interest/ Expenses) : 2.01%*** - Rated by SEBI Registered Agency Refer Annexure for PTC details * Top 10 holdings
2.63 years
10.59%*
2.37 years**
AVERAGE MATURITY
YIELD TO MATURITY
MODIFIED DURATION
Composition by Assets
YTM is the weighted average yield of portfolio based on the security level yield. Security level yield for securities with maturity greater than 60 days is the simple average of yield provided by AMFI designated agencies and for securities with maturity up to 60 days it is the last traded / valuation yield.
Franklin Templeton Investmentswww.franklintempletonindia.com
Franklin India Corporate Bond Opportunities Fund
# Call, Cash & Other Current Assets Net Assets
18785.05824824.93
2.28100.00
ENTRY LOAD NilEXIT LOAD 3% if redeemed within 12
months from the date of allotment; 2% if redeemed after 12 months but within 24 months from the date of allotment; 1% if redeemed after 24 months but within 36 months from the date of allotment
JSW Steel Ltd CARE AA 68747.94 8.33
Adani Enterprises Ltd CARE A+(SO) 43352.70 5.26
Reliance Project Ventures And Management Pvt. Ltd* BWR A+ (SO) 33445.79 4.05
HPCL Mittal Pipelines Ltd* ICRA AA- 33442.25 4.05
Hinduja Leyland Finance Ltd CARE A+ 30113.85 3.65
Dolvi Minerals And Metals Ltd BWR A-(SO) 29984.32 3.64
Jindal Steel & Power Ltd CARE AA 29514.37 3.58
JSW Techno Projects Management Ltd BWR A(SO) 29349.58 3.56
BWR A+ (SO) 29133.31 3.53
Incline Realty Private Ltd CARE AA+(SO) 26391.61 3.20
Jindal Steel & Power Ltd CRISIL AA- 23637.93 2.87
AU Financiers (india) Private Ltd CRISIL A 23123.65 2.80
Hinduja Leyland Finance Ltd IND A+ 22490.26 2.73
JSW Energy Ltd CARE AA- 21768.30 2.64
Shriram Transport Finance Company Ltd IND AA+ 18043.65 2.19
OPJ Trading Private Ltd BWR A+ (SO) 17587.70 2.13
Tata Housing Development Company Ltd ICRA AA 16729.27 2.03
Dewan Housing Finance Corporation Ltd. CARE AAA 16713.87 2.03
JSW Infrastructure Ltd CARE A+ 14358.44 1.74
Cholamandalam Investment & Fin. Co. Ltd ICRA AA 14057.97 1.70
Tata Sky Ltd CRISIL A+ 13828.41 1.68
Sprit Textiles Private Ltd BWR A+ (SO) 13305.32 1.61
Tata Bluescope Steel Ltd CARE AA(SO) 12895.29 1.56
Cholamandalam Investment & Fin. Co. Ltd CRISIL AA- 12609.38 1.53
Aditya Birla Finance Company Ltd. CARE AA+(SO) 12577.19 1.52
IFMR Capital Finance Private Ltd ICRA A+ 12029.08 1.46
Piramal Realty Private Ltd ICRA A+(SO) 11542.40 1.40
Mahindra World City (jaipur) Ltd CRISIL A 11015.58 1.34
IL&FS Transportation Networks Ltd ICRA A 10340.64 1.25
Afcons Infrastructure Ltd. ICRA AA 10111.06 1.23
Reliance Inceptum Pvt Ltd BWR AA+(SO) 9787.32 1.19
AU Housing Finance Ltd CRISIL A- 8893.54 1.08
Indostar Capital Finance Ltd CARE AA- 8640.30 1.05
Reliance Infrastructure Ltd IND AA-(SO) 8438.39 1.02
SBK Properties Private Ltd ICRA A+(SO) 8293.09 1.01
Essel Corporate Resources Pvt Ltd Privately Rated *** 7619.00 0.92
Renew Power Ventures Private Ltd Privately Rated *** 7508.66 0.91
Trent Hypermarket Ltd CARE AA(SO) 5885.36 0.71
Grand View Estates Private Ltd. ICRA AA+(SO) 5808.52 0.70
Tata International Ltd ICRA A+ 5410.88 0.66
Mahindra Lifespace Developers Ltd CRISIL A+ 5347.05 0.65
Century Textiles And Industries Ltd CARE AA- 5125.15 0.62
TRIF Amritsar Projects Private Ltd BWR A(SO) 4950.86 0.60
Magma Fincorp Ltd CARE AA 3994.56 0.48
Cholamandalam Investment & Fin. Co. Ltd ICRA AA- 3923.45 0.48
Celica Developers Private Ltd BW AA-(SO) 2576.64 0.31
HPCL-mittal Energy Ltd ICRA AA- 2537.52 0.31
Shriram Housing Finance Ltd IND AA 2508.95 0.30
Andhra Pradesh Expressway Ltd ICRA AAA(SO) 2165.74 0.26
ECL Finance Ltd CRISIL AA- 551.62 0.07
Ma Dairy Products Private Ltd BWR A+ (SO) 257.44 0.03
LIC Housing Finance Ltd CRISIL AAA 101.47 0.01
Total Corporate Debt 772566.61 93.66
Bank Of Baroda CRISIL A1+ 22353.45 2.71
Canara Bank CRISIL A1+ 7462.22 0.90
IDBI Bank Ltd. CRISIL A1+ 2473.56 0.30
Power Finance Corporation Ltd. CRISIL A1+ 695.40 0.08
Jindal Steel & Power Ltd CRISIL A1+ 488.64 0.06
Total Money Market Instruments 33473.27 4.06
# The rates specified are the actual average expenses charged for the month of March 2015. The above ratio includes the Service tax on Investment Management Fees. The above ratio also includes, proportionate charge in respect sales beyond T-15 cities subject to maximum of 30 bps on daily net assets, wherever applicable
Growth Plan ` 14.0972Dividend Plan ` 11.0316Direct - Growth Plan ` 14.3636Direct - Dividend Plan ` 11.2686
NAV
93.66% 4.06%
2.28%
Corporate Debt Money Market Instruments
Other Assets
Reliance Communications Enterprises Private Ltd*
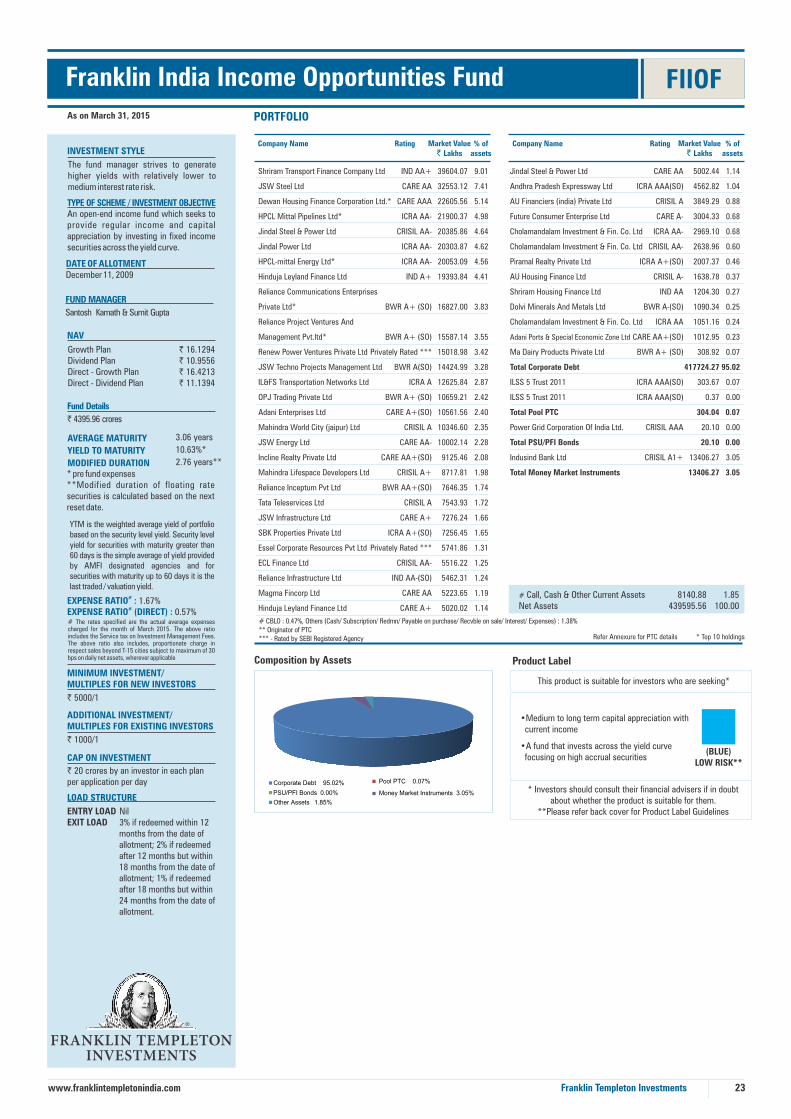
Company Name Rating Market Value` Lakhs
% ofassetsINVESTMENT STYLE
TYPE OF SCHEME / INVESTMENT OBJECTIVE
DATE OF ALLOTMENTDecember 11, 2009
FUND MANAGER
Santosh Kamath & Sumit Gupta
Fund Details
` 4395.96 crores
#EXPENSE RATIO : 1.67%#EXPENSE RATIO (DIRECT) : 0.57%
MINIMUM INVESTMENT/MULTIPLES FOR NEW INVESTORS
` 5000/1
ADDITIONAL INVESTMENT/MULTIPLES FOR EXISTING INVESTORS
` 1000/1
LOAD STRUCTURE
ENTRY LOAD NilEXIT LOAD 3% if redeemed within 12
months from the date of allotment; 2% if redeemed after 12 months but within 18 months from the date of allotment; 1% if redeemed after 18 months but within 24 months from the date of allotment.
FIIOFFranklin India Income Opportunities Fund
23
As on March 31, 2015 PORTFOLIO
CAP ON INVESTMENT
` 20 crores by an investor in each planper application per day
# CBLO : 0.47%, Others (Cash/ Subscription/ Redmn/ Payable on purchase/ Recvble on sale/ Interest/ Expenses) : 1.38%** Originator of PTC*** - Rated by SEBI Registered Agency * Top 10 holdings
Product Label
This product is suitable for investors who are seeking*
•Medium to long term capital appreciation with current income
•A fund that invests across the yield curve focusing on high accrual securities
(BLUE)LOW RISK**
* Investors should consult their financial advisers if in doubtabout whether the product is suitable for them.
**Please refer back cover for Product Label Guidelines
Company Name Rating Market Value` Lakhs
% ofassets
Composition by Assets
3.06 years
10.63%*
2.76 years**
AVERAGE MATURITY
YIELD TO MATURITY
MODIFIED DURATION
YTM is the weighted average yield of portfolio based on the security level yield. Security level yield for securities with maturity greater than 60 days is the simple average of yield provided by AMFI designated agencies and for securities with maturity up to 60 days it is the last traded / valuation yield.
Refer Annexure for PTC details
Franklin Templeton Investmentswww.franklintempletonindia.com
# Call, Cash & Other Current Assets Net Assets
8140.88439595.56
1.85100.00
Jindal Steel & Power Ltd CARE AA 5002.44 1.14
Andhra Pradesh Expressway Ltd ICRA AAA(SO) 4562.82 1.04
AU Financiers (india) Private Ltd CRISIL A 3849.29 0.88
Future Consumer Enterprise Ltd CARE A- 3004.33 0.68
Cholamandalam Investment & Fin. Co. Ltd ICRA AA- 2969.10 0.68
Cholamandalam Investment & Fin. Co. Ltd CRISIL AA- 2638.96 0.60
Piramal Realty Private Ltd ICRA A+(SO) 2007.37 0.46
AU Housing Finance Ltd CRISIL A- 1638.78 0.37
Shriram Housing Finance Ltd IND AA 1204.30 0.27
Dolvi Minerals And Metals Ltd BWR A-(SO) 1090.34 0.25
Cholamandalam Investment & Fin. Co. Ltd ICRA AA 1051.16 0.24
Adani Ports & Special Economic Zone Ltd CARE AA+(SO) 1012.95 0.23
Ma Dairy Products Private Ltd BWR A+ (SO) 308.92 0.07
Total Corporate Debt 417724.27 95.02
ILSS 5 Trust 2011 ICRA AAA(SO) 303.67 0.07
ILSS 5 Trust 2011 ICRA AAA(SO) 0.37 0.00
Total Pool PTC 304.04 0.07
Power Grid Corporation Of India Ltd. CRISIL AAA 20.10 0.00
Total PSU/PFI Bonds 20.10 0.00
Indusind Bank Ltd CRISIL A1+ 13406.27 3.05
Total Money Market Instruments 13406.27 3.05
Shriram Transport Finance Company Ltd IND AA+ 39604.07 9.01
JSW Steel Ltd CARE AA 32553.12 7.41
Dewan Housing Finance Corporation Ltd.* CARE AAA 22605.56 5.14
HPCL Mittal Pipelines Ltd* ICRA AA- 21900.37 4.98
Jindal Steel & Power Ltd CRISIL AA- 20385.86 4.64
Jindal Power Ltd ICRA AA- 20303.87 4.62
HPCL-mittal Energy Ltd* ICRA AA- 20053.09 4.56
Hinduja Leyland Finance Ltd IND A+ 19393.84 4.41
Reliance Communications Enterprises
Private Ltd* BWR A+ (SO) 16827.00 3.83
Reliance Project Ventures And
Management Pvt.ltd* BWR A+ (SO) 15587.14 3.55
Renew Power Ventures Private Ltd Privately Rated *** 15018.98 3.42
JSW Techno Projects Management Ltd BWR A(SO) 14424.99 3.28
IL&FS Transportation Networks Ltd ICRA A 12625.84 2.87
OPJ Trading Private Ltd BWR A+ (SO) 10659.21 2.42
Adani Enterprises Ltd CARE A+(SO) 10561.56 2.40
Mahindra World City (jaipur) Ltd CRISIL A 10346.60 2.35
JSW Energy Ltd CARE AA- 10002.14 2.28
Incline Realty Private Ltd CARE AA+(SO) 9125.46 2.08
Mahindra Lifespace Developers Ltd CRISIL A+ 8717.81 1.98
Reliance Inceptum Pvt Ltd BWR AA+(SO) 7646.35 1.74
Tata Teleservices Ltd CRISIL A 7543.93 1.72
JSW Infrastructure Ltd CARE A+ 7276.24 1.66
SBK Properties Private Ltd ICRA A+(SO) 7256.45 1.65
Essel Corporate Resources Pvt Ltd Privately Rated *** 5741.86 1.31
ECL Finance Ltd CRISIL AA- 5516.22 1.25
Reliance Infrastructure Ltd IND AA-(SO) 5462.31 1.24
Magma Fincorp Ltd CARE AA 5223.65 1.19
Hinduja Leyland Finance Ltd CARE A+ 5020.02 1.14
# The rates specified are the actual average expenses charged for the month of March 2015. The above ratio includes the Service tax on Investment Management Fees. The above ratio also includes, proportionate charge in respect sales beyond T-15 cities subject to maximum of 30 bps on daily net assets, wherever applicable
Growth Plan ` 16.1294Dividend Plan ` 10.9556Direct - Growth Plan ` 16.4213Direct - Dividend Plan ` 11.1394
NAV
Corporate Debt 95.02% Pool PTC 0.07%
PSU/PFI Bonds 0.00%
Other Assets 1.85%
Money Market Instruments 3.05%

Indian Bank IND A1+ 9883.56 2.92
State Bank Of Patiala CRISIL A1+ 9875.87 2.92
Indusind Bank Ltd CRISIL A1+ 8738.90 2.58
Punjab And Sind Bank ICRA A1+ 7363.81 2.18
Axis Bank Ltd CRISIL A1+ 6954.73 2.06
Housing Development Finance Corporation Ltd CRISIL A1+ 4988.78 1.47
JM Financial Products Ltd ICRA A1+ 4964.11 1.47
Tata Realty & Infrastructure Ltd CARE A1+ 4952.96 1.46
Allahabad Bank CRISIL A1+ 4486.10 1.33
Bank Of Baroda CRISIL A1+ 2480.94 0.73
Total Money Market Instruments 431494.59 127.52
Citi Bank N.A. NR 6948.11 2.05
Total Bank Deposit 6948.11 2.05
Reliance Infrastructure Ltd. IND AA-(SO) 1251.27 0.37
Total Corporate Debt 1251.27 0.37
Dewan Housing Finance Corporation Ltd.* CRISIL A1+ 54515.53 16.11
Reliance Capital Ltd.* CRISIL A1+ 49364.70 14.59
Canara Bank* CRISIL A1+ 44469.69 13.14
Jindal Steel & Power Ltd CRISIL A1+ 36006.44 10.64
Amba River Coke Ltd CARE A1+ 26927.42 7.96
Small Industries Development Bank Of India* CARE A1+ 24571.23 7.26
IDBI Bank Ltd.* CRISIL A1+ 19907.46 5.88
Indian Bank* CRISIL A1+ 19843.08 5.86
Vijaya Bank Ltd.* CARE A1+ 19771.10 5.84
Daimler Financial Services India Pvt Ltd* IND A1+ 14824.55 4.38
JM Financial Products Ltd CRISIL A1+ 14820.75 4.38
Bank Of India CRISIL A1+ 14726.84 4.35
Rashtriya Ispat Nigam Ltd IND A1+ 14714.33 4.35
Bank Of Maharashtra CRISIL A1+ 12341.76 3.65
Company Name Rating Market Value` Lakhs
% ofassets
Company Name Rating Market Value` Lakhs
% ofassets
INVESTMENT STYLE
TYPE OF SCHEME / INVESTMENT OBJECTIVE
DATE OF ALLOTMENTMarch 5, 1997FUND MANAGERSantosh Kamath, Umesh Sharma & Sachin Padwal - Desai (w.e.f. Feb 23, 2015)
FUND SIZE` 871.90 crores
#EXPENSE RATIO : 1.74%
#EXPENSE RATIO (DIRECT) : 0.81%
AVERAGE MATURITY 3.69 yearsYIELD TO MATURITY 11.39%*MODIFIED DURATION 3.31 years**
MINIMUM INVESTMENT/ MULTIPLES FOR NEW INVESTORS
` 10000/1ADDITIONAL INVESTMENT/MULTIPLES FOR EXISTING INVESTORS` 1000/1
LOAD STRUCTURE
FIDAFranklin India Dynamic Accrual Fund
# CBLO : 1.96%, Others (Cash/ Subscription/ Redmn/ Payable on purchase/ Recvble on sale/ Interest/ Expenses) : -3.91%
Product Label
This product is suitable for investors who are seeking*
•Medium term capital appreciation with current income
•A long bond fund investing in quality fixed income instruments across segments
(BLUE)LOW RISK**
* Investors should consult their financial advisers if in doubtabout whether the product is suitable for them.
**Please refer back cover for Product Label Guidelines
24
As on March 31 , 2015 PORTFOLIO
YTM is the weighted average yield of portfolio based on the security level yield. Security level yield for securities with maturity greater than 60 days is the simple average of yield provided by AMFI designated agencies and for securities with maturity up to 60 days it is the last traded / valuation yield.
Refer Annexure for PTC details
NAV
Franklin India Treasury Management Account FITMAAs on March 31, 2015
INVESTMENT STYLE
DATE OF ALLOTMENT
FITMA - R PlanFITMA- I PlanFITMA - SI Plan
April 29, 1998June 22, 2004September 2, 2005
FUND MANAGER
Pallab Roy & Sachin Padwal-Desai
TYPE OF SCHEME / INVESTMENT OBJECTIVEAn open end liquid fund which seeks to provide current income along with high liquidity.
Minimum Investment/Multiples ForNew InvestorsFITMA - SI Plan - WDPFITMA - SI Plan
` 25 lakh/1`10,000/1
Additional Investment/Multiples ForExisting InvestorsFITMA - SI Plan - WDPFITMA - SI Plan
` 1 lakh/1` 1000/1
FUND SIZE` 3383.79 crores
LOAD STRUCTURE
FITMA - SI PlanEntry LoadExit Load
NilNil
R Plan: Regular Plan; I Plan: InstitutionalPlan; WDP: Weekly Dividend PayoutSales suspended in Regular Plan & Institutional Plan
PORTFOLIOCompany Name Rating Market Value
` Lakhs% of
assetsCompany Name Rating Market Value
` Lakhs% of
assets
# CBLO : -5.76%, Others (Cash/ Subscription/ Redmn/ Payable on purchase/ Recvble on sale/ Interest/ Expenses) : -24.18%“IND”-rating by “India Ratings & Research Pvt. Ltd. (India Ratings)” (Formaly known as FITCH India)
AVERAGE MATURITYYIELD TO MATURITYMODIFIED DURATION
0.19 Years8.27%*0.17 Years**
#EXPENSE RATIO FITMA-R PlanFITMA-I PlanFITMA SI Plan
0.86%0.58%0.20%
#EXPENSE RATIO (DIRECT)
0.14%# The rates specified are the actual average expenses charged for the month of March 2015. The above ratio includes the Service tax on Investment Management Fees. The above ratio also includes, proportionate charge in respect sales beyond T-15 cities subject to maximum of 30 bps on daily net assets, wherever applicable
Product LabelThis product is suitable for investors who are seeking*
Regular income for short term
A liquid fund that invests in short term andmoney market instruments (BLUE)
LOW RISK*** Investors should consult their financial advisers if in doubt about
whether the product is suitable for them.**Please refer back cover for Product Label Guidelines
(ICRA)A1+mfs rating by ICRA*
* Top 10 holdings
The fund manager strives to strike an optimum balance between steady income and high liquidity through a judicious mix of short term debt and money market instruments.
NAVFITMA - R PlanGrowth OptionWeekly OptionDaily Dividend OptionFITMA - I PlanGrowth OptionWeekly OptionDaily Dividend OptionFITMA Super Institutional PlanGrowth OptionWeekly Dividend OptionDaily Dividend
` 3362.1337` 1245.9526` 1512.3400
` 2158.2758` 1056.1149` 1000.6730
` 2087.4034` 1022.4984` 1000.7164
FITMA - Super Institutional Plan (Direct)Growth PlanWeekly Dividend PlanDaily Dividend
` 2089.8896` 1022.7664` 1001.8518
Franklin Templeton Investmentswww.franklintempletonindia.com
(Fund name change W.E.F. 01 December 2014, ERSTWHILE Franklin India Income Fund)
Composition by Assets
YTM is the weighted average yield of portfolio based on the security level yield. Security level yield for securities with maturity greater than 60 days is the simple average of yield provided by AMFI designated agencies and for securities with maturity up to 60 days it is the last traded / valuation yield.
**Modified duration of floating rate securities is calculated based on the next reset date.
ENTRY LOAD NilEXIT LOAD 3% if redeemed within 12 months from the date of allotment;2% if redeemed after 12 months but within 24 months from the date of allotment;1% if redeemed after 24 months but within 36 months from the date of allotment;0.50% if redeemed after 36 months but within 48 months from the date of allotment
# Call, Cash & Other Current Assets Net Assets
-1701.6587189.83
-1.95100.00
# Call, Cash & Other Current Assets Net Assets
-101315.35338378.63
-29.94100.00
Cholamandalam Investment & Fin. Co. Ltd* ICRA AA 5255.81 6.03Renew Power Ventures Private Ltd Privately Rated *** 5007.93 5.74Dolvi Minerals And Metals Ltd BWR A-(SO) 4470.39 5.13SBK Properties Private Ltd ICRA A+(SO) 4093.28 4.69IFMR Capital Finance Private Ltd* ICRA A+ 3793.68 4.35OPJ Trading Private Ltd* BWR A+ (SO) 3730.72 4.28HPCL-mittal Energy Ltd* ICRA AA- 3699.48 4.24Reliance Infrastructure Ltd IND AA-(SO) 3471.00 3.98Reliance Inceptum Pvt Ltd* BWR AA+(SO) 3466.34 3.98Jindal Steel & Power Ltd CRISIL AA- 3455.72 3.96Jindal Power Ltd ICRA AA- 3438.51 3.94Dish Tv India Ltd CRISIL A- 3131.47 3.59Hinduja Leyland Finance Ltd IND A+ 3118.77 3.58Indostar Capital Finance Ltd CARE AA- 3047.24 3.49 BWR A+ (SO) 3026.70 3.47Piramal Realty Private Ltd ICRA A+(SO) 3011.06 3.45Future Consumer Enterprise Ltd CARE A- 3004.33 3.45Essel Propack Ltd CARE A 3001.32 3.44
TRIF Amritsar Projects Private Ltd BWR A(SO) 2970.51 3.41Sprit Textiles Private Ltd BWR A+ (SO) 2771.94 3.18Essel Corporate Resources Pvt Ltd Privately Rated *** 2650.09 3.04IL&FS Transportation Networks Ltd ICRA A 2378.35 2.73Reliance Communications Enterprises Private Ltd BWR A+ (SO) 2260.34 2.59HPCL Mittal Pipelines Ltd ICRA AA- 1862.12 2.14JSW Steel Ltd CARE AA 1347.35 1.55JSW Infrastructure Ltd CARE A+ 1261.21 1.45Jindal Steel & Power Ltd CARE AA 1000.49 1.15Ma Dairy Products Private Ltd BWR A+ (SO) 102.97 0.12Total Corporate Debt 83829.13 96.15ILSS 5 Trust 2011 ICRA AAA(SO) 138.03 0.16Total Pool PTC 138.03 0.16Adani Enterprises Ltd* BWR A1+ 4924.32 5.65Total Money Market Instruments 4924.32 5.65
# The rates specified are the actual average expenses charged for the month of March 2015. The above ratio includes the Service tax on Investment Management Fees. The above ratio also includes, proportionate charge in respect sales beyond T-15 cities subject to maximum of 30 bps on daily net assets, wherever applicable
Growth Plan ` 47.0032Dividend Plan ` 11.3963Direct - Growth Plan ` 47.6405Direct - Dividend Plan ` 11.5703
Corporate Debt 96.15%
Pool PTC 0.16% Other Assets ‐1.95%
Money Market Instruments 5.65%
Reliance Project Ventures And Management Pvt.Ltd

Power Finance Corporation Ltd. CRISIL AAA 49.99 0.01
Total PSU/PFI Bonds 9080.08 1.65
Jindal Steel & Power Ltd CRISIL A1+ 34226.49 6.23
Housing Development Finance Corporation Ltd* ICRA A1+ 19789.60 3.60
Dewan Housing Finance Corporation Ltd. CRISIL A1+ 18317.59 3.34
Bank Of Maharashtra CRISIL A1+ 17228.17 3.14
IDBI Bank Ltd. CRISIL A1+ 13752.98 2.50
Vijaya Bank CARE A1+ 9875.55 1.80
Shapoorji Pallonji & Co Ltd. CRISIL A1+ 9803.77 1.79
Oriental Bank Of Commerce CRISIL A1+ 7394.98 1.35
State Bank Of Hyderabad CRISIL A1+ 7242.56 1.32
JM Financial Products Ltd CRISIL A1+ 4938.10 0.90
L&T Finance Holdings Ltd CARE A1+ 4935.19 0.90
Canara Bank CRISIL A1+ 4922.44 0.90
Afcons Infrastructure Ltd. CRISIL A1+ 4831.44 0.88
JM Financial Ltd ICRA A1+ 4796.29 0.87
State Bank Of Mysore CRISIL A1+ 2891.40 0.53
Tata Realty & Infrastructure Ltd CARE A1+ 2476.48 0.45
S.D. Corporation Private Ltd CARE A1+(SO) 2451.86 0.45
Afcons Infrastructure Ltd. ICRA A1+ 2412.23 0.44
Total Money Market Instruments 172287.11 31.38
Product Label
This product is suitable for investors who are seeking*
* Investors should consult their financial advisers if in doubtabout whether the product is suitable for them.
**Please refer back cover for Product Label Guidelines
• Medium term capital appreciation with current income
• A long bond fund – focuses on Corporate / PSU Bonds
(BLUE)LOW RISK**
25
FIIBAFranklin India Income Builder AccountAs on March 31, 2015 PORTFOLIO
Franklin India Ultra Short Bond Fund FIUBF
(ICRA)A1+mfs rating by ICRA*
Company Name Rating Market Value` Lakhs
% ofassets
Company Name Rating Market Value` Lakhs
% ofassets
Composition by Assets
# CBLO : -3%, Others (Cash/ Subscription/ Redmn/ Payable on purchase/ Recvble on sale/ Interest/ Expenses) : -0.44%“IND”-rating by “India Ratings & Research Pvt. Ltd. (India Ratings)” (Formaly known as FITCH India)
#EXPENSE RATIO : RP : 0.86%; IP: 0.66%; SIP: 0.30% 0.22%
#EXPENSE RATIO (DIRECT):
Minimum investment/Multiples for New investors:SIP : ` 10,000/1Additional investment/Multiples for existing investors:SIP : ` 1000/1
LOAD STRUCTURE
Entry Load:Exit Load:Fund Size:
NilNil` 5490.97 crores
As on March 31, 2015
INVESTMENT STYLE
The fund manager strives to strike an optimum
balance between regular income and high liquidity
through a judicious mix of short term debt and
money market instruments.
TYPE OF SCHEME / INVESTMENT OBJECTIVE
NAV
Sales suspended in Retail Plan &
Institutional Plan
DATE OF ALLOTMENTDecember 18,2007
An open-end income fund that seeks to provide a
combination of regular income and high liquidity
by investing primarily in a mix of short term debtand money market instruments.
FUND MANAGERPallab Roy & Sachin Padwal Desai
AVERAGE MATURITYYIELD TO MATURITYMODIFIED DURATION
0.56 years9.75%*0.51 years**
* Pre fund expenses**Modified duration of floating rate securities is calculated based on the next reset date.YTM is the weighted average yield of portfolio based on the security level yield. Security level yield for securities with maturity greater than 60 days is the simple average of yield provided by AMFI designated agencies and for securities with maturity up to 60 days it is the last traded / valuation yield.
Company Name Rating Market Value` Lakhs
% ofassets
Company Name Rating Market Value` Lakhs
% ofassets
Product Label
This product is suitable for investors who are seeking*
• Regular income for short term
• A fund that invests in short term debt and money market instruments
(BLUE)LOW RISK**
* Investors should consult their financial advisers if in doubt aboutwhether the product is suitable for them.
**Please refer back cover for Product Label Guidelines
* Top 10 holdings
# CBLO : 2.3%, Others (Cash/ Subscription/ Redmn/ Payable on purchase/ Recvble on sale/ Interest/ Expenses) : 0.49%“IND”-rating by “India Ratings & Research Pvt. Ltd. (India Ratings)” (Formaly known as FITCH India)
* Top 10 holdingsRefer Annexure for PTC details
Franklin Templeton Investmentswww.franklintempletonindia.com
# Call, Cash & Other Current Assets Net Assets
4791.31171411.45
2.80100.00
Shriram Transport Finance Company Ltd IND AA+ 50648.86 9.22
JSW Techno Projects Management Ltd BWR A(SO) 32158.12 5.86
Incline Realty Private Ltd CARE AA+(SO) 30334.79 5.52
Century Textiles And Industries Ltd* CARE AA- 29051.02 5.29
Tata Sky Ltd CRISIL A+ 27460.77 5.00
Albrecht Builder Private Ltd ICRA A+ 23129.15 4.21
Karelides Traders Private Ltd ICRA AA-(SO) 21627.47 3.94
Ashok Leyland Ltd.* ICRA A+ 19994.28 3.64
JSW Energy Ltd CARE AA- 19023.47 3.46
Celica Developers Private Ltd BW AA-(SO) 18036.51 3.28
Edelweiss Housing Financial Ltd CRISIL AA- 15049.17 2.74
Sharda Solvent Ltd BWR AA- (SO) 12525.04 2.28
JSW Steel Ltd CARE AA 12191.70 2.22
Tata Housing Development Company Ltd ICRA AA 12055.66 2.20
Mahindra Lifespace Developers Ltd CRISIL A+ 8254.01 1.50
Reliance Infrastructure Ltd IND AA-(SO) 7970.09 1.45
Grand View Estates Private Ltd. ICRA AA+(SO) 7849.58 1.43
Capital First Ltd CARE AA+ 6560.61 1.19
Sprit Textiles Private Ltd BWR A+ (SO) 5534.77 1.01
Tata International Ltd ICRA A+ 5529.88 1.01
Capital First Ltd CARE AA+ 5063.20 0.92
Magma Housing Finance Ltd CARE AA- 5004.67 0.91
Essel Corporate Resources Pvt Ltd Privately Rated *** 3312.61 0.60
Tata Power Company Ltd CRISIL AA- 3235.10 0.59
Adani Ports & Special Economic Zone Ltd CARE AA+(SO) 3014.91 0.55
Sundaram BNP Paribas Home Finance Ltd CARE AA+ 2000.10 0.36
Total Corporate Debt 386615.51 70.41
Nabard CRISIL AAA 9030.09 1.64
JSW Steel Ltd CARE AA 12387.45 7.23Shriram Transport Finance Company Ltd IND AA+ 11041.26 6.44Indostar Capital Finance Ltd* CARE AA- 9144.59 5.33HPCL Mittal Pipelines Ltd* ICRA AA- 8203.60 4.79Adani Enterprises Ltd CARE A+(SO) 8046.90 4.69Jindal Steel & Power Ltd CRISIL AA- 7668.02 4.47HPCL-mittal Energy Ltd* ICRA AA- 7404.35 4.32Tata Bluescope Steel Ltd CARE AA(SO) 6603.13 3.85Reliance Communications Enterprises Private Ltd BWR A+ (SO) 6529.88 3.81Andhra Pradesh Expressway Ltd ICRA AAA(SO) 6464.14 3.77Dolvi Minerals And Metals Ltd BWR A-(SO) 6323.97 3.69Cholamandalam Investment & Fin. Co. Ltd ICRA AA 6306.65 3.68Reliance Project Ventures And Management Pvt.Ltd BWR A+ (SO) 6301.14 3.68Sprit Textiles Private Ltd BWR A+ (SO) 5543.89 3.23Renew Power Ventures Private Ltd Privately Rated *** 5005.74 2.92Reliance Infrastructure Ltd IND AA-(SO) 4961.53 2.89OPJ Trading Private Ltd BWR A+ (SO) 4263.68 2.49IL&FS Transportation Networks Ltd ICRA A 4245.67 2.48
Dewan Housing Finance Corporation Ltd. CARE AAA 4138.98 2.41JSW Infrastructure Ltd CARE A+ 2910.50 1.70Hinduja Leyland Finance Ltd IND A+ 2598.97 1.52Jindal Power Ltd ICRA AA- 2543.28 1.48Reliance Gas Transportation Infrastr. Ltd. CRISIL AAA 1571.20 0.92Tata Teleservices Ltd CRISIL A 1510.80 0.88Jindal Steel & Power Ltd CARE AA 1000.49 0.58Cholamandalam Investment & Fin. Co. Ltd CRISIL AA- 527.07 0.31Ma Dairy Products Private Ltd BWR A+ (SO) 102.97 0.06Total Corporate Debt 143349.84 83.63ILSS 5 Trust 2011 ICRA AAA(SO) 27.61 0.02Total Pool PTC 27.61 0.02Power Grid Corporation Of India Ltd. CRISIL AAA 10.05 0.01Total PSU/PFI Bonds 10.05 0.018.15% Goi 2026* SOVEREIGN 10320.15 6.028.60% Goi 2028* SOVEREIGN 6652.98 3.888.40% Goi 2024 SOVEREIGN 6259.51 3.65Total Gilts 23232.64 13.55
# Call, Cash & Other Current Assets Net Assets
-18885.28549097.42
-3.44100.00
TYPE OF SCHEME / INVESTMENT OBJECTIVE
An open-end income scheme with an objective toprimarily provide investors regular income underthe Dividend Plan and capital appreciation underthe Growth Plan.DATE OF ALLOTMENT June 23, 1997
FUND MANAGERSantosh Kamath & Sumit Gupta NAV
FUND SIZE : ` 1714.11 crores
AVERAGE MATURITY :YIELD TO MATURITY:MODIFIED DURATION :
4.87 years10.27%*3.98 years**
* Pre fund expenses.**Modified duration of floating rate securitiesis calculated based on the next reset date.
MINIMUM INVESTMENT/MULTIPLES FOR NEW INVESTORS
Plan A : `10,000 / 1
ADDITIONAL INVESTMENT/MULTIPLES FOR EXISTING INVESTORS#EXPENSE RATIO#EXPENSE RATIO (DIRECT)
: 1.93%: 1.14%
LOAD STRUCTUREPlan A : Entry Load: NilExit Load: 0.50%, if redeemed within 1 year of allotment
Sales suspended in Plan B - All Options
YTM is the weighted average yield of portfolio based on the security level yield. Security level yield for securities with maturity greater than 60 days is the simple average of yield provided by AMFI designated agencies and for securities with maturity up to 60 days it is the last traded / valuation yield.
PORTFOLIO
RP-Retail Plan, IP-Institutional Plan,SIP-Super Institutional Plan
*** - Rated by SEBI Registered Agency
# The rates specified are the actual average expenses charged for the month of March 2015. The above ratio includes the Service tax on Investment Management Fees. The above ratio also includes, proportionate charge in respect sales beyond T-15 cities subject to maximum of 30 bps on daily net assets, wherever applicable
# The rates specified are the actual average expenses charged for the month of March 2015. The above ratio includes the Service tax on Investment Management Fees. The above ratio also includes, proportionate charge in respect sales beyond T-15 cities subject to maximum of 30 bps on daily net assets, wherever applicable
FIUBF - Retail Plan
Growth Option ` 17.9397
Weekly Option ` 10.1261
Daily Dividend Option ` 10.0548
FIUBF - Institutional Plan
Growth Option ` 18.2032
Weekly Option ` 10.2987
Daily Dividend Option ` 10.0050
FIUBF Super Insitutional Plan
Growth Option ` 18.5419
Weekly Option ` 10.0963
Daily Dividend Option ` 10.0793
FIUBF - Super Insitutional Plan (Direct)
Growth Option ` 18.5658
Weekly Option ` 10.1108
Daily Dividend Option ` 10.0628
Growth Plan ` 48.4648Annual Dividend Plan ` 16.7003Monthly Dividend Plan ` 15.8245Quarterly Dividend Plan ` 13.5478Half-yearly Dividend Plan ` 13.7512Direct - Growth Plan ` 49.4155Direct - Annual Dividend Plan ` 17.0723Direct - Monthly Dividend Plan ` 16.1690Direct - Quarterly Dividend Plan ` 13.8499Direct - Half-yearly Dividend Plan ` 14.1931Direct - Bonus Plan ` 19.0330Monthly Bonus Plan ` 18.4305
Corporate Debt 83.63% Pool PTC 0.02%
PSU/PFI Bonds 0.01% Gilts 13.55% Other Assets 2.80%

26
Franklin India Government Securities Fund FIGSF
Company Name Rating Market Value` Lakhs
% ofassets
Company Name Rating Market Value` Lakhs
% ofassets
PORTFOLIOAs on March 31, 2015
INVESTMENT STYLE
8.60% Goi 2028 SOVEREIGN 2764.94 33.129.23% Goi 2043 SOVEREIGN 2307.03 27.639.20% Goi 2030 SOVEREIGN 1118.28 13.398.17% Goi 2044 SOVEREIGN 1044.50 12.518.40% Goi 2024 SOVEREIGN 417.30 5.008.15% Goi 2026 SOVEREIGN 103.20 1.248.27% Goi 2020 SOVEREIGN 102.17 1.22Total Gilts 7857.43 94.11
DATE OF ALLOTMENT : FIGSF - CP: June 21, 1999 ,FIGSF - PF Plan: May 7, 2004FIGSF - LT: December 7, 2001
LOAD STRUCTURE
FIGSF-CP/PF: Entry Load: Nil Exit Load: In respect of eachpurchase of Units – 0.50% if the Units are redeemed/switched-out within 3 months of allotment
FIGSF-LT : Entry Load: Nil Exit Load: Nil
*Prefund Expenses. **Modified duration of floating rate securitiesis calculated based on the next reset date.
Minimum Investment for New / existing InvestorsFIGSF - CP/LT: ` 10,000/1 (G); ` 25,000/1 (D); FIGSF-PF Plan: ` 25,000/1Additional Investment/multiples for Existing InvestorsFIGSF - CP/LT: ` 1000/1; FIGSF - PF Plan: ` 5000/1
FUND MANAGERS
Sachin Padwal - Desai & Umesh Sharma
NAV
FIGSF - CPGrowth PlanDividend PlanFIGSF - LTGrowth PlanDividend PlanBonus PlanFIGSF - PF PlanGrowth PlanDividend PlanFIGSF - CP (Direct)Growth PlanDividend PlanFIGSF - LT (Direct)Growth PlanDividend PlanBonus Plan
` 46.9042` 11.5204
` 32.8354` 11.5874` 11.7111
` 20.6015` 20.6015
` 47.4282` 11.7315
` 33.5062` 11.8441` 11.9542
FUND SIZE
FIGSF - CPFIGSF - LT
` 83.49 crores` 374.69 crores Medium term capital appreciation
with current incomeA fund that invests in Indian governmentsecurities
This Product is suitable for investors who are seeking*
* Investors should consult their financial advisers if in doubtabout whether the product is suitable for them.
**Please refer back cover for Product Label Guidelines
(BLUE)LOW RISK**
Product Label - FIGSF CP/PF/LT
Composite Plan Long Term Plan
# CBLO : 7.33%, Others (Cash/ Subscription/ Redmn/ Payable on purchase/ Recvble on sale/ Interest/
Expenses) : -1.44%
# Call, Cash & Other Current Assets Net Assets
491.608349.03
5.89100.00
Franklin India Banking & PSU Debt Fund FIBPDFAs on March 31, 2015
Product Label - FIBPDF
This product is suitable for investors who are seeking*
Regular Income for medium term
An income fund that invests predominantly in debt and money market instruments issued by Banksand Public Sector Undertakings.
* Investors should consult their financial advisers if in doubtabout whether the product is suitable for them.
**Please refer back cover for Product Label Guidelines
(BLUE)LOW RISK**
TYPE OF SCHEME / INVESTMENT OBJECTIVE
Umesh Sharma & Sachin Padwal-Desai
FUND MANAGER
NAV
FUND SIZE
` 135.87 crores
LOAD STRUCTURE
Entry LoadExit Load
Nil0.5%: if redeemed before 6 months from allotment date
An open-end income fund that seeks to provide regular income through a portfolio ofdebt and money market instruments consisting predominantly of securities issued by entities such as Banks and Public Sector Undertakings (PSUs).
DATE OF ALLOTMENTApril 25, 2014
MINIMUM INVESTMENT/MULTIPLES FOR NEW INVESTORS
`5,000/1
PORTFOLIO
Company Name Rating Market Value` Lakhs
% ofassets
Company Name Rating Market Value` Lakhs
% ofassets
# CBLO : 0.08%, Others (Cash/ Subscription/ Redmn/ Payable on purchase/ Recvble on sale/ Interest/
Expenses) : 2.43%
#EXPENSE RATIO#EXPENSE RATIO (DIRECT)
: 0.95%: 0.43%
# The rates specified are the actual average expenses charged for the month of March 2015. The above ratio includes the Service tax on Investment Management Fees. The above ratio also includes, proportionate charge in respect sales beyond T-15 cities subject to maximum of 30 bps on daily net assets, wherever applicable
Averagematurity
Yield tomaturity
FIGSF - CP/PF Plan:
FIGSF - LT:
18.78 years
18.79 years
7.87%*
8.00%*
8.57 years
8.73 years
Type of scheme / Investment objectiveAn open end dedicated Gilts scheme with the primary objective to generate credit risk-free return through investments in sovereign securities issued by the Central Government and/or state Government and/or any security unconditionally guaranteed by the Central Government and/or State Government for repayment of Principal and Interest.
State Bank Of Mysore CRISIL A1+ 1927.60 14.19Bank Of Baroda CRISIL A1+ 689.48 5.07Canara Bank CRISIL A1+ 98.64 0.73Total Money Market Instruments 2715.73 19.99
9.23% Goi 2043 SOVEREIGN 13842.20 36.94
9.20% Goi 2030 SOVEREIGN 11182.77 29.85
8.60% Goi 2028 SOVEREIGN 7187.79 19.18
8.40% Goi 2024 SOVEREIGN 2399.48 6.40
8.15% Goi 2026 SOVEREIGN 1135.22 3.03
8.27% Goi 2020 SOVEREIGN 408.70 1.09
Total Gilts 36156.15 96.50
Franklin Templeton Investmentswww.franklintempletonindia.com
YTM is the weighted average yield of portfolio based on the security level yield. Security level yield for securities with maturity greater than 60 days is the simple average of yield provided by AMFI designated agencies and for securities with maturity up to 60 days it is the last traded / valuation yield.
AVERAGE MATURITYYIELD TO MATURITYMODIFIED DURATION
5.60 years8.31%*5.16 years**
YTM is the weighted average yield of portfolio based on the security level yield. Security level yield for securities with maturity greater than 60 days is the simple average of yield provided by AMFI designated agencies and for securities with maturity up to 60 days it is the last traded / valuation yield.
# Call, Cash & Other Current Assets Net Assets
341.2413586.90
2.51100.00
Reliance Utilities And Power Pvt Ltd. CRISIL AAA 1766.57 13.00Total Corporate Debt 1766.57 13.00Power Finance Corporation Ltd. CRISIL AAA 2016.83 14.84Nabard CRISIL AAA 2001.38 14.73Power Grid Corporation Of India Ltd. CRISIL AAA 1926.49 14.18Rural Electrification Corporation Ltd CRISIL AAA 1796.95 13.23Steel AUthority Of India Ltd. CARE AAA 1021.71 7.52Total PSU/PFI Bonds 8763.36 64.50
EXPENSE RATIO#: FIGSF - CP / FIGSF-PF Plan: 1.74% (Direct): 0.70%FIGSF - LT: 1.71%, (Direct): 0.49%
# Call, Cash & Other Current Assets Net Assets
1313.01
37469.16
3.50
100.00
# CBLO : 15.53%, Others (Cash/ Subscription/ Redmn/ Payable on purchase/ Recvble on sale/ Interest/
Expenses) : -12.02%
# The rates specified are the actual average expenses charged for the month of March 2015. The above ratio includes the Service tax on Investment Management Fees. The above ratio also includes, proportionate charge in respect sales beyond T-15 cities subject to maximum of 30 bps on daily net assets, wherever applicable
Growth Plan 11.0232 `Dividend Plan 10.4987 `Direct - Growth Plan 11.0833 `Direct - Dividend Plan 10.5528 `
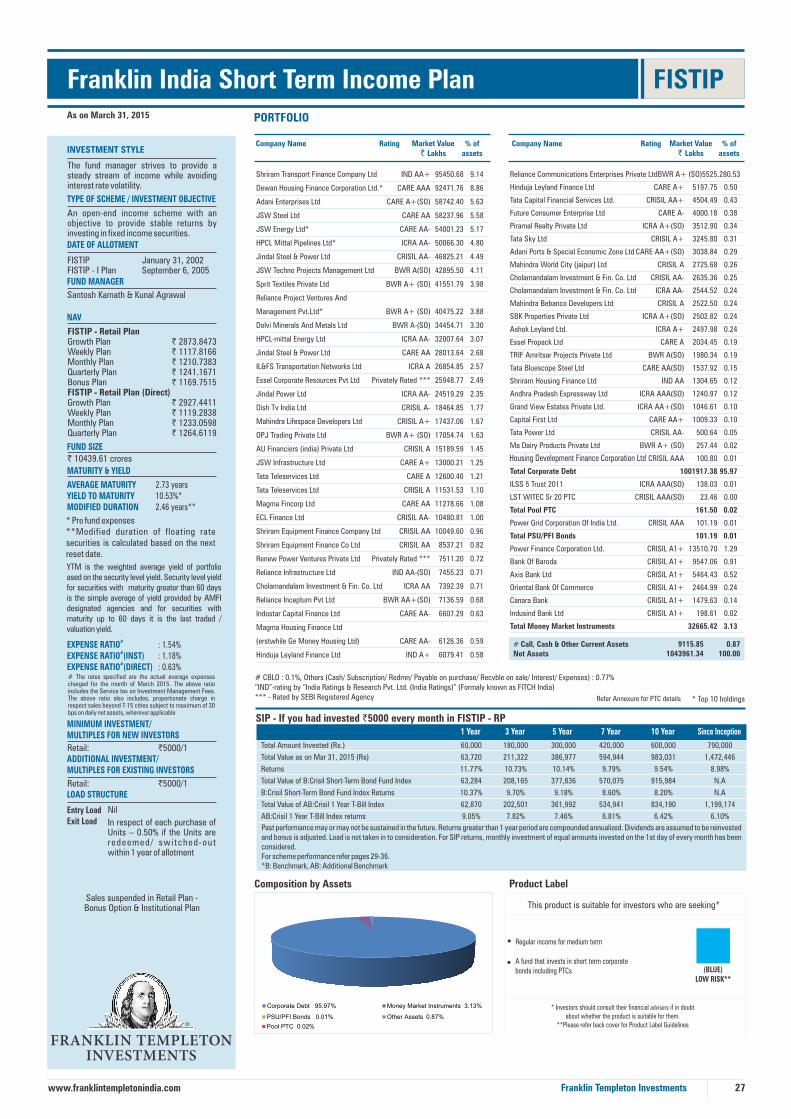
Franklin India Short Term Income Plan FISTIP
Company Name Rating Market Value` Lakhs
% ofassets
Company Name Rating Market Value` Lakhs
% ofassets
# CBLO : 0.1%, Others (Cash/ Subscription/ Redmn/ Payable on purchase/ Recvble on sale/ Interest/ Expenses) : 0.77%“IND”-rating by “India Ratings & Research Pvt. Ltd. (India Ratings)” (Formaly known as FITCH India)*** - Rated by SEBI Registered Agency
Product Label
This product is suitable for investors who are seeking*
Regular income for medium term
A fund that invests in short term corporatebonds including PTCs
* Investors should consult their financial advisers if in doubtabout whether the product is suitable for them.
**Please refer back cover for Product Label Guidelines
(BLUE)LOW RISK**
Composition by Assets
PORTFOLIOAs on March 31, 2015
INVESTMENT STYLE
TYPE OF SCHEME / INVESTMENT OBJECTIVE
DATE OF ALLOTMENT
FISTIPFISTIP - I Plan
January 31, 2002September 6, 2005
FUND MANAGER
Santosh Kamath & Kunal Agrawal
NAV
FUND SIZE
` 10439.61 crores
MATURITY & YIELD
AVERAGE MATURITYYIELD TO MATURITYMODIFIED DURATION
2.73 years10.53%*2.46 years**
#EXPENSE RATIO#EXPENSE RATIO (INST)#EXPENSE RATIO (DIRECT)
: 1.54%: 1.18%: 0.63%
MINIMUM INVESTMENT/MULTIPLES FOR NEW INVESTORS
Retail:ADDITIONAL INVESTMENT/MULTIPLES FOR EXISTING INVESTORS
`5000/1
Retail: `5000/1LOAD STRUCTURE
Entry LoadExit Load
Sales suspended in Retail Plan -Bonus Option & Institutional Plan
27
* Top 10 holdings
Nil
Refer Annexure for PTC details
Franklin Templeton Investmentswww.franklintempletonindia.com
YTM is the weighted average yield of portfolio ased on the security level yield. Security level yield for securities with maturity greater than 60 days is the simple average of yield provided by AMFI designated agencies and for securities with maturity up to 60 days it is the last traded / valuation yield.
Reliance Communications Enterprises Private Ltd BWR A+ (SO) 5525.28 0.53
Hinduja Leyland Finance Ltd CARE A+ 5197.75 0.50
Tata Capital Financial Services Ltd. CRISIL AA+ 4504.49 0.43
Future Consumer Enterprise Ltd CARE A- 4000.18 0.38
Piramal Realty Private Ltd ICRA A+(SO) 3512.90 0.34
Tata Sky Ltd CRISIL A+ 3245.80 0.31
Adani Ports & Special Economic Zone Ltd CARE AA+(SO) 3038.84 0.29
Mahindra World City (jaipur) Ltd CRISIL A 2725.68 0.26
Cholamandalam Investment & Fin. Co. Ltd CRISIL AA- 2635.36 0.25
Cholamandalam Investment & Fin. Co. Ltd ICRA AA- 2544.52 0.24
Mahindra Bebanco Developers Ltd CRISIL A 2522.50 0.24
SBK Properties Private Ltd ICRA A+(SO) 2502.82 0.24
Ashok Leyland Ltd. ICRA A+ 2497.98 0.24
Essel Propack Ltd CARE A 2034.45 0.19
TRIF Amritsar Projects Private Ltd BWR A(SO) 1980.34 0.19
Tata Bluescope Steel Ltd CARE AA(SO) 1537.92 0.15
Shriram Housing Finance Ltd IND AA 1304.65 0.12
Andhra Pradesh Expressway Ltd ICRA AAA(SO) 1240.97 0.12
Grand View Estates Private Ltd. ICRA AA+(SO) 1046.61 0.10
Capital First Ltd CARE AA+ 1009.33 0.10
Tata Power Ltd CRISIL AA- 500.64 0.05
Ma Dairy Products Private Ltd BWR A+ (SO) 257.44 0.02
CRISIL AAA 100.80 0.01
Total Corporate Debt 1001917.38 95.97
ILSS 5 Trust 2011 ICRA AAA(SO) 138.03 0.01
LST WITEC Sr 20 PTC CRISIL AAA(SO) 23.46 0.00
Total Pool PTC 161.50 0.02
Power Grid Corporation Of India Ltd. CRISIL AAA 101.19 0.01
Total PSU/PFI Bonds 101.19 0.01
Power Finance Corporation Ltd. CRISIL A1+ 13510.70 1.29
Bank Of Baroda CRISIL A1+ 9547.06 0.91
Axis Bank Ltd CRISIL A1+ 5464.43 0.52
Oriental Bank Of Commerce CRISIL A1+ 2464.99 0.24
Canara Bank CRISIL A1+ 1479.63 0.14
Indusind Bank Ltd CRISIL A1+ 198.61 0.02
Total Money Market Instruments 32665.42 3.13
# Call, Cash & Other Current Assets Net Assets
9115.851043961.34
0.87100.00
SIP - If you had invested `5000 every month in FISTIP - RPSince Inception10 Year7 Year5 Year3 Year1 Year
Past performance may or may not be sustained in the future. Returns greater than 1 year period are compounded annualized. Dividends are assumed to be reinvested and bonus is adjusted. Load is not taken in to consideration. For SIP returns, monthly investment of equal amounts invested on the 1st day of every month has been considered. For scheme performance refer pages 29-36.*B: Benchmark, AB: Additional Benchmark
Total Amount Invested (Rs.) 60,000 180,000 300,000 420,000 600,000 790,000
Total Value as on Mar 31, 2015 (Rs) 63,720 211,322 386,977 594,944 983,031 1,472,446
Returns 11.77% 10.73% 10.14% 9.79% 9.54% 8.98%
Total Value of B:Crisil Short-Term Bond Fund Index 63,284 208,165 377,836 570,075 915,984 N.A
B:Crisil Short-Term Bond Fund Index Returns 10.37% 9.70% 9.18% 8.60% 8.20% N.A
Total Value of AB:Crisil 1 Year T-Bill Index 62,870 202,501 361,992 534,941 834,190 1,199,174
AB:Crisil 1 Year T-Bill Index returns 9.05% 7.82% 7.46% 6.81% 6.42% 6.10%
Shriram Transport Finance Company Ltd IND AA+ 95450.68 9.14
Dewan Housing Finance Corporation Ltd.* CARE AAA 92471.76 8.86
Adani Enterprises Ltd CARE A+(SO) 58742.40 5.63
JSW Steel Ltd CARE AA 58237.96 5.58
JSW Energy Ltd* CARE AA- 54001.23 5.17
HPCL Mittal Pipelines Ltd* ICRA AA- 50066.30 4.80
Jindal Steel & Power Ltd CRISIL AA- 46825.21 4.49
JSW Techno Projects Management Ltd BWR A(SO) 42895.50 4.11
Sprit Textiles Private Ltd BWR A+ (SO) 41551.79 3.98
Reliance Project Ventures And
Management Pvt.Ltd* BWR A+ (SO) 40475.22 3.88
Dolvi Minerals And Metals Ltd BWR A-(SO) 34454.71 3.30
HPCL-mittal Energy Ltd ICRA AA- 32007.64 3.07
Jindal Steel & Power Ltd CARE AA 28013.64 2.68
IL&FS Transportation Networks Ltd ICRA A 26854.85 2.57
Essel Corporate Resources Pvt Ltd Privately Rated *** 25948.77 2.49
Jindal Power Ltd ICRA AA- 24519.29 2.35
Dish Tv India Ltd CRISIL A- 18464.85 1.77
Mahindra Lifespace Developers Ltd CRISIL A+ 17437.06 1.67
OPJ Trading Private Ltd BWR A+ (SO) 17054.74 1.63
AU Financiers (india) Private Ltd CRISIL A 15189.59 1.45
JSW Infrastructure Ltd CARE A+ 13000.21 1.25
Tata Teleservices Ltd CARE A 12600.46 1.21
Tata Teleservices Ltd CRISIL A 11531.53 1.10
Magma Fincorp Ltd CARE AA 11278.66 1.08
ECL Finance Ltd CRISIL AA- 10480.81 1.00
Shriram Equipment Finance Company Ltd CRISIL AA 10049.60 0.96
Shriram Equipment Finance Co Ltd CRISIL AA 8537.21 0.82
Renew Power Ventures Private Ltd Privately Rated *** 7511.20 0.72
Reliance Infrastructure Ltd IND AA-(SO) 7455.23 0.71
Cholamandalam Investment & Fin. Co. Ltd ICRA AA 7392.39 0.71
Reliance Inceptum Pvt Ltd BWR AA+(SO) 7136.59 0.68
Indostar Capital Finance Ltd CARE AA- 6607.29 0.63
Magma Housing Finance Ltd
(erstwhile Ge Money Housing Ltd) CARE AA- 6126.36 0.59
Hinduja Leyland Finance Ltd IND A+ 6079.41 0.58
# The rates specified are the actual average expenses charged for the month of March 2015. The above ratio includes the Service tax on Investment Management Fees. The above ratio also includes, proportionate charge in respect sales beyond T-15 cities subject to maximum of 30 bps on daily net assets, wherever applicable
FISTIP - Retail PlanGrowth Plan ` 2873.8473Weekly Plan ` 1117.8166Monthly Plan ` 1210.7383Quarterly Plan ` 1241.1671Bonus Plan ` 1169.7515FISTIP - Retail Plan (Direct)Growth Plan ` 2927.4411Weekly Plan ` 1119.2838Monthly Plan ` 1233.0598Quarterly Plan ` 1264.6119
Corporate Debt 95.97%
Pool PTC 0.02%
PSU/PFI Bonds 0.01% Other Assets 0.87%
Money Market Instruments 3.13%
Housing Development Finance Corporation Ltd
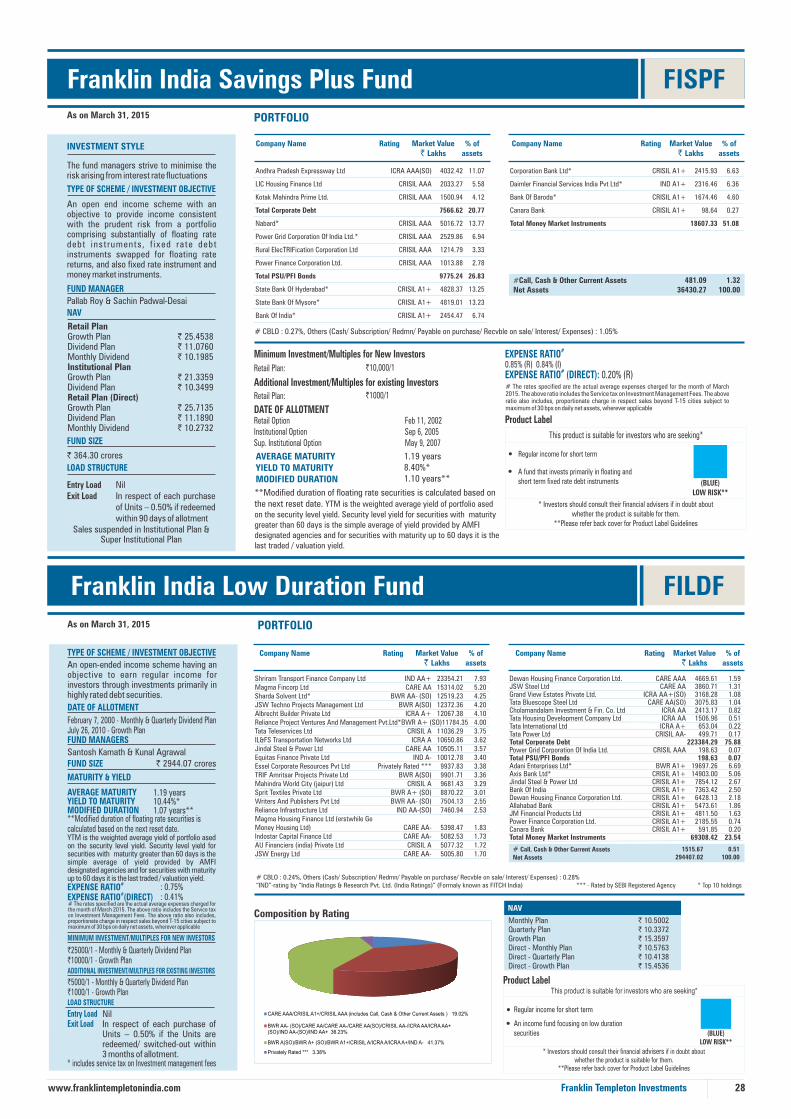
Franklin India Savings Plus Fund FISPF
Company Name Rating Market Value` Lakhs
% ofassets
Company Name Rating Market Value` Lakhs
% ofassets
# CBLO : 0.27%, Others (Cash/ Subscription/ Redmn/ Payable on purchase/ Recvble on sale/ Interest/ Expenses) : 1.05%
Minimum Investment/Multiples for New Investors
Retail Plan: `10,000/1
Additional Investment/Multiples for existing Investors Retail Plan: `1000/1
DATE OF ALLOTMENTRetail OptionInstitutional OptionSup. Institutional Option
Feb 11, 2002Sep 6, 2005May 9, 2007
AVERAGE MATURITYYIELD TO MATURITYMODIFIED DURATION
1.19 years8.40%*1.10 years**
#EXPENSE RATIO0.85% (R) 0.84% (I)
#EXPENSE RATIO (DIRECT): 0.20% (R)# The rates specified are the actual average expenses charged for the month of March 2015. The above ratio includes the Service tax on Investment Management Fees. The above ratio also includes, proportionate charge in respect sales beyond T-15 cities subject to maximum of 30 bps on daily net assets, wherever applicable
Product Label
PORTFOLIOAs on March 31, 2015
INVESTMENT STYLE
TYPE OF SCHEME / INVESTMENT OBJECTIVE
Pallab Roy & Sachin Padwal-Desai
FUND MANAGER
NAV
FUND SIZE
` 364.30 crores
LOAD STRUCTURE
Entry LoadExit Load
NilIn respect of each purchase of Units – 0.50% if redeemed within 90 days of allotment
Sales suspended in Institutional Plan &Super Institutional Plan
This product is suitable for investors who are seeking*
Regular income for short term
A fund that invests primarily in floating andshort term fixed rate debt instruments
* Investors should consult their financial advisers if in doubt aboutwhether the product is suitable for them.
**Please refer back cover for Product Label Guidelines
(BLUE)LOW RISK**
28
Franklin India Low Duration Fund FILDF
Company Name Rating Market Value` Lakhs
% ofassets
Company Name Rating Market Value` Lakhs
% ofassets
# CBLO : 0.24%, Others (Cash/ Subscription/ Redmn/ Payable on purchase/ Recvble on sale/ Interest/ Expenses) : 0.28%“IND”-rating by “India Ratings & Research Pvt. Ltd. (India Ratings)” (Formaly known as FITCH India)
NAV
TYPE OF SCHEME / INVESTMENT OBJECTIVE
As on March 31, 2015
DATE OF ALLOTMENT
February 7, 2000 - Monthly & Quarterly Dividend PlanJuly 26, 2010 - Growth PlanFUND MANAGERS
Santosh Kamath & Kunal AgrawalFUND SIZE ` 2944.07 crores
AVERAGE MATURITYYIELD TO MATURITYMODIFIED DURATION
MATURITY & YIELD
1.19 years10.44%*1.07 years**
**Modified duration of floating rate securities iscalculated based on the next reset date.
#EXPENSE RATIO#EXPENSE RATIO (DIRECT)
: 0.75%: 0.41%
MINIMUM INVESTMENT/MULTIPLES FOR NEW INVESTORS
`25000/1 - Monthly & Quarterly Dividend Plan`10000/1 - Growth PlanADDITIONAL INVESTMENT/MULTIPLES FOR EXISTING INVESTORS
`5000/1 - Monthly & Quarterly Dividend Plan`1000/1 - Growth PlanLOAD STRUCTURE
NilIn respect of each purchase of Units – 0.50% if the Units are redeemed/ switched-out within 3 months of allotment.
Entry LoadExit Load
* includes service tax on Investment management fees
PORTFOLIO
Product LabelThis product is suitable for investors who are seeking*
Regular income for short term
An income fund focusing on low durationsecurities
* Investors should consult their financial advisers if in doubt aboutwhether the product is suitable for them.
**Please refer back cover for Product Label Guidelines
(BLUE)LOW RISK**
Composition by Rating
The fund managers strive to minimise the risk arising from interest rate fluctuations
Franklin Templeton Investmentswww.franklintempletonindia.com
**Modified duration of floating rate securities is calculated based onthe next reset date. YTM is the weighted average yield of portfolio ased on the security level yield. Security level yield for securities with maturity greater than 60 days is the simple average of yield provided by AMFI designated agencies and for securities with maturity up to 60 days it is the last traded / valuation yield.
YTM is the weighted average yield of portfolio ased on the security level yield. Security level yield for securities with maturity greater than 60 days is the simple average of yield provided by AMFI designated agencies and for securities with maturity up to 60 days it is the last traded / valuation yield.
Corporation Bank Ltd* CRISIL A1+ 2415.93 6.63
Daimler Financial Services India Pvt Ltd* IND A1+ 2316.46 6.36
Bank Of Baroda* CRISIL A1+ 1674.46 4.60
Canara Bank CRISIL A1+ 98.64 0.27
Total Money Market Instruments 18607.33 51.08
#Call, Cash & Other Current Assets Net Assets
481.0936430.27
1.32100.00
Shriram Transport Finance Company Ltd IND AA+ 23354.21 7.93Magma Fincorp Ltd CARE AA 15314.02 5.20Sharda Solvent Ltd* BWR AA- (SO) 12519.23 4.25JSW Techno Projects Management Ltd BWR A(SO) 12372.36 4.20Albrecht Builder Private Ltd ICRA A+ 12067.38 4.10Reliance Project Ventures And Management Pvt.Ltd* BWR A+ (SO) 11784.35 4.00Tata Teleservices Ltd CRISIL A 11036.29 3.75IL&FS Transportation Networks Ltd ICRA A 10650.86 3.62Jindal Steel & Power Ltd CARE AA 10505.11 3.57Equitas Finance Private Ltd IND A- 10012.78 3.40Essel Corporate Resources Pvt Ltd Privately Rated *** 9937.83 3.38TRIF Amritsar Projects Private Ltd BWR A(SO) 9901.71 3.36Mahindra World City (jaipur) Ltd CRISIL A 9681.43 3.29Sprit Textiles Private Ltd BWR A+ (SO) 8870.22 3.01Writers And Publishers Pvt Ltd BWR AA- (SO) 7504.13 2.55Reliance Infrastructure Ltd IND AA-(SO) 7460.94 2.53Magma Housing Finance Ltd (erstwhile Ge Money Housing Ltd) CARE AA- 5398.47 1.83Indostar Capital Finance Ltd CARE AA- 5082.53 1.73AU Financiers (india) Private Ltd CRISIL A 5077.32 1.72JSW Energy Ltd CARE AA- 5005.80 1.70
Dewan Housing Finance Corporation Ltd. CARE AAA 4669.61 1.59JSW Steel Ltd CARE AA 3860.71 1.31Grand View Estates Private Ltd. ICRA AA+(SO) 3168.28 1.08Tata Bluescope Steel Ltd CARE AA(SO) 3075.83 1.04Cholamandalam Investment & Fin. Co. Ltd ICRA AA 2413.17 0.82Tata Housing Development Company Ltd ICRA AA 1506.96 0.51Tata International Ltd ICRA A+ 653.04 0.22Tata Power Ltd CRISIL AA- 499.71 0.17Total Corporate Debt 223384.29 75.88Power Grid Corporation Of India Ltd. CRISIL AAA 198.63 0.07Total PSU/PFI Bonds 198.63 0.07Adani Enterprises Ltd* BWR A1+ 19697.26 6.69Axis Bank Ltd* CRISIL A1+ 14903.00 5.06Jindal Steel & Power Ltd CRISIL A1+ 7854.12 2.67Bank Of India CRISIL A1+ 7363.42 2.50Dewan Housing Finance Corporation Ltd. CRISIL A1+ 6428.13 2.18Allahabad Bank CRISIL A1+ 5473.61 1.86JM Financial Products Ltd CRISIL A1+ 4811.50 1.63Power Finance Corporation Ltd. CRISIL A1+ 2185.55 0.74Canara Bank CRISIL A1+ 591.85 0.20Total Money Market Instruments 69308.42 23.54
Andhra Pradesh Expressway Ltd ICRA AAA(SO) 4032.42 11.07
LIC Housing Finance Ltd CRISIL AAA 2033.27 5.58
Kotak Mahindra Prime Ltd. CRISIL AAA 1500.94 4.12
Total Corporate Debt 7566.62 20.77
Nabard* CRISIL AAA 5016.72 13.77
Power Grid Corporation Of India Ltd.* CRISIL AAA 2529.86 6.94
Rural ElecTRIFication Corporation Ltd CRISIL AAA 1214.79 3.33
Power Finance Corporation Ltd. CRISIL AAA 1013.88 2.78
Total PSU/PFI Bonds 9775.24 26.83
State Bank Of Hyderabad* CRISIL A1+ 4828.37 13.25
State Bank Of Mysore* CRISIL A1+ 4819.01 13.23
Bank Of India* CRISIL A1+ 2454.47 6.74
* Top 10 holdings
# Call, Cash & Other Current Assets Net Assets
1515.67294407.02
0.51100.00
*** - Rated by SEBI Registered Agency
# The rates specified are the actual average expenses charged for the month of March 2015. The above ratio includes the Service tax on Investment Management Fees. The above ratio also includes, proportionate charge in respect sales beyond T-15 cities subject to maximum of 30 bps on daily net assets, wherever applicable
Retail PlanGrowth Plan ` 25.4538Dividend Plan ` 11.0760Monthly Dividend ` 10.1985Institutional PlanGrowth Plan ` 21.3359Dividend Plan ` 10.3499Retail Plan (Direct)Growth Plan ` 25.7135Dividend Plan ` 11.1890Monthly Dividend ` 10.2732
Monthly Plan ` 10.5002Quarterly Plan ` 10.3372Growth Plan ` 15.3597Direct - Monthly Plan ` 10.5763Direct - Quarterly Plan ` 10.4138Direct - Growth Plan ` 15.4536
CARE AAA/CRISIL A1+/CRISIL AAA (includes Call, Cash & Other Current Assets ) 19.02%
BWR AA- (SO)/CARE AA/CARE AA-/CARE AA(SO)/CRISIL AA-/ICRA AA/ICRA AA+(SO)/IND AA-(SO)/IND AA+ 36.23%
BWR A(SO)/BWR A+ (SO)/BWR A1+/CRISIL A/ICRA A/ICRA A+/IND A- 41.37%
Privately Rated *** 3.38%
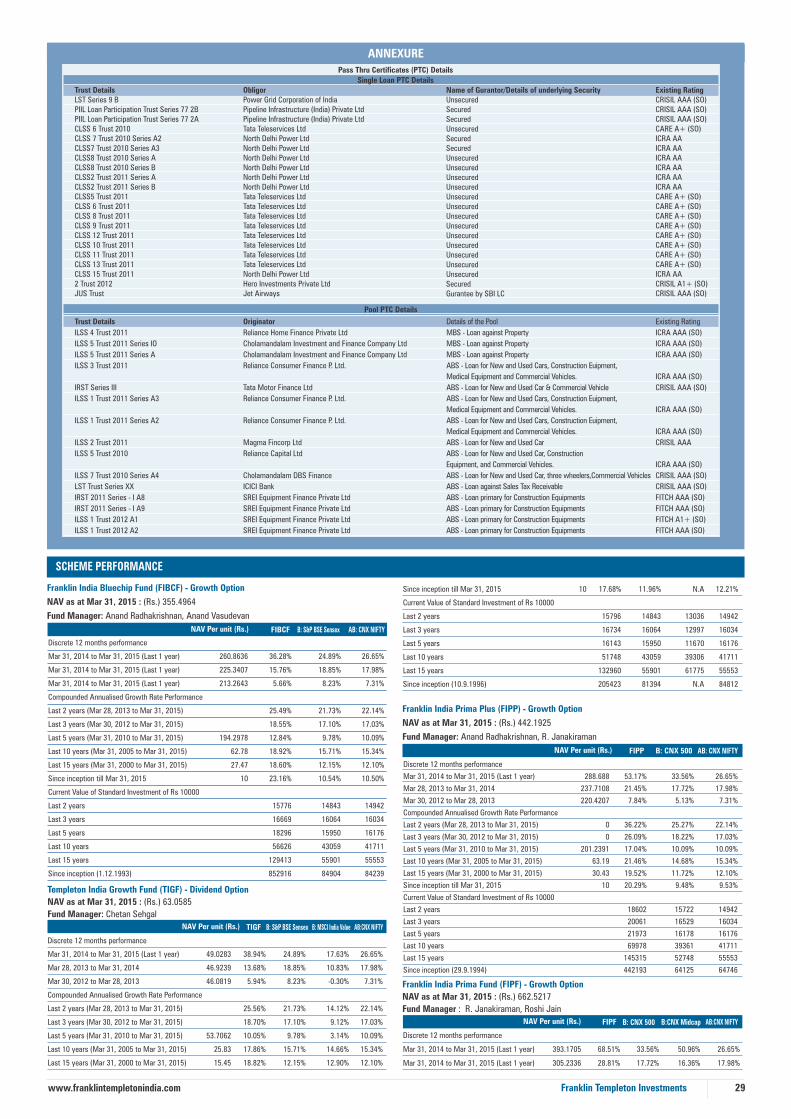
SCHEME PERFORMANCE
Franklin India Bluechip Fund (FIBCF) - Growth Option
NAV as at Mar 31, 2015 : (Rs.) 355.4964
Fund Manager: Anand Radhakrishnan, Anand Vasudevan
NAV Per unit (Rs.) FIBCF AB: CNX NIFTYB: S&P BSE Sensex
Templeton India Growth Fund (TIGF) - Dividend Option
NAV as at Mar 31, 2015 : (Rs.) 63.0585
Fund Manager: Chetan Sehgal
NAV Per unit (Rs.) B: S&P BSE Sensex AB:CNX NIFTYB: MSCI India ValueTIGF
NAV Per unit (Rs.) FIPP AB: CNX NIFTYB: CNX 500
Franklin India Prima Plus (FIPP) - Growth Option
NAV as at Mar 31, 2015 : (Rs.) 442.1925
Fund Manager: Anand Radhakrishnan, R. Janakiraman
Franklin India Prima Fund (FIPF) - Growth Option
NAV as at Mar 31, 2015 : (Rs.) 662.5217
Fund Manager : R. Janakiraman, Roshi Jain
NAV Per unit (Rs.) B: CNX 500 AB:CNX NIFTYB:CNX MidcapFIPF
29Franklin Templeton Investmentswww.franklintempletonindia.com
Discrete 12 months performance
Mar 31, 2014 to Mar 31, 2015 (Last 1 year) 49.0283 38.94% 24.89% 17.63% 26.65%
Mar 28, 2013 to Mar 31, 2014 46.9239 13.68% 18.85% 10.83% 17.98%
Mar 30, 2012 to Mar 28, 2013 46.0819 5.94% 8.23% -0.30% 7.31%
Compounded Annualised Growth Rate Performance
Last 2 years (Mar 28, 2013 to Mar 31, 2015) 25.56% 21.73% 14.12% 22.14%
Last 3 years (Mar 30, 2012 to Mar 31, 2015) 18.70% 17.10% 9.12% 17.03%
Last 5 years (Mar 31, 2010 to Mar 31, 2015) 53.7062 10.05% 9.78% 3.14% 10.09%
Last 10 years (Mar 31, 2005 to Mar 31, 2015) 25.83 17.86% 15.71% 14.66% 15.34%
Last 15 years (Mar 31, 2000 to Mar 31, 2015) 15.45 18.82% 12.15% 12.90% 12.10%
Since inception till Mar 31, 2015 10 17.68% 11.96% N.A 12.21%
Current Value of Standard Investment of Rs 10000
Last 2 years 15796 14843 13036 14942
Last 3 years 16734 16064 12997 16034
Last 5 years 16143 15950 11670 16176
Last 10 years 51748 43059 39306 41711
Last 15 years 132960 55901 61775 55553
Since inception (10.9.1996) 205423 81394 N.A 84812
Discrete 12 months performance
Mar 31, 2014 to Mar 31, 2015 (Last 1 year) 288.688 53.17% 33.56% 26.65%
Mar 28, 2013 to Mar 31, 2014 237.7108 21.45% 17.72% 17.98%
Mar 30, 2012 to Mar 28, 2013 220.4207 7.84% 5.13% 7.31%
Compounded Annualised Growth Rate Performance
Last 2 years (Mar 28, 2013 to Mar 31, 2015) 0 36.22% 25.27% 22.14%
Last 3 years (Mar 30, 2012 to Mar 31, 2015) 0 26.09% 18.22% 17.03%
Last 5 years (Mar 31, 2010 to Mar 31, 2015) 201.2391 17.04% 10.09% 10.09%
Last 10 years (Mar 31, 2005 to Mar 31, 2015) 63.19 21.46% 14.68% 15.34%
Last 15 years (Mar 31, 2000 to Mar 31, 2015) 30.43 19.52% 11.72% 12.10%
Since inception till Mar 31, 2015 10 20.29% 9.48% 9.53%
Current Value of Standard Investment of Rs 10000
Last 2 years 18602 15722 14942
Last 3 years 20061 16529 16034
Last 5 years 21973 16178 16176
Last 10 years 69978 39361 41711
Last 15 years 145315 52748 55553
Since inception (29.9.1994) 442193 64125 64746
Discrete 12 months performance
Mar 31, 2014 to Mar 31, 2015 (Last 1 year) 393.1705 68.51% 33.56% 50.96% 26.65%
Mar 31, 2014 to Mar 31, 2015 (Last 1 year) 305.2336 28.81% 17.72% 16.36% 17.98%
ANNEXURE
Pass Thru Certificates (PTC) Details
Single Loan PTC DetailsTrust DetailsLST Series 9 BPIIL Loan Participation Trust Series 77 2BPIIL Loan Participation Trust Series 77 2ACLSS 6 Trust 2010CLSS 7 Trust 2010 Series A2 CLSS7 Trust 2010 Series A3 CLSS8 Trust 2010 Series ACLSS8 Trust 2010 Series B CLSS2 Trust 2011 Series A CLSS2 Trust 2011 Series B CLSS5 Trust 2011CLSS 6 Trust 2011CLSS 8 Trust 2011CLSS 9 Trust 2011CLSS 12 Trust 2011CLSS 10 Trust 2011CLSS 11 Trust 2011CLSS 13 Trust 2011CLSS 15 Trust 2011 2 Trust 2012JUS Trust
ObligorPower Grid Corporation of IndiaPipeline Infrastructure (India) Private LtdPipeline Infrastructure (India) Private LtdTata Teleservices LtdNorth Delhi Power LtdNorth Delhi Power LtdNorth Delhi Power LtdNorth Delhi Power LtdNorth Delhi Power LtdNorth Delhi Power LtdTata Teleservices LtdTata Teleservices LtdTata Teleservices LtdTata Teleservices LtdTata Teleservices LtdTata Teleservices LtdTata Teleservices LtdTata Teleservices LtdNorth Delhi Power LtdHero Investments Private LtdJet Airways
Name of Gurantor/Details of underlying SecurityUnsecuredSecuredSecuredUnsecuredSecuredSecuredUnsecuredUnsecuredUnsecuredUnsecuredUnsecuredUnsecuredUnsecuredUnsecuredUnsecuredUnsecuredUnsecuredUnsecuredUnsecuredSecuredGurantee by SBI LC
Existing RatingCRISIL AAA (SO)CRISIL AAA (SO)CRISIL AAA (SO)CARE A+ (SO)ICRA AAICRA AAICRA AAICRA AAICRA AAICRA AACARE A+ (SO)CARE A+ (SO)CARE A+ (SO)CARE A+ (SO)CARE A+ (SO)CARE A+ (SO)CARE A+ (SO)CARE A+ (SO)ICRA AACRISIL A1+ (SO)CRISIL AAA (SO)
Trust Details
ILSS 4 Trust 2011
ILSS 5 Trust 2011 Series IO
ILSS 5 Trust 2011 Series A
ILSS 3 Trust 2011
IRST Series III
ILSS 1 Trust 2011 Series A3
ILSS 1 Trust 2011 Series A2
ILSS 2 Trust 2011
ILSS 5 Trust 2010
ILSS 7 Trust 2010 Series A4
LST Trust Series XX
IRST 2011 Series - I A8
IRST 2011 Series - I A9
ILSS 1 Trust 2012 A1
ILSS 1 Trust 2012 A2
Originator
Reliance Home Finance Private Ltd
Cholamandalam Investment and Finance Company Ltd
Cholamandalam Investment and Finance Company Ltd
Reliance Consumer Finance P. Ltd.
Tata Motor Finance Ltd
Reliance Consumer Finance P. Ltd.
Reliance Consumer Finance P. Ltd.
Magma Fincorp Ltd
Reliance Capital Ltd
Cholamandalam DBS Finance
ICICI Bank
SREI Equipment Finance Private Ltd
SREI Equipment Finance Private Ltd
SREI Equipment Finance Private Ltd
SREI Equipment Finance Private Ltd
Details of the Pool
MBS - Loan against Property
MBS - Loan against Property
MBS - Loan against Property
ABS - Loan for New and Used Cars, Construction Euipment,
Medical Equipment and Commercial Vehicles.
ABS - Loan for New and Used Car & Commercial Vehicle
ABS - Loan for New and Used Cars, Construction Euipment,
Medical Equipment and Commercial Vehicles.
ABS - Loan for New and Used Cars, Construction Euipment,
Medical Equipment and Commercial Vehicles.
ABS - Loan for New and Used Car
ABS - Loan for New and Used Car, Construction
Equipment, and Commercial Vehicles.
ABS - Loan for New and Used Car, three wheelers,Commercial Vehicles
ABS - Loan against Sales Tax Receivable
ABS - Loan primary for Construction Equipments
ABS - Loan primary for Construction Equipments
ABS - Loan primary for Construction Equipments
ABS - Loan primary for Construction Equipments
Existing Rating
ICRA AAA (SO)
ICRA AAA (SO)
ICRA AAA (SO)
ICRA AAA (SO)
CRISIL AAA (SO)
ICRA AAA (SO)
ICRA AAA (SO)
CRISIL AAA
ICRA AAA (SO)
CRISIL AAA (SO)
CRISIL AAA (SO)
FITCH AAA (SO)
FITCH AAA (SO)
FITCH A1+ (SO)
FITCH AAA (SO)
Pool PTC Details
Discrete 12 months performance
Mar 31, 2014 to Mar 31, 2015 (Last 1 year) 260.8636 36.28% 24.89% 26.65%
Mar 31, 2014 to Mar 31, 2015 (Last 1 year) 225.3407 15.76% 18.85% 17.98%
Mar 31, 2014 to Mar 31, 2015 (Last 1 year) 213.2643 5.66% 8.23% 7.31%
Compounded Annualised Growth Rate Performance
Last 2 years (Mar 28, 2013 to Mar 31, 2015) 25.49% 21.73% 22.14%
Last 3 years (Mar 30, 2012 to Mar 31, 2015) 18.55% 17.10% 17.03%
Last 5 years (Mar 31, 2010 to Mar 31, 2015) 194.2978 12.84% 9.78% 10.09%
Last 10 years (Mar 31, 2005 to Mar 31, 2015) 62.78 18.92% 15.71% 15.34%
Last 15 years (Mar 31, 2000 to Mar 31, 2015) 27.47 18.60% 12.15% 12.10%
Since inception till Mar 31, 2015 10 23.16% 10.54% 10.50%
Current Value of Standard Investment of Rs 10000
Last 2 years 15776 14843 14942
Last 3 years 16669 16064 16034
Last 5 years 18296 15950 16176
Last 10 years 56626 43059 41711
Last 15 years 129413 55901 55553
Since inception (1.12.1993) 852916 84904 84239
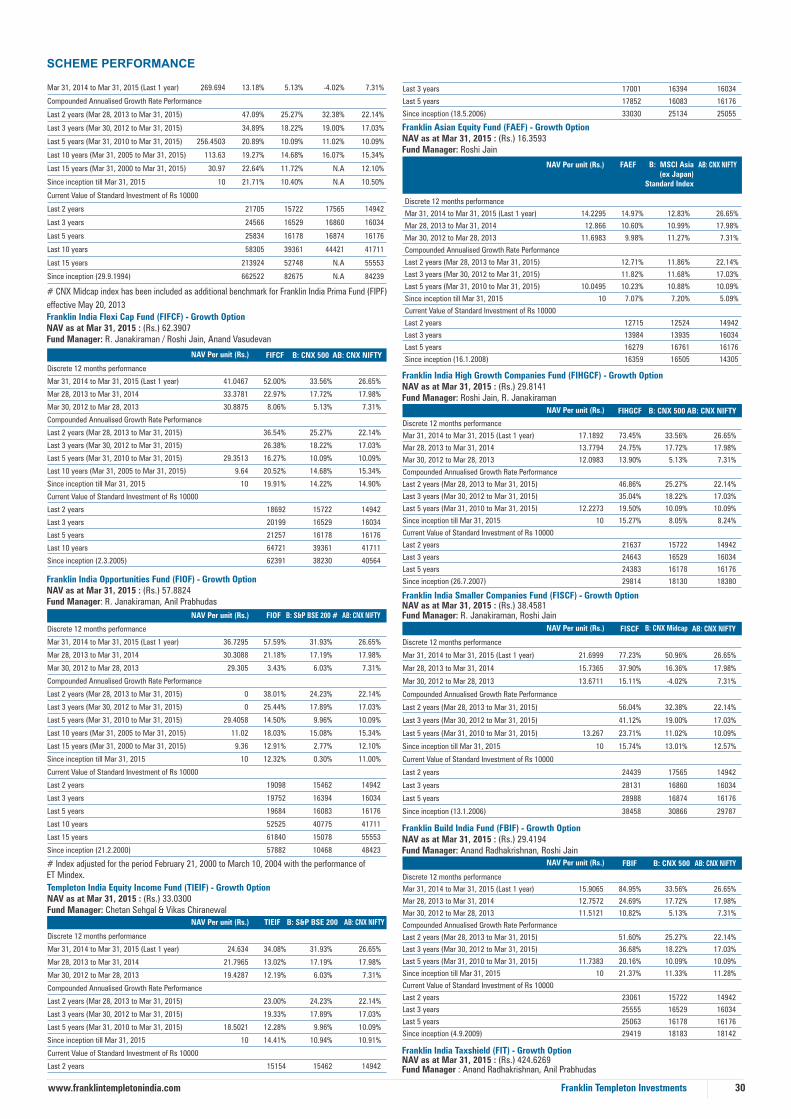
Discrete 12 months performance
Mar 31, 2014 to Mar 31, 2015 (Last 1 year) 41.0467 52.00% 33.56% 26.65%
Mar 28, 2013 to Mar 31, 2014 33.3781 22.97% 17.72% 17.98%
Mar 30, 2012 to Mar 28, 2013 30.8875 8.06% 5.13% 7.31%
Compounded Annualised Growth Rate Performance
Last 2 years (Mar 28, 2013 to Mar 31, 2015) 36.54% 25.27% 22.14%
Last 3 years (Mar 30, 2012 to Mar 31, 2015) 26.38% 18.22% 17.03%
Last 5 years (Mar 31, 2010 to Mar 31, 2015) 29.3513 16.27% 10.09% 10.09%
Last 10 years (Mar 31, 2005 to Mar 31, 2015) 9.64 20.52% 14.68% 15.34%
Since inception till Mar 31, 2015 10 19.91% 14.22% 14.90%
Current Value of Standard Investment of Rs 10000
Last 2 years 18692 15722 14942
Last 3 years 20199 16529 16034
Last 5 years 21257 16178 16176
Last 10 years 64721 39361 41711
Since inception (2.3.2005) 62391 38230 40564
SCHEME PERFORMANCE
# CNX Midcap index has been included as additional benchmark for Franklin India Prima Fund (FIPF)
effective May 20, 2013
Franklin India Flexi Cap Fund (FIFCF) - Growth OptionNAV as at Mar 31, 2015 : (Rs.) 62.3907Fund Manager: R. Janakiraman / Roshi Jain, Anand Vasudevan
NAV Per unit (Rs.) FIFCF AB: CNX NIFTYB: CNX 500
Franklin India Opportunities Fund (FIOF) - Growth OptionNAV as at Mar 31, 2015 : (Rs.) 57.8824Fund Manager: R. Janakiraman, Anil Prabhudas
NAV Per unit (Rs.) FIOF AB: CNX NIFTYB: S&P BSE 200 #
Templeton India Equity Income Fund (TIEIF) - Growth OptionNAV as at Mar 31, 2015 : (Rs.) 33.0300Fund Manager: Chetan Sehgal & Vikas Chiranewal
NAV Per unit (Rs.) TIEIF AB: CNX NIFTYB: S&P BSE 200
Franklin India High Growth Companies Fund (FIHGCF) - Growth OptionNAV as at Mar 31, 2015 : (Rs.) 29.8141Fund Manager: Roshi Jain, R. Janakiraman
NAV Per unit (Rs.) FIHGCF AB: CNX NIFTYB: CNX 500
Franklin India Smaller Companies Fund (FISCF) - Growth OptionNAV as at Mar 31, 2015 : (Rs.) 38.4581Fund Manager: R. Janakiraman, Roshi Jain
NAV Per unit (Rs.) FISCF AB: CNX NIFTYB: CNX Midcap
Franklin Build India Fund (FBIF) - Growth OptionNAV as at Mar 31, 2015 : (Rs.) 29.4194Fund Manager: Anand Radhakrishnan, Roshi Jain
NAV Per unit (Rs.) FBIF AB: CNX NIFTYB: CNX 500
Franklin India Taxshield (FIT) - Growth OptionNAV as at Mar 31, 2015 : (Rs.) 424.6269Fund Manager : Anand Radhakrishnan, Anil Prabhudas
30Franklin Templeton Investmentswww.franklintempletonindia.com
Mar 31, 2014 to Mar 31, 2015 (Last 1 year) 269.694 13.18% 5.13% -4.02% 7.31%
Compounded Annualised Growth Rate Performance
Last 2 years (Mar 28, 2013 to Mar 31, 2015) 47.09% 25.27% 32.38% 22.14%
Last 3 years (Mar 30, 2012 to Mar 31, 2015) 34.89% 18.22% 19.00% 17.03%
Last 5 years (Mar 31, 2010 to Mar 31, 2015) 256.4503 20.89% 10.09% 11.02% 10.09%
Last 10 years (Mar 31, 2005 to Mar 31, 2015) 113.63 19.27% 14.68% 16.07% 15.34%
Last 15 years (Mar 31, 2000 to Mar 31, 2015) 30.97 22.64% 11.72% N.A 12.10%
Since inception till Mar 31, 2015 10 21.71% 10.40% N.A 10.50%
Current Value of Standard Investment of Rs 10000
Last 2 years 21705 15722 17565 14942
Last 3 years 24566 16529 16860 16034
Last 5 years 25834 16178 16874 16176
Last 10 years 58305 39361 44421 41711
Last 15 years 213924 52748 N.A 55553
Since inception (29.9.1994) 662522 82675 N.A 84239
Discrete 12 months performance
Mar 31, 2014 to Mar 31, 2015 (Last 1 year) 36.7295 57.59% 31.93% 26.65%
Mar 28, 2013 to Mar 31, 2014 30.3088 21.18% 17.19% 17.98%
Mar 30, 2012 to Mar 28, 2013 29.305 3.43% 6.03% 7.31%
Compounded Annualised Growth Rate Performance
Last 2 years (Mar 28, 2013 to Mar 31, 2015) 0 38.01% 24.23% 22.14%
Last 3 years (Mar 30, 2012 to Mar 31, 2015) 0 25.44% 17.89% 17.03%
Last 5 years (Mar 31, 2010 to Mar 31, 2015) 29.4058 14.50% 9.96% 10.09%
Last 10 years (Mar 31, 2005 to Mar 31, 2015) 11.02 18.03% 15.08% 15.34%
Last 15 years (Mar 31, 2000 to Mar 31, 2015) 9.36 12.91% 2.77% 12.10%
Since inception till Mar 31, 2015 10 12.32% 0.30% 11.00%
Current Value of Standard Investment of Rs 10000
Last 2 years 19098 15462 14942
Last 3 years 19752 16394 16034
Last 5 years 19684 16083 16176
Last 10 years 52525 40775 41711
Last 15 years 61840 15078 55553
Since inception (21.2.2000) 57882 10468 48423
Discrete 12 months performance
Mar 31, 2014 to Mar 31, 2015 (Last 1 year) 24.634 34.08% 31.93% 26.65%
Mar 28, 2013 to Mar 31, 2014 21.7965 13.02% 17.19% 17.98%
Mar 30, 2012 to Mar 28, 2013 19.4287 12.19% 6.03% 7.31%
Compounded Annualised Growth Rate Performance
Last 2 years (Mar 28, 2013 to Mar 31, 2015) 23.00% 24.23% 22.14%
Last 3 years (Mar 30, 2012 to Mar 31, 2015) 19.33% 17.89% 17.03%
Last 5 years (Mar 31, 2010 to Mar 31, 2015) 18.5021 12.28% 9.96% 10.09%
Since inception till Mar 31, 2015 10 14.41% 10.94% 10.91%
Current Value of Standard Investment of Rs 10000
Last 2 years 15154 15462 14942
Last 3 years 17001 16394 16034
Last 5 years 17852 16083 16176
Since inception (18.5.2006) 33030 25134 25055
Discrete 12 months performance
Mar 31, 2014 to Mar 31, 2015 (Last 1 year) 17.1892 73.45% 33.56% 26.65%
Mar 28, 2013 to Mar 31, 2014 13.7794 24.75% 17.72% 17.98%
Mar 30, 2012 to Mar 28, 2013 12.0983 13.90% 5.13% 7.31%
Compounded Annualised Growth Rate Performance
Last 2 years (Mar 28, 2013 to Mar 31, 2015) 46.86% 25.27% 22.14%
Last 3 years (Mar 30, 2012 to Mar 31, 2015) 35.04% 18.22% 17.03%
Last 5 years (Mar 31, 2010 to Mar 31, 2015) 12.2273 19.50% 10.09% 10.09%
Since inception till Mar 31, 2015 10 15.27% 8.05% 8.24%
Current Value of Standard Investment of Rs 10000
Last 2 years 21637 15722 14942
Last 3 years 24643 16529 16034
Last 5 years 24383 16178 16176
Since inception (26.7.2007) 29814 18130 18380
Discrete 12 months performance
Mar 31, 2014 to Mar 31, 2015 (Last 1 year) 21.6999 77.23% 50.96% 26.65%
Mar 28, 2013 to Mar 31, 2014 15.7365 37.90% 16.36% 17.98%
Mar 30, 2012 to Mar 28, 2013 13.6711 15.11% -4.02% 7.31%
Compounded Annualised Growth Rate Performance
Last 2 years (Mar 28, 2013 to Mar 31, 2015) 56.04% 32.38% 22.14%
Last 3 years (Mar 30, 2012 to Mar 31, 2015) 41.12% 19.00% 17.03%
Last 5 years (Mar 31, 2010 to Mar 31, 2015) 13.267 23.71% 11.02% 10.09%
Since inception till Mar 31, 2015 10 15.74% 13.01% 12.57%
Current Value of Standard Investment of Rs 10000
Last 2 years 24439 17565 14942
Last 3 years 28131 16860 16034
Last 5 years 28988 16874 16176
Since inception (13.1.2006) 38458 30866 29787
Discrete 12 months performance
Mar 31, 2014 to Mar 31, 2015 (Last 1 year) 15.9065 84.95% 33.56% 26.65%
Mar 28, 2013 to Mar 31, 2014 12.7572 24.69% 17.72% 17.98%
Mar 30, 2012 to Mar 28, 2013 11.5121 10.82% 5.13% 7.31%
Compounded Annualised Growth Rate Performance
Last 2 years (Mar 28, 2013 to Mar 31, 2015) 51.60% 25.27% 22.14%
Last 3 years (Mar 30, 2012 to Mar 31, 2015) 36.68% 18.22% 17.03%
Last 5 years (Mar 31, 2010 to Mar 31, 2015) 11.7383 20.16% 10.09% 10.09%
Since inception till Mar 31, 2015 10 21.37% 11.33% 11.28%
Current Value of Standard Investment of Rs 10000
Last 2 years 23061 15722 14942
Last 3 years 25555 16529 16034
Last 5 years 25063 16178 16176
Since inception (4.9.2009) 29419 18183 18142
Franklin Asian Equity Fund (FAEF) - Growth OptionNAV as at Mar 31, 2015 : (Rs.) 16.3593Fund Manager: Roshi Jain
NAV Per unit (Rs.) B: MSCI Asia(ex Japan)
Standard Index
FAEF AB: CNX NIFTY
Discrete 12 months performance
Mar 31, 2014 to Mar 31, 2015 (Last 1 year) 14.2295 14.97% 12.83% 26.65%
Mar 28, 2013 to Mar 31, 2014 12.866 10.60% 10.99% 17.98%
Mar 30, 2012 to Mar 28, 2013 11.6983 9.98% 11.27% 7.31%
Compounded Annualised Growth Rate Performance
Last 2 years (Mar 28, 2013 to Mar 31, 2015) 12.71% 11.86% 22.14%
Last 3 years (Mar 30, 2012 to Mar 31, 2015) 11.82% 11.68% 17.03%
Last 5 years (Mar 31, 2010 to Mar 31, 2015) 10.0495 10.23% 10.88% 10.09%
Since inception till Mar 31, 2015 10 7.07% 7.20% 5.09%
Current Value of Standard Investment of Rs 10000
Last 2 years 12715 12524 14942
Last 3 years 13984 13935 16034
Last 5 years 16279 16761 16176
Since inception (16.1.2008) 16359 16505 14305
# Index adjusted for the period February 21, 2000 to March 10, 2004 with the performance of ET Mindex.

SCHEME PERFORMANCE
Franklin India Index Fund Nifty Plan (FIIF-Nifty Plan) - Growth OptionNAV as at Mar 31, 2015 : (Rs.) 66.833Fund Manager: Anil Prabhudas
NAV Per unit (Rs.) FIIF - Nifty Plan B: CNX NIFTY
31Franklin Templeton Investmentswww.franklintempletonindia.com
Discrete 12 months performance Mar 31, 2014 to Mar 31, 2015 (Last 1 year) 277.6719 52.92% 33.56% 26.65%Mar 28, 2013 to Mar 31, 2014 228.7064 21.41% 17.72% 17.98%Mar 30, 2012 to Mar 28, 2013 213.507 7.12% 5.13% 7.31%Compounded Annualised Growth Rate Performance Last 2 years (Mar 28, 2013 to Mar 31, 2015) 36.09% 25.27% 22.14%Last 3 years (Mar 30, 2012 to Mar 31, 2015) 25.73% 18.22% 17.03%Last 5 years (Mar 31, 2010 to Mar 31, 2015) 186.9133 17.82% 10.09% 10.09%Last 10 years (Mar 31, 2005 to Mar 31, 2015) 67.89 20.11% 14.68% 15.34%Last 15 years (Mar 31, 2000 to Mar 31, 2015) 31.02 19.05% 11.72% 12.10%Since inception till Mar 31, 2015 10 26.43% 15.53% 14.37%Current Value of Standard Investment of Rs 10000 Last 2 years 18566 15722 14942Last 3 years 19888 16529 16034Last 5 years 22718 16178 16176Last 10 years 62546 39361 41711Last 15 years 136888 52748 55553Since inception (10.4.1999) 424627 100511 85474
Discrete 12 months performance
Mar 31, 2014 to Mar 31, 2015 (Last 1 year) 52.7985 26.58% 26.65%
Mar 28, 2013 to Mar 31, 2014 44.6307 18.30% 17.98%
Mar 30, 2012 to Mar 28, 2013 41.5435 7.43% 7.31%
Compounded Annualised Growth Rate Performance
Last 2 years (Mar 28, 2013 to Mar 31, 2015) 22.27% 22.14%
Last 3 years (Mar 30, 2012 to Mar 31, 2015) 17.16% 17.03%
Last 5 years (Mar 31, 2010 to Mar 31, 2015) 41.1366 10.19% 10.09%
Last 10 years (Mar 31, 2005 to Mar 31, 2015) 15.8985 15.43% 15.34%
Since inception till Mar 31, 2015 10 13.83% 13.54%
Current Value of Standard Investment of Rs 10000
Last 2 years 14975 14942
Last 3 years 16087 16034
Last 5 years 16247 16176
Last 10 years 42037 41711
Since inception (4.8.2000) 66833 64396
NAV Per unit (Rs.) FIF AB: CNX NIFTYB:S&P BSE IT Index
Franklin Infotech Fund (FIF) - Growth OptionNAV as at Mar 31, 2015 : (Rs.) 116.1432Fund Manager: Anand Radhakrishnan
Franklin India Balanced Fund (FIBF) - growth optionNAV as at Mar 31, 2015 : (Rs.) 90.3392Fund Manager: Equity:Anand Radhakrishnan, Anil Prabhudas Debt:Sachin Padwal-Desai, Umesh Sharma
Discrete 12 months performance
Mar 31, 2014 to Mar 31, 2015 (Last 1 year) 62.6032 44.30% 22.53% 26.65%
Mar 28, 2013 to Mar 31, 2014 52.777 18.62% 13.40% 17.98%
Mar 30, 2012 to Mar 28, 2013 49.2293 7.21% 8.18% 7.31%
Compounded Annualised Growth Rate Performance
Last 2 years (Mar 28, 2013 to Mar 31, 2015) 30.69% 17.80% 22.14%
Last 3 years (Mar 30, 2012 to Mar 31, 2015) 22.41% 14.54% 17.03%
Last 5 years (Mar 31, 2010 to Mar 31, 2015) 45.2555 14.82% 9.74% 10.09%
Last 10 years (Mar 31, 2005 to Mar 31, 2015) 19.08 16.81% 12.78% 15.34%
Last 15 years (Mar 31, 2000 to Mar 31, 2015) 10.72 15.26% N.A 12.10%
Since inception till Mar 31, 2015 10 15.46% N.A 12.29%
Current Value of Standard Investment of Rs 10000
Last 2 years 17117 13895 14942
Last 3 years 18351 15032 16034
Last 5 years 19962 15918 16176
Last 10 years 47348 33311 41711
Last 15 years 84272 N.A 55553
Since inception (10.12.1999) 90339 N.A 58978
NAV Per unit (Rs.) B: Crisil BalancedFund Index
FIBF AB: CNX Nifty
Franklin India Pension Plan (FIPEP) - Growth OptionNAV as at Mar 31, 2015 : (Rs.) 98.0807Fund Manager Equity:Anand Radhakrishnan, Anil Prabhudas Debt:Sachin Padwal-Desai, Umesh Sharma
NAV Per unit (Rs.) Benchmark*FIPEP AB:Crisil 10 YearGilt Index
Discrete 12 months performance
Mar 31, 2014 to Mar 31, 2015 (Last 1 year) 74.1104 32.34% 22.09% 14.57%
Mar 28, 2013 to Mar 31, 2014 67.1221 10.41% 9.86% -0.96%
Mar 30, 2012 to Mar 28, 2013 61.2521 9.58% 7.77% 11.25%
Compounded Annualised Growth Rate Performance
Last 2 years (Mar 28, 2013 to Mar 31, 2015) 20.79% 15.74% 6.49%
Last 3 years (Mar 30, 2012 to Mar 31, 2015) 16.97% 13.06% 8.07%
Last 5 years (Mar 31, 2010 to Mar 31, 2015) 54.8005 12.34% 9.23% 6.23%
Last 10 years (Mar 31, 2005 to Mar 31, 2015) 32.25 11.76% 10.65% 6.05%
Last 15 years (Mar 31, 2000 to Mar 31, 2015) 15.55 13.06% N.A N.A
Since inception till Mar 31, 2015 10 13.52% N.A N.A
Current Value of Standard Investment of Rs 10000
Last 2 years 14612 13413 11347
Last 3 years 16013 14455 12624
Last 5 years 17898 15554 13528
Last 10 years 30413 27520 17995
Last 15 years 63074 N.A N.A
Since inception (31.3.1997) 98081 N.A N.A
Franklin India Dynamic PE Ratio Fund of Funds (FIDPEF) - Growth OptionNAV as at Mar 31, 2015 : (Rs.) 61.5933Fund Manager : Anand Radhakrishnan
Franklin India Life Stage Fund of Funds (FILSF) - Growth Option
NAV as at Mar 31, 2015 : (Rs.)
The 20s Plan: 62.2134 The 30s Plan: 44.7475
The 40s Plan: 35.8722The 50s Plus Plan: 26.7568The 50s Plus Floating Rate Plan: 28.2131
Fund Manager: Equity: Anand Radhakrishnan Debt: Sachin Padwal-Desai, Pallab Roy
Discrete 12 months performance
Mar 28, 2014 to Mar 31, 2015 (Last 1 year) 49.6065 24.16% 25.15% 22.66% N.A
Mar 28, 2013 to Mar 28, 2014 44.5739 11.29% 18.60% 13.28% N.A
Mar 30, 2012 to Mar 28, 2013 41.7231 6.83% 8.23% 8.18% N.A
Compounded Annualised Growth Rate Performance
Last 2 years (Mar 28, 2013 to Mar 31, 2015) 17.47% 21.73% 17.80% N.A
Last 3 years (Mar 30, 2012 to Mar 31, 2015) 13.85% 17.10% 14.54% N.A
Last 5 years (Mar 31, 2010 to Mar 31, 2015) 37.373 10.50% 9.78% 9.74% N.A
Last 10 years (Mar 31, 2005 to Mar 31, 2015) 13.9462 16.00% 15.71% 12.78% N.A
Since inception till Mar 31, 2015 10 17.25% 16.46% 12.98% N.A
Current Value of Standard Investment of Rs 10000
Last 2 years 13818 14843 13895 N.A
Last 3 years 14762 16064 15032 N.A
Last 5 years 16481 15950 15918 N.A
Last 10 years 44165 43059 33311 N.A
Since inception (31.10.2003) 61593 56976 40313 N.A
NAV Per unit (Rs.) B: Crisil Balanced
Fund Index
FIDPEF AdditionalBenchmark
B: S&P BSESensex
NAV Per unit (Rs.) FIT AB: CNX NIFTYB: CNX 500
Discrete 12 months performance
Mar 28, 2013 to
Mar 28, 2014
Mar 30, 2012 to
Mar 28, 2013
Compounded Annualised Growth Rate Performance
Last 2 years
(Mar 28, 2013 to Mar 31,
2015)
Last 3 years
(Mar 30, 2012 to Mar 31,
2015)
Last 5 years
(Mar 31, 2010 to Mar 31,
2015)
Since inception
till Mar 31,
2015
Last
2 years
Last
3 years
Last
5 years
since
inception
45.6780
36.20%
24.44%
34.8477
28.41%
21.42%
29.0193
23.61%
19.29%
22.8475
17.11%
16.85%
N.A
39.8352
14.67%
15.64%
32.0860
3.86%
6.42%
26.7945
4.36%
5.36%
19.9931
3.86%
5.03%
N.A
37.2515
6.94%
8.09%
29.0121
7.71%
8.58%
24.3549
8.75%
8.76%
19.7258
8.72%
9.17%
N.A
0.0000
24.86%
19.87%
0.0000
19.57%
16.64%
0.0000
16.31%
14.13%
0
11.65%
11.90%
N.A
0.0000
18.63%
15.85%
0.0000
15.52%
13.92%
0.0000
13.76%
12.34%
0
10.69%
11.01%
N.A
33.9515
12.87%
9.73%
25.8730
11.57%
9.42%
21.7061
10.56%
9.06%
17.7025
8.61%
8.68%
N.A
10.0000
17.50%
14.57%
10.0000
14.13%
12.35%
10.0000
11.93%
10.31%
10.0000
9.07%
8.66%
N.A
15618
14391
14319
13621
13544
13040
12476
12533
N.A
16701
15556
15424
14790
14729
14182
13564
13683
N.A
18324
15913
17295
15689
16526
15430
15115
15168
N.A
47343
38033
36844
32095
30995
27181
24768
23874
N.A
Current Value of Standard Investment of Rs 10000 invested at the
beginning of the period
Last 10 years (Mar 31, 2005 to Mar 31,
2015)
13.1409
16.81%
14.28%
12.1450
13.92%
12.36%
11.5734
11.97%
10.51%
10.8030
9.49%
9.09%
N.A
Last 10
years
62213
46724
44748
37446
35872
30420
26757
25644
N.A
The 20s Plan - NAV Per Unit (Rs.)
The 20s Plan - Returns
Benchmark*
The 30s Plan - NAV Per Unit (Rs.)
The 30s Plan - Returns
Benchmark*
The 40s Plan - NAV Per Unit (Rs.)
The 40s Plan - Returns
Benchmark*
The 50s Plus Plan - NAV Per Unit (Rs.)
The 50s Plus Plan - Returns
Benchmark*
Additional Benchmark
Mar 28, 2014 to
Mar 31, 2015 (Last 1 year)
Discrete 12 months performance
Mar 31, 2014 to Mar 31, 2015 (Last 1 year) 180.1362 28.97% 29.75% 26.65%
Mar 28, 2013 to Mar 31, 2014 143.1152 25.87% 27.65% 17.98%
Mar 30, 2012 to Mar 28, 2013 130.0436 10.05% 13.21% 7.31%
Compounded Annualised Growth Rate Performance
Last 2 years (Mar 28, 2013 to Mar 31, 2015) 27.28% 28.56% 22.14%
Last 3 years (Mar 30, 2012 to Mar 31, 2015) 21.32% 23.29% 17.03%
Last 5 years (Mar 31, 2010 to Mar 31, 2015) 110.5572 16.00% 16.83% 10.09%
Last 10 years (Mar 31, 2005 to Mar 31, 2015) 55.7676 15.33% 15.48% 15.34%
Last 15 years (Mar 31, 2000 to Mar 31, 2015) 84.8115 6.94% 4.67% 12.10%
Since inception till Mar 31, 2015 10 20.84% N.A 14.81%
Current Value of Standard Investment of Rs 10000
Last 2 years 16233 16563 14942
Last 3 years 17865 18751 16034
Last 5 years 21013 21774 16176
Last 10 years 41658 42216 41711
Last 15 years 27392 19835 55553
Since inception (22.8.1998) 232318 N.A 99258

Discrete 12 months performance
Mar 28, 2014 to Mar 31, 2015 (Last 1 year) 10.3088 10.13% 10.40% 8.82%
Mar 28, 2013 to Mar 28, 2014 10.3106 9.77% 8.78% 5.77%
Mar 30, 2012 to Mar 28, 2013 10.5179 9.87% 9.05% 8.33%
Compounded Annualised Growth Rate Performance
Last 2 years (Mar 28, 2013 to Mar 31, 2015) 9.91% 9.55% 7.25%
Last 3 years (Mar 30, 2012 to Mar 31, 2015) 9.91% 9.40% 7.62%
Last 5 years (Mar 31, 2010 to Mar 31, 2015) 10.5327 9.23% 8.62% 6.65%
Last 10 years (Mar 31, 2005 to Mar 31, 2015) 10.1624 7.62% 8.52% 5.95%
Last 15 years (Mar 31, 2000 to Mar 31, 2015) 10.1 7.76% N.A 6.29%
Since inception till Mar 31, 2015 10 7.75% N.A 6.30%
Current Value of Standard Investment of Rs 10000
Last 2 years 12089 12010 11509
Last 3 years 13282 13097 12468
Last 5 years 15552 15122 13803
Last 10 years 20856 22651 17833
Last 15 years 30691 N.A 24980
Since inception (7.2.2000) 30998 N.A 25224
Discrete 12 months performance
Mar 28, 2014 to Mar 31, 2015 (Last 1 year) 10.4556 10.13% 10.40% 8.82%
Mar 28, 2013 to Mar 28, 2014 10.3916 9.77% 8.78% 5.77%
Mar 30, 2012 to Mar 28, 2013 10.4222 9.87% 9.05% 8.33%
Compounded Annualised Growth Rate Performance
Last 2 years (Mar 28, 2013 to Mar 31, 2015) 9.91% 9.55% 7.25%
Last 3 years (Mar 30, 2012 to Mar 31, 2015) 9.91% 9.40% 7.62%
Last 5 years (Mar 31, 2010 to Mar 31, 2015) 10.1893 9.23% 8.62% 6.65%
Last 10 years (Mar 31, 2005 to Mar 31, 2015) 10.1688 7.62% 8.52% 5.95%
Last 15 years (Mar 31, 2000 to Mar 31, 2015) 10.04 7.75% N.A 6.29%
Since inception till Mar 31, 2015 10 7.74% N.A 6.30%
Current Value of Standard Investment of Rs 10000
Last 2 years 12089 12010 11509
Last 3 years 13282 13097 12468
Last 5 years 15552 15122 13803
Last 10 years 20854 22651 17833
Last 15 years 30662 N.A 24980
Since inception (7.2.2000) 30939 N.A 25224
SCHEME PERFORMANCE
Franklin India Dynamic Accrual Fund (FIDA) - Growth option(Fund name change W.E.F. 01 December 2014, Erstwhile Franklin India Income Fund)
NAV as at Mar 31, 2015 : (Rs.) 47.0032Fund Manager : Umesh Sharma, Sachin Padwal-Desai
NAV Per unit (Rs.) B: Crisil Compositebond Fund Index
FIDA AB:Crisil 10 yeargilt Index
Franklin India Income Builder Account (FIIBA) - Growth OptionNAV as at Mar 31, 2015 : (Rs.) 48.4648Fund Manager: Umesh Sharma, Sachin Padwal-Desai
NAV Per unit (Rs.) B: Crisil CompositeBond Fund Index
FIIBA AB: Crisil 10 yeargilt Index
Franklin India Income Opportunities Fund (FIIOF) - Growth OptionNAV as at Mar 31, 2015 : (Rs.) 16.1294Fund Manager : Umesh Sharma, Sachin Padwal-Desai
NAV Per unit (Rs.) B: Crisil Short-Term Bond Fund Index
AB: Crisil 10 yeargilt Index
Franklin India Low Duration Fund (FILDF) - GrowthNAV as at Mar 31, 2015 : (Rs.) 15.3597Fund Manager : Sachin Padwal-Desai, Umesh Sharma
32
FIIOF
Franklin Templeton Investmentswww.franklintempletonindia.com
Discrete 12 months performance
Mar 28, 2014 to Mar 31, 2015 (Last 1 year) 41.3849 13.58% 14.67% 14.63%
Mar 28, 2013 to Mar 28, 2014 39.6936 4.26% 4.32% -1.01%
Mar 30, 2012 to Mar 28, 2013 36.0444 10.12% 9.24% 11.25%
Compounded Annualised Growth Rate Performance
Last 2 years (Mar 28, 2013 to Mar 31, 2015) 8.78% 9.33% 6.49%
Last 3 years (Mar 30, 2012 to Mar 31, 2015) 9.24% 9.32% 8.07%
Last 5 years (Mar 31, 2010 to Mar 31, 2015) 32.0034 7.99% 8.13% 6.23%
Last 10 years (Mar 31, 2005 to Mar 31, 2015) 23.8537 7.01% 6.85% 6.05%
Last 15 years (Mar 31, 2000 to Mar 31, 2015) 15.03 7.89% N.A N.A
Since inception till Mar 31, 2015 10 8.94% N.A N.A
Current Value of Standard Investment of Rs 10000
Last 2 years 11842 11962 11347
Last 3 years 13040 13067 12624
Last 5 years 14687 14783 13528
Last 10 years 19705 19403 17995
Last 15 years 31273 N.A N.A
Since inception (5.3.1997) 47003 N.A N.A
Discrete 12 months performance
Mar 28, 2014 to Mar 31, 2015 (Last 1 year) 42.7076 13.48% 14.67% 14.63%
Mar 28, 2013 to Mar 28, 2014 39.4955 8.13% 4.32% -1.01%
Mar 30, 2012 to Mar 28, 2013 35.5611 11.06% 9.24% 11.25%
Compounded Annualised Growth Rate Performance
Last 2 years (Mar 28, 2013 to Mar 31, 2015) 10.73% 9.33% 6.49%
Last 3 years (Mar 30, 2012 to Mar 31, 2015) 10.86% 9.32% 8.07%
Last 5 years (Mar 31, 2010 to Mar 31, 2015) 30.5678 9.65% 8.13% 6.23%
Last 10 years (Mar 31, 2005 to Mar 31, 2015) 23.3938 7.55% 6.85% 6.05%
Last 15 years (Mar 31, 2000 to Mar 31, 2015) 14.4 8.42% N.A N.A
Since inception till Mar 31, 2015 10 9.28% N.A N.A
Current Value of Standard Investment of Rs 10000
Last 2 years 12271 11962 11347
Last 3 years 13629 13067 12624
Last 5 years 15855 14783 13528
Last 10 years 20717 19403 17995
Last 15 years 33656 N.A N.A
Since inception (23.6.1997) 48465 N.A N.A
Discrete 12 months performance
Mar 28, 2014 to Mar 31, 2015 (Last 1 year) 14.4138 11.90% 10.40% 14.63%
Mar 28, 2013 to Mar 28, 2014 13.242 8.85% 8.78% -1.01%
Mar 30, 2012 to Mar 28, 2013 11.9809 10.53% 9.05% 11.25%
Compounded Annualised Growth Rate Performance
Last 2 years (Mar 28, 2013 to Mar 31, 2015) 10.32% 9.55% 6.49%
Last 3 years (Mar 30, 2012 to Mar 31, 2015) 10.41% 9.40% 8.07%
Last 5 years (Mar 31, 2010 to Mar 31, 2015) 10.3196 9.34% 8.31% 6.23%
Since inception till Mar 31, 2015 10 9.43% 8.11% 5.94%
Current Value of Standard Investment of Rs 10000
Last 2 years 12180 12010 11347
Last 3 years 13463 13097 12624
Last 5 years 15630 14907 13528
Since inception (11.12.2009) 16129 15124 13579
NAV Per unit (Rs.) B: Crisil Short-termBond Fund Index #
Growth AB:1 year T-BillIndex
Discrete 12 months performance
Mar 28, 2014 to Mar 31, 2015 (Last 1 year) 13.9392 10.19% 10.40% 8.82%
Mar 28, 2013 to Mar 28, 2014 12.6984 9.77% 8.78% 5.77%
Mar 30, 2012 to Mar 28, 2013 11.558 9.87% 9.05% 8.33%
Compounded Annualised Growth Rate Performance
Last 2 years (Mar 28, 2013 to Mar 31, 2015) 9.94% 9.55% 7.25%
24.6341
14.53%
12.27%
N.A
22.2535
7.70%
9.28%
N.A
20.6867
8.01%
8.32%
N.A
0.0000
12.31%
11.83%
N.A
0.0000
10.89%
10.67%
N.A
10.8471
10.02%
9.42%
N.A
12627
13559
N.A
13638
15247
N.A
15399
24603
N.A
26010
NA
N.A
Inception: FILSF 20s Plan/30s Plan/40s Plan/50s plus Plan(1.12.2003); 50s plus Floating Rate Plan: 9.7.2004*Benchmark: The 20s Plan - 65% S&P BSE Sensex + 15% CNX 500 + 20% Crisil Composite Bond Fund Index; The 30s Plan -
45%S&P BSE Sensex + 10%CNX 500 + 45%Crisil Composite Bond Fund Index; The 40s Plan - 25%S&P BSE Sensex + 10%
CNX 500 + 65% Crisil Composite Bond Fund Index; The 50s Plus Plan - 20% S&P BSE Sensex+ 80% Crisil Composite Bond
Fund Index; The 50s Plus Floating Rate Plan - 20% S&P BSE Sensex + 80% Crisil Liquid Fund Index.
10.0000
10.15%
9.56%
N.A
28213
26646
N.A
The 50s Plus Floating Rate Plan - NAV Per Unit (Rs.)
The 50s Plus Floating Rate Plan - Returns
Benchmark*
Additional Benchmark
Franklin India Low Duration Fund (FILDF) - Monthly Dividend (MD)NAV as at Mar 31, 2015 : (Rs.) MD: 10.5002Fund Manager: Sachin Padwal-Desai, Umesh Sharma
NAV Per unit (Rs.) B: Crisil Short-termBond Fund Index #
MD AB: 1 year T-BillIndex
Last 3 years (Mar 30, 2012 to Mar 31, 2015) 9.93% 9.40% 7.62%
Since inception till Mar 31, 2015 10 9.60% 8.73% 6.93%
Current Value of Standard Investment of Rs 10000
Last 2 years 12096 12010 11509
Last 3 years 13289 13097 12468
Since inception (26.7.2010) 15360 14800 13687
Franklin India Low Duration Fund (FILDF) - Quarterly Dividend (QD)NAV as at Mar 31, 2015 : (Rs.) QD: 10.3372Fund Manager: Sachin Padwal-Desai, Umesh Sharma
NAV Per unit (Rs.) B: Crisil Short-termBond Fund Index #
QD AB:1 year T-Bill Index
# Index adjusted for the period April 1, 2002 to November 29, 2010 with the performance of Crisil MIP Blended
Index.
Franklin India Monthly Income Plan (FIMIP) - Growth optionNAV as at Mar 31, 2015 : (Rs.) 43.4074Fund Manager : Equity:Anand Radhakrishnan, Anil Prabhudas Debt:Sachin Padwal-Desai, Umesh Sharma
NAV Per unit (Rs.) B: Crisil MIPBlended Index
FIMIP AB: Crisil 10 YearGilt Index
Discrete 12 months performance
Mar 31, 2014 to Mar 31, 2015 (Last 1 year) 35.4525 22.44% 16.45% 14.57%
Mar 28, 2013 to Mar 31, 2014 32.4459 9.27% 6.52% -0.96%
Mar 30, 2012 to Mar 28, 2013 29.5685 9.73% 9.06% 11.25%
Compounded Annualised Growth Rate Performance
Last 2 years (Mar 28, 2013 to Mar 31, 2015) 15.60% 11.32% 6.49%
Last 3 years (Mar 30, 2012 to Mar 31, 2015) 13.64% 10.59% 8.07%
Last 5 years (Mar 31, 2010 to Mar 31, 2015) 26.6575 10.24% 8.61% 6.23%
Last 10 years (Mar 31, 2005 to Mar 31, 2015) 17.2203 9.68% 8.51% 6.05%
Since inception till Mar 31, 2015 10 10.65% N.A N.A
Current Value of Standard Investment of Rs 10000
Last 2 years 13378 12404 11347
Last 3 years 14680 13528 12624
Last 5 years 16283 15114 13528
Last 10 years 25207 22639 17995
Since inception (28.9.2000) 43407 N.A N.A
Franklin India Government Securities Fund (FIGSF) - Growth - Composite Plan (CP)NAV as at Mar 31, 2015 : (Rs.) CP: 46.9042Fund Manager : Sachin Padwal-Desai, Umesh Sharma
NAV Per unit (Rs.) B: I-SecComposite
Index
CP AB: Crisil 10 Year
Gilt Index
Discrete 12 months performance
Mar 28, 2014 to Mar 31, 2015 (Last 1 year) 39.0566 20.09% 15.72% 14.63%
Mar 28, 2013 to Mar 28, 2014 38.5661 1.27% 3.91% -1.01%
Mar 30, 2012 to Mar 28, 2013 35.4797 8.70% 11.64% 11.25%
Compounded Annualised Growth Rate Performance
18.3208
9.01%
8.80%
N.A
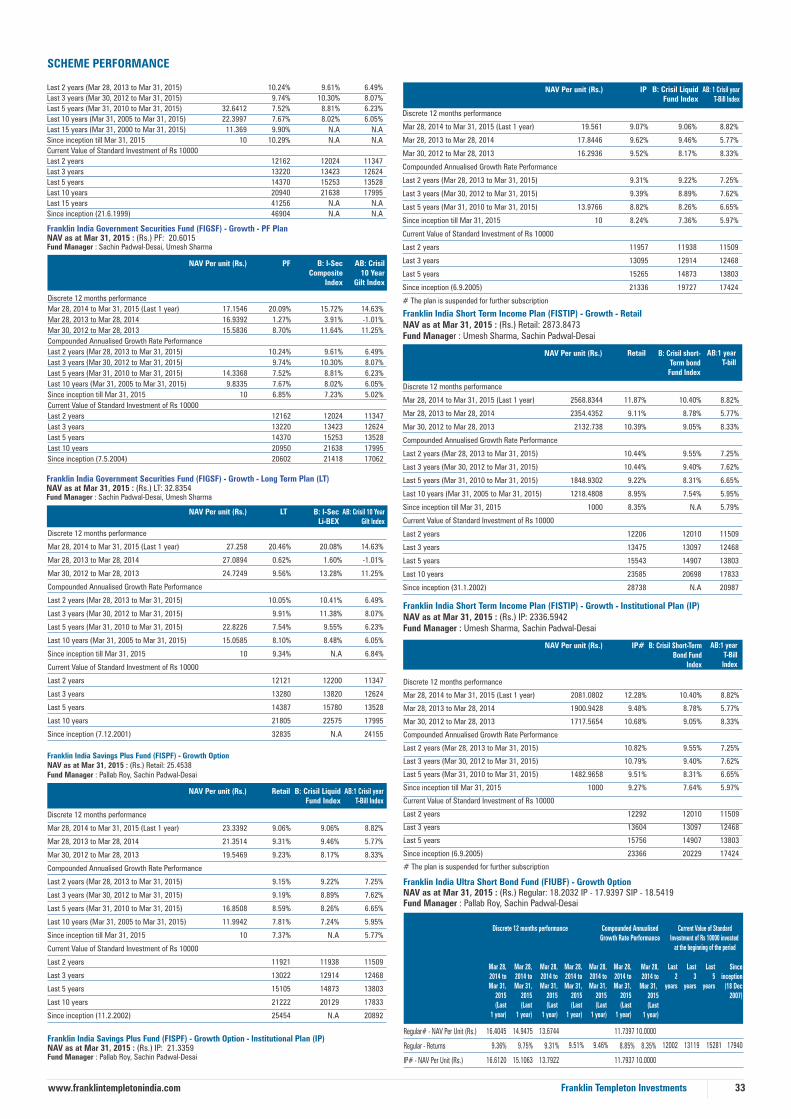
SCHEME PERFORMANCE
33Franklin Templeton Investmentswww.franklintempletonindia.com
Franklin India Government Securities Fund (FIGSF) - Growth - PF PlanNAV as at Mar 31, 2015 : (Rs.) PF: 20.6015Fund Manager : Sachin Padwal-Desai, Umesh Sharma
Discrete 12 months performance
Mar 28, 2014 to Mar 31, 2015 (Last 1 year) 17.1546 20.09% 15.72% 14.63%
Mar 28, 2013 to Mar 28, 2014 16.9392 1.27% 3.91% -1.01%
Mar 30, 2012 to Mar 28, 2013 15.5836 8.70% 11.64% 11.25%
Compounded Annualised Growth Rate Performance
Last 2 years (Mar 28, 2013 to Mar 31, 2015) 10.24% 9.61% 6.49%
Last 3 years (Mar 30, 2012 to Mar 31, 2015) 9.74% 10.30% 8.07%
Last 5 years (Mar 31, 2010 to Mar 31, 2015) 14.3368 7.52% 8.81% 6.23%
Last 10 years (Mar 31, 2005 to Mar 31, 2015) 9.8335 7.67% 8.02% 6.05%
Since inception till Mar 31, 2015 10 6.85% 7.23% 5.02%
Current Value of Standard Investment of Rs 10000
Last 2 years 12162 12024 11347
Last 3 years 13220 13423 12624
Last 5 years 14370 15253 13528
Last 10 years 20950 21638 17995
Since inception (7.5.2004) 20602 21418 17062
Franklin India Savings Plus Fund (FISPF) - Growth OptionNAV as at Mar 31, 2015 : (Rs.) Retail: 25.4538Fund Manager : Pallab Roy, Sachin Padwal-Desai
NAV Per unit (Rs.) B: Crisil LiquidFund Index
Retail AB:1 Crisil year T-Bill Index
Discrete 12 months performance
Mar 28, 2014 to Mar 31, 2015 (Last 1 year) 23.3392 9.06% 9.06% 8.82%
Mar 28, 2013 to Mar 28, 2014 21.3514 9.31% 9.46% 5.77%
Mar 30, 2012 to Mar 28, 2013 19.5469 9.23% 8.17% 8.33%
Compounded Annualised Growth Rate Performance
Last 2 years (Mar 28, 2013 to Mar 31, 2015) 9.15% 9.22% 7.25%
Last 3 years (Mar 30, 2012 to Mar 31, 2015) 9.19% 8.89% 7.62%
Last 5 years (Mar 31, 2010 to Mar 31, 2015) 16.8508 8.59% 8.26% 6.65%
Last 10 years (Mar 31, 2005 to Mar 31, 2015) 11.9942 7.81% 7.24% 5.95%
Since inception till Mar 31, 2015 10 7.37% N.A 5.77%
Current Value of Standard Investment of Rs 10000
Last 2 years 11921 11938 11509
Last 3 years 13022 12914 12468
Last 5 years 15105 14873 13803
Last 10 years 21222 20129 17833
Since inception (11.2.2002) 25454 N.A 20892
NAV Per unit (Rs.) B: I-SecComposite
Index
PF AB: Crisil 10 Year
Gilt Index
Franklin India Government Securities Fund (FIGSF) - Growth - Long Term Plan (LT)NAV as at Mar 31, 2015 : (Rs.) LT: 32.8354Fund Manager : Sachin Padwal-Desai, Umesh Sharma
NAV Per unit (Rs.) B: I-Sec Li-BEX
AB: Crisil 10 YearGilt Index
Discrete 12 months performance
Mar 28, 2014 to Mar 31, 2015 (Last 1 year) 27.258 20.46% 20.08% 14.63%
Mar 28, 2013 to Mar 28, 2014 27.0894 0.62% 1.60% -1.01%
Mar 30, 2012 to Mar 28, 2013 24.7249 9.56% 13.28% 11.25%
Compounded Annualised Growth Rate Performance
Last 2 years (Mar 28, 2013 to Mar 31, 2015) 10.05% 10.41% 6.49%
Last 3 years (Mar 30, 2012 to Mar 31, 2015) 9.91% 11.38% 8.07%
Last 5 years (Mar 31, 2010 to Mar 31, 2015) 22.8226 7.54% 9.55% 6.23%
Last 10 years (Mar 31, 2005 to Mar 31, 2015) 15.0585 8.10% 8.48% 6.05%
Since inception till Mar 31, 2015 10 9.34% N.A 6.84%
Current Value of Standard Investment of Rs 10000
Last 2 years 12121 12200 11347
Last 3 years 13280 13820 12624
Last 5 years 14387 15780 13528
Last 10 years 21805 22575 17995
Since inception (7.12.2001) 32835 N.A 24155
LT
Franklin India Savings Plus Fund (FISPF) - Growth Option - Institutional Plan (IP)NAV as at Mar 31, 2015 : (Rs.) IP: 21.3359Fund Manager : Pallab Roy, Sachin Padwal-Desai
NAV Per unit (Rs.) B: Crisil LiquidFund Index
IP AB: 1 Crisil year T-Bill Index
Last 2 years (Mar 28, 2013 to Mar 31, 2015) 10.24% 9.61% 6.49%
Last 3 years (Mar 30, 2012 to Mar 31, 2015) 9.74% 10.30% 8.07%
Last 5 years (Mar 31, 2010 to Mar 31, 2015) 32.6412 7.52% 8.81% 6.23%
Last 10 years (Mar 31, 2005 to Mar 31, 2015) 22.3997 7.67% 8.02% 6.05%
Last 15 years (Mar 31, 2000 to Mar 31, 2015) 11.369 9.90% N.A N.A
Since inception till Mar 31, 2015 10 10.29% N.A N.A
Current Value of Standard Investment of Rs 10000
Last 2 years 12162 12024 11347
Last 3 years 13220 13423 12624
Last 5 years 14370 15253 13528
Last 10 years 20940 21638 17995
Last 15 years 41256 N.A N.A
Since inception (21.6.1999) 46904 N.A N.A
Franklin India Short Term Income Plan (FISTIP) - Growth - Institutional Plan (IP)NAV as at Mar 31, 2015 : (Rs.) IP: 2336.5942Fund Manager : Umesh Sharma, Sachin Padwal-Desai
NAV Per unit (Rs.) B: Crisil Short-Term Bond Fund
Index
IP# AB:1 year T-Bill Index
Franklin India Short Term Income Plan (FISTIP) - Growth - RetailNAV as at Mar 31, 2015 : (Rs.) Retail: 2873.8473Fund Manager : Umesh Sharma, Sachin Padwal-Desai
NAV Per unit (Rs.) B: Crisil short-Term bondFund Index
Retail AB:1 year T-bill
Discrete 12 months performance
Mar 28, 2014 to Mar 31, 2015 (Last 1 year) 2568.8344 11.87% 10.40% 8.82%
Mar 28, 2013 to Mar 28, 2014 2354.4352 9.11% 8.78% 5.77%
Mar 30, 2012 to Mar 28, 2013 2132.738 10.39% 9.05% 8.33%
Compounded Annualised Growth Rate Performance
Last 2 years (Mar 28, 2013 to Mar 31, 2015) 10.44% 9.55% 7.25%
Last 3 years (Mar 30, 2012 to Mar 31, 2015) 10.44% 9.40% 7.62%
Last 5 years (Mar 31, 2010 to Mar 31, 2015) 1848.9302 9.22% 8.31% 6.65%
Last 10 years (Mar 31, 2005 to Mar 31, 2015) 1218.4808 8.95% 7.54% 5.95%
Since inception till Mar 31, 2015 1000 8.35% N.A 5.79%
Current Value of Standard Investment of Rs 10000
Last 2 years 12206 12010 11509
Last 3 years 13475 13097 12468
Last 5 years 15543 14907 13803
Last 10 years 23585 20698 17833
Since inception (31.1.2002) 28738 N.A 20987
Discrete 12 months performance
Mar 28, 2014 to Mar 31, 2015 (Last 1 year) 2081.0802 12.28% 10.40% 8.82%
Mar 28, 2013 to Mar 28, 2014 1900.9428 9.48% 8.78% 5.77%
Mar 30, 2012 to Mar 28, 2013 1717.5654 10.68% 9.05% 8.33%
Compounded Annualised Growth Rate Performance
Last 2 years (Mar 28, 2013 to Mar 31, 2015) 10.82% 9.55% 7.25%
Last 3 years (Mar 30, 2012 to Mar 31, 2015) 10.79% 9.40% 7.62%
Last 5 years (Mar 31, 2010 to Mar 31, 2015) 1482.9658 9.51% 8.31% 6.65%
Since inception till Mar 31, 2015 1000 9.27% 7.64% 5.97%
Current Value of Standard Investment of Rs 10000
Last 2 years 12292 12010 11509
Last 3 years 13604 13097 12468
Last 5 years 15756 14907 13803
Since inception (6.9.2005) 23366 20229 17424
# The plan is suspended for further subscription
Discrete 12 months performance
Mar 28, 2014 to Mar 31, 2015 (Last 1 year) 19.561 9.07% 9.06% 8.82%
Mar 28, 2013 to Mar 28, 2014 17.8446 9.62% 9.46% 5.77%
Mar 30, 2012 to Mar 28, 2013 16.2936 9.52% 8.17% 8.33%
Compounded Annualised Growth Rate Performance
Last 2 years (Mar 28, 2013 to Mar 31, 2015) 9.31% 9.22% 7.25%
Last 3 years (Mar 30, 2012 to Mar 31, 2015) 9.39% 8.89% 7.62%
Last 5 years (Mar 31, 2010 to Mar 31, 2015) 13.9766 8.82% 8.26% 6.65%
Since inception till Mar 31, 2015 10 8.24% 7.36% 5.97%
Current Value of Standard Investment of Rs 10000
Last 2 years 11957 11938 11509
Last 3 years 13095 12914 12468
Last 5 years 15265 14873 13803
Since inception (6.9.2005) 21336 19727 17424
# The plan is suspended for further subscription
Franklin India Ultra Short Bond Fund (FIUBF) - Growth OptionNAV as at Mar 31, 2015 : (Rs.) Regular: 18.2032 IP - 17.9397 SIP - 18.5419Fund Manager : Pallab Roy, Sachin Padwal-Desai
Discrete 12 months performance
Mar 28, 2014 to Mar 31,
2015 (Last
1 year)
Mar 28, 2014 to Mar 31,
2015 (Last
1 year)
Mar 28, 2014 to Mar 31,
2015 (Last
1 year)
Compounded AnnualisedGrowth Rate Performance
Mar 28, 2014 to Mar 31,
2015 (Last
1 year)
Mar 28, 2014 to Mar 31,
2015 (Last
1 year)
Mar 28, 2014 to Mar 31,
2015 (Last
1 year)
Current Value of Standard Investment of Rs 10000 invested
at the beginning of the period
Last 2
years
Last 3
years
Since inception
(18 Dec 2007)
Regular# - NAV Per Unit (Rs.)
Regular - Returns
IP# - NAV Per Unit (Rs.)
16.4045
9.36%
16.6120
14.9475
9.75%
15.1063
13.6744
9.31%
13.7922
9.51% 9.46%
11.7397
8.85%
11.7937
12002 13119 17940
Mar 28, 2014 to
Mar 31, 2015 (Last
1 year)
10.0000
8.35%
10.0000
Last 5
years
15281
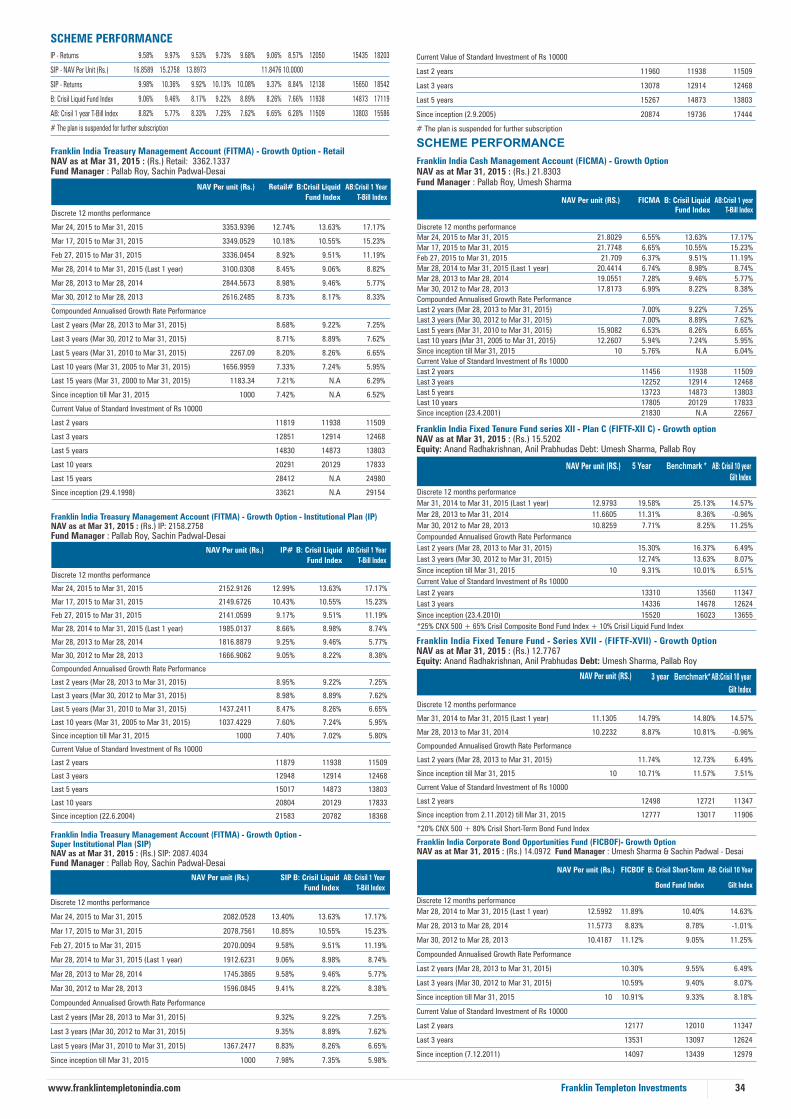
Discrete 12 months performance
Mar 31, 2014 to Mar 31, 2015 (Last 1 year) 12.9793 19.58% 25.13% 14.57%
Mar 28, 2013 to Mar 31, 2014 11.6605 11.31% 8.36% -0.96%
Mar 30, 2012 to Mar 28, 2013 10.8259 7.71% 8.25% 11.25%
Compounded Annualised Growth Rate Performance
Last 2 years (Mar 28, 2013 to Mar 31, 2015) 15.30% 16.37% 6.49%
Last 3 years (Mar 30, 2012 to Mar 31, 2015) 12.74% 13.63% 8.07%
Since inception till Mar 31, 2015 10 9.31% 10.01% 6.51%
Current Value of Standard Investment of Rs 10000
Last 2 years 13310 13560 11347
Last 3 years 14336 14678 12624
Since inception (23.4.2010) 15520 16023 13655
*25% CNX 500 + 65% Crisil Composite Bond Fund Index + 10% Crisil Liquid Fund Index
SCHEME PERFORMANCE
Franklin India Fixed Tenure Fund series XII - Plan C (FIFTF-XII C) - Growth optionNAV as at Mar 31, 2015 : (Rs.) 15.5202Equity: Anand Radhakrishnan, Anil Prabhudas Debt: Umesh Sharma, Pallab Roy
AB: Crisil 10 yearGilt Index
NAV Per unit (RS.) Benchmark *
Franklin India Fixed Tenure Fund - Series XVII - (FIFTF-XVII) - Growth OptionNAV as at Mar 31, 2015 : (Rs.) 12.7767Equity: Anand Radhakrishnan, Anil Prabhudas Debt: Umesh Sharma, Pallab Roy
AB:Crisil 10 yearBenchmark*NAV Per unit (RS.) 3 year
Gilt Index
Franklin India Cash Management Account (FICMA) - Growth OptionNAV as at Mar 31, 2015 : (Rs.) 21.8303Fund Manager : Pallab Roy, Umesh Sharma
AB:Crisil 1 year T-Bill Index
B: Crisil LiquidFund Index
FICMANAV Per unit (RS.)
Discrete 12 months performance
Mar 24, 2015 to Mar 31, 2015 21.8029 6.55% 13.63% 17.17%
Mar 17, 2015 to Mar 31, 2015 21.7748 6.65% 10.55% 15.23%
Feb 27, 2015 to Mar 31, 2015 21.709 6.37% 9.51% 11.19%
Mar 28, 2014 to Mar 31, 2015 (Last 1 year) 20.4414 6.74% 8.98% 8.74%
Mar 28, 2013 to Mar 28, 2014 19.0551 7.28% 9.46% 5.77%
Mar 30, 2012 to Mar 28, 2013 17.8173 6.99% 8.22% 8.38%
Compounded Annualised Growth Rate Performance
Last 2 years (Mar 28, 2013 to Mar 31, 2015) 7.00% 9.22% 7.25%
Last 3 years (Mar 30, 2012 to Mar 31, 2015) 7.00% 8.89% 7.62%
Last 5 years (Mar 31, 2010 to Mar 31, 2015) 15.9082 6.53% 8.26% 6.65%
Last 10 years (Mar 31, 2005 to Mar 31, 2015) 12.2607 5.94% 7.24% 5.95%
Since inception till Mar 31, 2015 10 5.76% N.A 6.04%
Current Value of Standard Investment of Rs 10000
Last 2 years 11456 11938 11509
Last 3 years 12252 12914 12468
Last 5 years 13723 14873 13803
Last 10 years 17805 20129 17833
Since inception (23.4.2001) 21830 N.A 22667
Discrete 12 months performance
Mar 31, 2014 to Mar 31, 2015 (Last 1 year) 11.1305 14.79% 14.80% 14.57%
Mar 28, 2013 to Mar 31, 2014 10.2232 8.87% 10.81% -0.96%
Compounded Annualised Growth Rate Performance
Last 2 years (Mar 28, 2013 to Mar 31, 2015) 11.74% 12.73% 6.49%
Since inception till Mar 31, 2015 10 10.71% 11.57% 7.51%
Current Value of Standard Investment of Rs 10000
Last 2 years 12498 12721 11347
Since inception from 2.11.2012) till Mar 31, 2015 12777 13017 11906
*20% CNX 500 + 80% Crisil Short-Term Bond Fund Index
SCHEME PERFORMANCE
34
Franklin India Treasury Management Account (FITMA) - Growth Option - Super Institutional Plan (SIP)NAV as at Mar 31, 2015 : (Rs.) SIP: 2087.4034Fund Manager : Pallab Roy, Sachin Padwal-Desai
Franklin Templeton Investmentswww.franklintempletonindia.com
Franklin India Treasury Management Account (FITMA) - Growth Option - Institutional Plan (IP)NAV as at Mar 31, 2015 : (Rs.) IP: 2158.2758Fund Manager : Pallab Roy, Sachin Padwal-Desai
NAV Per unit (Rs.) IP# B: Crisil Liquid
Fund Index
AB:Crisil 1 Year
T-Bill Index
Franklin India Treasury Management Account (FITMA) - Growth Option - RetailNAV as at Mar 31, 2015 : (Rs.) Retail: 3362.1337Fund Manager : Pallab Roy, Sachin Padwal-Desai
NAV Per unit (Rs.) Retail# B:Crisil Liquid
Fund Index
AB:Crisil 1 Year
T-Bill Index
Discrete 12 months performance
Mar 24, 2015 to Mar 31, 2015 3353.9396 12.74% 13.63% 17.17%
Mar 17, 2015 to Mar 31, 2015 3349.0529 10.18% 10.55% 15.23%
Feb 27, 2015 to Mar 31, 2015 3336.0454 8.92% 9.51% 11.19%
Mar 28, 2014 to Mar 31, 2015 (Last 1 year) 3100.0308 8.45% 9.06% 8.82%
Mar 28, 2013 to Mar 28, 2014 2844.5673 8.98% 9.46% 5.77%
Mar 30, 2012 to Mar 28, 2013 2616.2485 8.73% 8.17% 8.33%
Compounded Annualised Growth Rate Performance
Last 2 years (Mar 28, 2013 to Mar 31, 2015) 8.68% 9.22% 7.25%
Last 3 years (Mar 30, 2012 to Mar 31, 2015) 8.71% 8.89% 7.62%
Last 5 years (Mar 31, 2010 to Mar 31, 2015) 2267.09 8.20% 8.26% 6.65%
Last 10 years (Mar 31, 2005 to Mar 31, 2015) 1656.9959 7.33% 7.24% 5.95%
Last 15 years (Mar 31, 2000 to Mar 31, 2015) 1183.34 7.21% N.A 6.29%
Since inception till Mar 31, 2015 1000 7.42% N.A 6.52%
Current Value of Standard Investment of Rs 10000
Last 2 years 11819 11938 11509
Last 3 years 12851 12914 12468
Last 5 years 14830 14873 13803
Last 10 years 20291 20129 17833
Last 15 years 28412 N.A 24980
Since inception (29.4.1998) 33621 N.A 29154
Discrete 12 months performance
Mar 24, 2015 to Mar 31, 2015 2152.9126 12.99% 13.63% 17.17%
Mar 17, 2015 to Mar 31, 2015 2149.6726 10.43% 10.55% 15.23%
Feb 27, 2015 to Mar 31, 2015 2141.0599 9.17% 9.51% 11.19%
Mar 28, 2014 to Mar 31, 2015 (Last 1 year) 1985.0137 8.66% 8.98% 8.74%
Mar 28, 2013 to Mar 28, 2014 1816.8879 9.25% 9.46% 5.77%
Mar 30, 2012 to Mar 28, 2013 1666.9062 9.05% 8.22% 8.38%
Compounded Annualised Growth Rate Performance
Last 2 years (Mar 28, 2013 to Mar 31, 2015) 8.95% 9.22% 7.25%
Last 3 years (Mar 30, 2012 to Mar 31, 2015) 8.98% 8.89% 7.62%
Last 5 years (Mar 31, 2010 to Mar 31, 2015) 1437.2411 8.47% 8.26% 6.65%
Last 10 years (Mar 31, 2005 to Mar 31, 2015) 1037.4229 7.60% 7.24% 5.95%
Since inception till Mar 31, 2015 1000 7.40% 7.02% 5.80%
Current Value of Standard Investment of Rs 10000
Last 2 years 11879 11938 11509
Last 3 years 12948 12914 12468
Last 5 years 15017 14873 13803
Last 10 years 20804 20129 17833
Since inception (22.6.2004) 21583 20782 18368
NAV Per unit (Rs.) SIP B: Crisil Liquid
Fund Index
AB: Crisil 1 Year
T-Bill Index
Discrete 12 months performance
Mar 24, 2015 to Mar 31, 2015 2082.0528 13.40% 13.63% 17.17%
Mar 17, 2015 to Mar 31, 2015 2078.7561 10.85% 10.55% 15.23%
Feb 27, 2015 to Mar 31, 2015 2070.0094 9.58% 9.51% 11.19%
Mar 28, 2014 to Mar 31, 2015 (Last 1 year) 1912.6231 9.06% 8.98% 8.74%
Mar 28, 2013 to Mar 28, 2014 1745.3865 9.58% 9.46% 5.77%
Mar 30, 2012 to Mar 28, 2013 1596.0845 9.41% 8.22% 8.38%
Compounded Annualised Growth Rate Performance
Last 2 years (Mar 28, 2013 to Mar 31, 2015) 9.32% 9.22% 7.25%
Last 3 years (Mar 30, 2012 to Mar 31, 2015) 9.35% 8.89% 7.62%
Last 5 years (Mar 31, 2010 to Mar 31, 2015) 1367.2477 8.83% 8.26% 6.65%
Since inception till Mar 31, 2015 1000 7.98% 7.35% 5.98%
IP - Returns
SIP - NAV Per Unit (Rs.)
SIP - Returns
B: Crisil Liquid Fund Index
AB: Crisil 1 year T-Bill Index
# The plan is suspended for further subscription
9.58%
16.8589
9.98%
9.06%
8.82%
9.97%
15.2758
10.36%
9.46%
5.77%
9.53%
13.8973
9.92%
8.17%
8.33%
9.73%
10.13%
9.22%
7.25%
9.68%
10.08%
8.89%
7.62%
9.06%
11.8476
9.37%
8.26%
6.65%
12050
12138
11938
11509
18203
18542
17119
15586
8.57%
10.0000
8.84%
7.66%
6.28%
15435
15650
14873
13803
Current Value of Standard Investment of Rs 10000
Last 2 years 11960 11938 11509
Last 3 years 13078 12914 12468
Last 5 years 15267 14873 13803
Since inception (2.9.2005) 20874 19736 17444
# The plan is suspended for further subscription
Discrete 12 months performance
NAV Per unit (Rs.) FICBOF B: Crisil Short-Term
Bond Fund Index
AB: Crisil 10 Year
Gilt Index
Franklin India Corporate Bond Opportunities Fund (FICBOF)- Growth OptionNAV as at Mar 31, 2015 : (Rs.) 14.0972 Fund Manager : Umesh Sharma & Sachin Padwal - Desai
Mar 28, 2014 to Mar 31, 2015 (Last 1 year) 12.5992 11.89% 10.40% 14.63%
Mar 28, 2013 to Mar 28, 2014 11.5773 8.83% 8.78% -1.01%
Mar 30, 2012 to Mar 28, 2013 10.4187 11.12% 9.05% 11.25%
Compounded Annualised Growth Rate Performance
Last 2 years (Mar 28, 2013 to Mar 31, 2015) 10.30% 9.55% 6.49%
Last 3 years (Mar 30, 2012 to Mar 31, 2015) 10.59% 9.40% 8.07%
Since inception till Mar 31, 2015 10 10.91% 9.33% 8.18%
Current Value of Standard Investment of Rs 10000
Last 2 years 12177 12010 11347
Last 3 years 13531 13097 12624
Since inception (7.12.2011) 14097 13439 12979

35Franklin Templeton Investmentswww.franklintempletonindia.com
Past performance may or may not be sustained in the future. Returns greater than 1 year period are compounded annualized B: Benchmark, AB: Additional Benchmark Performance of close-ended funds are not strictly comparable with that of open-ended schemes since its investment strategy is primarily buy-and-hold whereas opened-ended schemes are actively managed Given the asset allocation, hybrid fund/fund of funds performance are not comparable with pure equity/debt fund performance and that of Additional Benchmarks For liquid funds, the less than 1 year returns are simple annualised Performance of dividend plan / option would be at the gross rates Load has not been taken into consideration. Dividends assumed to be reinvested and Bonus is adjusted. For equity oriented funds, additional benchmark chosen is CNX Nifty, For long term debt oriented funds, additional benchmark is CRISIL 10Year Gilt Index and For short term debt oriented funds, additional benchmark is CRISIL 1Year T-Bill Index [For past performance of direct plans, please log on to: http://www.franklintempletonindia.com/content-india/documents/PDF/Direct%20Plan%20Returns%20Mar2015.pdf ]
1 Year 3 Year 5 Year 7 Year 10 Year Since jan 97
Franklin India Bluechip Fund (FIBCF) - Growth OptionSIP - If you had invested 5000 every month in FIBCF ... `
SIP RETURNS
Total Amount Invested (Rs.) 60,000 180,000 300,000 420,000 600,000 1,095,000
Total Value as on Mar 31, 2015 (Rs) 68,593 258,007 463,585 781,380 1,381,246 13,195,727
Returns 27.75% 24.90% 17.46% 17.44% 15.92% 23.48%
Total Value of B:S&P BSE Sensex 64,098 240,947 427,226 681,166 1,134,174 4,713,078
B:S&P BSE Sensex Returns 12.98% 19.94% 14.13% 13.58% 12.24% 14.28%
Total Value of AB:CNX Nifty 64,955 243,309 431,690 687,753 1,148,839 4,700,270
AB:CNX Nifty returns 15.75% 20.64% 14.55% 13.85% 12.48% 14.25%
1 Year 3 Year 5 Year 7 Year 10 Year Since Inception
1 Year 3 Year 5 Year 7 Year 10 Year Since Inception
Templeton India Growth Fund (TIGF) - Growth OptionSIP - If you had invested 5000 every month in TIGF …`
Franklin India Prima Plus (FIPP) - Growth OptionSIP - If you had invested 5000 every month in FIPP …`
Total Amount Invested (Rs.) 60,000 180,000 300,000 420,000 600,000 1,115,000
Total Value as on Mar 31, 2015 (Rs) 66,565 259,117 453,105 752,776 1,332,345 9,537,509
Returns 21.02% 25.22% 16.53% 16.39% 15.25% 20.04%
Total Value of B:S&P BSE Sensex 64,098 240,947 427,226 681,166 1,134,174 4,892,404
B:S&P BSE Sensex Returns 12.98% 19.94% 14.13% 13.58% 12.24% 14.18%
Total Value of B:MSCI India Value 60,979 216,747 360,796 561,588 965,480 N.A
B:MSCI India Value Returns 3.06% 12.48% 7.32% 8.17% 9.20% N.A
Total Value of AB:CNX Nifty 64,955 243,309 431,690 687,753 1,148,839 4,888,493
AB:CNX Nifty returns 15.75% 20.64% 14.55% 13.85% 12.48% 14.17%
Total Amount Invested (Rs.) 60,000 180,000 300,000 420,000 600,000 1,225,000
Total Value as on Mar 31, 2015 (Rs) 73,128 295,772 543,693 913,411 1,634,746 22,586,324
Returns 43.18% 35.16% 24.04% 21.83% 19.05% 24.04%
Total Value of B:CNX 500 66,458 253,468 444,884 709,895 1,154,441 6,513,450
B:CNX 500 Returns 20.67% 23.60% 15.78% 14.74% 12.57% 14.36%
Total Value of AB:CNX Nifty 64,955 243,309 431,690 687,753 1,148,839 5,804,182
AB:CNX Nifty returns 15.75% 20.64% 14.55% 13.85% 12.48% 13.44%
1 Year 3 Year 5 Year 7 Year 10 Year Since Inception
Franklin India Prima Fund (FIPF) - Growth OptionSIP - If you had invested 5000 every month in FIPF…`
Total Amount Invested (Rs.) 60,000 180,000 300,000 420,000 600,000 1,280,000
Total Value as on Mar 31, 2015 (Rs) 75,589 336,938 635,266 1,119,090 1,769,847 27,456,697
Returns 51.76% 45.40% 30.58% 27.58% 20.52% 24.00%
Total Value of B:CNX 500 66,458 253,468 444,884 709,895 1,154,441 6,843,225
B:CNX 500 Returns 20.67% 23.60% 15.78% 14.74% 12.57% 13.74%
Total Value of CNX Midcap 70,167 276,480 474,948 784,541 1,293,738 N.A
CNX Midcap Returns 33.05% 30.04% 18.45% 17.55% 14.70% N.A
Total Value of AB:CNX Nifty 64,955 243,309 431,690 687,753 1,148,839 6,183,878
AB:CNX Nifty returns 15.75% 20.64% 14.55% 13.85% 12.48% 12.98%
Franklin India Opportunities Fund (FIOF) - Growth OptionIf you had invested `5000 every month in FIOF..
sinceInception
10 year7 year5 year3 year1 year
Franklin India Flexi Cap Fund (FIFCF) - Growth OptionSIP - If you had invested 5000 every month in FIFCF …`
Franklin India High Growth Companies Fund (FIHGCF) - Growth OptionSIP - If you had invested 5000 every month in FIHGCF …`
Franklin Asian Equity Fund (FAEF) - Growth OptionSIP - If you had invested 5000 every month in FAEF …`
1 Year 3 Year 5 Year 7 Year Since Inception
Templeton India Equity Income Fund (TIEIF) - Growth OptionSIP - If you had invested 5000 every month in TIEIF …`
1 Year 3 Year 5 Year 7 Year 10 Year Since Inception
Franklin India Taxshield (FIT) - Growth OptionSIP - If you had invested 5000 every month in FIT …`
Total amount Invested (Rs) 60,000 180,000 300,000 420,000 535,000
Total value as on Mar 31, 2015 (Rs) 65,069 248,605 451,343 767,159 1,073,505
Returns 16.12% 22.20% 16.37% 16.92% 15.09%
Total value of B :S&P BSE 200 66,280 250,663 440,332 706,023 945,734
B:S&P BSE 200 returns 20.08% 22.79% 15.36% 14.59% 12.38%
Total value of AB :CNX Nifty 64,955 243,309 431,690 687,753 926,918
AB:CNX Nifty returns 15.75% 20.64% 14.55% 13.85% 11.95%
Total amount Invested (Rs) 60,000 180,000 300,000 420,000 600,000 960,000
Total value as on Mar 31, 2015 (Rs) 72,935 294,554 545,566 935,160 1,623,717 7,922,552
Returns 42.51% 34.85% 24.18% 22.49% 18.92% 23.25%
Total value of B :CNX 500 66,458 253,468 444,884 709,895 1,154,441 3,867,372
B:CNX 500 Returns 20.67% 23.60% 15.78% 14.74% 12.57% 15.73%
Total value of AB : CNX NIFTY 64,955 243,309 431,690 687,753 1,148,839 3,560,482
AB:CNX NIFTY returns 15.75% 20.64% 14.55% 13.85% 12.48% 14.86%
Total amount Invested (Rs) 60,000 180,000 300,000 420,000 600,000 905,000
Total value as on Mar 31, 2015 (Rs) 74,099 299,042 528,187 832,599 1,341,398 4,267,679
Returns 46.55% 36.01% 22.84% 19.22% 15.37% 18.54%
Total value of B :S&P BSE 200 # 66,280 250,663 440,332 706,023 1,164,225 2,672,047
B:S&P BSE 200 # Returns 20.08% 22.79% 15.36% 14.59% 12.73% 13.21%
Total value of AB :CNX Nifty 64,955 243,309 431,690 687,753 1,148,839 3,188,439
AB:CNX Nifty returns 15.75% 20.64% 14.55% 13.85% 12.48% 15.24%
1 Year 3 Year 5 Year 7 Year Since Inception
Total amount Invested (Rs) 60,000 180,000 300,000 420,000 465,000
Total value as on Mar 31, 2015 (Rs) 76,514 337,805 629,116 1,072,901 1,191,037
Returns 55.02% 45.61% 30.17% 26.38% 23.64%
Total value of B :CNX 500 66,458 253,468 444,884 709,895 783,226
B:CNX 500 returns 20.67% 23.60% 15.78% 14.74% 13.15%
Total value of AB : CNX Nifty 64,955 243,309 431,690 687,753 762,516
AB: CNX Nifty returns 15.75% 20.64% 14.55% 13.85% 12.48%
Franklin Build India Fund (FBIF) - Growth OptionIf you had invested `5000 every month in FBIF..
1 Year 3 Year 5 Year Since Inception
Total amount Invested (Rs) 60,000 180,000 300,000 335,000
Total value as on Mar 31, 2015 (Rs) 78,910 358,394 663,048 758,691
Returns 63.56% 50.41% 32.40% 29.53%
SCHEME PERFORMANCEFranklin India Feeder - Franklin U.S. Opportunities Fund (FIF-FUSOF) - Growth OptionNAV as at Mar 31, 2015 : (Rs.) 20.0490 Fund Manager : Roshi Jain
AdditionalBenchmark
B: Russell3000 Growth
FIF-FUSOFNAV Per unit (RS.)
Discrete 12 months performance
Mar 28, 2014 to Mar 31, 2015 (Last 1 year) 16.6347 20.53% 21.96% Not Applicable
Mar 28, 2013 to Mar 28, 2014 12.3696 34.48% 35.00% Not Applicable
Mar 30, 2012 to Mar 28, 2013 11.1049 11.39% 17.81% Not Applicable
Compounded Annualised Growth Rate Performance
Last 2 years (Mar 28, 2013 to Mar 31, 2015) 27.19% 28.18% Not Applicable
Last 3 years (Mar 30, 2012 to Mar 31, 2015) 21.74% 24.69%
Since inception till Mar 31, 2015 10 24.90% 26.65% Not Applicable
Current Value of Standard Investment of Rs 10000
Last 2 years 16208 16465 Not Applicable
Last 3 years 18054 19396
Since inception (13.2.2012) 20049 20945 Not Applicable
1 Year 3 Year 5 Year 7 Year 10 Year Since Inception
Total amount Invested (Rs) 60,000 180,000 300,000 420,000 600,000 600,000
Total value as on Mar 31, 2015 (Rs) 71,961 296,118 535,659 908,908 1,566,884 1,566,884
Returns 39.16% 35.25% 23.42% 21.69% 18.26% 18.26%
Total value of B : CNX 500 66,458 253,468 444,884 709,895 1,154,441 1,154,441
B:CNX 500 Returns 20.67% 23.60% 15.78% 14.74% 12.57% 12.57%
Total value of AB :CNX Nifty 64,955 243,309 431,690 687,753 1,148,839 1,148,839
AB:CNX Nifty returns 15.75% 20.64% 14.55% 13.85% 12.48% 12.48%
1 Year 3 Year 5 Year 7 Year Since Inception
Total Amount Invested (Rs.) 60,000 180,000 300,000 420,000 435,000
Total Value as on Mar 31, 2015 (Rs) 63,384 213,158 395,653 629,150 654,868
Returns 10.68% 11.32% 11.03% 11.36% 11.09%
Total Value of B:MSCI Asia (ex Japan) 63,227 211,341 395,323 638,163 663,354
B:MSCI Asia (ex Japan) Returns 10.18% 10.73% 10.99% 11.76% 11.43%
Total Value of AB:CNX Nifty 64,955 243,309 431,690 687,753 711,462
AB:CNX Nifty returns 15.75% 20.64% 14.55% 13.85% 13.32%
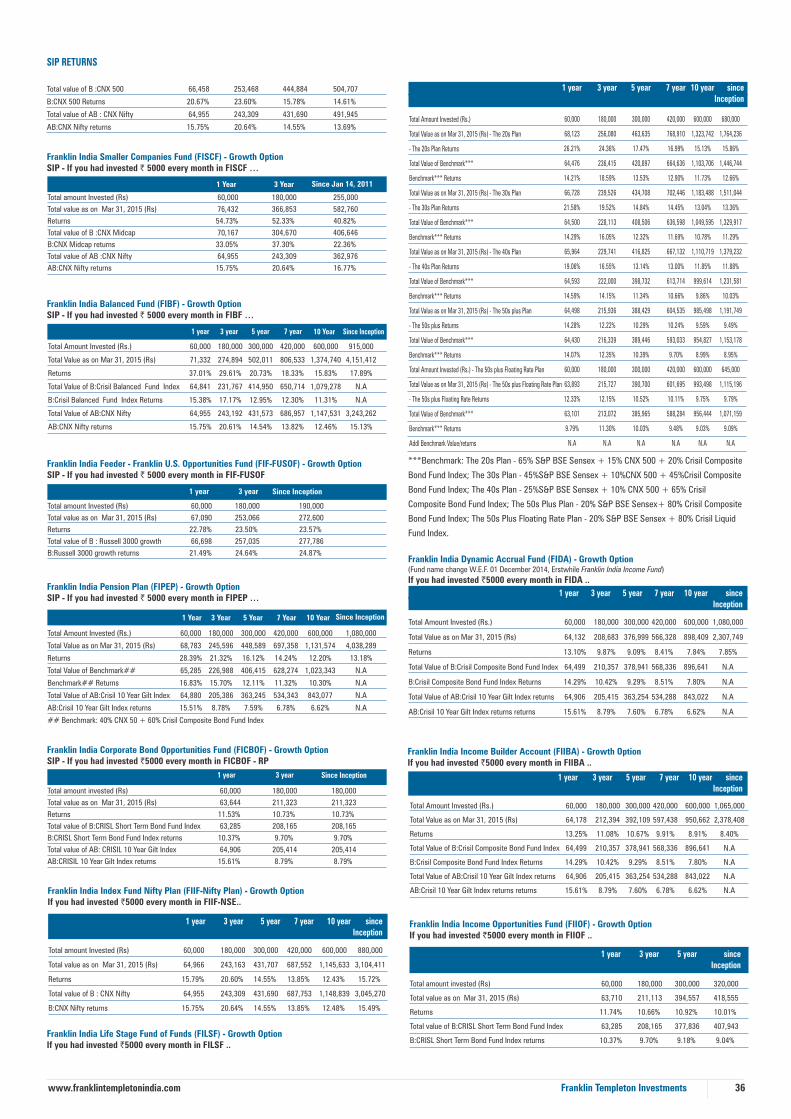
36
SIP RETURNS
Franklin Templeton Investmentswww.franklintempletonindia.com
Since Jan 14, 20111 Year 3 Year
Franklin India Smaller Companies Fund (FISCF) - Growth OptionSIP - If you had invested 5000 every month in FISCF …`
Total amount Invested (Rs) 60,000 180,000 255,000
Total value as on Mar 31, 2015 (Rs) 76,432 366,853 582,760
Returns 54.73% 52.33% 40.82%
Total value of B :CNX Midcap 70,167 304,670 406,646
B:CNX Midcap returns 33.05% 37.30% 22.36%
Total value of AB :CNX Nifty 64,955 243,309 362,976
AB:CNX Nifty returns 15.75% 20.64% 16.77%
1 year Since Inception
Franklin India Feeder - Franklin U.S. Opportunities Fund (FIF-FUSOF) - Growth OptionSIP - If you had invested 5000 every month in FIF-FUSOF`
Total amount Invested (Rs) 60,000 180,000 190,000
Total value as on Mar 31, 2015 (Rs) 67,090 253,066 272,600
Returns 22.78% 23.50% 23.57%
Total value of B : Russell 3000 growth 66,698 257,035 277,786
B:Russell 3000 growth returns 21.49% 24.64% 24.87%
1 Year 3 Year 5 Year 7 Year 10 Year Since Inception
Franklin India Pension Plan (FIPEP) - Growth OptionSIP - If you had invested 5000 every month in FIPEP …`
Total Amount Invested (Rs.) 60,000 180,000 300,000 420,000 600,000 1,080,000
Total Value as on Mar 31, 2015 (Rs) 68,783 245,596 448,589 697,358 1,131,574 4,038,289
Returns 28.39% 21.32% 16.12% 14.24% 12.20% 13.18%
Total Value of Benchmark## 65,285 226,988 406,415 628,274 1,023,343 N.A
Benchmark## Returns 16.83% 15.70% 12.11% 11.32% 10.30% N.A
Total Value of AB:Crisil 10 Year Gilt Index 64,880 205,386 363,245 534,343 843,077 N.A
AB:Crisil 10 Year Gilt Index returns 15.51% 8.78% 7.59% 6.78% 6.62% N.A
## Benchmark: 40% CNX 50 + 60% Crisil Composite Bond Fund Index
1 year Since Inception3 year 5 year 7 year 10 Year
Franklin India Balanced Fund (FIBF) - Growth OptionSIP - If you had invested ` 5000 every month in FIBF …
Total Amount Invested (Rs.) 60,000 180,000 300,000 420,000 600,000 915,000
Total Value as on Mar 31, 2015 (Rs) 71,332 274,894 502,011 806,533 1,374,740 4,151,412
Returns 37.01% 29.61% 20.73% 18.33% 15.83% 17.89%
Total Value of B:Crisil Balanced Fund Index 64,841 231,767 414,950 650,714 1,079,278 N.A
B:Crisil Balanced Fund Index Returns 15.38% 17.17% 12.95% 12.30% 11.31% N.A
Total Value of AB:CNX Nifty 64,955 243,192 431,573 686,957 1,147,531 3,243,262
AB:CNX Nifty returns 15.75% 20.61% 14.54% 13.82% 12.46% 15.13%
1 year Since Inception
Franklin India Corporate Bond Opportunities Fund (FICBOF) - Growth OptionSIP - If you had invested `5000 every month in FICBOF - RP
Total amount invested (Rs)
Total value as on Mar 31, 2015 (Rs)
Returns
Total value of B:CRISL Short Term Bond Fund Index
B:CRISL Short Term Bond Fund Index returns
Total value of AB: CRISIL 10 Year Gilt Index
AB:CRISIL 10 Year Gilt Index returns
Total value of B :CNX 500 66,458 253,468 444,884 504,707
B:CNX 500 Returns 20.67% 23.60% 15.78% 14.61%
Total value of AB : CNX Nifty 64,955 243,309 431,690 491,945
AB:CNX Nifty returns 15.75% 20.64% 14.55% 13.69%
Franklin India Index Fund Nifty Plan (FIIF-Nifty Plan) - Growth OptionIf you had invested `5000 every month in FIIF-NSE..
sinceInception
10 year7 year5 year3 year1 year
Total amount Invested (Rs) 60,000 180,000 300,000 420,000 600,000 880,000
Total value as on Mar 31, 2015 (Rs) 64,966 243,163 431,707 687,552 1,145,633 3,104,411
Returns 15.79% 20.60% 14.55% 13.85% 12.43% 15.72%
Total value of B : CNX Nifty 64,955 243,309 431,690 687,753 1,148,839 3,045,270
B:CNX Nifty returns 15.75% 20.64% 14.55% 13.85% 12.48% 15.49%
Franklin India Life Stage Fund of Funds (FILSF) - Growth OptionIf you had invested `5000 every month in FILSF ..
1 year 3 year 5 year 7 year sinceInception
10 year
***Benchmark: The 20s Plan - 65% S&P BSE Sensex + 15% CNX 500 + 20% Crisil Composite
Bond Fund Index; The 30s Plan - 45%S&P BSE Sensex + 10%CNX 500 + 45%Crisil Composite
Bond Fund Index; The 40s Plan - 25%S&P BSE Sensex + 10% CNX 500 + 65% Crisil
Composite Bond Fund Index; The 50s Plus Plan - 20% S&P BSE Sensex+ 80% Crisil Composite
Bond Fund Index; The 50s Plus Floating Rate Plan - 20% S&P BSE Sensex + 80% Crisil Liquid
Fund Index.
Franklin India Income Opportunities Fund (FIIOF) - Growth OptionIf you had invested 5000 every month in FIIOF ..`
sinceInception
3 year1 year
Franklin India Income Builder Account (FIIBA) - Growth OptionIf you had invested `5000 every month in FIIBA ..
sinceInception
10 year7 year5 year3 year1 year
Franklin India Dynamic Accrual Fund (FIDA) - Growth Option(Fund name change W.E.F. 01 December 2014, Erstwhile Franklin India Income Fund)
If you had invested `5000 every month in FIDA ..
sinceInception
10 year7 year5 year3 year1 year
Total Amount Invested (Rs.) 60,000 180,000 300,000 420,000 600,000 1,080,000
Total Value as on Mar 31, 2015 (Rs) 64,132 208,683 376,999 566,328 898,409 2,307,749
Returns 13.10% 9.87% 9.09% 8.41% 7.84% 7.85%
Total Value of B:Crisil Composite Bond Fund Index 64,499 210,357 378,941 568,336 896,641 N.A
B:Crisil Composite Bond Fund Index Returns 14.29% 10.42% 9.29% 8.51% 7.80% N.A
Total Value of AB:Crisil 10 Year Gilt Index returns 64,906 205,415 363,254 534,288 843,022 N.A
AB:Crisil 10 Year Gilt Index returns returns 15.61% 8.79% 7.60% 6.78% 6.62% N.A
Total Amount Invested (Rs.) 60,000 180,000 300,000 420,000 600,000 1,065,000
Total Value as on Mar 31, 2015 (Rs) 64,178 212,394 392,109 597,438 950,662 2,378,408
Returns 13.25% 11.08% 10.67% 9.91% 8.91% 8.40%
Total Value of B:Crisil Composite Bond Fund Index 64,499 210,357 378,941 568,336 896,641 N.A
B:Crisil Composite Bond Fund Index Returns 14.29% 10.42% 9.29% 8.51% 7.80% N.A
Total Value of AB:Crisil 10 Year Gilt Index returns 64,906 205,415 363,254 534,288 843,022 N.A
AB:Crisil 10 Year Gilt Index returns returns 15.61% 8.79% 7.60% 6.78% 6.62% N.A
Total amount invested (Rs)
Total value as on Mar 31, 2015 (Rs)
Returns
Total value of B:CRISL Short Term Bond Fund Index
B:CRISL Short Term Bond Fund Index returns
Total Amount Invested (Rs.)
Total Value as on Mar 31, 2015 (Rs) - The 20s Plan
- The 20s Plan Returns
Total Value of Benchmark***
Benchmark*** Returns
Total Value as on Mar 31, 2015 (Rs) - The 30s Plan
- The 30s Plan Returns
Total Value of Benchmark***
Benchmark*** Returns
Total Value as on Mar 31, 2015 (Rs) - The 40s Plan
- The 40s Plan Returns
Total Value of Benchmark***
Benchmark*** Returns
Total Value as on Mar 31, 2015 (Rs) - The 50s plus Plan
- The 50s plus Returns
Total Value of Benchmark***
Benchmark*** Returns
Total Amount Invested (Rs.) - The 50s plus Floating Rate Plan
Total Value as on Mar 31, 2015 (Rs) - The 50s plus Floating Rate Plan
- The 50s plus Floating Rate Returns
Total Value of Benchmark***
Benchmark*** Returns
Addl Benchmark Value/returns
60,000
68,123
26.21%
64,476
14.21%
66,728
21.58%
64,500
14.29%
65,964
19.06%
64,593
14.59%
64,498
14.28%
64,430
14.07%
60,000
63,893
12.33%
63,101
9.79%
N.A
180,000
256,080
24.36%
236,415
18.59%
239,526
19.52%
228,113
16.05%
229,741
16.55%
222,000
14.15%
215,936
12.22%
216,339
12.35%
180,000
215,727
12.15%
213,072
11.30%
N.A
300,000
463,635
17.47%
420,897
13.53%
434,708
14.84%
408,506
12.32%
416,825
13.14%
398,732
11.34%
388,429
10.29%
389,446
10.39%
300,000
390,700
10.52%
385,965
10.03%
N.A
420,000
768,910
16.99%
664,636
12.90%
702,446
14.45%
636,598
11.69%
667,132
13.00%
613,714
10.66%
604,535
10.24%
593,033
9.70%
420,000
601,695
10.11%
588,284
9.48%
N.A
600,000
1,323,742
15.13%
1,103,706
11.73%
1,183,488
13.04%
1,049,595
10.78%
1,110,719
11.85%
999,614
9.86%
985,498
9.59%
954,827
8.99%
600,000
993,498
9.75%
956,444
9.03%
N.A
680,000
1,764,236
15.86%
1,446,744
12.66%
1,511,044
13.36%
1,329,917
11.29%
1,379,232
11.88%
1,231,581
10.03%
1,191,749
9.49%
1,153,178
8.95%
645,000
1,115,196
9.79%
1,071,159
9.09%
N.A
5 year
3 year
3 year
60,000
63,644
11.53%
63,285
10.37%
64,906
15.61%
180,000
211,323
10.73%
208,165
9.70%
205,414
8.79%
180,000
211,323
10.73%
208,165
9.70%
205,414
8.79%
60,000
63,710
11.74%
63,285
10.37%
180,000
211,113
10.66%
208,165
9.70%
300,000
394,557
10.92%
377,836
9.18%
320,000
418,555
10.01%
407,943
9.04%

37Franklin Templeton Investmentswww.franklintempletonindia.com
Franklin India Monthly Income Plan (FIMIP) - Growth OptionIf you had invested `5000 every month in FIMIP..
sinceInception
10 year7 year5 year3 year1 year
Total Amount Invested (Rs.) 60,000 180,000 300,000 420,000 600,000 870,000
Total Value as on Mar 31, 2015 (Rs) 66,253 227,821 414,970 635,831 1,027,189 1,928,531
Returns 19.99% 15.96% 12.95% 11.65% 10.37% 10.28%
Total Value of B:Crisil MIP Blended Index 64,583 215,281 387,764 588,448 944,509 N.A
B:Crisil MIP Blended Index Returns 14.55% 12.01% 10.21% 9.48% 8.79% N.A
Total Value of AB:Crisil 10 Year Gilt Index returns 64,880 205,386 363,245 534,343 843,077 N.A
AB:Crisil 10 Year Gilt Index returns returns 15.51% 8.78% 7.59% 6.78% 6.62% N.A
Franklin India Government Securities Fund (FIGSF) - Growth - Composite Plan (CP)If you had invested `5000 every month in FIGSF-CP..
Total amount invested (Rs) 60,000 180,000 300,000 420,000 600,000 950,000
Total value as on Mar 31, 2015 (Rs) 66,106 214,774 382,406 568,447 922,855 1,984,945
Returns 19.53% 11.85% 9.66% 8.52% 8.35% 8.72%
Total value of B: I- Sec Composite Index 64,861 212,369 385,831 583,063 943,858 N.A
B: I- Sec Composite Index returns 15.46% 11.07% 10.02% 9.23% 8.77% N.A
Total value of AB: CRISIL 10 Year Gilt Index 64,906 205,414 363,253 534,287 843,040 N.A
AB:CRISIL 10 Year Gilt Index returns 15.61% 8.79% 7.60% 6.78% 6.62% N.A
sinceInception
10 year7 year5 year3 year1 year
Franklin India Government Securities Fund (FIGSF) - Growth - PF PlanIf you had invested 5000 every month in FIGSF-PF..`
Total amount invested (Rs) 60,000 180,000 300,000 420,000 600,000 655,000
Total value as on Mar 31, 2015 (Rs) 66,106 214,774 382,406 568,446 922,944 1,039,208
Returns 19.53% 11.85% 9.66% 8.52% 8.35% 8.16%
Total value of B: I- Sec Composite Index 64,861 212,369 385,831 583,063 943,858 1,065,140
B: I- Sec Composite Index returns 15.46% 11.07% 10.02% 9.23% 8.77% 8.59%
Total value of AB: CRISIL 10 Year Gilt Index 64,906 205,414 363,253 534,287 843,040 942,069
AB:CRISIL 10 Year Gilt Index returns 15.61% 8.79% 7.60% 6.78% 6.62% 6.46%
sinceInception
10 year7 year5 year3 year1 year
sinceInception
3 year1 year
Total amount invested (Rs) 60,000 180,000 285,000
Total value as on Mar 31, 2015 (Rs) 63,200 208,947 360,864
Returns 10.10% 9.96% 9.91%
Total value of B:CRISL Short Term Bond Fund Index 63,285 208,165 355,588
B:CRISL Short Term Bond Fund Index returns 10.37% 9.70% 9.28%
Total value of AB:CRISIL 1 Year T - Bill Index 62,870 202,501 341,350
AB:CRISIL 1 Year T - Bill Index returns 9.05% 7.82% 7.55%
Franklin India Low Duration Fund (FILDF) - GrowthIf you had invested `5000 every month in FILDF..
sinceInception
10 year7 year5 year3 year1 year
Total Amount Invested (Rs.) 60,000 180,000 300,000 420,000 600,000 790,000
Total Value as on Mar 31, 2015 (Rs) 63,720 211,322 386,977 594,944 983,031 1,472,446
Returns 11.77% 10.73% 10.14% 9.79% 9.54% 8.98%
Total Value of B:Crisil Short-Term Bond Fund Index 63,284 208,165 377,836 570,075 915,984 N.A
B:Crisil Short-Term Bond Fund Index Returns 10.37% 9.70% 9.18% 8.60% 8.20% N.A
Total Value of AB:Crisil 1 Year T-Bill Index 62,870 202,501 361,992 534,941 834,190 1,199,174
AB:Crisil 1 Year T-Bill Index returns 9.05% 7.82% 7.46% 6.81% 6.42% 6.10%
Franklin India Short Term Income Plan (FISTIP) - Growth - RetailSIP - If you had invested `5000 every month in FISTIP - RP
Franklin India Government Securities Fund (FIGSF) - Growth - Long Term Plan (LT)If you had invested `5000 every month in FIGSF-LT..
sinceInception
10 year7 year5 year3 year1 year
*B: Benchmark, AB: Additional Benchmark
sinceInception
10 year7 year5 year3 year1 year
Total Amount Invested (Rs.) 60,000 180,000 300,000 420,000 600,000 790,000
Total Value as on Mar 31, 2015 (Rs) 62,881 206,347 376,704 570,474 921,579 1,360,974
Returns 9.08% 9.10% 9.05% 8.62% 8.32% 7.88%
Total Value of B:Crisil Liquid Fund Index 62,841 206,289 374,515 562,279 896,854 N.A
B:Crisil Liquid Fund Index Returns 8.96% 9.08% 8.82% 8.21% 7.80% N.A
Total Value of AB:Crisil 1 Year T-Bill Index 62,870 202,501 361,992 534,941 834,190 1,199,062
AB:Crisil 1 Year T-Bill Index returns 9.05% 7.82% 7.46% 6.81% 6.42% 6.10%
Franklin India Savings Plus Fund (FISPF) - Growth Option - RetailIf you had invested `5000 every month in FISPF-RP..
1 year 3 year 5 year 7 year sinceInception
10 year
Franklin India Dynamic PE Ratio Fund of Funds (FIDPEF)If you had invested ` 5000 every month in FIDPEF …
Total Amount Invested (Rs.) 60,000 180,000 300,000 420,000 600,000 685,000
Total Value as on Mar 31, 2015 (Rs) 65,918 232,312 419,434 674,663 1,193,617 1,631,501
Returns 18.91% 17.34% 13.39% 13.32% 13.20% 14.37%
Total Value of B:S&P BSE Sensex 64,000 240,755 426,832 679,529 1,132,027 1,555,434
B:S&P BSE Sensex Returns 12.67% 19.89% 14.10% 13.52% 12.20% 13.61%
Total Value of B:Crisil Balanced Fund Index 64,785 231,734 414,762 650,188 1,078,752 1,388,207
B:Crisil Balanced Fund Index Returns 15.22% 17.16% 12.94% 12.28% 11.30% 11.78%
Addl Benchmark Value/returns N.A N.A N.A N.A N.A N.A
Franklin Infotech Fund (FIF)
If you had invested `5000 every month in FIF
sinceInception
10 year7 year5 year3 year1 year
Total amount Invested (Rs) 60,000 180,000 300,000 420,000 600,000 1,000,000
Total value as on Mar 31, 2015 (Rs) 67,599 265,897 492,834 889,601 1,408,604 4,812,145
Returns 24.44% 27.13% 19.97% 21.08% 16.28% 16.85%
Total value of B :S&P BSE IT Index 68,098 275,090 511,796 914,027 1,443,817 N.A
B:S&P BSE IT Index Returns 26.10% 29.66% 21.53% 21.85% 16.74% N.A
Total value of AB :CNX NIFTY 64,955 243,309 431,690 687,753 1,148,839 3,795,838
AB:CNX NIFTY returns 15.75% 20.64% 14.55% 13.85% 12.48% 14.46%
Total value of AB: CRISIL 10 Year Gilt Index
AB:CRISIL 10 Year Gilt Index returns
64,906
15.61%
205,414
8.79%
363,253
10.49%
390,397
7.39%
Franklin India Ultra Short Bond Fund (FIUBF) - Growth Option - Retail*If you had invested `5000 every month in FIUBF-RP..
sinceInception
5 year3 year1 year
Total amount invested (Rs) 60,000 180,000 300,000 420,000 440,000
Total value as on Mar 31, 2015 (Rs) 62,958 207,352 379,404 573,972 609,536
Returns 9.33% 9.43% 9.34% 8.79% 8.74%
Total value of B:CRISIL Liquid Fund Index 62,841 206,289 374,516 562,280 596,304
B:CRISIL Liquid Fund Index returns 8.96% 9.08% 8.82% 8.21% 5.25%
Total value of AB:CRISIL 1 Year T - Bill Index 62,870 202,501 361,992 534,941 565,916
AB:CRISIL 1 Year T - Bill Index returns 9.05% 7.82% 7.46% 6.81% 6.76%
7 year
Total amount invested (Rs) 60,000 180,000 300,000 420,000 600,000 800,000
Total value as on Mar 31, 2015 (Rs) 66,228 214,787 382,859 570,643 935,963 1,447,582
Returns 19.93% 11.85% 9.71% 8.62% 8.61% 8.46%
Total value of B:I -Sec Li Bex 66,135 217,239 395,788 599,580 975,378 N.A
B:I -Sec Li Bex returns 19.62% 12.64% 11.04% 10.01% 9.40% N.A
Total value of AB: CRISIL 10 Year Gilt Index 64,906 205,414 363,253 534,287 843,040 1,232,484
AB:CRISIL 10 Year Gilt Index returns 15.61% 8.79% 7.60% 6.78% 6.62% 6.23%

38Franklin Templeton Investmentswww.franklintempletonindia.com
Product label of schemes which have not been covered in the factsheet but have been included in scheme performances
Product Label - Franklin Templeton Fixed Tenure Fund
This Product is suitable for investors who are seeking*
* Investors should consult their financial advisers if in doubt aboutwhether the product is suitable for them.
**Please refer back cover for Product Label Guidelines
(YELLOW)MEDIUM RISK**
Product Label - Franklin India Cash Management Account
This Product is suitable for investors who are seeking*
• Regular income for short term
• A liquid fund that invests in short term and money market instruments
(BLUE)LOW RISK**
* Investors should consult their financial advisers if in doubt aboutwhether the product is suitable for them.
**Please refer back cover for Product Label Guidelines
• Long term capital appreciation
• Gift Plan: A hybrid fund investing upto 75% in equities and balance in debt securities. Education Plan: A hybrid fund investing upto 20% in equities and balance in debt securities
(YELLOW)MEDIUM RISK**
* Investors should consult their financial advisers if in doubt about whether the product is suitable for them.
**Please refer back cover for Product Label Guidelines
Product Label - Templeton India Children’s asset Plan
This Product is suitable for investors who are seeking*
Past performance may or may not be sustained in the future. Returns are annualized "Given the asset allocation, hybrid fund performance are not comparable with pure equity/debt fund performanceand that of Additional Benchmarks" B: Benchmark, AB: Additional Benchmark Given the asset allocation, hybrid fund/fund of funds performance are not comparable with pure equity/debt fund performance and that of Additional Benchmarks Performance of dividend plan / option would be at the gross rates Load has not been taken into consideration. Dividends assumed to be reinvested and Bonus is adjusted. For equity oriented funds, additional benchmark chosen is CNX Nifty, For long term debt oriented funds, additional benchmark is CRISIL 10Year Gilt Index and For short term debt oriented funds, additional benchmark is CRISIL 1Year T-Bill Index

39
Past performance may or may not be sustained in future. ̂ Pursuant to payment of dividend, the NAV of the scheme will fall to the extent of payout and statutory levy (if applicable) • Past 12 +months dividend history # Past 3 months dividend history $ Past 3 quarters dividend history ** Since inception. ***1:1 bonus. Please refer to Index page for the name change. Dividend
distribution tax is taken into consideration wherever applicable while calculating the NAV performance. Dividend history given above is selective. For complete dividend history log on to www.franklintempletonindia.com
DIVIDEND^/BONUS HISTORY (FOR SELECT SCHEMES)Record Date
Rate perunit (`)
Record DateNAV* (`)
FIBCF**Jan 01, 1997Jul 30, 1999Mar 14, 2000***Nov 10, 2000Mar 09, 2001Mar 18, 2002Jul 30, 2003Feb 3, 2004Jan 19, 2005Jan 24, 2006Feb 07, 2007Jan 09, 2008Jan 21, 2009Jan 22, 2010Jan 21, 2011Jan 27, 2012Feb 08, 2013Jan 10, 2014Jan 16, 2015
TIGF**Apr 28, 2000Sep 16, 2003Feb 24, 2004Dec 8, 2004Dec 21, 2005Dec 20, 2006Dec 26, 2007Dec 10, 2008Dec 16, 2009Dec 16, 2010Dec 30, 2011Dec 24, 2012Dec 20, 2013Dec 12, 2014
FIPP**Oct 09, 1999Oct 13, 2000Jan 19, 2001Mar 18, 2002Aug 19, 2003Mar 23, 2004Oct 27, 2004Nov 9, 2005Nov 15, 2006Mar 7, 2007Feb 13, 2008Feb 25, 2009Feb 19, 2010Feb 18, 2011Mar 02, 2012Feb 15, 2013Feb 21, 2014Feb 13,2015
FIPF**Mar 11, 1999Sep 22, 2000Jan 17, 2001Mar 18, 2002Jun 27, 2003Jan 20, 2004Oct 5, 2004Jul 13, 2005Jul 19, 2006Jul 18, 2007Jun 18, 2008Jun 24, 2009Jun 18, 2010Jun 17, 2011Jun 22, 2012Jun 21, 2013Jun 13, 2014
FIFCF**Mar 14, 2006Sep 5, 2007Mar 12, 2008Jul 29, 2009Mar 23, 2010Mar 18, 2011Mar 23, 2012Mar 08, 2013Mar 28, 2014Mar 27, 2015
FIHGCFSep 24, 2010Jul 22, 2011Aug 23, 2013Aug 22, 2014
TIEIF**Sep 12, 2014Apr 18, 2007Nov 28, 2007May 21, 2008Aug 26, 2009Mar 12, 2010Sep 20, 2010Mar 11, 2011Sep 16, 2011Mar 16, 2012Sep 14, 2012Mar 15, 2013Sep 13, 2013Mar 14, 2014Mar 13, 2015
FBIFSep 24, 2010Jan 04, 2013Dec 20, 2013Dec 26, 2014
2.003.506.502.502.251.002.002.002.503.006.007.003.003.504.503.004.005.003.50
1.502.003.002.503.504.004.502.503.004.501.502.004.005.00
2.003.002.502.002.002.504.005.506.003.006.002.506.003.002.503.002.002.50
3.003.002.503.002.504.003.505.506.006.006.006.008.006.004.005.00
4.0000
2.002.503.001.502.001.502.002.001.00
1.7500
0.600.500.601.00
0.70000.700.700.700.700.700.700.700.700.700.700.700.700.70
0.7000
0.601.001.001.75
12.0330.1750.3816.8514.0812.9315.4522.4324.0733.9446.31
56.221223.468640.262443.035237.082538.870835.640644.2081
14.4520.4827.1627.2935.9441.07
60.599828.283351.572859.650439.954751.432149.050567.6406
18.8317.4116.7915.3618.1023.6323.0228.8538.8131.32
38.987219.454331.170428.326326.313126.886625.312939.5024
26.3418.9315.2716.7820.7335.6434.9747.4948.13
65.306348.845138.637648.137542.260834.235836.892248.1713
17.480018.540418.161915.102116.739815.577414.101513.699213.672219.0426
14.078212.333612.058220.8105
16.529112.337915.736215.099413.151014.690116.667515.013013.055213.148713.207813.431312.540212.970416.3782
13.335313.124612.544622.2172
Record DateRate per unit (`)
Individual /HUF and OthersRecord Date
NAV*(`)
FIT**Apr 17, 2000Apr 06, 2000Aug 04, 2001Feb 24, 2004Mar 18, 2005Feb 15, 2006Jan 10, 2007Nov 14, 2007Dec 17, 2008Jan 15, 2010Jan 14, 2011Feb 02, 2012Jan 18, 2013Jan 24, 2014Jan 30, 2015Feb 20, 2015
FIOF**Sep 14, 2005Sep 13, 2006Nov 29, 2006Sep 12, 2007Oct 28, 2009Oct 22, 2010Oct 21, 2011Oct 19, 2012Oct 18, 2013Oct 22, 2014
FAEF**Nov 18, 2013Nov 28, 2014
FIF**Aug 10, 1999Dec 01, 2000Mar 24, 2000Mar 16, 2004Nov 23, 2005Nov 29, 2006Oct 24, 2007Aug 20, 2008Oct 28, 2009Oct 22, 2010Oct 21, 2011Oct 12, 2012Oct 18, 2013Oct 22, 2014
+FIBF**Nov 25, 2003June 15, 2005May 4, 2006May 23, 2007May 21, 2008May 27, 2009May 21, 2010May 20, 2011May 18, 2012May 24, 2013May 30, 2014
+FIPEP**Dec 31, 1997Dec 14, 1998Mar 16, 2000Jul 13, 2001Mar 22, 2002Dec 23, 2003Dec 15, 2004Dec 21, 2005Dec 20, 2006Nov 14, 2007Dec 17, 2008Dec 16, 2009Dec 18, 2009Dec 16, 2010Dec 23, 2011Dec 21, 2012Jan 03, 2014Dec 26, 2014
+FIDPEFNov 11, 2009Nov 19, 2010Apr 21, 2011Jul 29, 2011Oct 21, 2011Oct 12, 2012Jul 20, 2012Apr 20, 2012Jan 27, 2012Jan 24, 2013Apr 18, 2013July 19, 2013Oct 25, 2013Jan 17, 2014Apr 17, 2014Jul 25, 2014Oct 31, 2014Jan 23, 2015
$+FIDAMar 20, 2015Dec 19, 2014Sep 19, 2014Jun 20, 2014
+FIIOFMar 20, 2015Dec 19, 2014Sep 19, 2014Jun 20, 2014Mar 21, 2014Dec 27, 2013May 24, 2013Mar 15, 2013Dec 28,2012Sep 28, 2012Jun 29, 2012Mar 30, 2012Dec 30, 2011Sep 29, 2011Jun 24, 2011
8.006.001.254.003.003.508.008.003.003.004.003.002.003.003.002.00
2.503.003.003.000.501.000.700.700.701.00
1.251.25
4.006.006.002.003.001.502.502.500.302.001.501.002.002.00
1.502.002.503.003.002.003.003.002.002.001.50
1.201.201.201.201.001.20
1.2000 1.12211.5000 1.39692.0000 1.86252.5000 2.32681.2000 1.11691.2000 1.11691.2000 1.11691.2999 1.21151.2500 1.07131.0000 0.85710.8000 0.76610.6533 0.6058
3.00003.00000.50000.50000.50000.50000.50000.50000.50000.50000.50000.50000.50000.7500
0.5845 0.55970.5845 0.55970.5444 0.50490.5444 0.5049
0.1633 0.15150.1633 0.15150.1714 0.16420.1753 0.1679
0.1633 0.15150.1633 0.15150.1753 0.16790.1753 0.16790.2338 0.22390.2727 0.26120.1970 0.16790.1629 0.13960.176 0.1510.198 0.169
0.1982 0.16980.1982 0.16980.2202 0.18880.2202 0.18880.2202 0.1888
31.02.19.8211.4324.0127.2538.0139.43
46.892220.668133.052334.033430.311132.252731.189647.244126.6372
15.9618.8818.82
17.855613.609916.520512.843413.312813.029019.0195
15.137214.7828
39.5964.0037.5712.6720.2625.61
21.476516.085216.547822.287818.274717.644423.913425.8828
13.9917.7724.26
24.637024.925020.755621.951420.664617.084718.037019.3792
11.3111.4612.4112.0911.7215.8116.2717.74
18.801720.451913.749015.880914.458715.891814.257314.995914.470917.7554
35.516136.493634.348833.582732.459332.795332.625532.914032.795335.115833.599133.340133.502634.027934.622537.343438.976040.4486
11.571111.452211.226511.2912
11.133511.069910.935510.928110.898311.009910.924010.750310.727610.732110.643010.592210.644610.656410.6385
0.3448 0.31970.1982 0.57070.6132 0.57070.8234 0.76630.2631 0.2450
0.3811 0.35340.3702 0.35450.3117 0.2985 0.2727 0.26120.3083 0.26420.3083 0.26420.3083 0.26420.3083 0.26430.3074 0.2865
0.0726 0.06730.0726 0.06730.0726 0.0673
0.1996 0.18510.1996 0.18510.1948 0.1866
0.0544 0.05050.0544 0.05050.0544 0.0505
0.1691 0.15680.1800 0.16690.1753 0.1679
0.0653 0.06060.0653 0.06060.0653 0.0606
0.1996 0.18510.1924 0.17840.1948 0.1866
0.1706 0.15820.1706 0.15820.1714 0.1642
0.1669 0.15480.1669 0.15480.1714 0.1642
0.0472 0.04380.0472 0.04380.0472 0.0438
0.1597 0.14810.1597 0.14810.1714 0.1642
5.8069 5.38515.8069 5.38515.8069 5.3851
17.4208 16.155417.0578 15.818817.5336 16.7923
5.8069 5.38515.8069 5.38515.8069 5.3851
0.1633 0.15150.1633 0.15150.1714 0.1642
0.1343 0.12450.1270 0.11780.1169 0.1119
2.359 2.1877
1.6332 1.5146
0.9073 0.8414
0.1996 0.18510.1996 0.1851
0.1815 0.16830.1815 0.1683
17.111812.603710.820411.059310.6028
14.223913.777213.372
13.090213.119912.925612.484212.192411.9269
15.864515.873
15.8806
13.771413.65
13.3937
10.534810.529910.5317
10.530310.531510.5107
14.428114.487614.4464
14.057413.735213.3303
11.733211.578110.9792
11.789911.000710.5725
10.225310.220310.2212
11.254411.239111.2043
1213.42751213.21591214.4228
1259.71251250.69021232.6599
1276.73501275.74561276.1693
11.210411.154911.0188
10.630610.570510.3943
32.8319
25.3082
15.9616
14.690414.572
13.785613.6363
+FIIBA(Annual Dividend)•Mar 20, 2015Mar 30, 2012Mar 26, 2009Mar 28, 2008Mar 28, 2007(Half Yearly Dividend)•Mar 20, 2015Sep 19, 2014Mar 21, 2014Sep 27, 2013Mar 15, 2013Sep 28, 2012Mar 30, 2012Sep 29, 2011Mar 28, 2011
#(Monthly Dividend)Mar 20, 2015Feb 20, 2015Jan 16, 2015
$(Quarterly Plan)Mar 20, 2015Dec 19, 2014Sep 19, 2014
+FILDF
#(Monthly Dividend)Mar 20, 2015Feb 20, 2015Jan 16, 2015(Quarterly Dividend)$
Mar 20, 2015Dec 19, 2014Sep 19, 2014
+FIMIP(Monthly Dividend)
#
Mar 20, 2015Feb 20, 2015Jan 16, 2015(Quarterly Dividend)$
Mar 20, 2015Dec 19, 2014Sep 19, 2014
$+FIGSF (Composite Plan)Mar 20, 2015Dec 19, 2014Sep 19, 2014
$+FIGSF (LT-Quarterly)Mar 20, 2015Dec 19, 2014Sep 19, 2014
$+FISPF (Monthly)Mar 20, 2015Feb 20, 2015Jan 16, 2015
$+FISPF (Quarterly)Mar 20, 2015Dec 19, 2014Sep 19, 2014
+FISTIP
#(Monthly Dividend)Mar 20, 2015Feb 20, 2015Jan 16, 2015
$(Quarterly Dividend)Mar 20, 2015Dec 19, 2014Sep 19, 2014(Institutional Monthly Dividend)Mar 20, 2015Feb 20, 2015Jan 16, 2015
+FICBOFMar 20, 2015Dec19, 2014Sep19, 2014FIBPDFMar 20, 2015Dec 19, 2014Sep 19, 2014FILSF (20s Plan)Oct 31, 2014FILSF (30s Plan)Oct 31, 2014FILSF (40s Plan)Oct 31, 2014FILSF (50s Plus Floating Rate Plan)
Mar 20, 2015Dec 19, 2014FILSF (50s Plus Plan)Mar 20, 2015Dec 19, 2014
Dividend on face value per unit : FISTIP - `1000 ; others - `10
Fund Managers Industry Experience Name FRANKLIN EQUITY Anand Radhakrishnan Anil Prabhudas Janakiraman Roshi Jain Murali Yerram Anand Vasudevan Neeraj Gaurh TEMPLETON EQUITY Chetan Sehgal Vikas Chiranewal FIXED INCOME Santosh Kamath Kunal Agrawal Sumit Gupta Sachin Desai Umesh Sharma Pallab Roy
Industry experience
19 years24 years16 years13 years4 years
21 years11 years
22 years11 years
19 years11 years10 years17 years14 years13 years
Franklin Templeton Investmentswww.franklintempletonindia.com
Record DateRate per unit (`)
Individual /HUF and OthersRecord Date
NAV*(`)
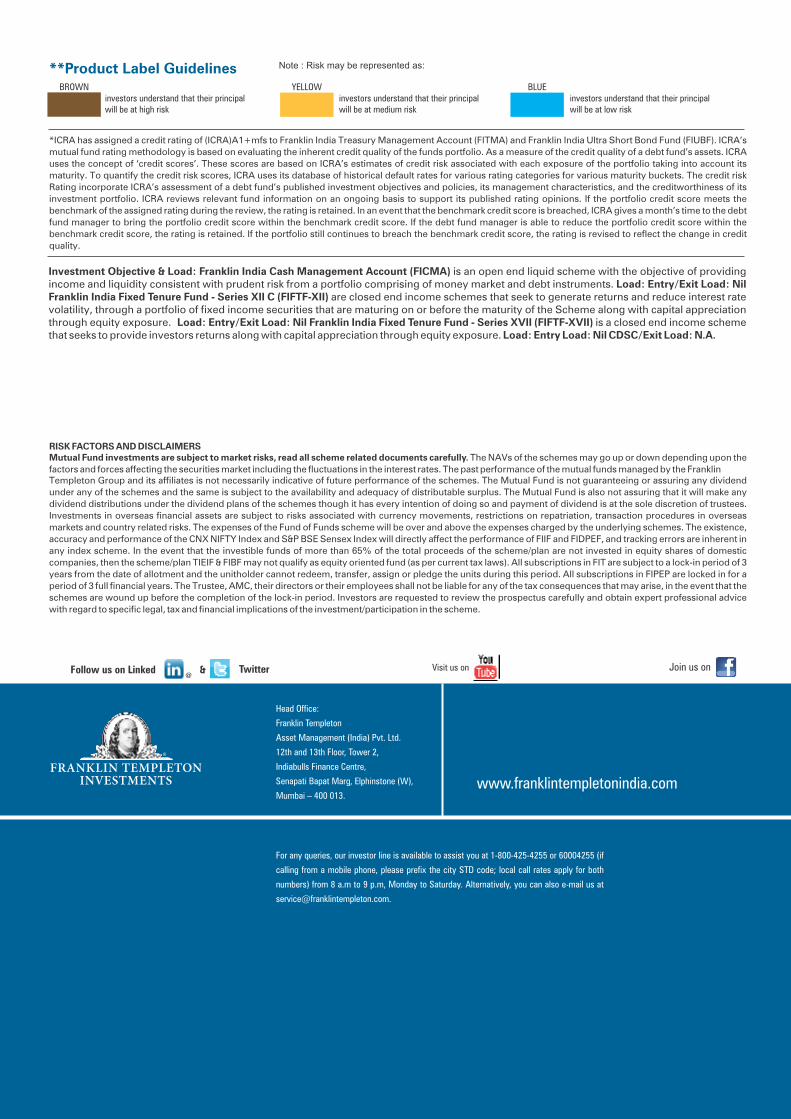
Investment Objective & Load: Franklin India Cash Management Account (FICMA) is an open end liquid scheme with the objective of providing income and liquidity consistent with prudent risk from a portfolio comprising of money market and debt instruments. Load: Entry/Exit Load: Nil Franklin India Fixed Tenure Fund - Series XII C (FIFTF-XII) are closed end income schemes that seek to generate returns and reduce interest rate volatility, through a portfolio of fixed income securities that are maturing on or before the maturity of the Scheme along with capital appreciation through equity exposure. Load: Entry/Exit Load: Nil Franklin India Fixed Tenure Fund - Series XVII (FIFTF-XVII) is a closed end income scheme that seeks to provide investors returns along with capital appreciation through equity exposure. Load: Entry Load: Nil CDSC/Exit Load: N.A.
**Product Label Guidelines
investors understand that their principalwill be at high risk
BROWN YELLOW BLUEinvestors understand that their principalwill be at medium risk
*ICRA has assigned a credit rating of (ICRA)A1+mfs to Franklin India Treasury Management Account (FITMA) and Franklin India Ultra Short Bond Fund (FIUBF). ICRA’s
mutual fund rating methodology is based on evaluating the inherent credit quality of the funds portfolio. As a measure of the credit quality of a debt fund’s assets. ICRA
uses the concept of ‘credit scores’. These scores are based on ICRA’s estimates of credit risk associated with each exposure of the portfolio taking into account its
maturity. To quantify the credit risk scores, ICRA uses its database of historical default rates for various rating categories for various maturity buckets. The credit risk
Rating incorporate ICRA’s assessment of a debt fund’s published investment objectives and policies, its management characteristics, and the creditworthiness of its
investment portfolio. ICRA reviews relevant fund information on an ongoing basis to support its published rating opinions. If the portfolio credit score meets the
benchmark of the assigned rating during the review, the rating is retained. In an event that the benchmark credit score is breached, ICRA gives a month’s time to the debt
fund manager to bring the portfolio credit score within the benchmark credit score. If the debt fund manager is able to reduce the portfolio credit score within the
benchmark credit score, the rating is retained. If the portfolio still continues to breach the benchmark credit score, the rating is revised to reflect the change in credit
quality.
RISK FACTORS AND DISCLAIMERSMutual Fund investments are subject to market risks, read all scheme related documents carefully. The NAVs of the schemes may go up or down depending upon the
factors and forces affecting the securities market including the fluctuations in the interest rates. The past performance of the mutual funds managed by the FranklinTempleton Group and its affiliates is not necessarily indicative of future performance of the schemes. The Mutual Fund is not guaranteeing or assuring any dividend
under any of the schemes and the same is subject to the availability and adequacy of distributable surplus. The Mutual Fund is also not assuring that it will make any
dividend distributions under the dividend plans of the schemes though it has every intention of doing so and payment of dividend is at the sole discretion of trustees.
Investments in overseas financial assets are subject to risks associated with currency movements, restrictions on repatriation, transaction procedures in overseas
markets and country related risks. The expenses of the Fund of Funds scheme will be over and above the expenses charged by the underlying schemes. The existence,
accuracy and performance of the CNX NIFTY Index and S&P BSE Sensex Index will directly affect the performance of FIIF and FIDPEF, and tracking errors are inherent in
any index scheme. In the event that the investible funds of more than 65% of the total proceeds of the scheme/plan are not invested in equity shares of domestic
companies, then the scheme/plan TIEIF & FIBF may not qualify as equity oriented fund (as per current tax laws). All subscriptions in FIT are subject to a lock-in period of 3
years from the date of allotment and the unitholder cannot redeem, transfer, assign or pledge the units during this period. All subscriptions in FIPEP are locked in for a
period of 3 full financial years. The Trustee, AMC, their directors or their employees shall not be liable for any of the tax consequences that may arise, in the event that the
schemes are wound up before the completion of the lock-in period. Investors are requested to review the prospectus carefully and obtain expert professional advice
with regard to specific legal, tax and financial implications of the investment/participation in the scheme.
Join us onVisit us onTwitterFollow us on Linked@
Head Office:
Franklin Templeton
Asset Management (India) Pvt. Ltd.
12th and 13th Floor, Tower 2,
Indiabulls Finance Centre,
Senapati Bapat Marg, Elphinstone (W),
Mumbai – 400 013.www.franklintempletonindia.com
For any queries, our investor line is available to assist you at 1-800-425-4255 or 60004255 (if
calling from a mobile phone, please prefix the city STD code; local call rates apply for both
numbers) from 8 a.m to 9 p.m, Monday to Saturday. Alternatively, you can also e-mail us at
investors understand that their principalwill be at low risk
&
Note : Risk may be represented as:


