+ All Categories
Home > Documents > FTIR Analysis for Quantification of Fatty Acid Methyl …€”Biodiesel was produced by...

FTIR Analysis for Quantification of Fatty Acid Methyl …€”Biodiesel was produced by...

Date post: 10-Apr-2018
Category:
Upload: dotuong
View: 218 times
Download: 3 times
Share this document with a friend
6
AbstractBiodiesel was produced by microwave-assisted transesterification of soybean oil with methanol as esterifying agent and sodium methoxide as catalyst. Fourier transform infrared spectroscopy was employed as a fast and reliable analytical technique for the quantification of fatty acid methyl ester content in the produced biodiesel. The quantification was done with the use of a partial least squares model developed based on the infrared spectra obtained. It was shown that microwave irradiation is capable of reducing the reaction time when compared to conventional mechanically stirred reactors used for biodiesel production. In addition, quantification of fatty acid methyl ester content in biodiesel by Fourier transform infrared spectroscopy coupled to multivariate statistics was demonstrated feasible. Index TermsBiodiesel, microwave, FTIR. I. INTRODUCTION The transesterification of vegetable oils in batch processes is the most commonly used technology for biodiesel production, in which a short chain alcohol reacts with the oil in a stirred tank to produce the alkyl esters of fatty acids (biodiesel), with a basic homogeneous catalyst being used to accelerate the reaction [1]. One of the major advances in technology for the biodiesel production of recent times is the employment of microwave-irradiated reactors for the transesterification of oils, in which the reaction times are significantly reduced when compared to the conventional processes [2]. The effects of microwave irradiation on the transesterification reactions were studied theoretically and experimentally by Asakuma et al. [3], where triolein was used as representative of the triglyceride class in oil. It was concluded that it is not only thermal effects that improve the reaction rates but also modifications that occur in the stereochemistry of triglycerides molecules under irradiation. It was theoretically demonstrated the a planar triolein was formed under microwave irradiation which presented higher reactivity, lower dipole moment, lower activation energy and stronger vibration around the carboxyl carbon, being more Manuscript received December 4, 2014; revised March 15, 2015. This work was supported by the following Brazilian Goverment Agency: FAPEMIG (Grant # CEX - APQ-04168-10 and PPM-00505-13). Sabrina N. Rabelo, Leandro S. Oliveira, and Adriana S. Franca are with DEMEC, Universidade Federal de Minas Gerais, Av. Antônio Carlos 6627, Belo Horizonte, MG, 31270-901, Brazil (e-mail: [email protected], [email protected], [email protected]). Vany P. Ferraz is with the Departamento de Química, Universidade Federal de Minas Gerais, Av. Antônio Carlos 6627, Belo Horizonte, MG, 31270-901, Brazil (e-mail: [email protected]). reactive than triolein with a higher dipole moment. Microwave assisted transesterification of Pongamia pinnata seed oil was carried out by Kumar et al. [4] using methanol and the catalysts sodium hydroxide and potassium hydroxide. The experiments were carried out at 6:1 alcohol/oil molar ratio and 60 o C reaction temperature. A significant reduction in reaction time for microwave induced transesterification was observed when compared to conventional heating. Tippayawong and Sittisun [5] studied a biodiesel production process from jatropha oil in a continuous flow with microwave heating, using sodium methoxide as a catalyst and with a microwave power of 800 W. Irradiation time was varied between 1040 s and the oil-to-methanol molar ratio was varied from 1:3 to 1:9 with increments of 3 regarding the number of moles of alcohol. 96.5 % conversion of oil to biodiesel was obtained in 30 s using an oil-to-methanol molar ratio of 1:6 and 1% catalyst. Lin et al. [6] studied the transesterification of palm oil in a microwave-irradiated reactor. The results indicated that the palm methyl ester yield first increased along with the amount of catalyst, reaction time, methanol-to-oil molar ratio, and reaction power, and then decreased as these parameters rose above certain levels. The best methyl ester yield was 99.5% with methyl ester content of 99.8% at 0.75 wt % catalyst, a methanol-to-oil molar ratio of 6, reaction time of 3 min, and microwave power of 750 W. Other ongoing advances in the area of biodiesel are the developments of fast and reliable analytical methodologies for the determination of Fatty Acids Methyl Esters (FAME) concentrations in biodiesel. A plethora of analytical methodologies was developed for the analysis of biodiesel [7]-[11], with gas chromatography (GC) being the most commonly adopted technique as standard for the determination of FAME content in biodiesel by regulatory and monitoring agencies in the majority of countries [9]. However, chromatographic techniques, such as GC and high performance liquid chromatography, are time-consuming expensive techniques that demand qualified personnel and sample preparation for operation and the development of fast and reliable analytical techniques, that require little or no sample preparation at all for FAME quantification in biodiesel and its blends with fossil fuel, have become the major focus of several recent research works. Spectroscopic techniques such as Fourier Transform Infrared (FTIR) and near infrared (NIR) have gained special attention in recent years for they are fast analytical techniques that require no sample preparation for the analysis of biodiesel [11]. Partial least square regression (PLS) and artificial neural FTIR Analysis for Quantification of Fatty Acid Methyl Esters in Biodiesel Produced by Microwave-Assisted Transesterification Sabrina N. Rabelo, Vany P. Ferraz, Leandro S. Oliveira, and Adriana S. Franca International Journal of Environmental Science and Development, Vol. 6, No. 12, December 2015 964 DOI: 10.7763/IJESD.2015.V6.730
Transcript

Abstract—Biodiesel was produced by microwave-assisted

transesterification of soybean oil with methanol as esterifying

agent and sodium methoxide as catalyst. Fourier transform

infrared spectroscopy was employed as a fast and reliable

analytical technique for the quantification of fatty acid methyl

ester content in the produced biodiesel. The quantification was

done with the use of a partial least squares model developed

based on the infrared spectra obtained. It was shown that

microwave irradiation is capable of reducing the reaction time

when compared to conventional mechanically stirred reactors

used for biodiesel production. In addition, quantification of fatty

acid methyl ester content in biodiesel by Fourier transform

infrared spectroscopy coupled to multivariate statistics was

demonstrated feasible.

Index Terms—Biodiesel, microwave, FTIR.

I. INTRODUCTION

The transesterification of vegetable oils in batch processes

is the most commonly used technology for biodiesel

production, in which a short chain alcohol reacts with the oil

in a stirred tank to produce the alkyl esters of fatty acids

(biodiesel), with a basic homogeneous catalyst being used to

accelerate the reaction [1]. One of the major advances in

technology for the biodiesel production of recent times is the

employment of microwave-irradiated reactors for the

transesterification of oils, in which the reaction times are

significantly reduced when compared to the conventional

processes [2]. The effects of microwave irradiation on the

transesterification reactions were studied theoretically and

experimentally by Asakuma et al. [3], where triolein was used

as representative of the triglyceride class in oil. It was

concluded that it is not only thermal effects that improve the

reaction rates but also modifications that occur in the

stereochemistry of triglycerides molecules under irradiation.

It was theoretically demonstrated the a planar triolein was

formed under microwave irradiation which presented higher

reactivity, lower dipole moment, lower activation energy and

stronger vibration around the carboxyl carbon, being more

Manuscript received December 4, 2014; revised March 15, 2015. This

work was supported by the following Brazilian Goverment Agency:

FAPEMIG (Grant # CEX - APQ-04168-10 and PPM-00505-13).

Sabrina N. Rabelo, Leandro S. Oliveira, and Adriana S. Franca are with

DEMEC, Universidade Federal de Minas Gerais, Av. Antônio Carlos 6627,

Belo Horizonte, MG, 31270-901, Brazil (e-mail:

[email protected], [email protected],

[email protected]).

Vany P. Ferraz is with the Departamento de Química, Universidade

Federal de Minas Gerais, Av. Antônio Carlos 6627, Belo Horizonte, MG,

31270-901, Brazil (e-mail: [email protected]).

reactive than triolein with a higher dipole moment.

Microwave assisted transesterification of Pongamia

pinnata seed oil was carried out by Kumar et al. [4] using

methanol and the catalysts sodium hydroxide and potassium

hydroxide. The experiments were carried out at 6:1

alcohol/oil molar ratio and 60oC reaction temperature. A

significant reduction in reaction time for microwave induced

transesterification was observed when compared to

conventional heating. Tippayawong and Sittisun [5] studied a

biodiesel production process from jatropha oil in a continuous

flow with microwave heating, using sodium methoxide as a

catalyst and with a microwave power of 800 W. Irradiation

time was varied between 10–40 s and the oil-to-methanol

molar ratio was varied from 1:3 to 1:9 with increments of 3

regarding the number of moles of alcohol. 96.5 % conversion

of oil to biodiesel was obtained in 30 s using an

oil-to-methanol molar ratio of 1:6 and 1% catalyst. Lin et al.

[6] studied the transesterification of palm oil in a

microwave-irradiated reactor. The results indicated that the

palm methyl ester yield first increased along with the amount

of catalyst, reaction time, methanol-to-oil molar ratio, and

reaction power, and then decreased as these parameters rose

above certain levels. The best methyl ester yield was 99.5%

with methyl ester content of 99.8% at 0.75 wt % catalyst, a

methanol-to-oil molar ratio of 6, reaction time of 3 min, and

microwave power of 750 W.

Other ongoing advances in the area of biodiesel are the

developments of fast and reliable analytical methodologies

for the determination of Fatty Acids Methyl Esters (FAME)

concentrations in biodiesel. A plethora of analytical

methodologies was developed for the analysis of biodiesel

[7]-[11], with gas chromatography (GC) being the most

commonly adopted technique as standard for the

determination of FAME content in biodiesel by regulatory

and monitoring agencies in the majority of countries [9].

However, chromatographic techniques, such as GC and high

performance liquid chromatography, are time-consuming

expensive techniques that demand qualified personnel and

sample preparation for operation and the development of fast

and reliable analytical techniques, that require little or no

sample preparation at all for FAME quantification in

biodiesel and its blends with fossil fuel, have become the

major focus of several recent research works. Spectroscopic

techniques such as Fourier Transform Infrared (FTIR) and

near infrared (NIR) have gained special attention in recent

years for they are fast analytical techniques that require no

sample preparation for the analysis of biodiesel [11].

Partial least square regression (PLS) and artificial neural

FTIR Analysis for Quantification of Fatty Acid Methyl

Esters in Biodiesel Produced by Microwave-Assisted

Transesterification

Sabrina N. Rabelo, Vany P. Ferraz, Leandro S. Oliveira, and Adriana S. Franca

International Journal of Environmental Science and Development, Vol. 6, No. 12, December 2015

964DOI: 10.7763/IJESD.2015.V6.730

network (ANN) combined to attenuated total reflection

Fourier Transform Infrared (ATR-FTIR) and NIR

spectroscopies were used by Oliveira et al. [12] to design

calibration models for the determination of methyl ester

content in biodiesel blends with fossil diesel. Methyl esters

were obtained by the methanolysis of soybean, babassu,

dende, and soybean used frying oils. The PLS results have

shown that the obtained models were suitable for the

determination of diesel–biodiesel blends composed of methyl

esters derived from different vegetable oils. Ferrão et al. [13]

used PLS, interval partial least squares (iPLS) and synergy

partial least squares (siPLS) regressions were used to

simultaneous determination of quality parameters of

biodiesel/diesel blends. Biodiesel amount, specific gravity,

sulfur content and flash point were evaluated using

spectroscopic data in the mid-infrared region obtained with an

ATR accessory. The algorithms iPLS and siPLS were able to

select the most adequate spectral region for each property

studied. For all the properties studied, the siPLS algorithm

produced better models than the full-spectrum PLS, selecting

the most important bands. Mueller et al. [14] employed

ATR-FTIR together with multivariate statistical analysis to

identify vegetable oils used as raw material for biodiesel

production. The vegetable oils canola, cotton, corn, palm,

sunflower and soybean were used to produce biodiesel

batches. For the multivariate analysis, principal component

analysis (PCA), hierarchical cluster analysis (HCA), interval

principal component analysis (iPCA) and soft independent

modeling of class analogy (SIMCA) were used. The results

indicated the feasibility of identifying vegetable oils used as

raw material in the production of biodiesel by ATR-FTIR.

In view of the aforementioned, it was the aim of this work

to develop a PLS model for the quantification of FAME in

biodiesel produced by microwave-assisted transesterification

of soybean oil with methanol and catalyzed by sodium

methoxide.

II. METHODOLOGY

A. Materials

In this study, refined soybean oil was used as raw starting

material and it was purchased from a local vendor (Belo

Horizonte, Brazil). Its Free Fatty Acid (FFA) content was

determined by a standard titration technique and its value was

0.6 % (m/m). Laboratory grade methanol (100%, Synth,

Brazil) and sodium methoxide (30% in methanol, ISOFAR,

Brazil) were used as short chain alcohol and catalyst,

respectively.

B. Microwave Assisted Transesterification

The transesterification of the oil was carried out in a glass

reactor of 500 mL capacity in a microwave-irradiated unit

(Model Start Synth, Milestone, Italy). The system was

equipped with a reflux condenser, a magnetic stirrer bar and

an infrared feedback temperature control system. For the

transesterification under microwave heating, the catalyst

concentration was varied from 1 to 3% (w/w of oil), the

alcohol-to-oil molar ratio was varied from 3:1 to 12:1, by

increments of 3, and the reaction times studied were 1, 7 and

15 minutes. The microwave unit was programmed to reach

60oC with a microwave power of 200 W (the maximum

power output of the microwave unit is 1200 W). The reaction

was timed as soon as the system was turned on. All tests were

conducted in duplicates.

C. Separation and Purification of Biodiesel

Upon reaching the desired time, the reaction was stopped

by immediately immersing the glass reactor in an ice bath.

Following the immersion in the ice bath, the mixture was

transferred to a separating funnel and left to rest over night for

the gravitational separation of the fatty acid methyl esters

(FAME) and glycerol. After separation of the mixture in an

upper layer of biodiesel and a lower glycerol layer, the upper

layer (FAME) was collected for further purification. The

adsorbent Amberlite BD10DRY was added to the FAME

fraction (10% weight in relation to the weight of the FAME)

and put in an orbital shaker at 200 rpm for 2 hours to remove

the reminiscent water and free glycerin present in that phase.

Afterwards, the purified FAME was subjected to a rotary

evaporation to remove the methanol.

D. Analytical Methods

The purified FAME were analyzed by Attenuated Total

Reflectance Fourier Transform Infrared (ATR-FTIR) and gas

chromatography (GC). A Shimadzu IRAffinity-1 FTIR

Spectrophotometer (Shimadzu, Japan) with a DLATGS

(Deuterated Triglycine Sulfate Doped with L-Alanine)

detector was used in the ATR-FTIR measurements that were

performed in dry atmosphere (18 ± 0.5°C). A horizontal ATR

sampling accessory (Shimadzu DRS8000A) equipped with

ZnSe cell was employed. Approximately 22 mg of the FAME

samples were placed in the sampling accessory obtaining the

best contact with the crystal. The empty accessory was used to

obtain the background spectrum. The approximate total time

required for spectral collection was 5 min. All spectra were

recorded within a range of 4000-600 cm−1

with a 4 cm−1

resolution and Happ-Genzel appodization. Each spectrum

was calculated as the average of 20 scans and subjected to

background subtraction. Analyses were carried out in

triplicates and the average of the three were used to construct

the models.

Gas chromatographic analyses were performed in

accordance with EU norm EN 14103, using a GC–FID

HP7820A apparatus (Agilent Technologies, USA) equipped

with an autosampler (Agilent 7386B series) and the data

acquisition software EZChrom Elite Compact (Agilent

Technologies, USA). Separations were accomplished using a

15-m long HP-INNOWAX capillary column, (0.25 mm I.D.

and 0.25 m film thicknesses) at a constant hydrogen flow

rate of 3 mL min−1

. Samples (1 L) were injected in a split

ratio of 1:50 with an injector temperature of 250oC. The

temperature program of the oven started with an initial

temperature of 120ºC and was followed by an increase in

temperature up to 220ºC at a rate of 7ºC/min for 10 minutes.

E. Multivariate Statistical Analysis

For the multivariate statistical analyses, a methyl oleate

standard (Sigma-Aldrich, Brazil) was used in mixtures with

the refined soybean oil in a way to cover the whole range of

ester conversion, as presented in Table I.

International Journal of Environmental Science and Development, Vol. 6, No. 12, December 2015

965

TABLE I: MIXTURES OF METHYL OLEATE STANDARD AND REFINED

SOYBEAN OIL USED FOR THE MULTIVARIATE STATISTICAL ANALYSES

Sample % Methyl Oleate (m/m) % Soybean Oil (m/m)

1 0% 100%

2 10% 90%

3 20% 80%

4 30% 70%

5 40% 60%

6 50% 50%

7 60% 40%

8 70% 30%

9 80% 20%

10 84% 16%

11 88% 12%

12 90% 10%

13 92% 8%

14 96% 4%

15 100% 0%

Principal Component Analysis (PCA) of all the obtained

spectra for the mixtures of methyl oleate standard and refined

soybean oil was spectra was performed to verify the capability

of the multivariate analysis approach to discriminate the

different samples with different contents of FAME. The 15

samples of mixtures were divided in 4 groups, taking as a

reference the percentage of methyl oleate in each sample: 0 to

30%; 31 to 60%; 61 to 90%; and 91 to 100%. Partial least

squares (PLS) regression analyses of the average ATR-FTIR

spectra of the samples were carried out using MATLAB

software, V. 7.13 (The MathWorks, Natick, Massachusetts,

USA) and the PLS Toolbox (Eigenvector Technologies,

Manson, USA). Cross-validation by a leave-one-out

procedure was performed during the validation step to define

the optimal number of parameters that should be kept in the

model to detect outliers. The data were pre-processed by

Standard Normal Variance (SNV) and Multiplicative Signal

Correction (MSC) [15]. In addition, mean-centering and

autoscaling methods were employed. Mean-centering method

resulted in better regression models. The set of samples was

divided into 2 groups with 30% being used for validation and

70% being used for calibration of the PLS regression model.

The model incurring minimal error was selected, that is, the

model with the lowest root mean square error of

cross-validation (RMSECV) and lowest root mean square

error of prediction (RMSEP).

III. RESULTS AND DISCUSSION

The ester concentrations for the microwave-assisted

transesterification reactions are presented in Table II, as

determined by CG analysis. It is clearly seen that the

microwave-assisted transesterification of oils is a rather

efficient process when compared to the conventional process,

which is carried out in a batch stirred tank reactor and for

which the reaction times required for the same magnitude of

ester conversion are in the range of 60 to 120 minutes [1]. For

the conditions of catalyst concentration of 3%, reaction time

of 1 minute and oil:alcohol molar ratio of 1:6, the ester

concentration reached a value of 99.0 ± 0.5 %, attesting the

efficacy of the microwave-assisted process. Only two sets of

conditions led to ester concentration values below the

European and Brazilian specifications of ester concentration

for commercialization of biodiesel that is 96.5% (m/m): (1)

Catalyst concentration of 1%, reaction time of 7 min and

oil:alcohol molar ratio of 1:6; and (2) catalyst concentration

of 3%, reaction time of 7 min and oil:alcohol molar ratio of

1:12. In the first case, the catalyst concentration of 1% has

proven not to be enough for the desired conversion of oil into

alkyl esters of fatty acids, even with the high intensity

microwave energy used, and, in the second case, the excessive

amount of methanol have proven to be a factor contributing to

hinder the conversion for the reaction time employed.

TABLE II: ESTER CONCENTRATIONS FOR MICROWAVE-ASSISTED TRANSESTERIFICATION OF OILS AS DETERMINED BY CG ANALYSIS

Sample* Molar Ratio (oil:alcohol) % Catalyst (m/moil) Reaction Time (min) Ester Content (% m/m)

1C 1:6 1 7 91.2 ± 0.8

2C 1:6 2 7 98.6 ± 0.3

3C 1:6 3 7 100.0 ± 0.3

1T 1:6 3 1 99.0 ± 0.5

7T 1:6 3 7 99.5 ± 0.4

15T 1:6 3 15 98.4 ± 0.7

MR 1:3 1:3 3 7 99.0 ± 0.3

MR 1:6 1:6 3 7 100.0 ± 0.2

MR 1:9 1:9 3 7 98.4 ± 0.6

MR 1:12 1:12 3 7 95.7 ± 0.6

*C means catalyst concentration was varied and reaction time and oil:alcohol molar ratio remained constant at 7 min and 1:6, respectively; T means reaction

time was varied and catalyst concentration and oil:alcohol molar ratio remained constant at 3% and 1:6, respectively; and MR means oil:alcohol ratio was

varied and catalyst concentration and reaction time remained constant at 3% and 7 min, respectively.

Fig. 1. ATR-FTIR spectra for a sample of refined soybean oil and of FAME of the same oil.

International Journal of Environmental Science and Development, Vol. 6, No. 12, December 2015

966

The ATR-FTIR spectra for a sample of the refined soybean

oil and for the FAME obtained with the conditions of catalyst

concentration of 3%, reaction time of 1 minute and oil:alcohol

molar ratio of 1:6 are presented in Fig. 1. Rather subtle

differences can be observed between the spectra, since the

product of the transesterification process (FAME) is

chemically similar to its precursor (the refined oil). In the

region from 1800-1700 cm-1

, it can be observed peaks that can

be attributed to the stretching of C=O, typical of esters, and

thus are common in both FAME and refined oil spectra [16].

The main spectrum region that allows for chemical

discrimination between soybean oil and its respective FAME

is in the range 1500-900 cm-1

, known as “fingerprint” region.

The peak at 1446 cm-1

correspond to the asymmetric

stretching of CH3 present in the biodiesel spectrum and

absent in the refined oil spectrum (Soares et al., 2008). The

peak at 1377 cm-1

can be attributed to the glycerol group

OCH2 (mono-, di- and triglycerides), which is present in the

refined oil spectrum and should be absent in the FAME

spectrum [17]. The stretching of OCH3, represented by the

absorbance at 1196 cm-1

, is typical of biodiesel. Another

region that allows for discrimination of FAME and refined oil

is 1075–1100 cm-1

, covering the asymmetric axial stretching

of OCH2Ce–CH2OH, with respective peaks present only

in the refined oil spectrum.

-0.15 -0.1 -0.05 0 0.05 0.1 0.15 0.2-0.1

-0.08

-0.06

-0.04

-0.02

0

0.02

0.04

0.06

0.08

Scores on PC 1 (73.44%)

Score

s o

n P

C 2

(18.0

2%

)

0%

10%

20%

30%

40%

50% 60%

70%

80%

84%

88%

90% 92%

96%

100%

(a)

2 4 6 8 10 12 14

-0.2

-0.15

-0.1

-0.05

0

0.05

0.1

0.15

0.2

Sample

Score

s o

n P

C 1

(73.4

4%

)

0%

10%

20% 30% 40% 50%

60%

70% 80%

84%

88% 90% 92% 96%

100%

(b)

Fig. 2. Plots of (a) PC 1 PC 2 scores and (b) PC1 scores samples: 0 to

30%, 31 to 60%, 61 to 90%, 91 to 100% FAME (represented by

methyl oleate standard).

PCA of all the spectra for the mixtures of methyl oleate

standard and refined soybean oil spectra was performed to

verify the capability of the multivariate analysis approach to

discriminate the different samples with different contents of

FAME. The scatter plots obtained by PCA are displayed in

Fig. 2(a). A clear separation between categories can be

observed, with highest concentrations of FAME (ranging

from 90 to 100%) being clustered altogether in the negative

quadrants of PC1 and PC2. PC1 and PC2 together explain

91.46% of the total variance amongst the samples. From the

scores, it is observed there is a tendency of showing the

evolution of the concentration as it increases from 0 to 100%

(Fig. 2(a)). Fig. 2(b) presents the PC1 score plotted against

the samples, clearly demonstrating the evolution of the FAME

concentration as it increases from 0 to 100%, as it happens

during the transesterification reaction of the oil. Results from

the principal components analysis indicate that the obtained

spectra could provide enough information to develop

quantification models for the different FAME concentrations.

Evaluation of the PC1 loadings plot (not shown) indicated

that the spectral range that presented the highest influence on

sample grouping was1800600 cm-1

. Group separation was

not improved by taking derivatives of the spectra.

Partial Least-Squares (PLS) regression was used to built

FAME concentration quantification models for both the

whole mid-infrared spectrum and the narrow region ranging

from1800-600 cm-1

that contributed most to the separation of

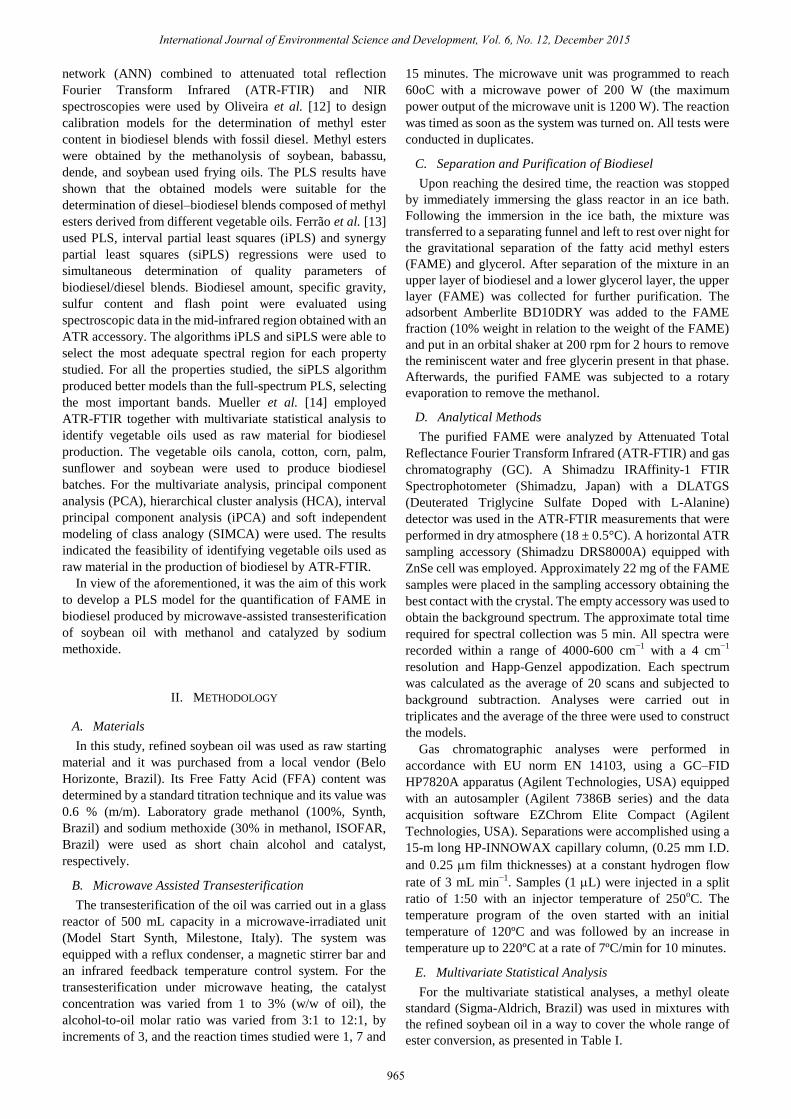
distinct FAME concentration group in the PCA. Table III

shows the results of RMSECV, RMSEP, number of latent

variables, the Calibration Correlation Coefficient Rc, and the

Validation Correlation Coefficient Rv for both the Standard

Normal Variance (SNV) and Multiplicative Signal Correction

(MSC) pre-treatments used in the full-spectrum PLS model

for the quantification of FAME in biodiesel.

TABLE III: RESULTS FOR PLS MODEL FOR FAME QUANTIFICATION IN

BIODIESEL USING MEAN-CENTERED DATA

Type of Pre-Processing

(whole spectrum)

RMSEC (%) RMSECV (%) RMSEP (%) LV Rc Rv

MC/SNV 2.07484 4.31705 4.43876 3 0.996 0.969

MC/SNV 0.57031 3.85306 3.75391 5 1.000 0.977

MC/MSC 2.97777 4.57190 6.12287 2 0.992 0.992

MC/MSC 1.01879 5.83188 4.42910 5 0.999 0.968

MC: Mean-Centered; SNV: Standard Normal Variance; MSC:

Multiplicative Signal Correction; VL: Latent Variables; Rc: Calibration

Correlation Coefficient; Rv: Validation Correlation Coefficient.

The best model was selected based on RMSEC and

RMSEP. The lower their value the better the predictive

capacity of the model. From Table III, it can be observed that

the spectra subjected to the pre-treatment SNV, with

mean-centered data, presented better results (i.e., lowest

RMSEC and RMSEP) when compared to the spectra

subjected to MSC for the same number of latent variables.

The model based on the pre-treatment SNV with 5 latent

variables (total of 99.91% of the spectral information) was the

best model obtained for the quantification of FAME in

biodiesel.

Based on the regression coefficients Rc and Rv of the

model obtained for the pre-treatments SNV/Mean-Centered

data and 5 LVs, the spectral region that presented the most

influence on the discrimination of distinct FAME

concentration groups was in the range of 1800600 cm-1.

Thus, this spectral region was used to build another PLS

quantification model and the results for its parameters are

presented in Table IV. In general, the models obtained for the

International Journal of Environmental Science and Development, Vol. 6, No. 12, December 2015

967

spectral region of 1800600 cm-1

were better than those

obtained for the full spectrum. Again, the best results (i.e.,

lowest RMSEC and RMSEP) were obtained using the

pre-treatments SNV/Mean-Centered data.

Fig. 3 shows a strong correlation between reference

(determined by GC method) and predicted values for both

calibration and validation sets, using the best PLS model

obtained that was for the spectral region of 1800600 cm-1

with the pre-treatments SNV and mean-centered data and 3

latent variables (Table IV).

TABLE IV: RESULTS FOR PLS MODEL FOR FAME QUANTIFICATION IN

BIODIESEL USING MEAN-CENTERED DATA OF THE SPECTRAL REGION

1800600 CM-1

MC: Mean-Centered; SNV: Standard Normal Variance; MSC:

Multiplicative Signal Correction; VL: Latent Variables; Rc: Calibration

Correlation Coefficient; Rv: Validation Correlation Coefficient.

0 10 20 30 40 50 60 70 80 90 100-20

0

20

40

60

80

100

120

GC (%) - Methyl Ester

FT

IR (

%)

- M

eth

yl E

ste

r

Fig. 3. FAME content (% m/m) vs. predicted values by cross-validation for

the PLS model obtained for the spectral region of 1800600 cm-1 with the

pre-treatments SNV and mean-centered data and 3 latent variables:

calibration samples and validation samples.

Although some of the predicted values presented a little

discrepancy regarding the reference values, the obtained

model can be considered rather good for the quantification of

FAME in biodiesel produced by microwave-assisted

transesterification reactions. A more robust model can be

built if non-converted mono and diglycerides are to be

considered in the samples used for both calibration and

validation. Nevertheless, considering that ATR-FTIR does

not require sample preparation for the analysis, as opposed to

the GC reference method adopt by most of the official

methods from regulating and monitoring agencies in the

world, it can be concluded that it is a rather promising

candidate for becoming a reference analytical technique.

REFERENCES

[1] B. Bharathiraja, M. Chakravarthy, R. R. Kumar, D. Yuvaraj, J.

Jayamuthunagai, R. P. Kumar, and S. Palani, “Biodiesel production

using chemical and biological methods – A review of process, catalyst,

acyl acceptor, source and process variables,” Renewable and

Sustainable Energy Reviews, vol. 38, pp. 368–382, October 2014.

[2] F. Motasemi and F. N. Ani, “A review on microwave-assisted

production of biodiesel,” Renewable and Sustainable Energy Reviews,

vol. 16, pp. 4719–4733, June 2012.

[3] Y. Asakuma, Y. Ogawa, K. Maeda, K. Fukui, and H. Kuramochi,

“Effects of microwave irradiation on triglyceride transesterification:

Experimental and theoretical studies,” Biochemical Engineering

Journal, vol. 58–59, pp. 20–24, 2011.

[4] R. Kumar, G. R. Kumar, and N. Chandrashekar, “Microwave assisted

alkali-catalyzed transesterification of Pongamia pinnata seed oil for

biodiesel production,” Bioresource Technology, vol. 102, pp.

6617–6620, 2011.

[5] N. Tippayawong and P. Sittisun, “Continuous-flow transesterification

of crude jatropha oil with microwave irradiation,” Scientia Iranica,

vol. B19, pp. 1324–1328, 2012.

[6] Y. C. Lin, K. H. Hsu, and J. F. Lin, “Rapid palm biodiesel production

assisted by a microwave system and sodium methoxide catalyst,” Fuel,

vol. 115, pp. 306–311, 2014.

[7] G. Knothe, “Analytical methods used in the production and fuel quality

assessment of biodiesel,” Transactions of the ASAE, vol. 44, pp.

193-200, 2001.

[8] M. R. Monteiro, A. R. P. Ambrozina, L. M. Lião, and A. G. Ferreira,

“Critical review on analytical methods for biodiesel characterization,”

Talanta, vol. 77, pp. 593–605, 2008.

[9] M. Yahaya, I. Demshemino, I. Nwadike, S. O’Donnell, and L. Okoro

"A review on the chromatographic analysis of biodiesel," International

Journal of Education and Research, vol. 1, pp. 1–12, August 2013.

[10] W. Zhang, “Review on analysis of biodiesel with infrared

spectroscopy,” Renewable and Sustainable Energy Reviews, vol. 16,

pp. 6048–6058, 2012.

[11] S. O’Donnell, I. Demshemino, M. Yahaya, I. Nwadike, and L. Okoro,

“A review on the spectroscopic analyses of biodiesel,” European

International Journal of Science and Technology, vol. 2, pp. 137–146,

September 2013.

[12] J. S. Oliveira, R. Montalvão, L. Daher, P. A. Z. Suarez, and J. C.

Rubim, “Determination of methyl ester contents in biodiesel blends by

FTIR-ATR and FTNIR spectroscopies,” Talanta, vol. 69, pp.

1278–1284, 2006.

[13] M. F. Ferrão, M. S. Viera, R. E. P. Pazos, D. Fachini, A. E. Gerbase,

and L. Marder, “Simultaneous determination of quality parameters of

biodiesel/diesel blends using HATR-FTIR spectra and PLS, iPLS or

siPLS regressions,” Fuel, vol. 90, pp. 701–706, 2011.

[14] D. Mueller, M. F. Ferrão, L. Marder, A. B. Costa, and R. C. S.

Schneider, “Fourier transform infrared spectroscopy (FTIR) and

multivariate analysis for identification of different vegetable oils used

in biodiesel production,” Sensors, vol. 13, pp. 4258-4271, 2013.

[15] B. M. Wise, N. B. Gallagher, R. Bro, J. M. Shaver, W. Willem, and R.

S. Koch, “PLS toolbox version 4.0 for use with Matlab™,”

Eigenvector Research, Inc., Wenatchee, USA, 2006.

[16] I. P. Soares, T. F. Rezende, R. C. Silva, E. V. R. Castro, and I. C. P.

Forte, “Multivariate calibration by variable selection for blends of raw

soybean oil/biodiesel from different sources using Fourier Transform

Infrared spectroscopy (FTIR) spectra data,” Energy Fuels, vol. 22, pp.

2079-2083, January 2008.

[17] M. A. Dube, S. Zheng, D. D. Mclean, and M. J. A. Kates, “Comparison

of attenuated total reflectance-FTIR spectroscopy and GPC for

monitoring biodiesel production,” Journal of the American Oil

Chemist Society, vol. 81, pp. 599–603, June 2004.

Sabrina N. Rabelo was born in 1987 and graduated in

chemical engineering from Centro Universitário de

Belo Horizonte (UNIBH), Belo Horizonte, Brazil, in

2012. She is currently enrolled in a Mechanical

Engineering Graduate Program at Universidade

Federal de Minas Gerais (UFMG) to obtain her master

degree.

Vany P. Ferraz was born in 1962. She graduated in

chemistry in 1987 and obtained her M.Sc. degree in

chemistry in 1991 from Universidade Federal de Minas

Gerais, Belo Horizonte, Brazil. She completed her

Ph.D. degree in separation science from Ghent

University, Belgium, in 1995.

She is currently working as an associate researcher

at the Chemistry Department from Universidade

Federal de Minas Gerais. She has published over 45

articles in international journals, 2 book chapters and has presented several

research papers at various international conferences held in Brazil and

abroad. Her research interests include gas chromatography, liquid

chromatography, mass spectrometry and others.

International Journal of Environmental Science and Development, Vol. 6, No. 12, December 2015

968

Leandro S. Oliveira was born in 1964. He graduated in

chemical engineering in 1988 and obtained his M.Sc.

degree in mechanical engineering in 1991 from

Universidade Federal de Minas Gerais, Belo Horizonte,

Brazil. He completed his Ph.D. degree in agricultural

and biological engineering from Purdue University,

USA, in 1995.

He is currently working as an associate professor at

the Department of Mechanical Engineering from Universidade Federal de

Minas Gerais and is currently the head of the Graduate Program at that

Department. Dr. Oliveira also teaches at the graduate course in food

sciences. He has published 65 articles in international journals, 11 book

chapters and has presented several research papers at various international

conferences held in Brazil and abroad. His research interests include

sustainable uses of solid residues, biofuels, sustainable materials, coffee

chemistry and others.

Adriana S. Franca was born in 1966. She graduated in

chemical engineering in 1988 and obtained her M.Sc.

degree in mechanical engineering in 1991 from

Universidade Federal de Minas Gerais, Belo Horizonte,

Brazil. She completed her Ph.D. degree in agricultural

and biological engineering from Purdue University,

USA, in 1995.

She is currently working as an associate professor at

the Department of Mechanical Engineering from Universidade Federal de

Minas Gerais and is a professor at the graduate course in food sciences. She

has published over 75 articles in international journals, 16 book chapters and

has presented several research papers at various international conferences

held in Brazil and abroad. Her research interests include sustainable uses of

agricultural residues, coffee chemistry, microwaves, FTIR and others.

International Journal of Environmental Science and Development, Vol. 6, No. 12, December 2015

969


Recommended