FTSE SET INDEX SERIES INTRODUCTION FTSE SET INDEX SERIES COMMENTARY VENDOR CODES Source: FTSE Group 1 of 22 FTSE MONTHLY REPORT - August 2012 FTSE SET INDEX SERIES Data as at: 31 August 2012 Univentures had the strongest performance in the FTSE SET All-Share Index, up 37.76 per cent, with Banpu PCL the best performing FTSE SET Large Cap Index constituent, up 12.50 per cent. Within the Thailand market, Fledgling companies had the best performance with the FTSE SET Fledgling Index up 5.69 per cent, followed by Small Cap companies seeing an increase of 5.18 per cent in August. Large Cap compliant companies were the worst performers. The FTSE SET All-Share Index had a performance of 0.87 per cent. Beverages was the best performing sector in the FTSE SET All-Share Index, up 21.57 per cent, followed by Mining companies, up 12.07 per cent. The Support Services, and Software & Computer Services sectors had the worst performance in August, down 7.14 and 6.68 per cent, respectively. The FTSE SET Large Cap Index ended the month in positive territory in August up 0.28 per cent, managing to outperform the FTSE ASEAN Index by 1.70 per cent. Pakistan was the best performing Asian market this month with the FTSE Pakistan Index seeing a rise of 2.92 per cent in August. The second best performing Asian market was Taiwan, with the FTSE TWSE Taiwan 50 Index, up 1.73 per cent. Vietnam was the worst performer, with the FTSE Vietnam Index falling 7.08 per cent. The FTSE All-World Index was up 1.40 per cent. FTSE SET Large Cap Index 1453.74 4.13 0.28% ▲ FTSE Group and the Stock Exchange of Thailand (SET) have jointly created the FTSE SET Index Series to provide investors with a comprehensive series of indices for accessing segments of Thailand’s market. The index series adopts FTSE’s global index standards such as size, free float weighting and liquidity screening, and provides a familiar tool for performance measurement, product creation and analysis, appealing to both local and international investors. As part of the FTSE SET Index Series the FTSE SET Large Cap Index is the flagship index that captures the largest, most liquid companies on the Thai market. The index is also delivered on an intra-second streaming basis, enabling investors to make trading decisions based on intra-second index quotes and respond more rapidly to immediate market events. TABLE OF CONTENTS Introduction & Index Series Overview FTSE SET Large Cap Index FTSE SET All-Share Index FTSE SET Mid Cap Index FTSE SET Small Cap Index FTSE SET Mid Small Cap Index FTSE SET Fledgling Index FTSE SET Shariah Index 1 5 9 13 15 17 19 21 1-Month Performance of the Selected FTSE Indices 1-Month THB Performance (%) 1.40 -1.42 -7.08 -2.90 -4.50 0.52 -1.26 -10.0 -5.0 - 5.0 Straits Time Index (STI) FTSE Bursa Malaysia KLCI FTSE Indonesia Index FTSE Philippines Index FTSE Vietnam Index FTSE ASEAN Index FTSE All-World Index 1-Month Performance of the FTSE SET Index Series 1-Month THB Performance (%) 3.30 5.69 0.87 3.09 5.18 2.45 0.28 - 2.0 4.0 6.0 FTSE SET Large Cap Index FTSE SET Mid Cap Index FTSE SET Small Cap Index FTSE SET Mid Small Cap Index FTSE SET All-Share Index FTSE SET Fledgling Index FTSE SET Shariah Index FEATURES Objective The indices have been designed for the creation of structured products, index tracking funds, ETFs or as performance benchmarks Universe The index series also contains the FTSE SET Large Cap Index that comprises 30 of the largest, most liquid companies listed on the SET Coverage The indices provide a comprehensive coverage of the major market segments of the Thai market, including size, sectors, and Shariah based indices Design The indices have been designed for both domestic and international investors who want to see global standards applied to the selection and maintenance of companies Investability Index constituents are free-float weighted to ensure that only the investable opportunity set is included within an index Liquidity Companies are liquidity screened to ensure that the indices are tradable (except for the FTSE SET Fledgling Index) Maintenance The indices are governed by an independent committee made up of senior investment professionals to ensure they continue to meet the needs of index Reuters <.FTFSTHL> Factset FSTHL.LOC-FTX Bloomberg FSTHL Telekurs CH4275381
Transcript
FTSE SET INDEX SERIES INTRODUCTION
FTSE SET INDEX SERIES COMMENTARY
VENDOR CODES
Source: FTSE Group 1 of 22
FTSE MONTHLY REPORT - August 2012
FTSE SET INDEX SERIES Data as at: 31 August 2012
Univentures had the strongest performance in the FTSE SET All-Share Index, up 37.76 per cent, with Banpu PCL the
best performing FTSE SET Large Cap Index constituent, up 12.50 per cent.
Within the Thailand market, Fledgling companies had the best performance with the FTSE SET Fledgling Index up
5.69 per cent, followed by Small Cap companies seeing an increase of 5.18 per cent in August. Large Cap compliant
companies were the worst performers. The FTSE SET All-Share Index had a performance of 0.87 per cent.
Beverages was the best performing
sector in the FTSE SET All-Share
Index, up 21.57 per cent, followed by
Mining companies, up 12.07 per cent.
The Support Services, and Software &
Computer Services sectors had the
worst performance in August, down
7.14 and 6.68 per cent, respectively.
The FTSE SET Large Cap Index ended the month in positive territory in August up 0.28 per cent, managing to
outperform the FTSE ASEAN Index by 1.70 per cent.
Pakistan was the best performing
Asian market this month with the FTSE
Pakistan Index seeing a rise of 2.92
per cent in August. The second best
performing Asian market was Taiwan,
with the FTSE TWSE Taiwan 50 Index,
up 1.73 per cent. Vietnam was the
worst performer, with the FTSE
Vietnam Index falling 7.08 per cent.
The FTSE All-World Index was up 1.40
per cent.
FTSE SET Large Cap Index 1453.74 4.13 0.28% ▲
FTSE Group and the Stock Exchange of Thailand (SET) have jointly created the FTSE SET Index Series to provide investors
with a comprehensive series of indices for accessing segments of Thailand’s market. The index series adopts FTSE’s global
index standards such as size, free float weighting and liquidity screening, and provides a familiar tool for performance
measurement, product creation and analysis, appealing to both local and international investors.
As part of the FTSE SET Index Series the FTSE SET Large Cap Index is the flagship index that captures the largest, most
liquid companies on the Thai market. The index is also delivered on an intra-second streaming basis, enabling investors to
make trading decisions based on intra-second index quotes and respond more rapidly to immediate market events.
COMMENTARY IN AUGUST COMMENTARY IN AUGUST COMMENTARY IN AUGUST COMMENTARY IN AUGUST COMMENTARY IN AUGUST COMMENTARY IN AUGUST
VENDOR CODES
Index Name
FTSE SET Large Cap Index
FTSE SET Mid Cap Index
FTSE SET Small Cap Index
FTSE SET Mid Small Cap Index
FTSE SET All-Share Index
FTSE SET Fledgling Index
FTSE SET Shariah Index
Source: FTSE Group 4 of 22
FTSE SET Index Series Data as at: 31 August 2012
Global markets were in positive territory in August, with the FTSE All-World Index up 1.40 per cent.
Year-to-date global markets have continued on a positive path, up 6.93 per cent.
Europe was the best performing region in August finishing the month up 3.62 per cent. Middle East &
Africa was the worst performing region, down on the month 1.18 per cent. Asian markets saw negative
performance with the FTSE Asia Pacific Index down 1.15 per cent.
Within Asia Pakistan was the best performing market in August, with the FTSE Pakistan Index up 2.92
per cent. The FTSE SET Large Cap Index had a rise of 4.13 index points on the month, seeing a
positive performance of 0.28 per cent.
The Mining sector within the FTSE SET Large Cap Index had the best performance up 12.50 per cent,
with Media sector showing the worst performance down 7.56 per cent. The best performing FTSE SET
Large Cap Index constituent was Banpu PCL showing a positive return of 12.50 per cent in August.
Within the size segments in August fledgling companies were the best performers in the FTSE SET
Index Series, up 5.69 per cent on the month with large cap companies showing the worst performance.
The FTSE SET All-Share Index had a performance of 0.87 per cent in August, with Univentures the best
performing constituent, up 37.76 per cent.
Year to date the FTSE SET Large Cap Index has the highest volatility within the FTSE SET Index Series
at 16.42 per cent. The FTSE SET Fledgling Index has the lowest volatility with 10.21 per cent. This
compares to a volatility of 25.17 and 12.42 per cent respectively for 2011. The FTSE SET All-Share
Index had a volatility of 15.29 per cent year to date, lower than 2011's 24.15 per cent.
As at the end of August, the FTSE SET Large Cap Index accounts for 77.48 per cent of the FTSE SET All-
Share Index, with the 95 constituents of the FTSE SET Small Cap Index accounting for 5.91 per cent.
The top ten constituents of the FTSE SET Large Cap Index account for 70.87 per cent of the index,
compared to 31.76 per cent of the FTSE SET Small Cap Index and 55.81 per cent of the FTSE SET All-
Share Index.
Beverages was the best performing sector in the FTSE SET All-Share Index up 21.57 per cent in August,
with Mining being the second best performer up 12.07 per cent. Support Services was the worst
performing sector followed by Software & Computer Services down 7.14 per cent and 6.68 per cent,
respectively.
With an index weighting of 37.60 per cent and 7 constituents, Financials is the largest industry in the
FTSE SET Large Cap Index, down 1.04 per cent in weighting compared to the previous month. This
compares to a weight of 37.74 per cent in the FTSE SET Mid Cap Index and 37.11 per cent in the FTSE
SET All-Share Index. Within the FTSE SET Shariah Index Financials has 12 constituents, and accounts
for 7.32 per cent.
TELEKURS
CH4275381
CH4275384
<.FTFSTHL>
REUTERS
<.FTFSTHA>
<.FTFSTHM>
CH4275385
CH4275392
FACTSETFTSE
<.FTFSTHF>
<.FTFSTSH>
<.FTFSTHS>
FSTHM
BLOOMBERG
FSTHL
FSTHS
FSTHMS
FSTHA
FSTHF
FSTSH
<.FTFSTHMS>
FSTHL
FSTHM
FSTHS
FSTHF
FSTSH-FTX
CH4275387
CH4275438
TK4647440
FSTHL.LOC-FTX
FSTHM-FTX
FSTHS-FTX
FSTHMS-FTX
FSTHA-FTX
FSTHF-FTX
FSTSH
FSTHMS
FSTHA
INDEX OVERVIEW
FTSE SET LARGE CAP INDEX FIVE-YEAR PERFORMANCE (THB PRICE RETURN) PERFORMANCE HIGHLIGHTS
● FTSE SET Large Cap Index ● FTSE SET All-Share Index
FTSE SET LARGE CAP INDEX HISTORICAL PERFORMANCE TABLE (THB PRICE RETURN)
FTSE SET Large Cap Index
FTSE SET All-Share Index
PERFORMANCE OF THE FTSE SET LARGE CAP INDEX AND SELECTED FTSE ASIA PACIFIC COUNTRY INDICES IN AUGUST (THB PRICE RETURN)
FTSE SET LARGE CAP INDEX HISTORICAL REVIEW TURNOVER
Source: FTSE Group 5 of 22
-1.56
0.52
-7.08
17.23 13.48 84.93 57.79
56.46 23.61
Div Yield
(%)
30 4,245,839 30
33,830
Rank Index Name
88.88 4.10
72.01 2.16
3,224
FTSE China 25 Index
Rank Index NameNumber
of Cons
Net Market Cap
(THBbn)
1M Perf
(%)
3.16
9.37
22.74 9.55 -48.04
1Y
(%)
-49.46
199
The FTSE SET Large Cap Index ended the
month in positive territory in August up
0.28 per cent, although underperforming
the FTSE SET All-Share Index by 0.59 per
cent.
Year to date the FTSE SET Large Cap Index
performance is up by 17.23 per cent, with
a volatility of 16.42 per cent, lower than
2011’s volatility of 25.17 per cent.
Mining had the best sector performance in
the FTSE SET Large Cap Index in August,
up 12.50 per cent.
1M Perf
(%)
5.49
5Y
(%)
3Y
(%pa)
5Y
(%pa)
2008
(%)
2009
(%)
10 FTSE Japan Index 450 63,867
FTSE Pakistan Index
0.28
5 130 2.92
76.07
38.03
13.91
3Y
(%)
Number
of Cons
Net Market Cap
(THBbn)
FTSE TWSE Taiwan 50 Index 50 11,476 1.73
18.69 3.13
5,306
-1.04
BEFORE REVIEW
7 15
FTSE Philippines Index 16
2
30
FTSE India Index 112 8,825 -0.19
6
8 FTSE Korea Index 116 19,624
December 2011
3 FTSE New Zealand Index 12 548 0.91
-1.30
FTSE Bursa Malaysia KLCI
26
FTSE SET Large Cap Index 30 4,400
30
14
Net Market Cap
(THBm)
1,010
1
30 3,745,868 30
Number of Cons
0.28
24 -
0.63
2010
(%)Index Name
1M
(%)
3M
(%)
6M
(%)
YTD
(%)
The FTSE SET Large Cap Index comprises the largest companies by full market capitalisation in the FTSE SET All-Share Index. The index is a free float adjusted
market-capitalisation weighted index representing the performance of the largest Thai blue chip companies, which pass the size, free float, and liquidity screens. The
index represents approximately 70 per cent of the SET Main Board and as at the end of August there were 30 constituents in the index.
0.87 6.47
2011
(%)
5
FTSE SET Index Series Data as at: 31 August 2012
-1.26
CUMULATIVE PERFORMANCE ANNUALISED PERFORMANCE
-2.90
25 - -4.87
AFTER REVIEW
9 Straits Times Index (STI)
-5.98
-4.50
11 FTSE ASFA Australia 200 Index
13
FTSE Vietnam Index
6,962
4
FTSE Indonesia Index
40.31 -0.66
FTSE China A50 Index 50 10,324
16
FTSE Hong Kong Index 118 16,208 0.45
12
Number of Adds
0
1
Number of Dels
0
1
Net Market Cap (THBm)
3,745,868
4,265,437
Total
2-Way Turnover (%)
0.00
2.00
2.00
Review Month
June 2012
Number of Cons
0
20
40
60
80
100
120
140
160
180
Inde
x R
ebas
ed (
31 A
ug 2
007=
100)
Note: The majority of index changes occurs at the index reviews in June and December. Review changes to the index may include constitue additions/deletions,
shares in issue and free float changes, and changes due to corporate events.
FIVE-YEAR HISTORICAL INDUSTRY BREAKDOWN (%) INDUSTRY BREAKDOWN
● Basic Materials
● Consumer Goods
● Consumer Services
● Financials
● Health Care
● Industrials
● Oil & Gas
● Technology
● Telecommunications
● Utilities
RELATIVE PERFORMANCE AGAINST FTSE SET LARGE CAP INDEX (THB PRICE RETURN)
1 MONTH 1 YEAR
FTSE SET LARGE CAP INDEX HISTORICAL VOLATILITY (THB PRICE RETURN)
● FTSE SET Large Cap Index
● FTSE SET All-Share Index
Index volatility is calculated on a rolling 180 days basis.
Source: FTSE Group 6 of 22
FTSE SET Large Cap Index Data as at: 31 August 2012
Key:
7 (37.60%)
Number of Constituents Index Weight
0
20
40
60
80
100 3
(4.60%) 3 (7.03%)
3 (7.77%)
7 (37.60%) 1
(2.73%)
3 (7.98%)
4 (21.40%)
1 (0.97%)
2 (7.26%)
3 (2.67%)
0
5
10
15
20
25
30
35
40
45
50
Vola
tilit
y (
%)
FTSE S
ET I
ndust
ry I
ndic
es
Basic Materials
Consumer Goods
Consumer Services
Financials
Health Care
Industrials
Oil & Gas
Technology
Telecommunications
Utilities 3.81
69.13
-18.42
-9.16
50.81
9.18
17.68
-3.41
-42.18
-50.0 - 50.0 100.0
Relative Performance (%)
FTSE S
ET I
ndust
ry I
ndic
es
Basic Materials
Consumer Goods
Consumer Services
Financials
Health Care
Industrials
Oil & Gas
Technology
Telecommunications
Utilities 3.31
7.74
5.30
1.81
0.62
4.00
-3.33
-0.63
-2.06
6.92
-5.0 - 5.0 10.0
Relative Performance (%)
FTSE SET LARGE CAP INDEX HISTORICAL VOLATILITY TABLE (THB PRICE RETURN)
FTSE SET Large Cap Index
FTSE SET All-Share Index
* Based on annualised daily total log returns. ** Based on annualised weekly total log returns. *** Based on annualised monthly total log returns.
FTSE SET LARGE CAP INDEX HISTORICAL SHARPE RATIO (THB PRICE RETURN)
FTSE SET Large Cap Index
FTSE SET All-Share Index
* Based on annualised daily total log returns. ** Based on annualised weekly total log returns. *** Based on annualised monthly total log returns.
Note: Bangkok 3-Month interbank offered rate (BIBOR) is used as the risk free rate.
FTSE SET LARGE CAP INDEX HISTORICAL CORRELATION AGAINST FTSE SET ALL-SHARE INDEX (THB PRICE RETURN)
FTSE SET Large Cap Index
* Based on annualised daily total log returns. ** Based on annualised weekly total log returns. *** Based on annualised monthly total log returns.
FTSE SET LARGE CAP INDEX TOP 5 AND BOTTOM 5 SECTOR PERFORMERS
FTSE SET LARGE CAP INDEX 1-YEAR TOP PERFORMING SECTOR - MOBILE TELECOMMUNICATIONS
PROFILE
● FTSE SET Large Cap Index - Mobile Telecommunications
● FTSE SET Mobile Telecommunications Index ● FTSE SET Large Cap Index
Source: FTSE Group 7 of 22
Index Name YTD * 1Y * 3Y ** 5Y *** 2008 * 2009 *
2.52
0.66 -1.82
6
1-Year Price Return: 82.61%
2.01
0.9942
5.58
79,937 1.82
2
-24.21
43.09
3.85
122,287 12.50
1 0.70
2.78
8.34
21.80
28.40
Weight in Sector:
Largest Constituent in Sector:
Advanced Info Serv
64.29 1.06
2.76
1.19
3.40
-
YTD (%)* 1Y (%)* 3Y (%)**
4.00
-3.06
1M Perf (%)
1770
-1.90
0.9967 0.9956 0.9964
1.69
Mining
Number of Cons
1
ICB Code ICB Sector
0.9958 0.9978
2010 *
5Y (%)***
Net Market Cap (THBm) Index Weight (%) 1Y Perf (%) Div Yield (%)
0.9933
9.24
2008 (%)* 2009 (%)* 2010 (%)* 2011 (%)*
-0.12 1.92 0.50 0.99 0.21
Index Name
0.22 -1.74 1.84 1.51 -0.06
4530 Health Care Equipment & Services 119,962 2.73 4.28
Food Producers 248,501 5.65
1350 Chemicals
2770 Industrial Transportation 28,821
3570
1
1
1
4.59Mobile Telecommunications 319,615 7.26 8.02
Weight in FTSE SET Large Cap Index:
7.26%
2
1
Dividend Yield: 0.00%
-7.56
0.9974
79.43%
9570 Technology Hardware & Equipment 42,485 0.97
8630 Real Estate Investment & Services 86,199 1.96 7.65
26570
-28.43
82.61
40.67
8350 Banks 1,568,209 35.64 -3.58
-0.02
Number of Constituents:
2
5550 Media 52,000 1.18
2011 (%)*
18.96 29.58 37.28
3Y (%)** 5Y (%)*** 2008 (%)* 2010 (%)*
25.17
15.29 21.47 24.15
2011 *
1.66 0.46 0.91
FTSE SET Large Cap Index Data as at: 31 August 2012
Index Name YTD (%)* 1Y (%)* 2009 (%)*
16.42 22.43 19.88 29.14 39.20 28.85 20.62
27.54 19.37
TO
P
BO
TTO
M
0
20
40
60
80
100
120
140
160
180
200
Index R
ebase
d (
31 A
ug 2
011=
100)
FTSE SET LARGE CAP INDEX TOP 10 CONSTITUENTS
FTSE SET LARGE CAP INDEX TOP 5 AND BOTTOM 5 PERFORMERS
FTSE SET LARGE CAP INDEX TOP PERFORMER IN AUGUST - BANPU PCL PROFILE
Source: FTSE Group 8 of 22
-6.54
6 ADVANC
4.47
1.23
1.22
4.76
11.56
PTT2
Thai Oil Exploration & Production 66,811 1.52 11.02
FTSE SET Large Cap Index Data as at: 31 August 2012
Rank
4 BBL Bangkok Bank
1 SCB Siam Commercial Bank PCL
Charoen Pokphand Foods PCL Farming & Fishing
Banks 508,804
Banks 358,798 8.15
Banks 402,421 9.15
6.79
-3.43
Index Weight (%)Net Market Cap (THBm)
5.28
Advanced Info Serv Mobile Telecommunications 257,638 5.86
-4.08
5 SCC Siam Cement Building Materials & Fixtures 298,800
8.50
Constituent Name ICB Subsector 1M Perf (%)
402,421 9.15
PTT Exploration & Production 469,005 10.66
3 KBANK Kasikornbank Banks
PTT Global Chemical Exploration & Production 209,501
7 CPALL CP ALL Food Retailers & Wholesalers
184,379 4.19
5.49
1.47
Totals 3,118,391 70.87
9 PTTEP PTT Exploration & Production Exploration & Production 196,526 -1.97
8 PTTGC
-4.51
232,520
-
10 CPF
Constituent Name ICB Subsector 1M Perf (%)
ICB Subsector:
Coal
-6.54
Bangkok Bank
BEC BEC World Broadcasting & Entertainment 52,000 1.18 -7.56
ADVANC Advanced Info Serv Mobile Telecommunications 257,638 5.86 8.50
Banks 358,798
Farming & Fishing 184,379 4.19
SCB Siam Commercial Bank PCL Banks 508,804 11.56
4.00%
KBANK Kasikornbank -3.43
Local Code:
BANPU
122,287 2.78
Weight in FTSE SET Large Cap Index:
2.78%
Dividend Yield
8.15 -4.08BBL
CPF Charoen Pokphand Foods PCL -4.51
BANPU Banpu PCL Coal 12.50
TMB
Local Code
Index Weight (%)Net Market Cap (THBm)Local Code
FTSE SET Mining Index
Banpu PCL
FTSE SET Large Cap Index
Banpu Public Company Limited is a mining and power company which has coal mining operations in Thailand,
Indonesia and China, and coal-fired Power generation operations in Thailand and China. It has a performance of
14.64% in August as the top performer in FTSE SET Large Cap Index. Its share price rose to their highest in
almost two months after the country's biggest coal miner provided a positive business outlook, as it expects its
45% owned Gaohe mine in China to receive final safety and production licences within the next few months.
TO
P
BO
TTO
M
▲ 0.28%
▲ 12.07%
▲ 14.64%
- 2.0 4.0 6.0 8.0 10.0 12.0 14.0
1-Month Price Return (%)
INDEX OVERVIEW
FTSE SET ALL-SHARE INDEX FIVE-YEAR PERFORMANCE (THB PRICE RETURN) PERFORMANCE HIGHLIGHTS
● FTSE SET Large Cap Index ● FTSE SET Mid Cap Index ● FTSE SET Small Cap Index
● FTSE SET Mid Small Index ● FTSE SET All-Share Index
● FTSE SET Fledgling Index ● FTSE SET Shariah Index
FTSE SET ALL-SHARE INDEX HISTORICAL PERFORMANCE TABLE (THB PRICE RETURN)
FTSE SET Large Cap Index
FTSE SET Mid Cap Index
FTSE SET Small Cap Index
FTSE SET Mid Small Cap Index
FTSE SET All-Share Index
FTSE SET Fledgling Index
FTSE SET Shariah Index
FIVE-YEAR HISTORICAL INDUSTRY BREAKDOWN (%) INDUSTRY BREAKDOWN (%)
● Basic Materials
● Consumer Goods
● Consumer Services
● Financials
● Health Care
● Industrials
● Oil & Gas
● Technology
● Telecommunications
● Utilities
Source: FTSE Group 9 of 22
3.13 18.69 13.91
26.34
3.09 15.96
88.88 56.46
41.53
-0.66 23.61 9.37
2010
(%)
2011
(%)
Div Yield
(%)
2009
(%)
1Y
(%)
FTSE SET All-Share Index Data as at: 31 August 2012
84.93 57.79 22.74 9.55 -48.04 72.01 38.03
3.97
3.50
93.85 83.38 24.69 12.89 -31.16 47.99
11.47 29.20 15.30
76.07
-0.59
106.90 50.56 27.42 8.53 -55.74 96.17 50.12
6.78 4.80 32.01
-49.46
55.97 26.43 15.97 -51.94 63.46
5.69 12.18
0.28 5.49 2.16 17.23 13.48
5Y
(%pa)
2008
(%)
3Y
(%)
5Y
(%)
3Y
(%pa)
31.47 -2.09
3.30 5.61
Index Name
17.16
CUMULATIVE PERFORMANCE ANNUALISED PERFORMANCE
127.29 85.74
The FTSE SET All-Share Index comprises the constituents in the FTSE SET Large Cap Index, the FTSE SET Mid Cap Index, and the FTSE SET Small Cap Index. The
index is a free float adjusted market-capitalisation weighted index representing the performance of approximately 98 per cent of the SET Main Board which pass the
size, free float, and liquidity screens. As at the end of August there were 177 constituents in the index.
23.03 16.10 101.67
5.18 11.38
YTD
(%)
-57.41 7.19
0.87
8.96
31.48 13.18 -50.22 89.30 65.77
98.56 46.02 -4.72 3.00
10.22 12.18 24.47
0.63
Within the size segments of the FTSE SET
All-Share Index, small cap companies had
the best performance in August with the
FTSE SET Small Cap Index up 5.18 per
cent, followed by mid cap companies
seeing an increase of 2.45 per cent.
Large cap companies were the worst
performers although up 0.28 per cent.
The FTSE SET All-Share Index had a
performance of 0.87 per cent.
1M
(%)
3M
(%)
6M
(%)
-5.24 3.05
6.47
-3.63
40.31
-6.52 3.17
4.10
3.16
2.45 9.86 12.42
27.43 19.97
0
20
40
60
80
100
120
140
160
180
200
Index R
ebase
d (
31 A
ug 2
007=
100)
4.94 7.05
9.90
37.11 3.21
10.01
17.32
1.79
6.22 2.46
0
20
40
60
80
100
RELATIVE PERFORMANCE AGAINST FTSE SET ALL-SHARE INDEX (THB PRICE RETURN)
1 MONTH 1 YEAR
FTSE SET INDEX SERIES PORTFOLIO CHARACTERISTICS
Number of Constituents
Full Market Cap (THBm)
% FTSE SET All-Share Index
Net Market Cap (THBm)
Dividend Yield (%)
Constituent Sizes (Net Market Cap THBm)
Average
Largest
Smallest
Median
Weight of Largest Constituent (%)
Top 10 Holdings (% Index Market Cap)
Source: FTSE Group 10 of 22
14
401
33.62 29.95
95
538,223
16,728
5.01
- 1.63 11.06 2.14 0.42
47.11
4,400,200
3.16
7,051,934
77.48
2.00
469,005
391
8,0783,049 570
17.6855.81
44,994
1,587
70.87
23,598
23,00531,569
372
146,673
39.69
3,640
3.79
44,994508,804
2.865.78
31.76
9.11 23.99
70.2830.01
85
3,598,722
39.54
2,339
-
126,576
76,505
11.56
508,804
5.91
289,623
3.17
254,495
147
2,049,462
22.52
372
5,610
372
3.97
3,623
2.00 3.29
29.93
222
4,107
17,268
13,765
FTSE SET Large
Cap Index
63.55 77.06
1,187,536
3.05
11.24 15.44 11.16 2.87
3.00
177
9,101,396
30 52
FTSE SET All-
Share Index
FTSE SET
Fledgling Index
FTSE SET
Shariah Index
100.00
1,955,395
3.50
1,511,239
16.60
897,914 5,587,737
3.13
FTSE SET Mid
Cap Index
12.86 26.51 13.30Totals
Review Turnover -
FTSE SET Small
Cap Index
June 2012
FTSE SET Mid
Small Cap Index
December 2011
FTSE SET All-Share Index Data as at: 31 August 2012
Large
Mid
Small
Mid Small
Fledgling
Shariah
FTSE S
ET I
ndic
es
FTSE S
ET I
ndust
ry I
ndic
es
Basic Materials
Consumer Goods
Consumer Services
Financials
Health Care
Industrials
Oil & Gas
Technology
Telecommunications
Utilities 6.33
60.12
27.20
-18.74
-7.96
57.02
7.48
16.91
-3.55
-39.96
-50.0 - 50.0 100.0
Relative Performance (%)
-7.13
2.05
6.06
1.39
2.19
-0.43
-10.0 -5.0 - 5.0 10.0
Relative Performance (%)
Large
Mid
Small
Mid Small
Fledgling
Shariah
FTSE S
ET I
ndic
es
FTSE
SET
Ind
ustr
y In
dic
es
Basic Materials
Consumer Goods
Consumer Services
Financials
Health Care
Industrials
Oil & Gas
Technology
Telecommunications
Utilities 3.35
7.10
7.62
1.20
1.12
2.63
-2.98
-0.30
-1.48
5.40
-5.0 - 5.0 10.0
Relative Performance (%)
2.43
2.22
4.82
4.31
1.58
-0.59
-2.0 - 2.0 4.0 6.0
Relative Performance (%)
FTSE SET INDEX SERIES HISTORICAL VOLATILITY (THB PRICE RETURN)
● FTSE SET Large Cap Index
● FTSE SET Mid Cap Index
● FTSE SET Small Cap Index
● FTSE SET Mid Small Cap Index
● FTSE SET All-Share Index
● FTSE SET Fledgling Index
● FTSE SET Shariah Index
Index volatility is calculated on a rolling 180 days basis.
FTSE SET INDEX SERIES HISTORICAL VOLATILITY TABLE (THB PRICE RETURN)
FTSE SET Large Cap Index
FTSE SET Mid Cap Index
FTSE SET Small Cap Index
FTSE SET Mid Small Cap Index
FTSE SET All-Share Index
FTSE SET Fledgling Index
FTSE SET Shariah Index
* Based on annualised daily total log returns. ** Based on annualised weekly total log returns. *** Based on annualised monthly total log returns.
FTSE SET INDEX SERIES HISTORICAL SHARPE RATIO (THB PRICE RETURN)
FTSE SET Large Cap Index
FTSE SET Mid Cap Index
FTSE SET Small Cap Index
FTSE SET Mid Small Cap Index
FTSE SET All-Share Index
FTSE SET Fledgling Index
FTSE SET Shariah Index
* Based on annualised daily total log returns. ** Based on annualised weekly total log returns. *** Based on annualised monthly total log returns.
Note: Bangkok 3-Month interbank offered rate (BIBOR) is used as the risk free rate.
FTSE SET INDEX SERIES HISTORICAL CORRELATION AGAINST FTSE SET ALL-SHARE INDEX (THB PRICE RETURN)
FTSE SET Large Cap Index
FTSE SET Mid Cap Index
FTSE SET Small Cap Index
FTSE SET Mid Small Cap Index
FTSE SET Fledgling Index
FTSE SET Shariah Index
* Based on annualised daily total log returns. ** Based on annualised weekly total log returns. *** Based on annualised monthly total log returns.
Source: FTSE Group 11 of 22
12.69 19.46 18.18 34.28 31.24 23.78 16.97 21.94
15.29 21.47 18.96 29.58 37.28 27.54 19.37 24.15
14.03 10.81 12.42
16.37 22.09 19.25 34.24 39.26 28.99 19.19 24.29
17.13
Index NameYTD
(%)*
1Y
(%)*
3Y
(%)**
5Y
(%)***
2008
(%)*
2009
(%)*
13.03 18.99 19.21 32.50 29.81 25.02 18.44 21.35
2010
(%)*
2011
(%)*
16.42 22.43 19.88 29.14 39.20 28.85 20.62 25.17
13.10 19.94 18.32 35.24 32.53 22.42 24.09 17.20
Index Name YTD* 1Y* 3Y** 5Y*** 2008* 2009* 2010* 2011*
SSI Sahaviriya Steel Industries Iron & Steel 7,501 0.13 -12.70
FTSE SET All-Share Index Data as at: 31 August 2012
TO
P
BO
TTO
M
TO
P
BO
TTO
M
INDEX OVERVIEW
FTSE SET MID CAP INDEX FIVE-YEAR PERFORMANCE (THB PRICE RETURN) PERFORMANCE HIGHLIGHTS
● FTSE SET Mid Cap Index ● FTSE SET All-Share Index
FTSE SET MID CAP INDEX HISTORICAL PERFORMANCE TABLE (THB PRICE RETURN)
FTSE SET Mid Cap Index
FTSE SET All-Share Index
FTSE SET MID CAP INDEX HISTORICAL REVIEW TURNOVER
FIVE-YEAR HISTORICAL INDUSTRY BREAKDOWN (%) INDUSTRY BREAKDOWN (%)
● Basic Materials
● Consumer Goods
● Consumer Services
● Financials
● Health Care
● Industrials
● Oil & Gas
● Technology
● Telecommunications
● Utilities
Source: FTSE Group 13 of 22
Net Market Cap (THBm) Number of Adds Number of Dels
FTSE SET Mid Cap Index Data as at: 31 August 2012
The FTSE SET Mid Cap Index ended the
month in positive territory in August up
2.45 per cent, outperforming the FTSE SET
All-Share Index by 1.58 per cent.
Year to date the FTSE SET Mid Cap Index
performance is up by 23.03 per cent, with
a volatility of 13.10 per cent, lower than
2011’s volatility of 22.42 per cent.
General Industrials had the best sector
performance in the FTSE SET Mid Cap
Index in August, up 11.95 per cent.
Total 12.86
June 2012 3
AFTER REVIEW
56.46 23.61 9.37
816,795
BEFORE REVIEW
0 49 770,418 52
December 2011 1 2 51 686,814 50 684,429
6.47
101.67 23.03 46.02
CUMULATIVE PERFORMANCE ANNUALISED PERFORMANCE
11.24
Review Month Number of Cons Net Market Cap
(THBm)
The FTSE SET Mid Cap Index comprises the companies within the top 90% of the SET Universe by full market capitalisation, excluding the constituents of the FTSE
SET Large Cap Index. The index is a free float adjusted market-capitalisation weighted index representing the performance of the mid-capitalised companies trading
on the SET Main Board, which pass the size, free float, and liquidity screens. As at the end of August there were 52 constituents in the index.
-0.66 76.07 40.31
Index Name1M
(%)
3M
(%)
6M
(%)
YTD
(%)
1Y
(%)
3Y
(%)
5Y
(%)
-57.41 98.56
Number of Cons 2-Way Turnover
(%)
9.86 12.42 3.00 16.10 -4.72 41.53 26.34
3.13
Div Yield
(%)
2.45
-49.46 0.87 4.10 18.69 13.91 88.88
1.63
7.19
3Y
(%pa)
5Y
(%pa)
2008
(%)
2009
(%)
2010
(%)
2011
(%)
0
20
40
60
80
100
120
140
160
180
Index R
ebase
d (
31 A
ug 2
007=
100)
2.74 5.37
20.64
37.74
6.27
17.65
2.86 2.92
2.79 1.00
0
20
40
60
80
100
Note: The majority of index changes occurs at the index reviews in June and December. Review changes to the index may include constitue additions/deletions,
shares in issue and free float changes, and changes due to corporate events.
FTSE SET MID CAP INDEX TOP 5 AND BOTTOM 5 SECTOR PERFORMERS
FTSE SET MID CAP INDEX TOP 10 CONSTITUENTS
FTSE SET MID CAP INDEX TOP 5 AND BOTTOM 5 PERFORMERS
ICB Sector Number of Cons Net Market Cap (THBm)ICB Code Index Weight (%) 1M Perf (%) 1Y Perf (%)
TO
P
BO
TTO
M
TO
P
BO
TTO
M
INDEX OVERVIEW
FTSE SET SMALL CAP INDEX FIVE-YEAR PERFORMANCE (THB PRICE RETURN) PERFORMANCE HIGHLIGHTS
● FTSE SET Small Cap Index ● FTSE SET All-Share Index
FTSE SET SMALL CAP INDEX HISTORICAL PERFORMANCE TABLE (THB PRICE RETURN)
FTSE SET Small Cap Index
FTSE SET All-Share Index
FTSE SET SMALL CAP INDEX HISTORICAL REVIEW TURNOVER
FIVE-YEAR HISTORICAL INDUSTRY BREAKDOWN (%) INDUSTRY BREAKDOWN (%)
● Basic Materials
● Consumer Goods
● Consumer Services
● Financials
● Health Care
● Industrials
● Oil & Gas
● Technology
● Telecommunications
● Utilities
Source: FTSE Group 15 of 22
Net Market Cap (THBm) Number of DelsNumber of Adds
The FTSE SET Small Cap Index comprises the companies within the top 98% of the SET Universe by full market capitalisation, excluding the constituents of the FTSE SET
Large Cap Index and FTSE SET Mid Cap Index. The index is a free float adjusted market-capitalisation weighted index representing the performance of the small-capitalised
companies trading on the SET Main Board, which pass the size, free float, and liquidity screens. As at the end of August there were 95 constituents in the index.
FTSE SET Small Cap Index Data as at: 31 August 2012
0
20
40
60
80
100
120
140
160
180
200
Index R
ebase
d (
31 A
ug 2
007=
100)
17.06
12.49
8.94
27.69
1.03
17.09
10.76
1.05 3.89
0
20
40
60
80
100
Note: The majority of index changes occurs at the index reviews in June and December. Review changes to the index may include constitue additions/deletions,
shares in issue and free float changes, and changes due to corporate events.
FTSE SET SMALL CAP INDEX TOP 5 AND BOTTOM 5 SECTOR PERFORMERS
FTSE SET SMALL CAP INDEX TOP 10 CONSTITUENTS
FTSE SET SMALL CAP INDEX TOP 5 AND BOTTOM 5 PERFORMERS
Source: FTSE Group 16 of 22
Index Weight (%)
Index Weight (%)Net Market Cap (THBm)
Net Market Cap (THBm)
Div Yield (%)
1M Perf (%)
1M Perf (%)
3530 Beverages 1 618 0.21 21.57 - 0.65
1.98
ICB Code ICB Sector Number of Cons Net Market Cap (THBm) Index Weight (%) 1M Perf (%) 1Y Perf (%)
FTSE SET Small Cap Index Data as at: 31 August 2012
TO
P
BO
TTO
M
TO
P
BO
TTO
M
INDEX OVERVIEW
FTSE SET MID SMALL CAP INDEX FIVE-YEAR PERFORMANCE (THB PRICE RETURN) PERFORMANCE HIGHLIGHTS
● FTSE SET Mid Small Cap Index ● FTSE SET All-Share Index
FTSE SET MID SMALL CAP INDEX HISTORICAL PERFORMANCE TABLE (THB PRICE RETURN)
FTSE SET Mid Small Cap Index
FTSE SET All-Share Index
FTSE SET MID SMALL CAP INDEX HISTORICAL REVIEW TURNOVER
FIVE-YEAR HISTORICAL INDUSTRY BREAKDOWN (%) INDUSTRY BREAKDOWN (%)
● Basic Materials
● Consumer Goods
● Consumer Services
● Financials
● Health Care
● Industrials
● Oil & Gas
● Technology
● Telecommunications
● Utilities
Source: FTSE Group 17 of 22
The FTSE SET Mid Small Cap Index comprises the constituents in the FTSE SET Mid Cap Index and the FTSE SET Small Cap Index. The index is a free float adjusted
market-capitalisation weighted index representing the performance of the mid and small-capitalised companies trading on the SET Main Board, which pass the size,
free float, and liquidity screens. As at the end of August there were 147 constituents in the index.
2010
(%)
2011
(%)
Div Yield
(%)
The FTSE SET Mid Small Cap Index ended
the month in positive territory in August up
3.09 per cent, outperforming the FTSE SET
All-Share Index by 2.22 per cent.
Year to date the FTSE SET Mid Small Cap
Index performance is up by 24.47 per cent,
with a volatility of 12.69 per cent, lower
than 2011’s volatility of 21.94 per cent.
Beverages had the best sector performance
in the FTSE SET Mid Small Cap Index in
August, up 21.57 per cent.
3Y
(%)
5Y
(%)
3Y
(%pa)
5Y
(%pa)
2008
(%)
2009
(%)
FTSE SET Mid Small Cap Index Data as at: 31 August 2012
Review Month Number of Adds Number of Dels Number of Cons Net Market Cap
(THBm)
Number of Cons
1,072,367 11.16
Total 13.30
June 2012 14 4 137 1,017,367 147
0
20
40
60
80
100
120
140
160
180
Index R
ebase
d (
31 A
ug 2
007=
100)
6.23
7.11
17.79
35.29
5.00
17.52
2.16
4.83 2.37 1.71
0
20
40
60
80
100
Note: The majority of index changes occurs at the index reviews in June and December. Review changes to the index may include constitue additions/deletions,
shares in issue and free float changes, and changes due to corporate events.
FTSE SET MID SMALL CAP INDEX TOP 5 AND BOTTOM 5 SECTOR PERFORMERS
FTSE SET MID SMALL CAP INDEX TOP 10 CONSTITUENTS
FTSE SET MID SMALL CAP INDEX TOP 5 AND BOTTOM 5 PERFORMERS
Source: FTSE Group 18 of 22
Div Yield (%)
Net Market Cap (THBm)
Net Market Cap (THBm)
3530 Beverages 1 618 0.05 21.57 - 0.65
1.65
ICB Code ICB Sector Number of Cons Net Market Cap (THBm) Index Weight (%) 1M Perf (%) 1Y Perf (%)
GOLD Golden Land Property Development Real Estate Holding & Development 2,790 0.23 28.13
SSI Sahaviriya Steel Industries Iron & Steel 7,501 0.63 -12.70
GFPT Gfpt Co Ltd Food Products 4,576 0.39 -12.57
SIS SIS Distribution Thailand Computer Hardware 372 0.03 -12.02
IT IT City Specialty Retailers 1,913 0.16 -15.12
FTSE SET Mid Small Cap Index Data as at: 31 August 2012
TO
P
BO
TTO
M
TO
P
BO
TTO
M
INDEX OVERVIEW
FTSE SET FLEDGLING INDEX FIVE-YEAR PERFORMANCE (THB PRICE RETURN) PERFORMANCE HIGHLIGHTS
● FTSE SET Fledgling Index ● FTSE SET All-Share Index
FTSE SET FLEDGLING INDEX HISTORICAL PERFORMANCE TABLE (THB PRICE RETURN)
FTSE SET Fledgling Index
FTSE SET All-Share Index
FTSE SET FLEDGLING INDEX HISTORICAL REVIEW TURNOVER
FIVE-YEAR HISTORICAL INDUSTRY BREAKDOWN (%) INDUSTRY BREAKDOWN (%)
● Basic Materials
● Consumer Goods
● Consumer Services
● Financials
● Health Care
● Industrials
● Oil & Gas
● Technology
● Telecommunications
● Utilities
Source: FTSE Group 19 of 22
FTSE SET Fledgling Index Data as at: 31 August 2012
Net Market Cap (THBm) Number of Adds Number of Dels
2010
(%)
2011
(%)
Div Yield
(%)
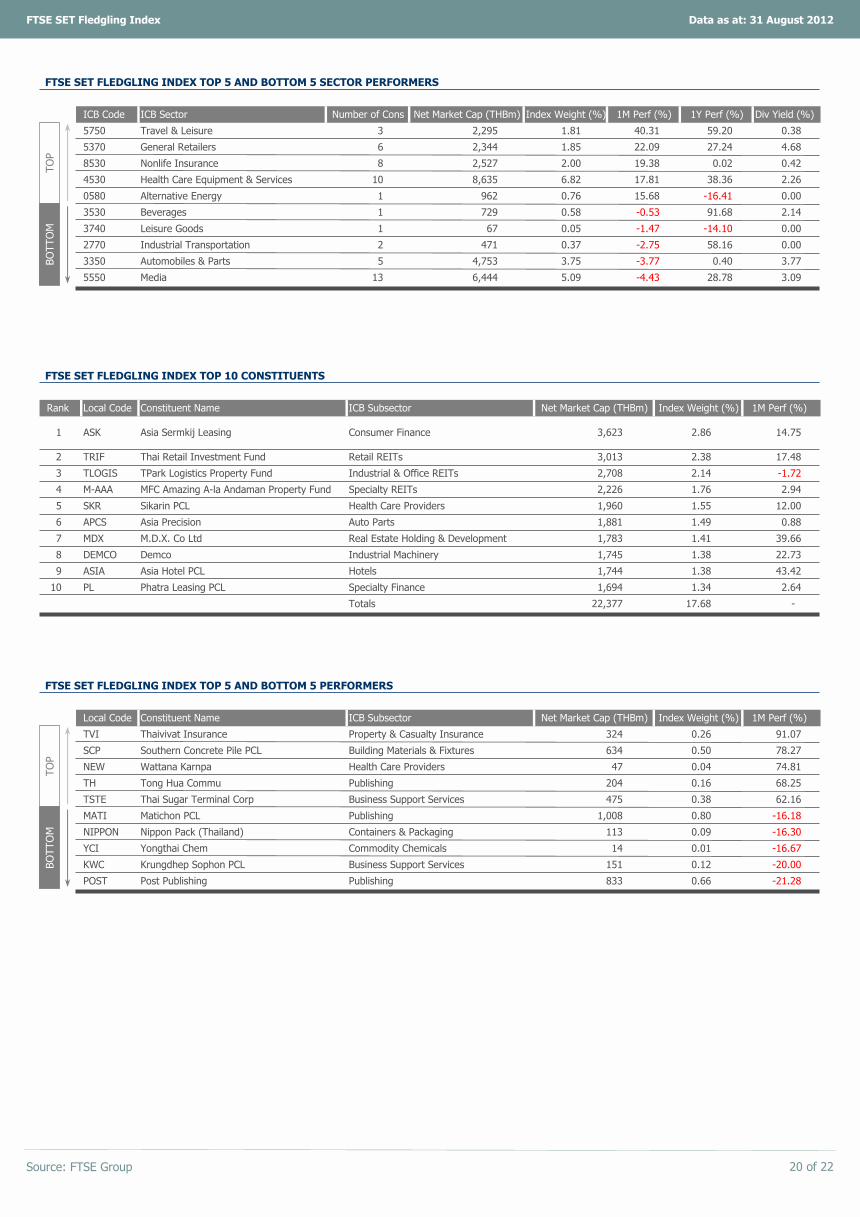
The FTSE SET Fledgling Index ended the
month in positive territory in August up
5.69 per cent, outperforming the FTSE SET
All-Share Index by 4.82 per cent.
Year to date the FTSE SET Fledgling Index
performance is up by 27.43 per cent, with
a volatility of 10.21 per cent, lower than
2011’s volatility of 12.42 per cent.
Travel & Leisure had the best sector
performance in the FTSE SET Fledgling
Index in August, up 40.31 per cent.
3Y
(%)
5Y
(%)
3Y
(%pa)
5Y
(%pa)
2008
(%)
2009
(%)
The FTSE SET Fledgling Index comprises the constituents listed on the SET Universe that are too small to be in the FTSE SET All-Share Index. The index is a free float
adjusted market-capitalisation weighted index representing the performance of companies ranked below the top 97% of the SET Universe. As at the end of August
Note: The majority of index changes occurs at the index reviews in June and December. Review changes to the index may include constitue additions/deletions,
shares in issue and free float changes, and changes due to corporate events.
FTSE SET FLEDGLING INDEX TOP 5 AND BOTTOM 5 SECTOR PERFORMERS
FTSE SET FLEDGLING INDEX TOP 10 CONSTITUENTS
FTSE SET FLEDGLING INDEX TOP 5 AND BOTTOM 5 PERFORMERS
Source: FTSE Group 20 of 22
Net Market Cap (THBm) Index Weight (%)
Index Weight (%)Net Market Cap (THBm)
FTSE SET Fledgling Index Data as at: 31 August 2012
TSTE Thai Sugar Terminal Corp Business Support Services 475 0.38
TO
P
BO
TTO
M
TO
P
BO
TTO
M
INDEX OVERVIEW
FTSE SET SHARIAH INDEX FIVE-YEAR PERFORMANCE (THB PRICE RETURN) PERFORMANCE HIGHLIGHTS
● FTSE SET Shariah Index ● FTSE SET All-Share Index
FTSE SET SHARIAH INDEX HISTORICAL PERFORMANCE TABLE (THB PRICE RETURN)
FTSE SET Shariah Index
FTSE SET All-Share Index
FTSE SET SHARIAH INDEX HISTORICAL REVIEW TURNOVER
Source: FTSE Group 21 of 22
2010
(%)
2011
(%)
Div Yield
(%)
The FTSE SET Shariah Index ended the
month in positive territory in August up
3.30 per cent, outperforming the FTSE SET
All-Share Index by 2.43 per cent.
Year to date the FTSE SET Shariah Index
performance is up by 8.96 per cent, with a
volatility of 16.37 per cent, lower than
2011’s volatility of 24.29 per cent.
3Y
(%)
5Y
(%)
3Y
(%pa)
5Y
(%pa)
2008
(%)
2009
(%)
FTSE SET Shariah Index Data as at: 31 August 2012
The FTSE SET Shariah Index comprises the constituents of the FTSE SET All-Share Index that are Shariah compliant according to the Yasaar screening methodology.
As at the end of August there were 85 constituents in the index.
Review Month Number of Adds Number of Dels Number of Cons Net Market Cap
(THBm)
Total
June 2012 13 10 82 2,418,916 85 1,884,831 47.11
29.95
77.06
Yasaar, an independent global Shariah (Islamic Law) consultancy ensures that all constituents and potential constituents of the FTSE SET All-Share Index are
screened quarterly to determine their Shariah status. An overview of the Yasaar/FTSE stock screening criteria is listed below.
FTSE and Yasaar’s screening process is managed in accordance with written guidelines relating to the Shariah. These guidelines have been set by Yasaar’s Shariah
Board who also monitors compliance. The Shariah guidelines can be grouped into two separate components – business activity and financial ratios.
Companies involved in the following activities will be considered to be non permitted business sectors:
a) Conventional Finance (non-Islamic Banking, Finance and Insurance, etc.) b) Alcohol
c) Pork related products and non-halal food production, packaging and d) Entertainment (Casinos, Gambling, Cinema, Music, Pornography and Hotels)
processing or any other activity related to pork and non-halal food
e) Tobacco f) Weapons, arms and defence manufacturing
This list is not exhaustive and is provided as a basic guidance to the broad principles involved.
After companies have been screened by their business sector activity, the remaining companies are further examined on their finances to ensure that those
companies are Shariah compliant. Only those companies that pass the following financial ratios will be considered Shariah complaint:
a) Debt is less than 33 per cent of total assets b) Cash and Interest bearing items are less than 33 per cent of total assets
c) Accounts receivable and cash are less than 50 per cent of total assets d) Total interest and non compliant activities income should not exceed 5 per cent
of total revenue
Appropriate purification of dividends at 5 per cent. This ratio calculates the recommended purification amount to be paid by the investor.
Constituent changes to the FTSE SET Shariah Index following the screening processes are implemented after the close of business following the third Friday in June
and December.
0
20
40
60
80
100
120
140
160
180
Index R
ebase
d (
31 A
ug 2
007=
100)
Note: The majority of index changes occurs at the index reviews in June and December. Review changes to the index may include constituent
additions/deletions, shares in issue and free float changes, and changes due to corporate events.
FIVE-YEAR HISTORICAL INDUSTRY BREAKDOWN (%) INDUSTRY BREAKDOWN (%)
● Basic Materials
● Consumer Goods
● Consumer Services
● Financials
● Health Care
● Industrials
● Oil & Gas
● Technology
● Telecommunications
● Utilities
FTSE SET SHARIAH INDEX TOP 10 CONSTITUENTS
FTSE SET SHARIAH INDEX TOP 5 AND BOTTOM 5 PERFORMERS
Source: FTSE Group 22 of 22
DISCLAIMER
The FTSE SET Index Series (“Index Series”) is calculated by FTSE International Limited (“FTSE”) in conjunction with the Stock Exchange of Thailand (“SET”) (collectively the
“Licensor Parties”). All rights in the Index Series vest in the Licensor Parties. “FTSE®” is a trade mark of the London Stock Exchange Group companies and is used by FTSE
International Limited (“FTSE”) under licence. “SET” is a trade mark of SET. Neither the Licensor Parties nor their respective licensors accept any liability (including in
negligence) for any loss arising out of use of the Index Series by any person.Every effort is made to ensure that all information given in this publication is accurate, but no
responsibility or liability can be accepted by FTSE, SET or its licensors for any errors or for any loss from use of this publication. Neither FTSE, SET nor any of its licensors
makes any claim, prediction, warranty or representation whatsoever, expressly or impliedly, either as to the results to be obtained from the use of the FTSE SET indices, data
or other material herein (“FTSE Material”) or the fitness or suitability of the FTSE Material for any particular purpose to which it might be put. No part of this information may
be reproduced, stored in a retrieval system or transmitted in any form or by any means, electronic, mechanical, photocopying, recording or otherwise, without prior written
permission of FTSE. Distribution of FTSE data and the use of FTSE SET indices to create financial products requires a licence with FTSE and/or its licensors.
Industry Classification Benchmark (“ICB”) is a product of FTSE International Limited (“FTSE”). All intellectual property rights in and to ICB vest in FTSE and a licence from
FTSE is required for use of ICB. FTSE and its licensors do not accept any liability to any person for any loss or damage arising out of any error or omission in ICB.
Net Market Cap (THBm) Index Weight (%)
Index Weight (%)Net Market Cap (THBm)
469,005
-1.97
EGCO Electricity Generating PCL
7 DTAC
2.41 9.59
Rank Local Code Constituent Name ICB Subsector 1M Perf (%)
3 PTTEP PTT Exploration & Production Exploration & Production 196,526 10.05
PTTGC PTT Global Chemical Exploration & Production 209,501 10.71 5.49
1 PTT PTT Exploration & Production 23.99 1.23
2
1,374,256 70.28 -
10 IRPC IRPC Commodity Chemicals 38,414 1.96 3.87
Exploration & Production 66,811
2.63
4 BANPU Banpu PCL Coal 122,287 6.25 12.50
5 BGH
9 BH Bumrungrad Hospital Health Care Providers 42,578