24
FTTP Feasibility Study for The City of Fort Collins Task 5 Report: Assessment of Risks & Opportunities August 2016 Uptown Services, LLC Dave Stockton & Neil Shaw, Principals

FTTP Feasibility Study for
The City of Fort Collins
Task 5 Report: Assessment of Risks & Opportunities
August 2016
Uptown Services, LLC Dave Stockton & Neil Shaw, Principals

12/23/2016 2
Uptown sees the following primary risk areas for the municipal FTTP system being
considered :
1. Comcast DOCSIS3.1 Upgrade
2. Market and Operating Risks
Technology costs
Market substitution (Voice and video)
Economic trends (premise growth, interest rates)
Construction cost overruns
The risks associated with DOCSIS3.1 were evaluated using market research and pro
forma revisions.
Market and operational risks were evaluated using sensitivity analysis
Study conducted by Uptown Services, LLC

DOCSIS3.1

12/23/2016 4
Total sample size of 100 respondents out of original 400
Respondents screened to ensure
Decision-maker for telecommunications and entertainment services in the home and
live within city limits
Currently using Internet in the household
Respondents with immediate family members employed by any of the following were
excluded:
The City of Fort Collins CenturyLink Comcast
Demographics were recorded (age, income, rent/own) but results not weighted for age
Three post-DOCSIS3.1 scenarios tested:
Comcast sole 1G provider at $70 MRC
Comcast and City 1G both at $70 MRC
City 1G at $50 MRC and Comcast 1G at $70 MRC
Study conducted by Uptown Services, LLC

Participants were asked if they would – or would not – switch to a different Internet service if both of the following services were provided in the future. The new service options would be the following two Internet services, both offering 1 Gbps speed…
12/23/2016 5
I Would Switch toComcast
I Would Switch to FtCollins
I Would Retain MyCurrent Service
Don't Know
1%
79%
18%
2% 10%
43% 44%
3%
Q4-5: “If these services were available to your home, and offer the same speed, which of the following statements best describes your likelihood to switch?”
Comcast $70/City $50 Both $70
Study conducted by Uptown Services, LLC
Demand for 1G is highly price elastic
City is preferred provider by a factor of
3x
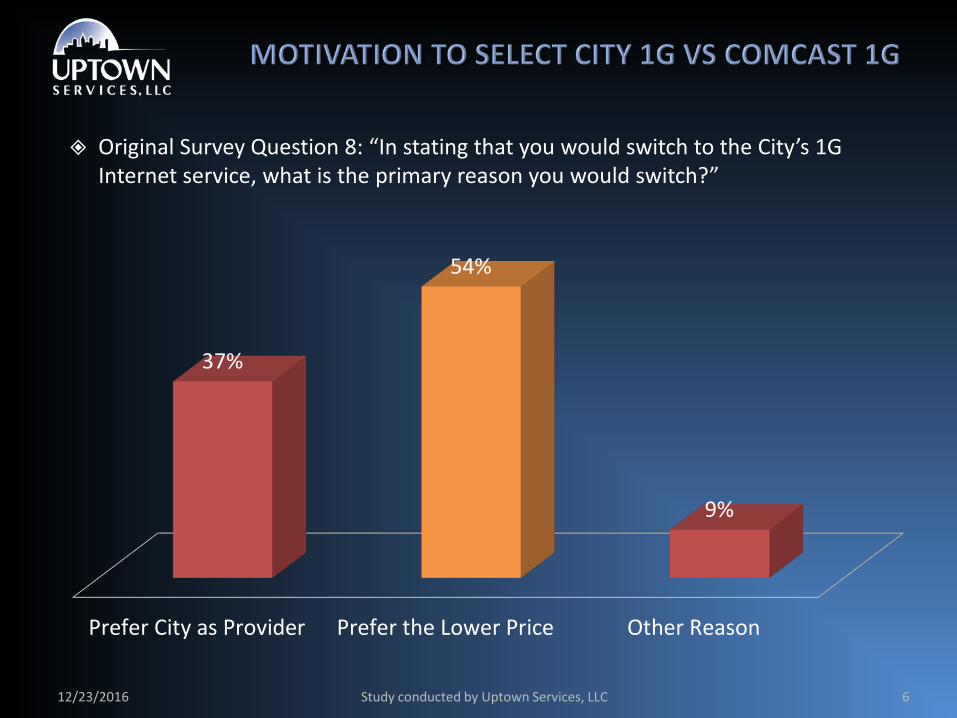
Original Survey Question 8: “In stating that you would switch to the City’s 1G Internet service, what is the primary reason you would switch?”
12/23/2016 6
Prefer City as Provider Prefer the Lower Price Other Reason
37%
54%
9%
Study conducted by Uptown Services, LLC
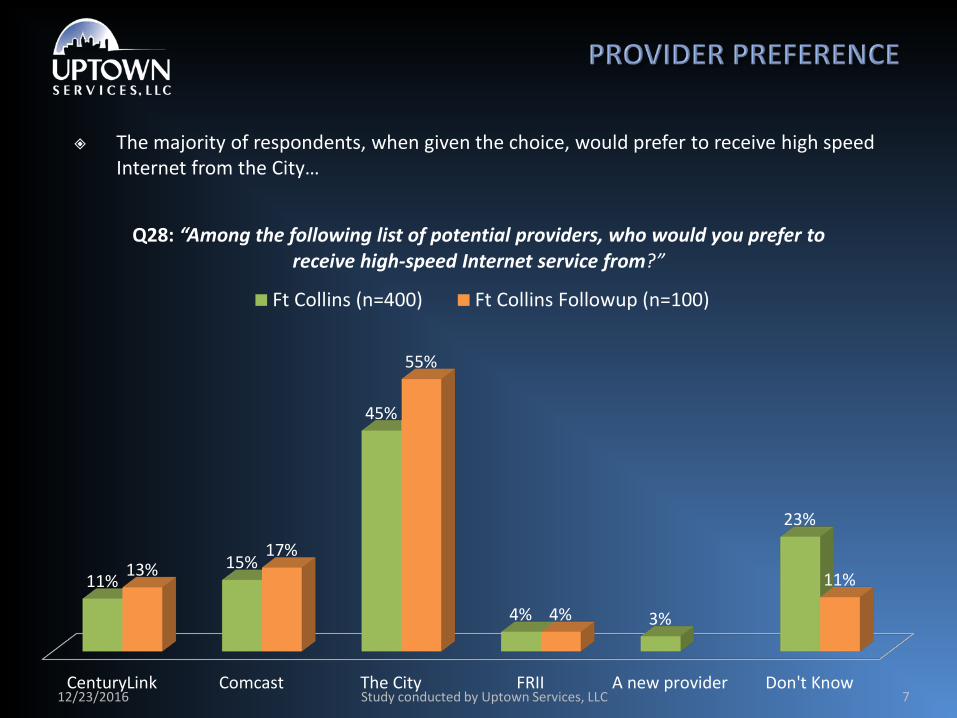
The majority of respondents, when given the choice, would prefer to receive high speed Internet from the City…
12/23/2016 7 CenturyLink Comcast The City FRII A new provider Don't Know
11% 15%
45%
4% 3%
23%
13% 17%
55%
4%
11%
Q28: “Among the following list of potential providers, who would you prefer to receive high-speed Internet service from?”
Ft Collins (n=400) Ft Collins Followup (n=100)
Study conducted by Uptown Services, LLC

December 16 Study conducted by Uptown Services, LLC 8
37%
57%
4% 2%
Current Internet Market Share (Households)
FTTP System CenturyLink
Comcast - All Tiers Satellite
Other
0%
33%
62%
4% 1%
Internet Market Share Post DOCSIS3.1 (No FTTP & Comcast 1G @ $70)
22%
78%
Comcast Internet Dispersion (Comcast 1G @ $70)
1 Gbps All Other Tiers
What if Comcast implements DOCSIS3.1 and is the sole provider of residential Gig service?
Add 5 points to market share Upsell 22% of subscribers to 1Gig

12/23/2016 9 Study conducted by Uptown Services, LLC
2016: Pre-DOCSIS3.1 2/1/2016 (n=400) Current Incidence No Internet 3 1% Dial-Up 0 0% DSL/FiOS 141 35% Cable 218 55% Satellite 15 4% Fixed Wireless/Other 6 2% DK Type 17 4%
400 100%
No Internet 3 1% Comcast 218 55% Not Comcast 179 45%
Intent to Switch to FTTP @ 10% Less
Comcast Not
Comcast All Market Share 55% 45% Definitely Switch 47.0% 33.4% 39.8% Probably 26.7% 36.1% 29.9% Might/Might Not 17.3% 17.8% 19.3% PN/DN/DK 9.0% 12.7% 11.0% Penetration 42.6% 36.0% 38.8%
2017: Post-DOCSIS3.1 6/1/2016 (n=100) Intent to Upgrade to 1G @ $70 MRC
Comcast Not
Comcast All Definitely 27.4% 8.8% Probably 32.3% 14.7% Might/Might Not 21.0% 14.7% PN/DN/DK 19.3% 61.8% Penetration 31.0% 12.0% 22.3%
Intent to Switch to FTTP @ 10% Less After DOCSIS3.1
Comcast Not
Comcast All Definitely 32.4% 29.4% Probably 18.4% 31.8% Might/Might Not 11.9% 15.7% 1G Upgraded 31.0% 12.0% PN/DN/DK 6.2% 11.2% Penetration 29.4% 31.7% 30.2%

12/23/2016 10
Determined that Comcast would add 5 points in market share and lock in 22% of
Internet subscribers with a $70 Gig tier (3 year contract term)
This results in a drop of FTTP Internet penetration from 38.8% to 30.2% for the
pro forma analysis. Baseline case revised accordingly.
Once FTTP is launched, Comcast’s $70 Gig service is not competitive with FTTP
service at $50/month due to strong provider preference and price elasticity
Study conducted by Uptown Services, LLC

12/23/2016 11
Comcast DOCSIS 3.1
‘Longmont Model’ (City is RSP)
‘Westminster Model’ (Ting is RSP)
‘Huntsville Model’ (Google is RSP)
Residential
Comcast 1G / 35M Monthly: $140
MRC: $70 NRC: TBD
Term: 3 Years
1G / 1G Charter Member
MRC: $49.95 NRC: $0
Term: Monthly
1G / 1G MRC: $98*
NRC: Up to $200
1G / 1G MRC: $70***
NRC: $0 Term: 1 Year
Commercial TBD 1G / 500M
MRC: $799.95 NRC: $0
1G / 1G MRC: $148**
NRC: Up to $400 Custom Quote
Affordable Internet
10M MRC: $9.95
Income Qualifier: Yes Not Offered
5M / 5M MRC: $28*
NRC: Up to $200 Income Qualifier: No
5M / 1M MRC: $0
NRC: $300 Income Qualifier: No
* Internet service is $89/month and ONT rental is $9/month or purchase for $200. ** Internet service is $139/month and ONT rental is $9/month or purchase for $200. *** Based on Austin, TX pricing.
Study conducted by Uptown Services, LLC

Business Model & Partnership Risk

December 16 13
Retail Model Risks
Service revenues may be insufficient to cover debt service requirement
Technology advances may require more frequent or costly system upgrades than forecast
Personnel or other operating expenses may exceed forecast
Wholesale Model Risks
Lease rates may be too low to pay off the long term debt from the fiber build
Retailer price levels may not be competitive in a DOCSIS3.1 environment with Comcast's $70 Gig service
Retailer may go bankrupt or default on wholesale payments
Franchise Model Risks
Retailer is not bound to serve all premises and can cherry pick service areas
Retailer performance may not achieve original City goals with FTTP
12/23/2016 14 Study conducted by Uptown Services, LLC
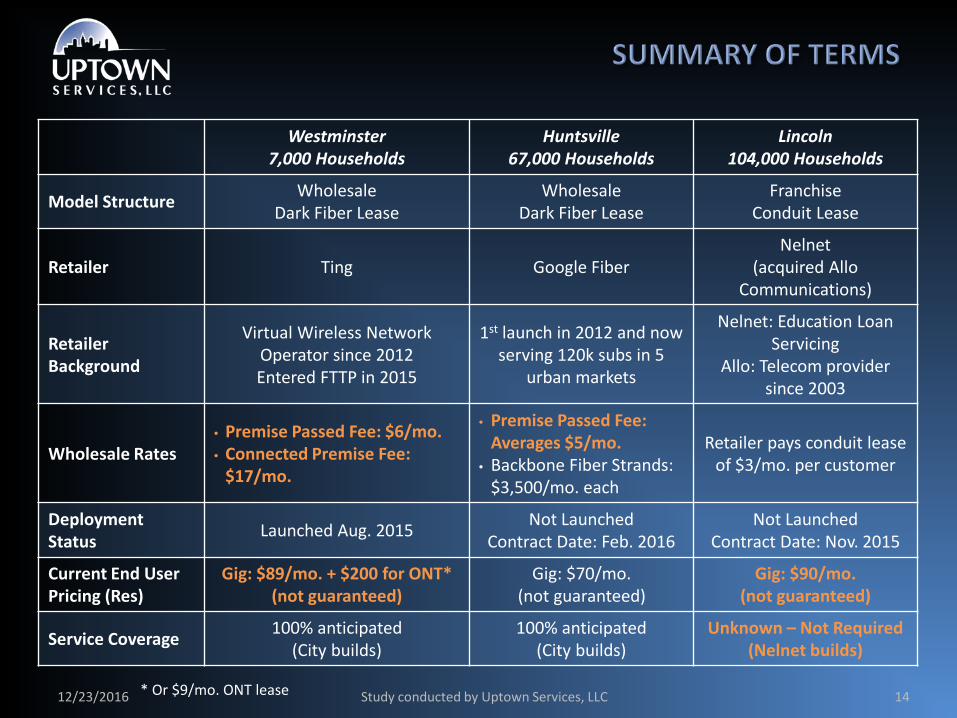
Westminster 7,000 Households
Huntsville 67,000 Households
Lincoln 104,000 Households
Model Structure Wholesale Dark Fiber Lease
Wholesale Dark Fiber Lease
Franchise Conduit Lease
Retailer Ting Google Fiber Nelnet
(acquired Allo Communications)
Retailer Background
Virtual Wireless Network Operator since 2012 Entered FTTP in 2015
1st launch in 2012 and now serving 120k subs in 5
urban markets
Nelnet: Education Loan Servicing
Allo: Telecom provider since 2003
Wholesale Rates • Premise Passed Fee: $6/mo. • Connected Premise Fee:
$17/mo.
• Premise Passed Fee: Averages $5/mo.
• Backbone Fiber Strands: $3,500/mo. each
Retailer pays conduit lease of $3/mo. per customer
Deployment Status Launched Aug. 2015 Not Launched
Contract Date: Feb. 2016 Not Launched
Contract Date: Nov. 2015
Current End User Pricing (Res)
Gig: $89/mo. + $200 for ONT* (not guaranteed)
Gig: $70/mo. (not guaranteed)
Gig: $90/mo. (not guaranteed)
Service Coverage 100% anticipated (City builds)
100% anticipated (City builds)
Unknown – Not Required (Nelnet builds)
* Or $9/mo. ONT lease

15
Retail Model Wholesale Fiber Lease Models$0
$20,000,000
$40,000,000
$60,000,000
$80,000,000
$100,000,000
$120,000,000
Network Construction Facility Capital Costs Other Capital CostsBack Office Systems Middleware & Conditional Access Fixed EquipmentVehicles Contract Installation FTTP ONTsFiber Drop and Powering Converters Engineering Services
12/23/2016 Study conducted by Uptown Services, LLC
$109M vs. $85M Wholesale =78% of
Retail CAPEX

16
Yr 1 Yr 2 Yr 3 Yr 4 Yr 5 Yr 6 Yr 7 Yr 8 Yr 9 Yr 10 Yr 11 Yr 12 Yr 13 Yr 14 Yr 15$0
$1,000,000
$2,000,000
$3,000,000
$4,000,000
$5,000,000
$6,000,000
$7,000,000
$8,000,000
Retail Model Wholesale Fiber Lease Models
12/23/2016 Study conducted by Uptown Services, LLC
13% of Retail
Saving $5M annually in
Opex
17
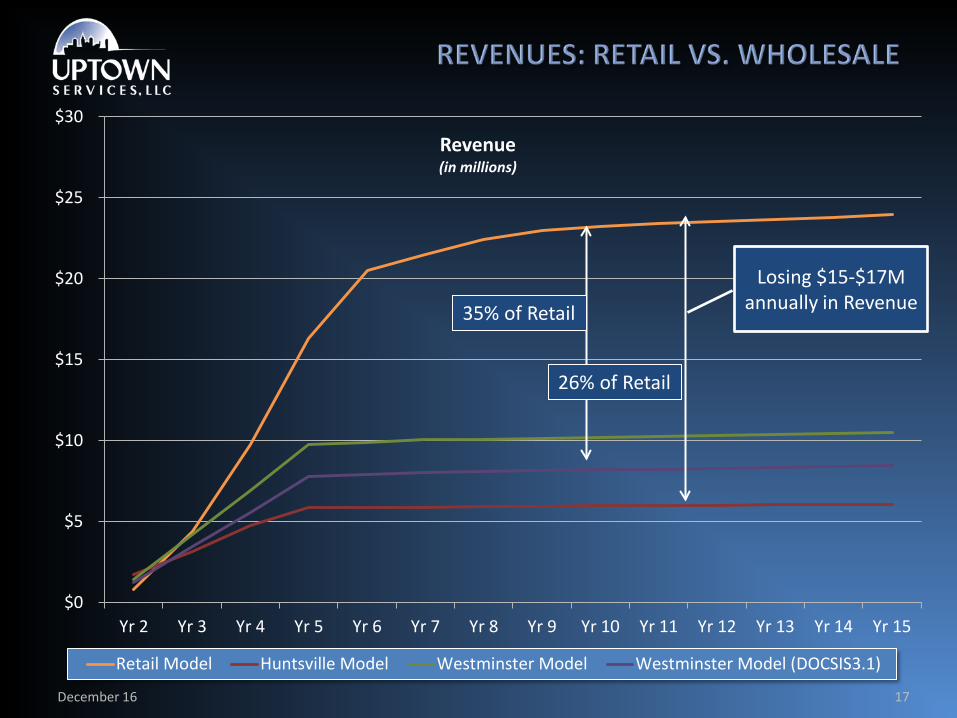
$0
$5
$10
$15
$20
$25
$30
Yr 2 Yr 3 Yr 4 Yr 5 Yr 6 Yr 7 Yr 8 Yr 9 Yr 10 Yr 11 Yr 12 Yr 13 Yr 14 Yr 15
Revenue (in millions)
Retail Model Huntsville Model Westminster Model Westminster Model (DOCSIS3.1)
December 16
35% of Retail
26% of Retail
Losing $15-$17M annually in Revenue

12/23/2016 18
Risk Factor Degree of Risk
Ability to Mitigate R W F
Lower Penetration Due to DOCSIS3.1
Retail model pro forma is feasible with penetration reduced by 22% (Internet & Voice). Interdependent with Price Advantage Risk.
Lower Penetration Due to Brand Preference
Aside from Google Fiber, brand preference is very low for an alternative provider new to the market.
Lower Penetration Due to Loss of Price Advantage
Significant questions about the ability of retailers, other than Google Fiber, to compete using $90+ Gig Internet.
Higher Opex Due to Increased Staffing Costs
Pro forma salary and FTE levels are robust, but many muni FTTP systems exceed staffing budgets
Higher Capex Due to Construction Cost Overrun
Retail model pro forma is feasible at up to 25% construction cost overrun.
Higher Debt Service Due to Higher Interest Rates
Interest rate thresholds identified. Cannot eliminate all risk with uncertain bond issue #2 interest rate
Lower Community Support Due to < 100% Availability Franchise model would require minimum density threshold
Study conducted by Uptown Services, LLC
LEGEND: R = Retail Model W = Wholesale Model F = Franchise Model

Sensitivity Analysis
12/23/2016 20
Core team identified issues:
― Higher network upgrade cost (Year 7 & 10)
― Higher construction cost
― Higher construction cost & higher network upgrade cost (Year 7 & 10)
― Higher bond interest rate
Higher Internet dispersion in 1G Charter Member
Higher premise growth rate
Model identified issues:
Identification of Top 10 most sensitive variables
Study conducted by Uptown Services, LLC

21
($140)
($120)
($100)
($80)
($60)
($40)
($20)
$0
$20
$40
Year2 Year3 Year4 Year5 Year6 Year7 Year8 Year9 Year10 Year11 Year12 Year13 Year14 Year15
Mill
ions
Baseline 25% Over Construction2x Upgrade Cost 2nd Bond @ 5.25%25% Over Construction & 2x Upgrade Higher Premise Growth RateHigher 1G Dispersion
12/23/2016 Study conducted by Uptown Services, LLC

12/23/2016 22 Study conducted by Uptown Services, LLC
A310 A104 A025 A073 A031 A080 A103 A028 A062 A154 A395 A058 A061 A148 A076 A397 A195 A155 A151 A185
$0
$5,000,000
$10,000,000
$15,000,000
$20,000,000
$25,000,000
Net
Cas
h Ye
ar15
ID A31A10A02A07A03A08A10A02A06A15
Title Blended Cost per Meter Passed - During Build Residential Internet Tier2 - Year1 Residential Internet Access Penetration High Capacity Services Penetration of Med-Large Tier2 Year 10 - Res Percentage of all Businesses Residential Internet Tier1 - Year1 Tier1 Year 10 - Res Commercial Internet Access Penetration DIA ARPU
Best $1,082 $54.95
5.5% $43.95
$1,650
Worst $885 $44.96
4.5% $35.96
$1,350
ID A39A05A06A14A07A39A19A15A15A18
Title Bond Rate - Series 1 Business Package 1 Lines per Business Package Business Package 1 Per Line - Year1 DIA Year 10 - Bus Bond Rate - Series 2 Bandwidth Minimum Capcity Trigger Direct Fiber High Cap ARPU Tier1 Bus Price Residential Average Bandwidth - Year1
Best 4.1%
4.2
$15.40
5.2%
$3,300 $65.95 1,650
Worst 3.4%
3.4
$12.60
4.3%
$2,700 $53.96 1,350
Scenario = Retail-2P(Post-DOCSIS3.1)

Conclusions

24
Retail model is financially feasible - even in a post-DOCSIS3.1 environment Total funding requirement is $125M Project is net cash positive in 15 years
The retail model remains feasible under most sensitivities: Construction overrun of 10%: 15 year net payback Bond issue #2 50 basis point higher interest rate: 15 year net payback Construction overrun of 10% & 2x Upgrade Cost: > 15 year net payback
Wholesale and/or franchise partner discussions could be pursued but will require much improved terms Franchise model: Google Fiber (funded by Alphabet) is ideal with
community-wide coverage commitment, but scale will be an issue Wholesale Model: Viable financial terms in port-DOCSIS3.1 environment are
unlikely Study conducted by Uptown Services, LLC 12/23/2016


