43
FTTx coverage and capex: worldwide trends and forecasts 2019–2025 FTTx coverage and capex: worldwide trends and forecasts 2019–2025 Stephen Wilson

FTTx coverage and capex: worldwide trends and forecasts 2019–2025
FTTx coverage and capex:
worldwide trends and
forecasts 2019–2025
Stephen Wilson

FTTx coverage and capex: worldwide trends and forecasts 2019–2025
KEY QUESTIONS ANSWERED IN THIS REPORT WHO SHOULD READ THIS REPORT
This report analyses and forecasts coverage (premises passed)
and capex for FTTx architecture and technologies during 2019–
2025. It is based on several sources, including the following.
▪ Analysys Mason’s internal research, including our core
telecoms forecasts, our fixed data traffic forecasts and our
detailed modelling of the costs of technologies and
deployment. Our modelling and assumptions are informed
by professionals in our 16 offices worldwide.
▪ Ongoing engagement with stakeholders in the FTTx market,
including operators and vendors.
2
About this report
▪ How quickly will next-generation access (NGA) coverage grow across
different global regions and individual markets?
▪ Which markets represent the most-promising opportunities for vendors
in terms of NGA coverage expansion?
▪ To what extent can NGA coverage grow in emerging markets across the
globe?
▪ What will be the scale of roll-outs from non-incumbent FTTP operators?
▪ What are the coverage levels of Gigabit-capable broadband?
▪ This report provides strategic planners with detailed and comprehensive
insight into the development of FTTx in comparable markets, allowing
them to understand what level and type of investment is appropriate,
and where opportunities lie.
▪ For equipment vendors, construction businesses and component
suppliers, it shows the scale of opportunity in FTTx.
▪ The model can also serve several other functions beyond the immediate
scope of this report. It can be used to provide the costs of alternative
scenarios, including different mixes of technologies, different demand
profiles in different geotypes, and different completion dates. If you wish
to explore these options, please contact the author.
GEOGRAPHICAL COVERAGE
▪ Western Europe (WE)
▪ Central and Eastern Europe
(CEE)
▪ Middle East and North Africa
(MENA)
▪ Sub-Saharan Africa (SSA)
▪ Emerging Asia–Pacific (EMAP)
▪ Developed Asia–Pacific (DVAP)
▪ North America (NA)
▪ Latin America (LATAM)
CASE STUDIES
▪ Coverage (premises passed)
▪ Capex (network and connection)
▪ Split by architecture/technology:
o FTTC/VDSL or G.fast,
FTTB/VDSL or G.fast, FTTB/LAN
o FTTP (split by incumbent and
alternative operator)
o Cable DOCSIS3.0 or 3.1 (Note:
capex is not provided for cable
DOCSIS3.0 or 3.1).

FTTx coverage and capex: worldwide trends and forecasts 2019–2025
6. Worldwide trends
7. We forecast that 2019 was the peak year for global FTTx capex worldwide
8. FTTP will increase its dominance of the global NGA landscape during the
forecast period
9. FTTP and cable networks are the only viable options for meeting coverage
targets for gigabit-capable broadband
10. Roll-out plans in most countries in Western Europe currently miss the
Gigabit Society’s targets by some margin
11. Much work remains in Central and Eastern Europe in order to meet the
EU’s Gigabit Society’s targets
12. The rate at which FTTP can be built out depends on the existing level of
usable infrastructure, but regulation can help to speed up roll-outs
13. Non-incumbent operators can also rapidly increase FTTP coverage,
particularly if they have access to their own or rented infrastructure
14. There are opportunities for FTTP vendors to benefit from significant
coverage increases in some, but not all, large emerging markets
15. Western Europe
16. We forecast strong levels of investment in FTTP networks in Western
Europe throughout the forecast period
17. Central and Eastern Europe
18. The number of non-incumbent FTTP deployments in rural areas in Central
and Eastern Europe is growing, but not dramatically
19. Middle East and North Africa
20. Government intervention is driving an increase in fibre coverage in the
Middle East and North Africa, and the focus on wholesale access in the
region is increasing
21. Sub-Saharan Africa
22. NGA coverage in Sub-Saharan Africa is constrained by affordability, the
high cost of deployment and the lack of availability of fibre backbone
infrastructure
23. China
24. FTTP coverage is already very high in China and the focus has shifted to
upgrading to next-generation PON
25. Emerging Asia–Pacific
26. The number of FTTP deployments in several countries in the EMAP region
increased in 2019 and this momentum will continue
27. Developed Asia–Pacific
28. Several drivers explain the growth in the number of next-generation PON
deployments in developed Asia–Pacific
29. North America
30. The number of new fibre entrants in North America is far fewer than in
Western Europe
31. Latin America
32. Investment in FTTx networks in LATAM continues to be strong, although
this will slow down during the forecast period
33. Forecast methodology and assumptions
34. Geographical scope: forecasts are provided for 64 countries in 8 regions
35. Definitions
36. We take baseline costs for each technology and then apply several context-
specific variables to determine total capexTop-level breakdown of the
relative costs of FTTx technologies: basic topologies
37. Top-level breakdown of the relative costs of FTTx technologies: basic
topologies
3
Contents [1/2]

FTTx coverage and capex: worldwide trends and forecasts 2019–2025
38. About the author and Analysys Mason
39. About the author
40. Analysys Mason’s consulting and research are uniquely positioned
41. Research from Analysys Mason
42. Consulting from Analysys Mason
4
Contents [2/2]

FTTx coverage and capex: worldwide trends and forecasts 2019–2025
Figure 1: FTTx capex, by worldwide region, 2015–2025
Figure 2: NGA coverage by technology, worldwide, 2015–2025
Figure 3: Percentage of premises covered by gigabit-capable networks,
Western Europe, 2019 and 2025
Figure 4: Percentage of premises covered by gigabit-capable networks, Central
and Eastern Europe, 2019 and 2025
Figure 5: Percentage of premises covered by gigabit-capable networks, North
America and developed Asia–Pacific, 2019 and 2025
Figure 6: Incumbent operators’ maximum year-on-year percentage point
increases in FTTP coverage, as a percentage of total premises passed, selected
countries
Figure 7: Incumbent operators’ maximum year-on-year percentage point
increases in FTTP coverage, as a percentage of total premises passed, selected
countries
Figure 8: FTTP coverage of total premises, by selected counties in emerging
markets, 2019 and 2025
Figure 9: NGA coverage by technology, Western Europe, 2017–2025
Figure 10: FTTx capex by technology, Western Europe, 2017–2025
Figure 11: NGA coverage by technology, Central and Eastern Europe, 2017–
2025
Figure 12: FTTx capex by technology, Central and Eastern Europe, 2017–2025
Figure 13: NGA coverage by technology, Middle East and North Africa, 2017–
2025
Figure 14: FTTx capex by technology, Middle East and North Africa, 2017–
2025
Figure 15: NGA coverage by technology, Sub-Saharan Africa, 2017–2025
Figure 16: FTTx capex by technology, Sub-Saharan Africa, 2017–2025
Figure 17: NGA coverage by technology, China, 2017–2025
Figure 18: FTTx capex by technology, China, 2017–2025
Figure 19: NGA coverage by technology, emerging Asia–Pacific excluding China,
2017–2025
Figure 20: FTTx capex by technology, emerging Asia–Pacific excluding China,
2017–2025
Figure 21: NGA coverage by technology, developed Asia–Pacific, 2017–2025
Figure 22: FTTx capex by technology, developed Asia–Pacific, 2017–2025
Figure 23: NGA coverage by technology, North America, 2017–2025
Figure 24: FTTx capex by technology, North America, 2017–2025
Figure 25: NGA coverage by technology, Latin America, 2017–2025
Figure 26: FTTx capex by technology, Latin America, 2017–2025
Figure 27: Countries covered in this report, by region
Figure 28: Definitions used in this report
Figure 29: Capex model outline
Figure 30: Basic overview of FTTx network topologies and elements
5
List of figures

FTTx coverage and capex: worldwide trends and forecasts 2019–2025
Contents Worldwide trends
Regional trends
Western Europe
Central and Eastern Europe
Middle East and North Africa
Sub-Saharan Africa
China
Rest of emerging Asia-Pacific
Developed Asia-Pacific
North America
Latin America
Forecast methodology and assumptions
About the author and Analysys Mason

FTTx coverage and capex: worldwide trends and forecasts 2019–2025
We estimate that global FTTx capex peaked in 2019.
FTTx coverage in China reached 96% of premises at the end of
2019 and there is limited scope to extend the number of new
premises passed in China. As the expansion of network coverage
in China slows, network capex will decline.
Capex in the rest of the EMAP region (excluding China) will peak in
2020. Roll-outs in markets such as India and Indonesia will be a
significant driver of high capex in the early part of the forecast
period. We expect 50% of premises in the rest of EMAP to be
passed with NGA infrastructure by the end of 2025, up from 21%
at the end of 2019. This growth reflects the confidence that has
been generated as a result of robust subscriber take-up of NGA
roll-outs in many emerging markets.
Western Europe’s share of global FTTx capex will grow from 24%
in 2019 to 47% in 2025, driven in part because there is room to
increase FTTP coverage in France, Germany and the UK.
Furthermore, many alternative operators are just starting to roll
out FTTP in Western Europe; this, together with a generally slower
rate of roll-out in the region, means that capex will still be spent
on these deployments, even in 2025. FTTx capex in North
America will remain steady towards the end of the forecast
period, and in 2025, the region will have the second-highest
share of overall global FTTx capex. Developed markets have much
higher FTTP costs per premises passed and connected, which
means they have a greater impact on the global capex figures.
Figure 1: FTTx capex, by worldwide region, 2015–2025
0
10
20
30
40
50
60
70
80
20
15
20
16
20
17
20
18
20
19
20
20
20
21
20
22
20
23
20
24
20
25
Ca
pe
x (
US
D b
illio
n)
WE CEE NA DVAP China Rest of EMAP MENA LATAM SSA
Source: Analysys Mason
7
We forecast that 2019 was the peak year for global FTTx capex worldwide

FTTx coverage and capex: worldwide trends and forecasts 2019–2025
We forecast that NGA coverage of premises as a percentage of
overall global premises will rise from 55.2% at the end of 2019 to
65% at the end of 2025.
We have increased our end-of-year 2025 NGA coverage figure by
3.4 percentage points compared with our forecasts from last year,
partly because we are more confident of further NGA roll-outs in
the EMAP region (excluding China). Compared with last year, our
forecasts for NGA coverage in India for the end of 2025 are higher
by around 59 million premises, equivalent to around 2.5% of total
global premises. We have increased our year-end 2025 NGA
coverage figure for Indonesia by around 25 million premises – or
around 1% of the global total.
The percentage of global premises covered by NGA but not by
FTTP will fall from 17.5% at the end of 2019 to 12.4% by the end
of 2025. This reflects the increasing momentum behind FTTC/B
to FTTP migration in Western Europe and North America. Global
FTTC coverage will decline from 11.7% at the end of 2019 to
10.2% at the end of 2025. Challenger FTTP operators, particularly
in Western Europe, will also increase their coverage and move
into the areas previously only covered by FTTC and FTTB.
Nevertheless, we do not expect any decline in the percentage of
cable premises passed because there are no signs of large-scale
migrations of DOCSIS networks to FTTP. DOCSIS 4.0 promises
further increases in capacity, and the ability to use all frequencies
for both downstream and upstream transmission negates the
disadvantages that cable traditionally had with upstream speeds.
Figure 2: NGA coverage by technology, worldwide, 2015–2025
0%
10%
20%
30%
40%
50%
60%
70%
20
15
20
16
20
17
20
18
20
19
20
20
20
21
20
22
20
23
20
24
20
25
NG
A c
ove
rage
of
pre
mis
es
FTTP FTTx, but not FTTP Cable, but not FTTx
Source: Analysys Mason
8
FTTP will increase its dominance of the global NGA landscape during the forecast
period

FTTx coverage and capex: worldwide trends and forecasts 2019–2025
Policymakers are placing increasing emphasis on ensuring that
NGA broadband coverage meets the targets set for higher speeds.
Targets set by the European Union’s Gigabit Society state that by
the end of 2025 all households should have access to networks
with download speeds of at least 100Mbit/s, which can be
upgraded to 1Gbit/s.
Cable networks have an important role to play in meeting gigabit
coverage targets.
Cable networks can provide gigabit downstream speeds, but such
speeds are not always made available in current retail offers. In
the USA, Comcast offered gigabit speeds across almost all of its
footprint as of October 2018, thanks to its roll-out of DOCSIS 3.1.
In the larger countries within Western Europe, maximum cable
download speeds of 300–500Mbit/s are common. However,
Vodafone Germany has deployed DOCSIS 3.1 and offers gigabit
speeds. Cable operators in Western Europe that do not offer
gigabit speeds could easily upgrade their networks to do so.
Copper networks will struggle in even the most-favourable of
circumstances to offer gigabit downstream speeds.
It is unclear whether copper networks can offer gigabit
downstream speeds. VDSL35b supervectoring falls far short and
Telekom Deutschland offers maximum download speeds with
VDSL35b of only 250Mbit/s. While aggregate downstream and
upstream speeds of around 1Gbit/s are possible with G.fast,
106MHz downstream speeds would be below 1Gbit/s.
BT’s FTTC-based G.fast roll-out offers download speeds of
300Mbit/s, and Swisscom’s FTTdp G.fast roll-out provides
downstream speeds of 500Mbit/s. Depending on the
circumstances, even G.fast that uses 212MHz may not deliver
gigabit downstream speeds. For example, this may be the case if
operators have to start G.fast at 19MHz because VDSL2 17MHz is
being used in the same binder.
G.mgfast aims to provide aggregate downstream and upstream
bitrates of 10Gbit/s over in-building copper and coaxial cabling by
using frequencies up to 424MHz or 848 MHz The first volume of
the recommendation for the G.mgfast ITU project was scheduled
to be completed in January 2020. However, we exclude G.mgfast
from our gigabit-capable forecasts because standardisation is
incomplete and it is not clear if it is commercially viable.
5G fixed-wireless access may also struggle to meet the criteria of
upgradability to 1Gbit/s speeds.
Given current benchmarks, 5G fixed-wireless in mid-band
spectrum will struggle to go much beyond speeds in the low
hundreds of Mbit/s. There also appears to be limited interest in
5G mmWave deployments in Western Europe currently. The cost
advantage of fixed-wireless roll-outs rapidly erode with mmWave.
which severely limits deployment incentives. In any case, it is not
clear that such roll-outs can achieve 1Gbit/s speeds. Verizon is
using 400MHz of spectrum but still only promises typical
download speeds of 300Mbit/s.
9
FTTP and cable networks are the only viable options for meeting coverage targets
for gigabit-capable broadband

FTTx coverage and capex: worldwide trends and forecasts 2019–2025
Current investment plans indicate that most countries in Western
Europe will fall far short of meeting the Gigabit Society’s target to
provide nationwide coverage for networks that can be upgraded
to 1Gbit/s.
By the end of 2019 in most countries in Western Europe,
households with DOCSIS cable coverage accounted for the largest
percentage of all households covered by networks that could be
upgraded to 1Gbit/s. Significantly, the two countries in Western
Europe with the lowest coverage of networks capable of being
upgraded to gigabit speeds are Greece and Italy, both of which
are unusual in that they do not have any DOCSIS cable networks.
Even during the forecast period, DOCSIS cable coverage will
continue to be important in determining the coverage of networks
that can be upgraded to 1Gbit/s. This is partly because
incumbents want to upgrade to FTTP to address competition from
cable operators. Cable operator coverage is focused on major
urban areas and these are also the cheapest areas for FTTP roll-
outs.
Nevertheless, there will be cases of FTTP roll-outs in more-rural
areas which will extend the coverage of gigabit-capable networks.
FTTP will be rolled out nationwide in Portugal and Spain, which
will enable the Gigabit Society’s targets to be met under current
roll-out plans.
Figure 3: Percentage of premises covered by gigabit-capable
networks, Western Europe, 2019 and 2025
10
Roll-out plans in most countries in Western Europe currently miss the Gigabit
Society’s targets by some margin
0%
10%
20%
30%
40%
50%
60%
70%
80%
90%
100%
Gre
ece
Ita
ly
UK
Ire
lan
d
Fra
nc
e
Au
str
ia
Ge
rma
ny
Fin
lan
d
De
nm
ark
Icela
nd
Sw
itze
rla
nd
Sp
ain
No
rwa
y
Sw
ed
en
Ne
the
rla
nd
s
Po
rtu
ga
l
Be
lgiu
m
Pe
rce
nta
ge
of
pre
mis
es p
asse
d b
y gig
ab
it-c
ap
ab
le n
etw
ork
s
2019 2025
Source: Analysys Mason

FTTx coverage and capex: worldwide trends and forecasts 2019–2025
In Central and Eastern Europe, much work is required to meet the EU’s Gigabit
Society’s targets
In some Western European countries, national broadband plans
will underpin changes to coverage of gigabit-capable broadband
networks between the end of 2019 and the end of 2025. For
example, the Irish National Broadband Plan will help to drive up
gigabit-capable broadband coverage in Ireland from 55% at the
end of 2019 to 95% at the end of 2025.
In most countries in Central and Eastern Europe, only modest
progress will be made towards meeting the Gigabit Society’s
targets. Incumbents in some markets, such as the Baltic countries
and Bulgaria, have focused on expanding NGA coverage with VDSL.
Rural FTTP deployments will be less common, but some are
emerging, for example, in Romania, Estonia, Croatia and Slovenia.
Gigabit-capable broadband coverage in other developed markets
is noteworthy. In the USA and Canada, gigabit cable speeds are
already available and gigabit coverage is therefore high. Fixed
wireless rollouts will be used to extend coverage in Canada but
these networks will not be gigabit capable. In developed Asia–
Pacific, the government-backed UFB FTTP roll-outs in New
Zealand will increase gigabit coverage to 91.6% by the end of
2025. In Australia, the multi-technology mix selected for the NBN
roll-out will mean that gigabit-capable coverage will reach 51.5%
of households at the end of 2025. We are sceptical that copper
technologies will offer gigabit downstream speeds. For example,
in Japan, KDDI’s FTTB-G.fast 106MHz roll-out promises only
aggregate downstream and upstream speeds of 830Mbit/s.
Figure 4: Percentage of premises covered by gigabit-capable
networks, Central and Eastern Europe, 2019 and 2025
0%
20%
40%
60%
80%
100%
Tu
rke
y
Cro
ati
a
Uk
rain
e
Slo
va
kia
Esto
nia
Cze
ch
ia
Po
lan
d
Slo
ve
nia
Se
rbia
La
tvia
Lit
hu
an
ia
Bu
lga
ria
Ru
ssia
Ro
ma
nia
Hu
ng
aryP
erc
en
tage
of
pre
mis
es
pa
sse
d b
y gig
ab
it-
ca
pa
ble
ne
two
rks
2019 2025
Source: Analysys Mason
Figure 5: Percentage of premises covered by gigabit-capable
networks, North America and developed Asia–Pacific, 2019
and 2025
0%
20%
40%
60%
80%
100%
Au
str
alia
Ta
iwa
n
Ne
w Z
ea
lan
d
Jap
an
Ca
na
da
US
A
So
uth
Ko
rea
Sin
ga
po
re
Pe
rce
nta
ge
of
pre
mis
es
pa
sse
d b
y gig
ab
it-
ca
pa
ble
ne
two
rks
2019 2025
Source: Analysys Mason
11

FTTx coverage and capex: worldwide trends and forecasts 2019–2025
The rate at which FTTP can be built out depends on the existing level of usable
infrastructure, but regulation can help to speed up roll-outs
FTTP build run rate is a topical issue in Western Europe. This is
partly due to government pressure, as well as objectives for fibre
broadband coverage. This also reflects the desire of each
country’s incumbent to head off the threat posed by challenger
operators by being the first to deploy FTTP in a particular area. In
Western Europe, Spain’s incumbent accounts for the highest
proportion of premises passed by any regional incumbent in a
single year – at 19.5% in 2014. FTTP coverage in Portugal also
grew by 15.5% in 2015. In the UK, Openreach noted that as of
January 2020 it passed around 26 000 premises per week with
fibre, and is aiming to reach 30 000 premises passed by the end
of March 2020, which equates to just 5% of all UK premises
passed in a single year.
Availability of civil infrastructure for FTTP roll-out
Operators in Spain and Portugal benefited from the availability of
good-quality, usable duct infrastructure. However, not all incumbents
in Western Europe (including in Germany, Belgium, the
Netherlands and Italy) have ducted networks between exchanges
and subscribers’ homes; instead, copper lines are directly buried.
MDU penetration and regulation
In Spain and Portugal, the high penetration of multiple dwelling
units (MDUs) has encouraged the rapid roll-out of FTTP.
Regulations in Spain also require property owners to allow fibre
deployments within the MDU or on the building facade. In the UK,
access to MDUs has been more challenging.
Figure 6: Incumbent operators’ maximum year-on-year
percentage point increases in FTTP coverage, as a percentage
of total premises passed, selected countries
4.0%
7.5%
8.5%
18.4%
19.3%
0% 5% 10% 15% 20% 25%
Openreach, UK, 2019
Orange, France, 2019
Incumbents, Canada, 2018
Meo, Portugal, 2017
Movistar, Spain, 2014
Percentage of premises
Source: Analysys Mason
12
The UK government’s UK Telecommunications Infrastructure
(Leasehold Property) Bill is currently being read in parliament.
This legislation seeks to address concerns that 40% of landlords
do not respond to requests for access to their buildings. The
legislation aims to provide operators with a less-costly and a
more-rapid legal process to use if they do not receive co-operation
from building owners for infrastructure roll-out.
Finally, new build properties in the UK are not currently required
to incorporate gigabit internet connections, but the government
intends to introduce legislation to address this.
FTTx coverage and capex: worldwide trends and forecasts 2019–2025
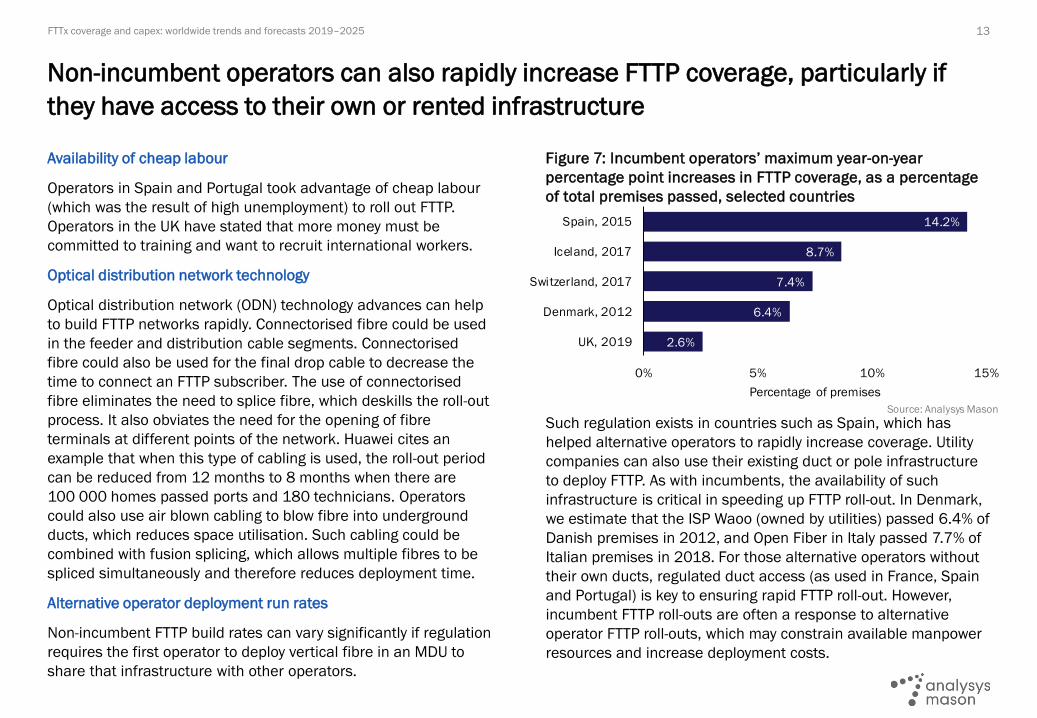
Non-incumbent operators can also rapidly increase FTTP coverage, particularly if
they have access to their own or rented infrastructure
Availability of cheap labour
Operators in Spain and Portugal took advantage of cheap labour
(which was the result of high unemployment) to roll out FTTP.
Operators in the UK have stated that more money must be
committed to training and want to recruit international workers.
Optical distribution network technology
Optical distribution network (ODN) technology advances can help
to build FTTP networks rapidly. Connectorised fibre could be used
in the feeder and distribution cable segments. Connectorised
fibre could also be used for the final drop cable to decrease the
time to connect an FTTP subscriber. The use of connectorised
fibre eliminates the need to splice fibre, which deskills the roll-out
process. It also obviates the need for the opening of fibre
terminals at different points of the network. Huawei cites an
example that when this type of cabling is used, the roll-out period
can be reduced from 12 months to 8 months when there are
100 000 homes passed ports and 180 technicians. Operators
could also use air blown cabling to blow fibre into underground
ducts, which reduces space utilisation. Such cabling could be
combined with fusion splicing, which allows multiple fibres to be
spliced simultaneously and therefore reduces deployment time.
Alternative operator deployment run rates
Non-incumbent FTTP build rates can vary significantly if regulation
requires the first operator to deploy vertical fibre in an MDU to
share that infrastructure with other operators.
Figure 7: Incumbent operators’ maximum year-on-year
percentage point increases in FTTP coverage, as a percentage
of total premises passed, selected countries
2.6%
6.4%
7.4%
8.7%
14.2%
0% 5% 10% 15%
UK, 2019
Denmark, 2012
Switzerland, 2017
Iceland, 2017
Spain, 2015
Percentage of premises
Source: Analysys Mason
13
Such regulation exists in countries such as Spain, which has
helped alternative operators to rapidly increase coverage. Utility
companies can also use their existing duct or pole infrastructure
to deploy FTTP. As with incumbents, the availability of such
infrastructure is critical in speeding up FTTP roll-out. In Denmark,
we estimate that the ISP Waoo (owned by utilities) passed 6.4% of
Danish premises in 2012, and Open Fiber in Italy passed 7.7% of
Italian premises in 2018. For those alternative operators without
their own ducts, regulated duct access (as used in France, Spain
and Portugal) is key to ensuring rapid FTTP roll-out. However,
incumbent FTTP roll-outs are often a response to alternative
operator FTTP roll-outs, which may constrain available manpower
resources and increase deployment costs.

FTTx coverage and capex: worldwide trends and forecasts 2019–2025
There are opportunities for FTTP vendors to benefit from significant coverage
increases in some, but not all, large emerging markets
Total FTTP coverage levels vary significantly between countries in
the world’s largest emerging markets (in terms of population). In
Vietnam, for example, FTTP coverage reached 68.2% at the end of
2019 compared with just 0.2% in Nigeria. The countries in large
emerging markets that today have the highest FTTP coverage
levels, namely Vietnam and China (although it is a matter of
debate whether China is an emerging market), have achieved this
status through state-directed investment. Governments either
fully or partly own fixed incumbents and have set objectives for
increasing fibre coverage.
We expect some levelling up of FTTP coverage levels across the
largest countries in emerging markets during the forecast period.
The drivers for this trend are largely commercial as operators see
opportunities to deliver a rapid return on investment. The threat
of new entrants will also encourage heavy incumbent investment
in some markets. In Indonesia, we expect Telekom Indonesia to
significantly expand its fibre coverage because it has seen much
improved take-up rates for its IndiHome retail proposition. In the
Philippines, the ambitious expansion plans of Converge ICT will
drive FTTP coverage expansion and force incumbent PLDT to roll
out FTTP with increased vigour. There is also considerable interest
from commercial investors in expanding FTTP coverage in Brazil.
There is a trend towards consolidation and expansion among
regional Brazilian FTTP providers and incumbent Oi is investing
heavily in expanding its FTTP coverage as it seeks to secure its
future place in the fixed broadband landscape.
Figure 8: FTTP coverage of total premises by selected counties
in emerging markets, 2019 and 2025
0%
20%
40%
60%
80%
100%
Nig
eri
a
Eg
ypt
Ind
ia
So
uth
Afr
ica
Me
xic
o
Ph
ilip
pin
es
Bra
zil
Ind
on
esia
Vie
tna
m
Pe
rce
nta
ge
of
pre
mis
es
pa
sse
d b
y F
TTP
2019 2025
Source: Analysys Mason
14
However, in other markets, obstacles will prevent significant
expansion of FTTP coverage. In Nigeria and South Africa, fixed
broadband affordability is a significant challenge. In Nigeria, the
availability of broader infrastructure such as backbone and metro
fibre networks will constrain the growth of FTTP coverage. In Sub-
Saharan Africa, right-of-way challenges also limit FTTP roll-outs. In
Mexico, incumbent Telmex has been slow to deploy NGA and we
forecast that it will continue to rely partly on FTTC-VDSL, even by
the end of 2025. This will also be the case in Egypt where the
government owns an 80% share in the incumbent, which has
deployed a nationwide FTTC network and is due to make some
upgrades to FTTP in the forecast period while keeping most of its
FTTC roll-out intact.

FTTx coverage and capex: worldwide trends and forecasts 2019–2025
Contents Worldwide trends
Regional trends
Western Europe
Central and Eastern Europe
Middle East and North Africa
Sub-Saharan Africa
China
Rest of emerging Asia-Pacific
Developed Asia-Pacific
North America
Latin America
Forecast methodology and assumptions
About the author and Analysys Mason

FTTx coverage and capex: worldwide trends and forecasts 2019–2025
We forecast strong levels of investment in FTTP networks in Western Europe
throughout the forecast period
Fragmentation is the dominant trend for fibre deployments in
Western Europe as new players emerge and mixed ownership
becomes more commonplace.
Across Western Europe, there is a growing emphasis on
wholesale-only FTTP challengers whose backers often include
energy companies such as those in Ireland (SIRO), Iceland
(Gagnaveita), Italy (Open Fiber) and Switzerland (Swiss Fibre Net).
Many of the networks in these countries have been able to attract
sizeable operators as wholesale clients. For example, Open Fiber
has agreements with Vodafone, WIND Tre, Fastweb and Sky Italia,
which bodes well for the overall prospects of the deployment.
There has also been a wave of incumbent FTTP infrastructure
carve-outs. This reflects incumbents’ desires to maximise
wholesale subscriber growth and limit the threat from the new
breed of wholesale-only competitors, while allowing more capex to
be spent on a more-rapid FTTP roll-out.
The momentum behind FTTC-to-FTTP migration is increasing in
Western Europe. In the UK, the threat posed by the new breed of
FTTP challengers explains Openreach’s increased focus on full
fibre. This increased emphasis is also explained by growing
government pressure. One significant exception to this rule is
Germany, where the absence of ducts in the access network
pushes up the costs of full FTTP considerably and helps to explain
the incumbent’s continuing focus on VDSL35b, at least in the
short term.
Figure 9: NGA coverage by technology, Western Europe, 2017–
2025
Figure 10: FTTx capex by technology, Western Europe, 2017–
2025
16
0%
10%
20%
30%
40%
50%
60%
70%
80%
90%
100%
20
17
20
18
20
19
20
20
20
21
20
22
20
23
20
24
20
25
Pe
rce
nta
ge
of
pre
mis
es p
assse
d
Cable, but not FTTx
FTTx, but not FTTP
FTTP
Source: Analysys Mason

FTTx coverage and capex: worldwide trends and forecasts 2019–2025
Contents Worldwide trends
Regional trends
Western Europe
Central and Eastern Europe
Middle East and North Africa
Sub-Saharan Africa
China
Rest of emerging Asia-Pacific
Developed Asia-Pacific
North America
Latin America
Forecast methodology and assumptions
About the author and Analysys Mason

FTTx coverage and capex: worldwide trends and forecasts 2019–2025
The number of non-incumbent FTTP deployments in rural areas in Central and
Eastern Europe is growing, but not dramatically
The NGA market in CEE has not changed dramatically over the
last year.
Incumbent operators in CEE have shown little additional
inclination to roll out FTTP during the last year. CETIN in Czechia is
an exception to this and the operator plans to roll out FTTP to
1 million premises (or 18% of all premises in the country) in the
next 7 years. Reticence from incumbents to deploy further FTTP is
partly explained by the fact that there may be some moves
towards using 5G fixed-wireless, for instance, in Poland.
There is little ongoing non-incumbent FTTP deployment in major
urban areas. This is because many such areas have long been
covered by FTTB+LAN players and/or cable networks, which
overlap in some cities in individual countries (such as in Warsaw,
Poland). Orange in Romania is an exception: its FTTP deployment
was launched at the end of 2019, perhaps spurred by MNO
Vodafone’s acquisition of Liberty Global’s Romanian cable assets,
which could lead to more pressure on standalone MNOs.
We noted in last year’s forecast report an emphasis on extending
NGA coverage to rural areas, and this continues to be important.
In Slovenia, the RUNE project will cover 233 000 premises
(around 22% of all premises) over the next 3 years. RUNE Group
is also rolling out FTTP in rural Croatia. National broadband plans,
such as those in Poland, can help to drive FTTP coverage in more-
rural areas. In Estonia, electricity company Elektrilevi is rolling out
FTTP in rural areas with some help from public funding.
Figure 11: NGA coverage by technology, Central and Eastern
Europe, 2017–2025
Figure 12: FTTx capex by technology, Central and Eastern
Europe, 2017–2025
18

FTTx coverage and capex: worldwide trends and forecasts 2019–2025
Contents Worldwide trends
Regional trends
Western Europe
Central and Eastern Europe
Middle East and North Africa
Sub-Saharan Africa
China
Rest of emerging Asia-Pacific
Developed Asia-Pacific
North America
Latin America
Forecast methodology and assumptions
About the author and Analysys Mason

FTTx coverage and capex: worldwide trends and forecasts 2019–2025
Government intervention is driving an increase in fibre coverage in the Middle East
and North Africa, and the focus on wholesale access in the region is increasing
The number of networks that offer wholesale access has been
increasing in the MENA region.
FTTP has been deployed nationwide by vertically integrated
incumbents in the United Arab Emirates (UAE) and Qatar, the
most-advanced countries in the Gulf region. Next-generation PON
has not yet been deployed in these countries, and for both
Etisalat in the UAE and Ooredoo in Qatar, the maximum speed
offered is only 1Gbit/s. Despite this, Etisalat in the UAE increased
entry-level FTTP speeds from 20Mbit/s to 250Mbit/s in 2019,
and Ooredoo in Qatar increased its entry-level speeds from
15Mbit/s to 50Mbit/s at the same time.
Investment in FTTP is increasing in other Gulf region and North
African markets. This is often driven by government pressure and,
as a result, more operators are offering wholesale access or are
operating purely as wholesale players. In Bahrain, Batelco has
structurally separated into a retail division and networks division
(BNET) and the National Broadband Network is set to cover 95%
of households with FTTP by the end of 2019. BNET will offer
wholesale access on equal terms to all operators. In Saudi Arabia,
the Saudi Electricity Company has received SAR1.56 billion
(USD0.4 billion) to roll out FTTP to 10% of premises by 2020.
Incumbent STC has also received government funding to deploy
FTTP to 1.3 million premises by the end of 2020. In Egypt,
government-backed incumbent Telecom Egypt is also offering
wholesale access and has largely completed its nationwide FTTC-
VDSL roll-out. It is also deploying FTTP and aims to cover 2 million
premises (7% of all premises).
Figure 13: NGA coverage by technology, Middle East and North
Africa, 2017–2025
Figure 14: FTTx capex by technology, Middle East and North
Africa, 2017–2025
20

FTTx coverage and capex: worldwide trends and forecasts 2019–2025
Contents Worldwide trends
Regional trends
Western Europe
Central and Eastern Europe
Middle East and North Africa
Sub-Saharan Africa
China
Rest of emerging Asia-Pacific
Developed Asia-Pacific
North America
Latin America
Forecast methodology and assumptions
About the author and Analysys Mason

FTTx coverage and capex: worldwide trends and forecasts 2019–2025
NGA coverage in Sub-Saharan Africa is constrained by affordability, the high cost of
deployment and the lack of availability of fibre backbone infrastructure
We forecast that by the end of 2025, NGA coverage will be well
below 10% of all premises in all countries that we provide
individual forecasts for, with the exception of South Africa.
Challenges remain around the affordability of fixed broadband in
SSA. The proportion of income spent on mobile is much higher in
this region than in other regions and constrains the ability to
spend on fixed broadband. In South Africa, Vumatel is trying to
assuage concerns about affordability by launching prepaid FTTP
offers. These offers reduce the barriers to subscribing by
eliminating installation charges. Vumatel has passed around
600 000 premises and its expansion into lower-income markets
with its prepaid offer could mean that it passes another 700 000
premises, equivalent to around 4% of all premises in the country.
Infrastructure and cost present further challenges in Sub-
Saharan Africa. The absence of fibre backbone infrastructure
hinders the roll-out of FTTP and the cost of such access network
deployments is likely to be higher than in other emerging market
regions. This helps to explain why some operators are moving
towards deploying fixed-wireless access. For example, Airtel in
Nigeria launched 4G fixed-wireless access in more than 130
towns and cities in August 2019. In South Africa, FTTP costs per
home passed and connected are both particularly high. This helps
explain why Rain in South Africa was one of the first operators in
the world to launch 5G fixed-wireless. Right-of-way issues also
severely hinder FTTP roll-outs in the SSA region.
Figure 15: NGA coverage by technology, Sub-Saharan Africa,
2017–2025
Figure 16: FTTx capex by technology, Sub-Saharan Africa,
2017–2025
22
0.0
0.1
0.1
0.2
0.2
0.3
0.3
0.4
20
17
20
18
20
19
20
20
20
21
20
22
20
23
20
24
20
25
FTTx c
ap
ex (
US
D b
illio
n)
Other FTTx
FTTP
Source: Analysys Mason
0%
1%
2%
3%
4%
5%
6%
7%
8%
9%
10%
20
17
20
18
20
19
20
20
20
21
20
22
20
23
20
24
20
25
Pe
rce
nta
ge
of
pre
mis
es p
assse
d
Cable, but not FTTx
FTTx, but not FTTP
FTTP
Source: Analysys Mason

FTTx coverage and capex: worldwide trends and forecasts 2019–2025
Contents Worldwide trends
Regional trends
Western Europe
Central and Eastern Europe
Middle East and North Africa
Sub-Saharan Africa
China
Rest of emerging Asia-Pacific
Developed Asia-Pacific
North America
Latin America
Forecast methodology and assumptions
About the author and Analysys Mason

FTTx coverage and capex: worldwide trends and forecasts 2019–2025
FTTP coverage is already very high in China and the focus has shifted to upgrading
to next-generation PON
There is little scope for further expansion of FTTP coverage in
China. We have therefore not altered our forecast from last year
that 96% of the country’s premises will be passed by the end of
2025.
However, the total FTTP coverage figure obscures the fact that we
forecast that China Mobile will continue to increase its FTTP
coverage: the company planned to reach 70% of households with
fibre by the end of 2017 and we estimate that total non-
incumbent FTTP coverage will reach 90% of premises by the end
of 2025.
We also estimate that upgrades of all legacy FTTx deployments to
FTTP will be complete by the end of 2021. An indication of the
near-completion of the migration to FTTP is that 96% of China
Telecom’s fixed broadband subscribers took FTTP by the end of
2018, compared with 86% 2 years earlier.
There is greater activity around expanding gigabit coverage and
extending next-generation PON deployments. China Mobile has
been deploying 10 GPON in Shanghai and it is estimated that by
the end of 3Q 2019, gigabit broadband coverage had been
extended to all of the administrative districts in the city. China
Telecom also completed a city-wide deployment in Shanghai of 10
GPON in October 2018 for a reported cost of USD144 million. By
mid-2019 China Telecom stated that 180 cities were gigabit-
enabled although this did not represent an increase from the end
of 2018.
Figure 17: NGA coverage by technology, China, 2017–2025
Figure 18: FTTx capex by technology, China, 2017–2025
24
75%
80%
85%
90%
95%
100%
20
17
20
18
20
19
20
20
20
21
20
22
20
23
20
24
20
25
Pe
rce
nta
ge
of
pre
mis
es p
assse
d
Cable, but not FTTx
FTTx, but not FTTP
FTTP
Source: Analysys Mason
0
2
4
6
8
10
12
14
20
17
20
18
20
19
20
20
20
21
20
22
20
23
20
24
20
25
FTTx c
ap
ex (
US
D b
illio
n)
Other FTTx
FTTP
Source: Analysys Mason

FTTx coverage and capex: worldwide trends and forecasts 2019–2025
Contents Worldwide trends
Regional trends
Western Europe
Central and Eastern Europe
Middle East and North Africa
Sub-Saharan Africa
China
Rest of emerging Asia-Pacific
Developed Asia-Pacific
North America
Latin America
Forecast methodology and assumptions
About the author and Analysys Mason

FTTx coverage and capex: worldwide trends and forecasts 2019–2025
The number of FTTP deployments in several countries in the EMAP region increased
in 2019 and this momentum will continue
We have adjusted our forecast figures from last year, and now
forecast that fibre coverage will increase more rapidly in a
number of countries in emerging Asia–Pacific (excluding China).
Telkom Indonesia had already passed 30 million premises with
FTTx at the end of 2018, and we estimate that its FTTP coverage
will reach 62 million premises by the end of 2025, equivalent to
66% of all premises in Indonesia. Strong take-up from existing
deployments and relatively low fibre coverage help to explain the
forecasted increase in coverage.
We have increased our end-of-year 2025 NGA coverage for the
Philippines to 66% (it was 50% in last year’s forecast). This is
because the challenger Converge ICT has received further financial
backing for its ambitious FTTP roll-out plans. Competition from
Converge ICT will also spur incumbent PLDT to deploy more FTTP.
We have also adjusted our forecast upwards for fibre coverage in
Malaysia due to the impact of government funding for fibre roll-
out in the form of the National Fiberisation and Connectivity Plan.
We estimate that NGA coverage will reach 78% of all premises by
the end of 2025. The remaining premises are in rural areas,
where the costs of roll-out are much higher and where 5G fixed-
wireless coverage is an option.
We also expect more-extensive FTTP roll-outs in India compared
with last year. Reliance Jio is aiming to pass 75 million premises
with FTTP by the end of 2022 and 35 million premises in its first
year of operating the network.
Figure 19: NGA coverage by technology, emerging Asia–Pacific
excluding China, 2017–2025
Figure 20: FTTx capex by technology, emerging Asia–Pacific
excluding China, 2017–2025
26
0%
10%
20%
30%
40%
50%
60%
70%
80%
90%
100%
20
17
20
18
20
19
20
20
20
21
20
22
20
23
20
24
20
25
Pe
rce
nta
ge
of
pre
mis
es p
assse
d
Cable, but not FTTx
FTTx, but not FTTP
FTTP
Source: Analysys Mason
0.0
2.0
4.0
6.0
8.0
10.0
12.0
14.0
16.0
20
17
20
18
20
19
20
20
20
21
20
22
20
23
20
24
20
25
FTTx c
ap
ex (
US
D b
illio
nOther FTTx
FTTP
Source: Analysys Mason

FTTx coverage and capex: worldwide trends and forecasts 2019–2025
Contents Worldwide trends
Regional trends
Western Europe
Central and Eastern Europe
Middle East and North Africa
Sub-Saharan Africa
China
Rest of emerging Asia-Pacific
Developed Asia-Pacific
North America
Latin America
Forecast methodology and assumptions
About the author and Analysys Mason

FTTx coverage and capex: worldwide trends and forecasts 2019–2025
Several drivers explain the growth in the number of next-generation PON
deployments in developed Asia–Pacific
NGA coverage is already high in most countries in developed
Asia–Pacific; government-backed roll-outs in New Zealand and
Australia are closing the gap with the rest of the region.
In New Zealand and Australia, NGA coverage reached 86% and
91% of all premises, respectively, at the end of 2019. This reflects
strong progress with the UFB initiatives in New Zealand and the
NBN roll-out in Australia.
The number of deployments of next-generation PON deployments
is higher in DVAP than any other region. In Singapore, the
availability of passive FTTP unbundling encouraged active
operators (which are also retailers) to roll out 10GPON (XGPON1)
some years ago in order to remain competitive. This strategy may
be replicated in New Zealand where Vodafone and Vocus have
expressed interest in using PON unbundling offers. In turn, this
has encouraged Chorus to roll out XGSPON from 2020 onwards.
In other markets in DVAP, competition from non-incumbent
infrastructures can encourage next-generation PON deployments.
For example, competition from HKBN was a driver for Hong Kong
incumbent HKT’s early deployment of XGPON1. In South Korea,
operators have had success in boosting ARPU with gigabit offers
and are looking to reproduce this with multi-gigabit access,
enabled by upgrades to next-generation PON technologies
(XGSPON for SK Telecom and 10GEPON for Korea Telecom). In
South Korea and elsewhere, the higher speeds enabled by next-
generation PON technologies can also avert any substitution
threat posed by the launch of 5G.
Figure 21: NGA coverage by technology, developed Asia–Pacific,
2017–2025
Figure 22: FTTx capex by technology, developed Asia–Pacific,
2017–2025
28
0%10%20%30%40%50%60%70%80%90%
100%
20
17
20
18
20
19
20
20
20
21
20
22
20
23
20
24
20
25
Pe
rce
nta
ge
of
pre
mis
es p
assse
d
Cable, but not FTTx
FTTx, but not FTTP
FTTP
Source: Analysys Mason
0.00.5
1.01.52.02.53.03.54.04.55.0
20
17
20
18
20
19
20
20
20
21
20
22
20
23
20
24
20
25
FTTx c
ap
ex (
US
D b
illio
nOther FTTx
FTTP
Source: Analysys Mason

FTTx coverage and capex: worldwide trends and forecasts 2019–2025
Contents Worldwide trends
Regional trends
Western Europe
Central and Eastern Europe
Middle East and North Africa
Sub-Saharan Africa
China
Rest of emerging Asia-Pacific
Developed Asia-Pacific
North America
Latin America
Forecast methodology and assumptions
About the author and Analysys Mason

FTTx coverage and capex: worldwide trends and forecasts 2019–2025
The number of new fibre entrants in North America is far fewer than in Western
Europe
Relatively few announcements have been made in the last year
about new major wireline infrastructure projects in North America.
Incumbent operators in North America have more incentive to use
fixed-wireless to complement fibre than their counterparts in
Europe. In Canada, Bell intends to cover 1 million hard-to-reach
premises (6% of all premises in the country) with 4G fixed-
wireless using spectrum in the 3.5GHz band. In addition, rather
than focusing on using FTTP to expand coverage beyond its
franchise area, Verizon is using 5G mmWave fixed-wireless. Little
progress has been made on this deployment in the last year and
the 5G Home service is still only available in certain areas within
five cities. FTTP costs per home passed and connected are
significantly higher for both Bell and Verizon than is the case for
operators in most of Western Europe, which helps to explain the
choice of fixed-wireless. The high cost of FTTP deployment also
helps to explain why there has been an absence of third wireline
infrastructure deployments to compete with those of incumbents
and near-ubiquitous cable networks.
AT&T is also reducing investment after completing the tranche of
fibre roll-out required by the FCC as part of the approval for
AT&T’s acquisition of pay-TV provider DirecTV.
Migration from FTTC-VDSL to FTTP continues in North America. In
Canada, we estimate that FTTC-VDSL covered 45% of all premises
at the end of 2017. This figure had fallen to 33% at the end of
2019 due to overbuilds of FTTC with FTTP conducted by Telus and
Bell.
Figure 23: NGA coverage by technology, North America, 2017–
2025
Figure 24: FTTx capex by technology, North America, 2017–
2025
30
0%
10%
20%
30%
40%
50%
60%
70%
80%
90%
100%
20
17
20
18
20
19
20
20
20
21
20
22
20
23
20
24
20
25
Pe
rce
nta
ge
of
pre
mis
es p
assse
d
Cable, but not FTTx
FTTx, but not FTTP
FTTP
Source: Analysys Mason
0
2
4
6
8
10
12
14
16
20
17
20
18
20
19
20
20
20
21
20
22
20
23
20
24
20
25
FTTx c
ap
ex (
US
D b
illio
nOther FTTx
FTTP
Source: Analysys Mason
FTTx coverage and capex: worldwide trends and forecasts 2019–2025
Contents Worldwide trends
Regional trends
Western Europe
Central and Eastern Europe
Middle East and North Africa
Sub-Saharan Africa
China
Rest of emerging Asia-Pacific
Developed Asia-Pacific
North America
Latin America
Forecast methodology and assumptions
About the author and Analysys Mason

FTTx coverage and capex: worldwide trends and forecasts 2019–2025
Investment in FTTx networks in LATAM continues to be strong, although this will slow
down during the forecast period
We expect that by the end of 2025, total NGA coverage will reach
60–75% of all premises in all the countries in LATAM that we
provide individual forecasts for (with the exception of Uruguay).
Incumbents in the LATAM region continue to announce FTTP
coverage expansion plans. Oi in Brazil is a prominent example of
this: it intends to cover 16 million premises (or 23%) of the
country’s premises by the end of 2021. This roll-out is being
funded partly through Oi’s divestment of non-core assets,
including its Angolan subsidiary. Oi’s deployments of FTTP have
previously lagged behind those of other operators in Brazil and it
has faced a strong threat to its existing broadband business from
Telefónica, cable operator NET Servicos and new fibre entrants.
Investment from non-incumbent operators, typically MNOs or
other third parties, has increased. Examples of this include
Claro’s FTTP deployment in Peru, which adds to the FTTP
deployment of fellow MNO Bitel. These roll-outs are more focused
on underserved inland areas. In Brazil, towerco American Tower
has a partnership with Vivo whereby American Tower will provide
the investment and construct and manage the fibre network and
Vivo will offer services to end users and supply the CPE. In Brazil,
a process of consolidation of smaller regional fibre ISPs is also
ongoing. For example, Vinci Partners is the largest shareholder in
Vero Internet, which has been formed from the consolidation of
eight regional providers in Minas Gerais. Vinci Partners intends to
spend BRL500–750 million (USD109–152 million) – including
the money spent on the acquisitions – in the next 5 years.
Figure 25: NGA coverage by technology, Latin America, 2017–
2025
Figure 26: FTTx capex by technology, Latin America, 2017–
2025
32
0%
10%
20%
30%
40%
50%
60%
70%
80%
90%
100%
20
17
20
18
20
19
20
20
20
21
20
22
20
23
20
24
20
25
Pe
rce
nta
ge
of
pre
mis
es p
assse
d
Cable, but not FTTx
FTTx, but not FTTP
FTTP
Source: Analysys Mason
0.00.51.01.52.02.53.03.54.04.55.0
20
17
20
18
20
19
20
20
20
21
20
22
20
23
20
24
20
25
FTTx c
ap
ex (
US
D b
illio
nOther FTTx
FTTP
Source: Analysys Mason

FTTx coverage and capex: worldwide trends and forecasts 2019–2025
Contents Worldwide trends
Regional trends
Western Europe
Central and Eastern Europe
Middle East and North Africa
Sub-Saharan Africa
China
Rest of emerging Asia-Pacific
Developed Asia-Pacific
North America
Latin America
Forecast methodology and assumptions
About the author and Analysys Mason

FTTx coverage and capex: worldwide trends and forecasts 2019–2025
Figure 27: Countries covered in this report, by region
34
Geographical scope: forecasts are provided for 64 countries in 8 regions
EMERGING MARKETS
DEVELOPED MARKETS
North America Western Europe
Developed
Asia–Pacific
Central and
Eastern Europe
▪ Canada
▪ USA▪ Austria
▪ Belgium
▪ Denmark
▪ Finland
▪ France
▪ Germany
▪ Greece
▪ Iceland
▪ Ireland
▪ Italy
▪ Netherlands
▪ Norway
▪ Portugal
▪ Spain
▪ Sweden
▪ Switzerland
▪ UK
▪ Australia
▪ Hong Kong
▪ Japan
▪ New Zealand
▪ Singapore
▪ South Korea
▪ Taiwan
▪ Bulgaria
▪ Croatia
▪ Czech Republic
▪ Estonia
▪ Hungary
▪ Latvia
▪ Lithuania
▪ Poland
▪ Romania
▪ Russia
▪ Serbia
▪ Slovakia
▪ Slovenia
▪ Turkey
▪ Ukraine
The Middle East
and Africa
Emerging
Asia–Pacific
Latin America
▪ Israel
▪ Oman
▪ Qatar
▪ Saudi Arabia
▪ UAE
▪ China
▪ India
▪ Indonesia
▪ Malaysia
▪ Philippines
▪ Thailand
▪ Vietnam
▪ Argentina
▪ Brazil
▪ Chile
▪ Colombia
▪ Mexico
▪ Peru
▪ Uruguay
Sub-Saharan Africa
▪ Ghana
▪ Kenya
▪ Nigeria
▪ South Africa
Source: Analysys Mason
FTTx coverage and capex: worldwide trends and forecasts 2019–2025
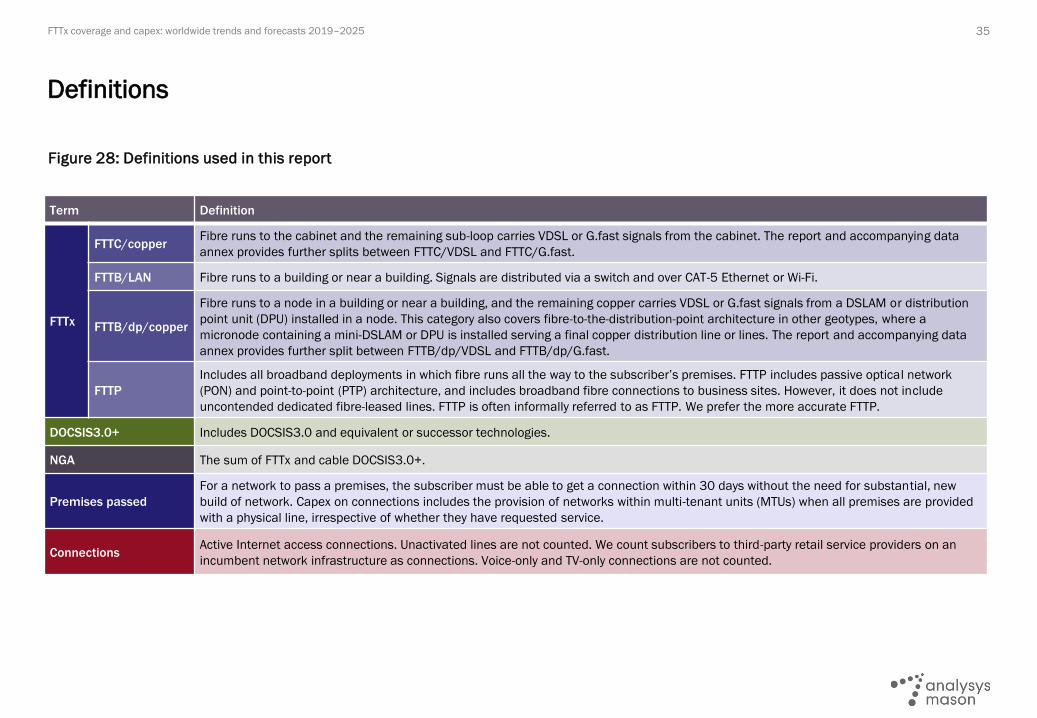
Figure 28: Definitions used in this report
35
Definitions
Term Definition
FTTx
FTTC/copperFibre runs to the cabinet and the remaining sub-loop carries VDSL or G.fast signals from the cabinet. The report and accompanying data
annex provides further splits between FTTC/VDSL and FTTC/G.fast.
FTTB/LAN Fibre runs to a building or near a building. Signals are distributed via a switch and over CAT-5 Ethernet or Wi-Fi.
FTTB/dp/copper
Fibre runs to a node in a building or near a building, and the remaining copper carries VDSL or G.fast signals from a DSLAM or distribution
point unit (DPU) installed in a node. This category also covers fibre-to-the-distribution-point architecture in other geotypes, where a
micronode containing a mini-DSLAM or DPU is installed serving a final copper distribution line or lines. The report and accompanying data
annex provides further split between FTTB/dp/VDSL and FTTB/dp/G.fast.
FTTP
Includes all broadband deployments in which fibre runs all the way to the subscriber’s premises. FTTP includes passive optical network
(PON) and point-to-point (PTP) architecture, and includes broadband fibre connections to business sites. However, it does not include
uncontended dedicated fibre-leased lines. FTTP is often informally referred to as FTTP. We prefer the more accurate FTTP.
DOCSIS3.0+ Includes DOCSIS3.0 and equivalent or successor technologies.
NGA The sum of FTTx and cable DOCSIS3.0+.
Premises passed
For a network to pass a premises, the subscriber must be able to get a connection within 30 days without the need for substantial, new
build of network. Capex on connections includes the provision of networks within multi-tenant units (MTUs) when all premises are provided
with a physical line, irrespective of whether they have requested service.
Connections Active Internet access connections. Unactivated lines are not counted. We count subscribers to third-party retail service providers on an
incumbent network infrastructure as connections. Voice-only and TV-only connections are not counted.

FTTx coverage and capex: worldwide trends and forecasts 2019–2025 36
We take baseline costs for each technology and then apply several context-specific
variables to determine total capex
Source: Analysys Mason
Technology
Baseline
cost to pass
Baseline
cost to
connect
Adjusted for
local costs
Adjusted for
local costs
Adjusted for
geo-type
Adjusted for
cost erosion
Adjusted for
cost erosion
Adjusted for
building type
Forecast
coverage
Forecast
conversion
Adjustment
for overbuild
of previous
NGA
=+Capex per
country per
technology
Active
equipment unit
costs
Passive
equipment unit
costs
Labour and
cost of physical
infrastructure
Based on real
capex
benchmarks
Labour rates
Availability of
physical
infrastructure
Topology of
existing copper
for FTTC (lines
per cabinet)
Likelihood of
vendor
discounts
General unit
cost erosion
Additional costs
such as
vectoring
Labour
efficiencies
over time
(deskilling)
FTTC/VDSL
FTTB/VDSL
FTTB/LAN
FTTP
If an operator
shifts from, for
example,
FTTB/VDSL to
FTTP, then
assume some
costs already
sunk
For FTTP,
separate
calculations
are made for
incumbent and
for other
operators.
Therefore, the
cost of overlaid
networks is
taken into
account
×
×
Figure 29: Capex model outline
▪ Forecast levels of coverage are what we consider to be the most likely outcome based on operators’ plans. Conversion takes into
account macro-economics and inter- and intra-country trends, which we monitor on a quarterly basis. Our capex forecasts are derived
as follows.

FTTx coverage and capex: worldwide trends and forecasts 2019–2025
Figure 30: Basic overview of FTTx network topologies and elements
37
Top-level breakdown of the relative costs of FTTx technologies: basic topologies
Source: Analysys Mason
Switch MSANs New modemFibre mostly in
existing duct
Existing
copper
Existing
copper
Switch New modem
Basement MSANs
Outdoor micro-
nodes
Fibre mostly in
existing duct
Existing
copperSplitter/switch
Fibre mostly in
existing duct
OLT Splitter ONUFibre mostly in
existing duct
Fibre mostly in
existing duct
In-building or aerial
fibre
OLT Switch ONUFibre mostly in
existing duct
In-building
or aerial fibre
Fibre mostly in
existing duct
Basement
switch
Fibre CAT 5
or Wi-FiSwitch
Fibre
mostly aerial
Other point
of interconnection
▪ Our assumptions on capital costs are based on a breakdown of network elements for the five main kinds of telco NGA deployment:
FTTC/VDSL, FTTB/VDSL, FTTB/LAN, FTTP/GPON and FTTP/PTP. In each case (except FTTB/LAN), our starting point is a typical urban
exchange serving 12 000 residential subscribers, connecting to 80 cabinets, each serving 150 subscribers, with each cabinet
connecting to distribution points typically serving 10 subscribers. FTTB/LAN costs are simply built on benchmarks because they will
vary greatly.

FTTx coverage and capex: worldwide trends and forecasts 2019–2025
Contents Worldwide trends
Regional trends
Western Europe
Central and Eastern Europe
Middle East and North Africa
Sub-Saharan Africa
China
Rest of emerging Asia-Pacific
Developed Asia-Pacific
North America
Latin America
Forecast methodology and assumptions
About the author and Analysys Mason

FTTx coverage and capex: worldwide trends and forecasts 2019–2025
About the author
39
Stephen Wilson (Principal Analyst) is the lead analyst for Analysys Mason’s Fixed Broadband Services research programme. He leads Analysys
Mason’s annual FTTx coverage, capex and conversion forecasts, and other recent areas of focus include examining fixed broadband operators’
home Wi-Fi strategies. Stephen has more than 10 years of experience in the telecoms sector and is a graduate in Philosophy, Politics and
Economics from St Catherine's College, Oxford University.

FTTx coverage and capex: worldwide trends and forecasts 2019–2025
CONSULTING
We deliver tangible benefits to clients across the telecoms
industry:
▪ communications and digital service providers, vendors,
financial and strategic investors, private equity and
infrastructure funds, governments, regulators, broadcasters,
and service and content providers.
Our sector specialists understand the distinct local challenges
facing clients, in addition to the wider effects of global forces.
We are future-focused and help clients understand the challenges
and opportunities that new technology brings.
RESEARCH
Our dedicated team of analysts track and forecast the different
services accessed by consumers and enterprises.
We offer detailed insight into the software, infrastructure and
technology delivering those services.
Clients benefit from regular and timely intelligence, and direct
access to analysts.
Analysys Mason’s consulting services and research portfolio
40
Analysys Mason’s consulting and research are uniquely positioned

FTTx coverage and capex: worldwide trends and forecasts 2019–2025
Research from Analysys Mason
41

FTTx coverage and capex: worldwide trends and forecasts 2019–2025
Consulting from Analysys Mason
42

FTTx coverage and capex: worldwide trends and forecasts 2019–2025
PUBLISHED BY ANALYSYS MASON LIMITED IN MARCH 2020
Bush House • North West Wing • Aldwych • London • WC2B 4PJ • UK
Tel: +44 (0)20 7395 9000 • Email: [email protected] • www.analysysmason.com/research • Registered in England and Wales No. 5177472
© Analysys Mason Limited 2020. All rights reserved. No part of this publication may be reproduced, stored in a retrieval system or transmitted in any form or by any means – electronic,
mechanical, photocopying, recording or otherwise – without the prior written permission of the publisher.
Figures and projections contained in this report are based on publicly available information only and are produced by the Research Division of Analysys Mason Limited independently of any
client-specific work within Analysys Mason Limited. The opinions expressed are those of the stated authors only.
Analysys Mason Limited recognises that many terms appearing in this report are proprietary; all such trademarks are acknowledged and every effort has been made to indicate them by the
normal UK publishing practice of capitalisation. However, the presence of a term, in whatever form, does not affect its legal status as a trademark.
Analysys Mason Limited maintains that all reasonable care and skill have been used in the compilation of this publication. However, Analysys Mason Limited shall not be under any liability for
loss or damage (including consequential loss) whatsoever or howsoever arising as a result of the use of this publication by the customer, his servants, agents or any third party.


