59
Fubon Year 2010 Q1 Overview 2010.05.06 1

Fubon Year 2010 Q1 Overview
2010.05.06
1

Disclaimer
This meeting may contain forward-looking statements with respect to the financial
condition, results of operations and business of the company. These forward-looking
statements represent the company’s expectations or beliefs concerning future events
and involve known and unknown risks and uncertainty that could cause actual
results, performance or events to differ materially from those expressed. Certain
statements, such as those that include the words “potential”, “estimated”, and similar
expressions or variations on such expressions may be considered “forward-looking
statements”.
2
Agenda
Performance highlights of the group
Performance review of banking business
Performance review of insurance business
Update on CDO exposure
3
Fubon Life Year 2009 Embedded Value
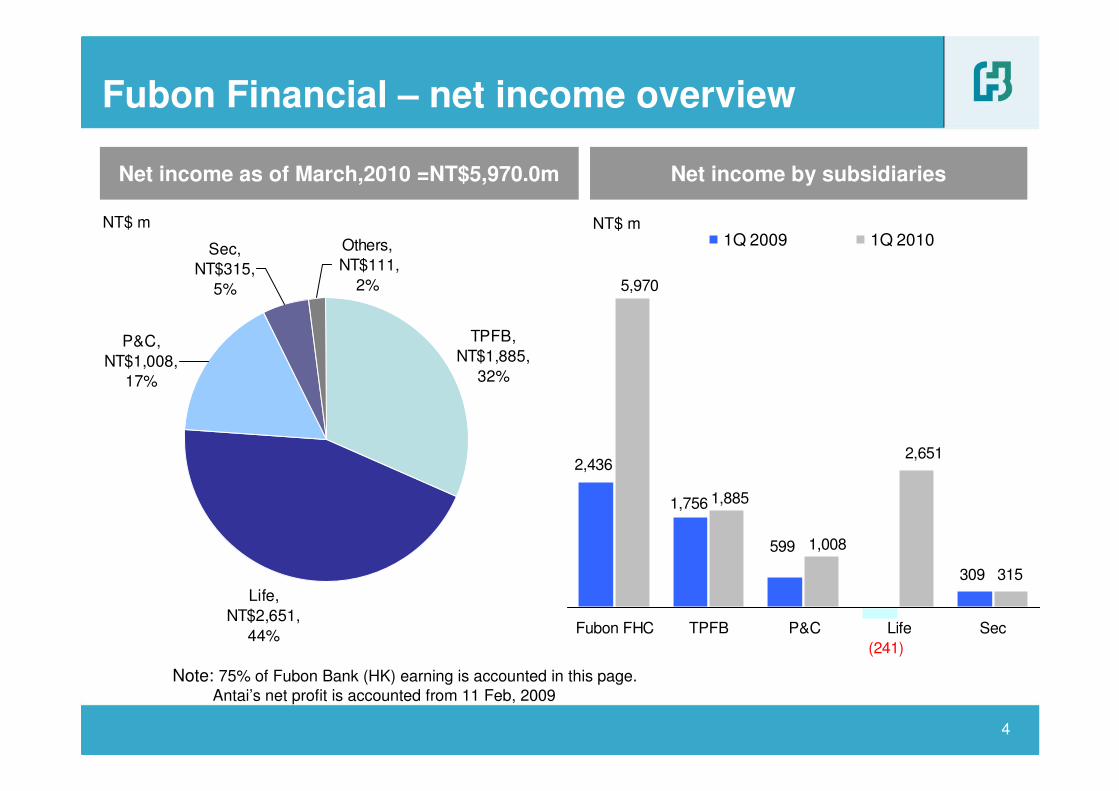
2,436
1,756
(241)
309
599
315
1,008
1,885
2,651
5,970
Fubon FHC TPFB P&C Life Sec
1Q 2009 1Q 2010
Fubon Financial – net income overview
NT$ m
Note: 75% of Fubon Bank (HK) earning is accounted in this page.Antai’s net profit is accounted from 11 Feb, 2009
Net income as of March,2010 =NT$5,970.0m
NT$ m
Net income by subsidiaries
4
Life,
NT$2,651,
44%
TPFB,
NT$1,885,
32%
Sec,
NT$315,
5%
Others,
NT$111,
2%
P&C,
NT$1,008,
17%

Fubon Financial – Return on assets and return on equity
Return on assets Return on equity
0.50%
0.82%
0.57%
0.79% 0.77%
2006 2007 2008 2009 3M 2010
5.3%
8.8%
7.0%
11.3% 11.4%
2006 2007 2008 2009 3M 2010
5
* Note : Annualized basis
* *

Fubon Financial – Per share calculations
Book value per share (NT$) EPS (NT$)
1.09
1.87
1.41
2.44
0.73
2006 2007 2008 2009 3M 2010
21.19 21.47
18.62
25.66 25.79
2006 2007 2008 2009 3M 2010
6

Changed
in 2009 in 1Q10
Balance
Dec 09
(NT$18,316)
+NT$ 35,716
NT$17,400
(NT$ 4,877)
NT$12,523
Balance
Mar 10
Available-for-sale movement in shareholder equity
Fubon FHC
NT$ m
Constituent of AFS
7
BalanceDec 08
Changed
(16,486)(16,486)Minus : Antai Life on merger date (2/11/09)
30,61026,602Fubon Life
(192)(155)Minus :
Other adjustment*
1,218541Fubon Insurance
446195Fubon Securities
17,40012,523Fubon FHC
125312Other subsidiaries
1,6791,514Taipei Fubon Bank
Dec-2009Mar-2010NT$ m
*Note: Other adjustment refers to the mark-to-market value of Antai’s share holding in Fubon FHC before merger. The shares are to be disposed within three years according to Securities and Exchange Act.

� Hidden book value came from book value of Antai Life
(NT$45.5bn on merger date) was higher than transaction
cost (NT$20.4bn)
� From a peer comparison perspective (e.g. P/B multiple),
the hidden book value could be added into the statuary
book value to be comparable.
FHC consolidated balance sheet on merger date*FHC consolidated balance sheet on merger date*
Equity
+ $8.9bn
Liabilities
+$598.1bn
+$33.8bn
+ $11.5bn
Assets
+$643.6bn
+$8.69bn
Antai’s book assets
Assets write-up from:
$8.6bn goodwill
$464m intangible assets
Other adjustments
Antai’s book liabilities
Liabilities write-up
Debt issuance
New share issuance@$21.7/share5% new shares
NT$bn
Merger accounting of Fubon Life
P&L related accountsP&L related accounts
� Revenue: recovery gains of policy reserve
� Recovery came from policy maturity, surrender
and lapse. Liabilities write up balance will
reduce accordingly. It is accounted on a
monthly basis and shown in audited report.
� Cumulative recovery gains as of March 2010
was NT$972m.
� We estimate annual recovery of NT$600~700m
in the next 15 years. Total recovery period is
estimated at 99 years.
� Expense: reduction after debt refinance
� Interest expense booked in 2009 was
NT$615m. The refinance exercise of NT$11bn
in Feb 2010 brought average funding cost to
2.28% from originally 6.326%. Average annual
interest expense would reduce to NT250m in
the next 6 years.
� Cumulative amortization of intangible assets as
of March 2010 was NT$174m. Remaining
amortization period is two years.
� Goodwill amortization is subject to impairment
test. There is no impairment loss in 2009.*Note: Antai merged into Fubon FHC on 2/11/2009
8

Sec, NT$48
, 1%PC, NT$65
, 2%
AM, NT$1
, 0%
Life, NT$1,433
, 45%
FBHK, NT$240
, 8%
TPFB, NT$1,402
, 44%
TPFB
FBHK
Life
PC
Sec
AM
Assets breakdown by subsidiaries
Total assets=NT$3,176.2 billion(31 March, 2010)
NT$bn
Note: Pie charts & statistics represent breakdown of six major subsidiaries.
9

Fubon Financial – Profit breakdown by business groups
Pretax profit by business groups – 1Q 2010 Pretax profit- Business group
Wealth
Mgmt,
NT$712 ,
10%
Insurance,
NT$3,688 ,
50%
Inv Mgmt,
NT$443 ,
6%
Consumer
Fin, NT$848
, 11%
Corp & Inv
Bk,
NT$1,391 ,
19%
Fin Mkt,
NT$308 ,
4%
886
(358)
1,241
308
712
1,391
Fin Mkt Wealth Mgmt Corp & Inv Bk
1Q 2009 1Q 2010
463166
496
3,688
443848
Insurance Inv Mgmt Consumer Fin
10
NT$ m NT$ m
Agenda
Performance highlights of the group
Performance review of banking business
Performance review of insurance business
Update on CDO exposure
11
Fubon Life Year 2009 Embedded Value

128.8 123.1 142.1 150.7185.2
389.2 390.9 380.6 368.8
246.3 258.1 271.2 277.9
281.7
381.1
21.5 22.5 21.7 23.422.5
8.7
8.78.78.9
8.713.1 12.311.7
10.411.2
Mar-09 Jun-09 Sep-09 Dec-09 Mar-10
Credit CardRevolving
Consumer -unsecured
Consumer - secured
Mortgage
Corporate
Government
Taipei Fubon Bank – Loan breakdown
Note: (1) Overdue loans not included.
(2) Cash card loans are under unsecured consumer portfolio. Outstanding balance NT$80m as of March 2010.
840.7836.0815.7 889.7807.6 YTD +5.8%YoY +10.2%
YTD +22.9%
YTD +1.4%
YTD +3.3%
Total loans (1) (NT$bn)
12

81.5% 81.5% 80.7% 77.5% 80.5%
Mar-09 Jun-09 Sep-09 Dec-09 Mar-10
Taipei Fubon Bank-Loan & Deposit
Loan growth YoY
Deposit growth YoY
Fubon’s Loan/ Deposit ratio
-1.5%
3.5%
8.5%
13.5%
1Q08 2Q08 3Q08 4Q08 1Q09 2Q09 3Q09 4Q09 1Q10
Industry Fubon
10.15%
3.06%
0.0%
5.0%
10.0%
15.0%
20.0%
1Q08 2Q08 3Q08 4Q08 1Q09 2Q09 3Q09 4Q09 1Q10
Industry Fubon
10.51%
6.29%
13

32% 36%41% 45% 49%
68% 64%59% 55%
51%
1Q09 2Q09 3Q09 4Q09 1Q10
Lower cost Higher cost
Solid deposit franchise
Averaged NTD deposits mix Averaged USD deposits mix
NT$bn NT$bn
181 172 164 169
14
42% 44% 46% 46% 45%
58% 56% 54% 54% 55%
1Q09 2Q09 3Q09 4Q09 1Q10
Lower cost Higher cost
818 859 878 919 175950

Taipei Fubon Bank – Interest yields overview
15
3.47%
0.46%
1.76%1.77%1.83%1.92%
2.34%
3.66%3.69%3.86%
0.52%0.65%0.76%1.01%
1.65% 1.65% 1.68% 1.59% 1.30%1.25%1.18%1.16%
1.33%
1.88%1.98%
2.04%2.21%
1Q08 2Q08 3Q08 4Q08 1Q09 2Q09 3Q09 4Q09 1Q10
Loan rate(incl. Credit cards)
Deposit rate
Loan deposit spread
3.15%
1.44%1.47%1.54%1.66%
2.12%
3.28%3.32%3.46%
0.51%0.56%0.68%0.78%
1.03%
1.83% 1.74% 1.78% 1.67%
0.96%0.94%0.89%0.90%1.12%1.54%1.58%1.64%1.69%
1Q08 2Q08 3Q08 4Q08 1Q09 2Q09 3Q09 4Q09 1Q10
Avg rate of IEA
Avg rate of IBL
NIM

Taipei Fubon Bank – Interest & fee Income
3,2272,731 2,737 2,945
894
1,082
1,408
3,049
1,3001,457
1Q09 2Q09 3Q09 4Q09 1Q10
Net Fee Income
Net Interest Income
33.1%
4,402
Net Fee/Major Incomes
Major Incomes
21.7%
4,121
28.4%
3,813
32.2%
4,037
31.6%
4,457
Note: Fees booked under insurance agency subsidiaries are excluded.
NT$ m
16

645771
1,0331,202
997
189
210
198
223
236
221
236
288
292
295
118
123
124
12
99
1Q09 2Q09 3Q09 4Q09 1Q10
Other
Corporate banking
Credit card
Wealth management
Taipei Fubon Bank – Net fee income breakdown
Note: Please refer to attachment 4 for definition
69.5% 61.3%62.9%57.6%55.0%
WM fee as % of total banking fee
NT$ m
17

6,812 5,742 3,871 6,244 4,295
13,73622,579
34,375
45,825
36,5931,867
2,996
2,275
3,865
14,179
17,867
16,274
23,083
19,426123
97
14
3,414
337
561
1Q09 2Q09 3Q09 4Q09 1Q10
Collective investment trust funds
Insurance
Structured notes
Foreign Mutual funds
Domestic Mutual funds
Taipei Fubon Bank – Wealth management business
1,202 9971,033771645
Total Wealth Management Fees (NT $m)
79,114
37,155
Note: Others represent collective investment trust funds
Wealth management sales breakdown
NT$ m
49,522
56,919
18
63,744

76.9% 80.3% 76.8%
124.3%111.6%
Mar-09 Jun-09 Sep-09 Dec-09 Mar-10
Taipei Fubon Bank – Quality of loan book
*Note: Credit card revolving included.
Provision & Recovery *
0.73%0.66% 0.65%
0.53%0.47%
Mar-09 Jun-09 Sep-09 Dec-09 Mar-10
NPL ratio
Coverage ratio
Provision as of average loan*
0.12%
230
6,614
615
(647)
262
1Q10
0.74%
1,033
6,384
475
(941)
1,499
4Q09
438434423Recovery
5,3515,5335,922Reserve
(182)(389)96Reserve
Movement
0.34%0.38%0.40%Annualized Credit cost
(1,307)(1,587)(1,129)Write-Off
688762802Provision
3Q092Q091Q09(NT$ m)
19

Corporate loan quality update (1)
Net NPL formation of Corp loans
NT $m
20
NPL ratio and coverage of corporate loans
(LHS) (RHS)
1.47%
0.9%
67.1%
102.0%
0.8%
0.9%
1.0%
1.1%
1.2%
1.3%
1.4%
1.5%
1.6%
Mar-08'
Jun-08'
Sep-08'
Dec-08'
Mar-09'
Jun-09'
Sep-09'
Dec-09'
Mar-10'
30.0%
40.0%
50.0%
60.0%
70.0%
80.0%
90.0%
100.0%
110.0%
NPL ratio Coverage ratio
(300)
(100)
100
300
500
700
900
1,100
1,300
1Q08 2Q08 3Q08 4Q08 1Q09 2Q09 3Q09 4Q09 1Q10
Net formation

Corporate loan quality update (2)
90 days overdue ratio of SME
21
90 days overdue ratio of large corporate
0.32%
0.60%
0.00%
0.20%
0.40%
0.60%
0.80%
1Q08 2Q08 3Q08 4Q08 1Q09 2Q09 3Q09 4Q09 1Q10
3.88%
2.53%
0.00%
2.00%
4.00%
6.00%
1Q08 2Q08 3Q08 4Q08 1Q09 2Q09 3Q09 4Q09 1Q10

Mortgage quality: NPL amount and NPL ratio
Overdue 30+ days loans Overdue 90 day+ loans
Overdue ratio: 30+ day Overdue ratio: 90+ days
NT$ m NT$ m
22
-
300
600
900
1,200
1,500
1,800
Dec-08' Mar-09' Jun-09' Sep-09' Dec-09' Mar-10'
0.22%
0.68%
0.00%
0.20%
0.40%
0.60%
0.80%
Dec-08' Mar-09' Jun-09' Sep-09' Dec-09' Mar-10'
-
300
600
900
1,200
1,500
1,800
Dec-08' Mar-09' Jun-09' Sep-09' Dec-09' Mar-10'
0.50%
0.19%
0.00%
0.20%
0.40%
0.60%
0.80%
Dec-08' Mar-09' Jun-09' Sep-09' Dec-09' Mar-10'

Agenda
Performance highlights of the group
Performance review of banking business
Performance review of insurance business
Update on CDO exposure
23
Fubon Life Year 2009 Embedded Value
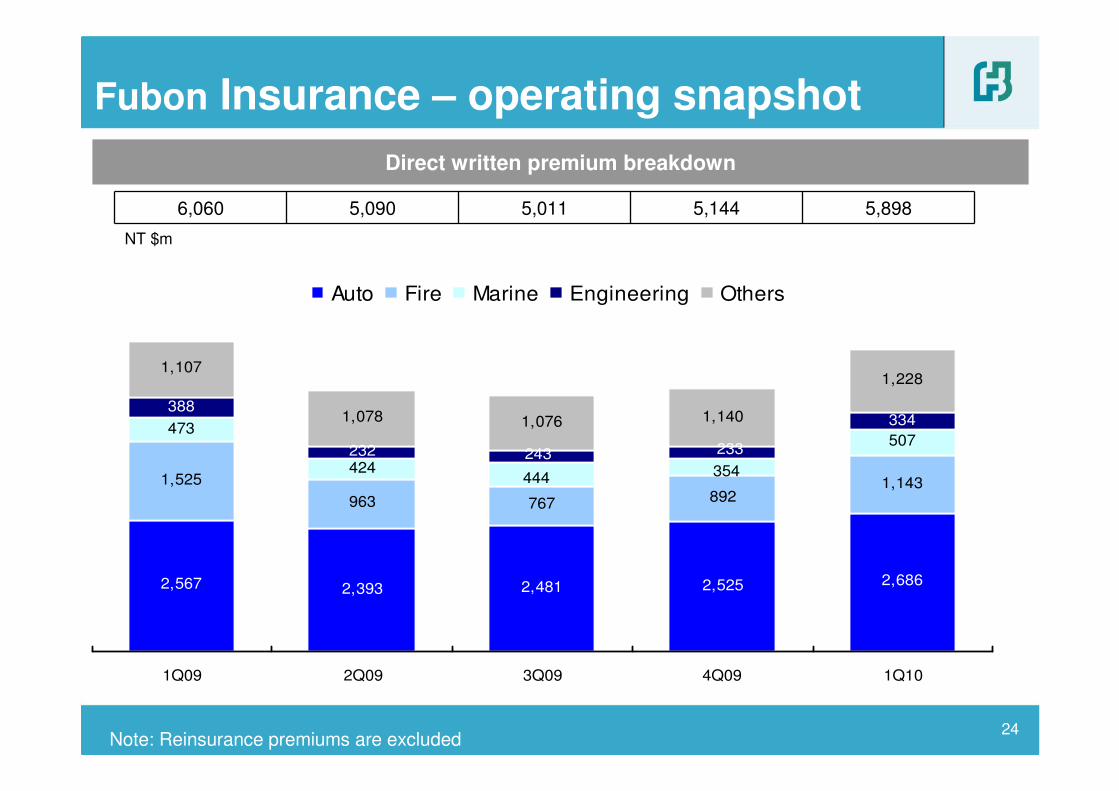
2,567 2,393 2,481 2,525 2,686
1,525
963 767 8921,143
473
424
507
388
232
334
1,107
1,078 1,076 1,140
1,228
444 354243 233
1Q09 2Q09 3Q09 4Q09 1Q10
Auto Fire Marine Engineering Others
Fubon Insurance – operating snapshot
Direct written premium breakdown
NT $m
Note: Reinsurance premiums are excluded24
5,1445,0115,090 5,8986,060

Net combined ratio
40.7%49.9%
55.9% 52.2% 53.6%
36.1%
35.1%32.8%
33.4% 38.5%
1Q09 2Q09 3Q09 4Q09 1Q10
Net Claim Ratio Net Expense Ratio
Fubon Insurance – Net combined ratio
76.8%82.7%
89.3% 90.7%
25
88.7%

9,3562,934
20,720
11,625
29,942
43,988 47,327
5,140
6,666
2,8171,121
18,782
1,797 921 163
1,20715,472
15,974
12,656
20,7701,654
1,791
1,093
1,1951,176
1Q09 2Q09 3Q09 4Q09 1Q10
Health, Accidents and others
Traditional Life
Investment-Linked
Interest-Sensitive Annuity
Interest-Sensitive Life
Fubon Life- FYP breakdown by products
56,034 67,703 70,55736,96245,032
FYP breakdown by products
NT $m
Note: data before the merger of Fubon and Antai is on a pro-forma basis
26
484 752 494
1,818
4,577 4,859
08' quarterly
average
09' quarterly
average
1Q10
Health Higher margin traditional life
Sum
2,302
5,328 5,353

Note: data before the merger of Fubon and Antai is on a pro-forma basis 27
Fubon Life- FYP breakdown by products
FYP breakdown by products
21%
8%3% 1%
46%
31%
53%65% 67%
3%
14%
12%
4% 2%
28%
42%
29% 28% 29%
2% 5% 3% 2% 2%
0%
1Q09 2Q09 3Q09 4Q09 1Q10
Health, Accidents and others
Traditional Life
Investment-Linked
Interest-Sensitive Annuity
Interest-Sensitive Life
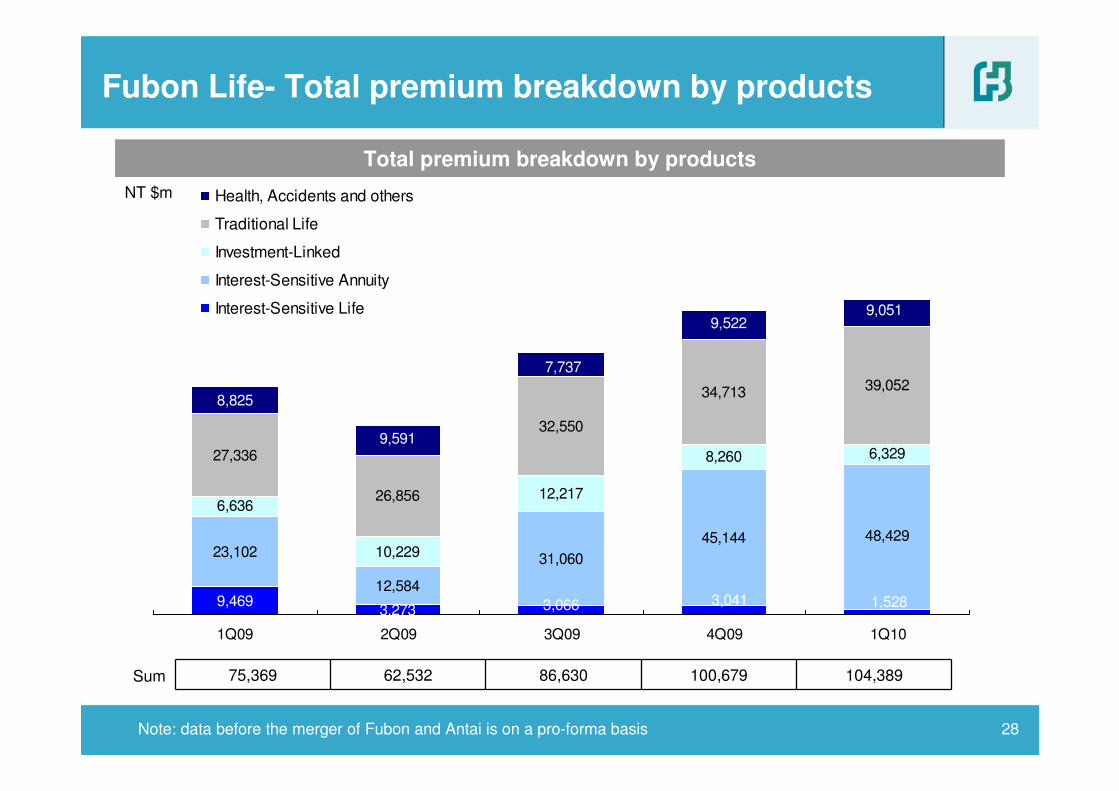
9,4693,273
23,102
12,584
31,060
45,144 48,42910,229
12,217
8,260 6,329
26,856
32,550
34,713
3,066 3,041 1,528
6,636
27,336
39,0527,737
9,591
8,825
9,5229,051
1Q09 2Q09 3Q09 4Q09 1Q10
Health, Accidents and others
Traditional Life
Investment-Linked
Interest-Sensitive Annuity
Interest-Sensitive Life
Fubon Life- Total premium breakdown by products
100,67986,63062,532 104,38975,369
Total premium breakdown by products
NT $m
Note: data before the merger of Fubon and Antai is on a pro-forma basis 28
Sum

FYP breakdown as of March 2010
Others
10%
Tied Agents
11%
Fubon Life- breakdown by channels
APE* breakdown as of March 2010
Others
14% Tied Agents
25%
*Note : APE is the abbreviation of annual premium equivalent .
Bancassurance-TPFB34%
Bancassurance-External
45%
29
Bancassurance-External
39%
Bancassurance-TPFB22%

Investment portfolio
30
-2.4%29.3%357.231.7%358.6Overseas
2.4%70.7%862.668.3%772.5Domestic
-100.0%1,219.8100.0%1,131.0Total investments
-0.4%4.4%53.54.8%53.9Real estate
-0.2%3.6%43.83.8%42.9Policy loans
-0.4%3.0%36.83.4%38.2Mortgage loans
0.2%0.6%6.90.3%3.7Overseas equity
-0.7%8.0%98.28.8%99.1Domestic equity
-2.7%28.7%350.331.4%354.9Overseas fixed Income
-1.3%42.0%512.743.4%490.5Domestic fixed Income
5.4%9.6%117.64.2%47.9Deposit and cash equivalents
Weighting Change
%Amount%Amount(NT$bn)
2010/03/312009/12/31

Domestic Fixed Income PortfolioOversea Fixed Income Portfolio
71% 70%
1% 1%
16% 17%
9% 8%
3% 4%
Year 2009 March 2010
Bond Funds
Corp bonds
Bank debentures
Others
Gov Bonds & T-Bills
19% 17%
20%19%
45% 49%
2% 2%
12%
2% 2%
11%
Year 2009 March 2010
Others
Corp bonds
CDO
Bank notes
Agency CMO/MBS
Gov Bonds & T-Bills
Reshuffle fixed income portfolio
31

USD
unhedged
7%
Fully
Hedged
82%
Basket
Hedge
8%
Other
currencies
3%
Hedging cost and composition
99bps
-0.159
2009
-90bps
-98bps
0.24
-3.24
2009
35bps
-0.056
1Q 2010
-98bps
-65bps
-0.30
-0.58
1Q 2010
55bps
-0.088
4Q 2009
-107bps
-73bps
-0.28
-0.61
4Q 2009
155bps
Implied annualized hedging cost - on shore
-0.263TWD/USD six months swap points - on shore
1Q 2009
Reference:
3bpsHedging cost after FX gain/loss
-154bpsHedging cost
0.99FX gain (loss) (NT$bn)
-0.97 Hedging cost (NT$bn)
1Q 2009
Fubon LifeComposition as of 31 March, 2010
32

Cost of liability & Investment return
Cost of liability and investment return Cost* of liability on new money
4.95% 4.88%4.71%
4.56%4.42%
3.84%4.06%3.98%
3.12%
3.62%
Mar-09 Jun-09 Sep-09 Dec-09 Mar-10
Cost of liability Investment return
1.50%
1.65%
1.80%
1.95%
2.10%
2.25%
2.40%
2.55%
2.70%
2.85%
3.00%
3.15%
3.30%
3.45%
Dec-08 Mar-09 Jun-09 Sep-09 Dec-09 Mar-10
2.19%
2.59%
*Note: The cost is based on 12 months moving average
33
2.78%
3.27%
1.71%1.67%

Agenda
Performance highlights of the group
Performance review of banking business
Performance review of insurance business
Update on CDO exposure
34
Fubon Life Year 2009 Embedded Value

Details of CDO and SIV exposure
35
7,929Total
4Fubon Bank HK
SIV
2.7%0.0%0.0%74.1%23.2%0.0%7,925Subtotal
100.0%0.0%0.0%0.0%0.0%0.0%41Fubon Bank HK
0.0%0.0%0.0%0.0%0.0%0.0%0Taipei Fubon Bank
9.0%0.0%0.0%43.7%47.3%0.0%646Fubon P&C
1.6%0.0%0.0%77.2%21.1%0.0%7,238Fubon Life
CDO
B or belowBBBBBAAAAAA
Credit rating distribution (%)Net
amountNT$ m

Update of CDO impairment / mark to market
36
*Note: Data for Fubon HK reflects the change of market value
7,91813,7445,8262,0532,623990160Total (75% of Fubon HK)
7,92914,3086,3792,3822,861984151Total
41,3431,33996137800Fubon Bank HK
031531517414100Taipei Fubon Bank
SIV::::
41913872352575-21-34 Fubon Bank HK
6461,29965305171360Fubon P&C
7,2389,5072,26901,214869185 Fubon Life
Corporate CDO::::
0206206206000Fubon Life
07257256883700Taipei Fubon Bank
Subprime CDO::::
Cumulative2007200820091Q 2010
Nominal net amount
Nominal gross amount
Impairment Losses/ mark to-market NT$ m

Agenda
Performance highlights of the group
Performance review of banking business
Performance review of insurance business
Update on CDO exposure
37
Fubon Life Year 2009 Embedded Value
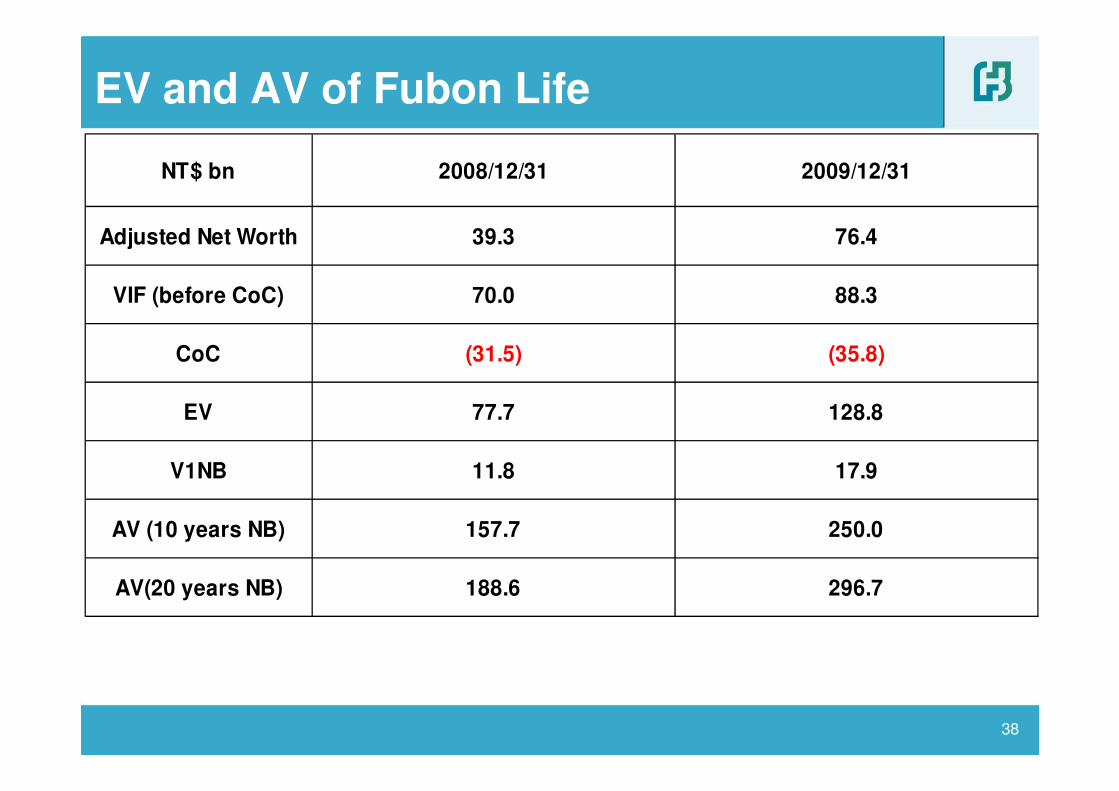
EV and AV of Fubon Life
NT$ bn 2008/12/31 2009/12/31
Adjusted Net Worth 39.3 76.4
VIF (before CoC) 70.0 88.3
CoC (31.5) (35.8)
EV 77.7 128.8
V1NB 11.8 17.9
AV (10 years NB) 157.7 250.0
AV(20 years NB) 188.6 296.7
38

Assumptions for investment yield
39
� EV 2009 VIF: Year 2010 to 2046 at 3.68%~5.36%; Year 2047+: 5.37%
V1NB: Year 2010 to 2063 at 3.35%~5.36%; Year 2064+: 5.37%
� EV 2008 VIF: Year 2009 to 2049 at 3.66%~5.36%; Year 2050+: 5.37%
V1NB: Year 2009 to 2081at 3.04%~5.36%; Year 2082+: 5.37%
� The investment return change is mostly due to initial point of 10-year risk-free rate increase (from 1.41% of 2008 to 2.29% of 2009), the 10-year risk-free rate is still assumed to reach 4% over 10 years. Spreads for asset classes with respect to relevant risk-free rates, are applied to give the asset class yields.
The investment return curve is determined by considering the asset mix, business and existing asset run-off.
3.00%
3.50%
4.00%
4.50%
5.00%
5.50%
Year 10 20 30 40
2009 VIF 2008 VIF
3.00%
3.50%
4.00%
4.50%
5.00%
5.50%
Year 10 20 30 40
2009 V1NB 2008 V1NB
3.04%
3.35%
3.68%3.66%
1 1

YoY comparison of Adjusted Net Worth
NT$ bn 2008/12/31 2009/12/31
Statutory Net Worth 66.4 95.5
Special Reserve
Contingency/Catastrophe3.7 4.1
Adjusted Market Value of fixed
Income to Book Value(30.3) (22.7)
Goodwill (0.5) (0.5)
Adjusted Net Worth 39.3 76.4
40
�Statutory net worth increased by NT$29.2bn mainly due to net profit of Year 2009(NT$10.9bn) and unrealized gains(NT$17.1bn) on AFS for the recovery of economy.
�In order to reflect the book yield assumption of fixed income assets, we deductedthe AFS unrealized gains on shareholder equity.

Statutory Net Worth
as of Dec. 31, 2009
Special Reserve Adjusted Market Value
of f ixed Income to Book
Value
Goodw ill Adjusted Net Worth
as of Dec. 31, 2009
Movement of Adjusted Net Worth
95.5 +4.1 -22.7
-0.5 76.4
NT$ bn
41

Value of In-force Movement
2008 VIF
(before CoC)
Model
Change
Valuation Date
Movement
Data
Change
Assumption
Change
2009 VNB
(before CoC)
2009 VIF
(before CoC)
70.0 -2.1 -1.0 -1.1 +1.4
+20.9 88.3
NT$ bn
42
Growth of VIF reflected contribution of strong FYP momentum in 2009

EV & AV Sensitivities
Base Case Scenario
Inv Return
- 0.25%
Inv Return
+ 0.25%
RDR
-1%
RDR
+ 1%
Adjusted Net Worth 76.4 76.4 76.4 76.4 76.4
VIF (before CoC) 64.4 112.0 88.3 93.9 83.5
CoC (37.2) (34.4) (35.8) (33.0) (38.0)
EV 103.6 154.0 128.8 137.2 121.9
V1NB 15.6 20.2 17.9 20.1 16.0
AV (10 years NB) 209.1 290.4 250.0 273.2 230.1
AV (20 years NB) 249.7 343.0 296.7 325.6 271.9
NT$ bn
All else equal except All else equal except
VIF : Year 2010 to 2046 at 3.68%~5.36%;
Year 2047+: 5.37%
V1NB: Year 2010 to 2063 at 3.35%~5.36%;
Year 2064+: 5.37%
43

VIF Sensitivities
VIF before
CoCChange CoC
VIF after
CoC
Base Scenario 88.3 (35.8) 52.4
Mortality +10% 85.2 (3.0) (35.7) 49.5
Mortality -10% 92.2 3.9 (35.9) 56.3
Morbidity +10% 72.8 (15.5) (35.8) 37.0
Morbidity -10% 103.7 15.5 (35.8) 67.9
Lapses +10% 87.2 (1.0) (35.3) 52.0
Lapses -10% 89.4 1.2 (36.4) 53.0
Expenses +10% 85.9 (2.4) (35.8) 50.0
Expenses -10% 90.6 2.4 (35.8) 54.8
NT$ bn
Valuation Date:
31 December 2009
Solvency Basis:
200% RBC
VIF Sensitive Analysis
44

V1NB Sensitivities
V1NB before
CoCChange CoC
V1NB after
CoC
Base Scenario 20.9 (3.0) 17.9
Mortality +10% 20.8 (0.1) (3.0) 17.8
Mortality -10% 21.1 0.1 (3.0) 18.0
Morbidity +10% 20.4 (0.6) (3.0) 17.4
Morbidity -10% 21.5 0.6 (3.0) 18.5
Lapses +10% 20.2 (0.7) (2.9) 17.3
Lapses -10% 21.8 0.8 (3.2) 18.6
Expenses +10% 20.6 (0.3) (3.0) 17.6
Expenses -10% 21.3 0.3 (3.0) 18.3
NT$ bn
Valuation Date:
31 December 2009
Solvency Basis:
200% RBC
V1NB Sensitive Analysis
45

Embedded Value: Supplementary Information
46

Solvency Capital� Relaxations on 20% of URGL from stock investment is still recognized in 2009 and
resume original practice after 2009
� Two relaxations introduced in year 2008 are stipulated as permanent practice
• Preferred share and surplus-like debenture issued are allowed to be counted as
shareholder’s capital.
• Special catastrophe reserve is counted as shareholder’s capital as well
� The cost of capital is based on future capital requirement maintaining regulatory
minimum RBC level of 200% and considering following factors
• Future required capital is projected based on local RBC framework considering current
business profile and future business plan.
• K-value moves linearly from 0.46 as of 2009 to 0.50 in 2011 and beyond
• Investments in insurance-related business is added on top of RBC 200% required
capital.
47

Economic Assumptions in Year 2009
Corporate tax rateTax
10%Discount Rate
Year 2010 to 2063 at 3.35%~5.36%;
Year 2064 and beyond assume flat rate at 5.37% Investment Return – V1NB
Year 2010 to 2046 at 3.68%~5.36%;
Year 2047 and beyond assume flat rate at 5.37% Investment Return - Inforce
DescriptionsAssumptions
48

Non-Economic Assumptions
2009 actual expenses are lower than last year due to actual active
expenses management results.
Integrated expense study, expense assumption is based on company
latest experience and varies by product categories.
Expense
Interest sensitive annuity – higher than last year to reflect actual
experience
Others – better than last year to reflect actual experience.
Lapse
Cancer and surgical products – increase deterioration rate to reflect
actual experience
Others – the morbidity assumption for other products are unchanged
Morbidity
Lower than last year to reflect actual experienceMortality
ChangesAssumption
49

Thank you
50

(NT$ million) TPFB P& C Fubon Life Sec AM FHC Combined
Revenues
Insurance premiums 0 3,945 98,529 0 0 0 102,474
Commissions and fees 1,408 0 85 1,100 119 0 2,713
Loan interest 3,437 0 0 316 0 0 3,753
Other interest and dividends 1,217 276 8,355 16 1 3 9,868
Principal transactions 759 485 2,577 9 0 (26) 3,805
Realized gains (losses) -- Debt 80 3 734 4 0 0 820
Realized gains (losses) -- Equity 123 485 2,665 190 0 0 3,463
Other gains (losses) 556 (3) (822) (185) 0 (26) (479)
Other income 165 0 340 120 0 6,444 1,191
Total revenues 6,986 4,707 109,886 1,561 120 6,421 123,804
Interest expense (1,602) 0 (2) (5) 0 (546) (2,155)
Total revenues, net of interest expense 5,384 4,707 109,884 1,555 120 5,875 121,649
0 0 0 0 0 0 0
Benefits, claims, and credit losses 0 0 0 0 0 0 0
Provisions for benefits and claims 0 (2,113) (101,317) 0 0 0 (103,430)
Provision for credit losses (263) (23) 0 0 0 0 (286)
Total benefits, claims and credit losses (263) (2,136) (101,317) 0 0 0 (103,716)
0
Operating expenses (2,920) (1,378) (5,926) (1,151) (95) (104) (11,574)
Net operating profit 2,201 1,193 2,642 404 25 5,772 6,359
Net non-operating income 75 (14) 20 4 (3) 2 84
Pretax income 2,276 1,178 2,661 408 22 5,774 6,443
Income taxes (391) (171) (10) (93) (4) 196 (473)
Accumulative effect of accounting changes 0 0 0 0 0 0 0
Net income 1,885 1,008 2,651 315 18 5,970 5,970
Memo:
- Commissions and fees: net of fee expenses for banks and insurers.
-
- Other gains (losses): FX and derivatives gains/losses.
- Other income: mainly income recognized under equity method for TPFB bank and FHC.
- Operating expenses: including provision for special reserves
Fubon Financial -- Income statement (preliminary)
Other interest: including interest for credit card revolving, interbank lending & bonds, and gains from money market paper. For insurance companies,
cash dividends and rental income are also included.
Attachment1

Fubon Financial - Financial summary
08-to-09 2010
2006 2007 2008 2009 Change 1Q 4Q 1Q YoY
Income Statement Data
Revenues :
Insurance premiums 73,793 78,091 145,874 297,020 103.6% 86,497 96,806 102,474 18.5%
Net commissions and fees 10,784 15,409 10,303 10,862 5.4% 1,787 2,981 2,713 51.8%
Interest and dividends 54,278 52,021 53,962 56,257 4.3% 15,972 13,667 13,622 -14.7%
Principal transactions 4,733 5,491 354 11,410 3120.9% 1,653 4,777 3,805 130.2%
Others * 2,666 3,194 2,231 3,230 44.8% 1,251 526 1,191 -4.8%
Total revenues 146,255 154,206 212,724 378,779 78.1% 79,778 118,758 123,804 55.2%
Interest expense 24,803 21,088 20,567 9,729 -52.7% 3,086 1,879 2,155 -30.2%
Total revenues, net of interest expense 121,452 133,118 192,157 369,049 92.1% 76,692 116,879 121,649 58.6%
Benefits, claims and provision for loan losses 86,444 84,325 148,260 300,070 102.4% 63,521 98,412 103,716 63.3%
Total operating expenses 26,045 30,959 31,911 47,112 47.6% 10,516 12,969 11,574 10.1%
Net non-operating income 643 (1,144) (232) (273) -17.8% 159 (4) 84 -47.1%
Income before Tax 9,606 16,689 11,754 21,593 83.7% 2,814 5,494 6,443 129.0%
Net Income 8,400 14,432 10,875 19,938 83.3% 2,436 5,224 5,970 145.0%
Balance Sheet Data
Total assets 1,724,453 1,803,936 2,006,720 3,060,253 52.5% 2,729,308 3,060,253 3,176,191 16.4%
Shareholders' equity 163,532 165,728 143,715 208,468 45.1% 158,549 208,468 209,552 32.2%
Summary ratios
Double leverage 102% 102% 111% 108% 114% 108% 111%
Equity / Assets 9.5% 9.2% 7.2% 6.8% 5.8% 6.8% 6.6%
Return on average assets 0.50% 0.82% 0.57% 0.79% 0.41% 0.69% 0.77%
Return on average equity 5.26% 8.77% 7.03% 11.32% 6.45% 10.17% 11.43%
Cash dividend per share NT$1.00 NT$1.50 NT$0.00 NT$2.00
2009 Change
Note: "Others": reflects income recognized for subsidiaries & elimination for consolidation purpose .
NT$ millions, except for percentagesFull Year
Attachment2

Taipei Fubon Bank - Financial summary
08-to-09 2010
2006 2007 2008 2009 Change 1Q 4Q 1Q YoY QoQ
Income statement data
Interest income 41,585 37,041 37,755 20,335 -46.1% 6,079 4,533 4,652 -23.5% 2.6%
Interest expense 23,293 19,859 19,780 8,695 -56.0% 2,852 1,588 1,602 -43.8% 0.9%
Net interest income 18,292 17,181 17,975 11,640 -35.2% 3,227 2,945 3,049 -5.5% 3.6%
Net fee income 5,731 7,268 5,331 4,733 -11.2% 894 1,457 1,408 57.5% -3.3%
Other income 1,540 2,799 2,269 5,603 146.9% 1,520 1,460 926 -39.1% -36.6%
Total revenue 25,563 27,249 25,576 21,975 -14.1% 5,641 5,862 5,384 -4.6% -8.1%
SG&A expense 11,648 12,389 12,677 12,419 -2.0% 2,971 3,512 2,920 -1.7% -16.9%
Provision for credit losses 15,034 10,302 5,512 3,937 -28.6% 802 1,585 263 -67.2% -83.4%
Net non-operating income 210 (509) 441 27 -93.9% 102 11 75 -26.5% 597.3%
Income before tax (909) 4,048 7,829 5,647 -27.9% 1,970 775 2,276 15.5% 193.7%
Net income 440 3,354 6,021 5,222 -13.3% 1,756 954 1,885 7.3% 97.5%
Balance sheet data
Gross loans 618,406 662,359 758,269 835,739 10.2% 802,227 835,739 885,367 10.4% 5.9%
Credit card revolving loans 21,920 17,774 14,639 11,183 -23.6% 13,061 11,183 10,431 -20.1% -6.7%
NPL (incl. Loans under surveillances) 12,003 7,885 6,013 4,457 -25.9% 5,873 4,457 4,188 -28.7% -6.0%
Allowance for loan losses 7,663 5,308 4,422 4,975 12.5% 4,518 4,975 5,205 15.2% 4.6%
Total assets 1,085,028 1,099,741 1,228,059 1,356,995 10.5% 1,235,805 1,356,995 1,401,501 13.4% 3.3%
Deposits 802,964 816,152 967,533 1,092,305 12.9% 1,000,515 1,092,305 1,112,597 11.2% 1.9%
Shareholders' equity 72,279 75,094 79,422 81,397 2.5% 81,162 81,397 83,143 2.4% 2.1%
Summary ratios
Loan-to-Deposit spread (incl. credit cards) 2.59% 2.13% 2.02% 1.23% 1.33% 1.25% 1.30%
Loan-to-Deposit spread 1.96% 1.80% 1.75% 1.04% 1.10% 1.09% 1.14%
Net interest margin 1.90% 1.66% 1.61% 0.96% 1.12% 0.94% 0.96%
Net fee income / Total revenue 22.4% 26.7% 20.8% 21.5% 15.9% 24.9% 26.2%
Cost-to-Income ratio 45.6% 45.5% 49.6% 56.5% 52.7% 59.9% 54.2%
Return on average assets 0.0% 0.3% 0.5% 0.4% 0.6% 0.3% 0.5%
Return on average equity 0.6% 4.6% 7.8% 6.5% 8.7% 4.7% 9.2%
NPLs / Gross loans 1.94% 1.19% 0.79% 0.53% 0.73% 0.53% 0.47%
Allowance / Gross loans 1.2% 0.8% 0.6% 0.6% 0.6% 0.6% 0.6%
Allowance / NPLs 63.8% 67.3% 73.6% 111.6% 76.9% 111.6% 124.3%
Equity / Assets 6.7% 6.8% 6.5% 6.0% 6.6% 6.0% 5.9%
Gross loan to deposit ratio (incl. credit cards) 79.7% 83.3% 79.9% 77.5% 81.5% 77.5% 80.5%
Gross loan to deposit ratio 77.0% 81.2% 78.4% 76.5% 80.2% 76.5% 79.6%
Note: -
2009 ChangeFull YearNT$ millions, except for percentages
Attachment 3

Taipei Fubon Bank - Fee income breakdown & credit card statistics
Net Fee Income Breakdown
(NT$ m)
FX 353 4.4% 345 5.5% 296 5.0% 64 5.5% 75 5.6% 78 4.8% 78 4.5% 76 4.6%
Agency 119 1.5% 119 1.9% 113 1.9% 18 1.5% 20 1.5% 21 1.3% 54 3.1% 23 1.4%
Custody 136 1.7% 110 1.7% 154 2.6% 34 2.9% 36 2.7% 42 2.6% 42 2.4% 42 2.6%
Trust 289 3.6% 267 4.2% 343 5.8% 92 7.8% 75 5.6% 86 5.2% 90 5.2% 70 4.3%
Mutaul funds 5,135 63.8% 2,586 41.0% 2,156 36.6% 274 23.4% 439 32.8% 603 36.7% 840 48.6% 709 43.6%
Credit card 232 2.9% 771 12.2% 820 13.9% 189 16.1% 210 15.7% 198 12.1% 223 12.9% 236 14.5%
Guarantee 226 2.8% 235 3.7% 227 3.9% 59 5.0% 57 4.2% 55 3.3% 56 3.2% 57 3.5%
Lottery -2 0.0% 19 0.3% 53 0.9% 10 0.8% 13 1.0% 14 0.8% 17 1.0% 10 0.6%
Syndication 545 6.8% 503 8.0% 247 4.2% 46 3.9% 48 3.6% 92 5.6% 61 3.6% 98 6.0%
Other 236 2.9% 378 6.0% 323 5.5% 108 9.2% 110 8.2% 111 6.7% -5 -0.3% 89 5.4%
Insurance(1) 780 9.7% 970 15.4% 1,153 19.6% 279 23.8% 257 19.2% 344 20.9% 272 15.7% 219 13.4%
Total net fee income 8,048 100.0% 6,301 100.0% 5,885 100.0% 1,173 100.0% 1,339 100.0% 1,644 100.0% 1,729 100.0% 1,627 100.0%
Of which, Wealth management 6,204 77.1% 3,823 60.7% 3,652 62.0% 645 55.0% 771 57.6% 1,033 62.9% 1,202 69.5% 997 61.3%
Note:
(1) The fee income is booked in insurance agency company which is a subsidiary of Taipei Fubon bank.
(2) Corporate banking fees include FX,agency,custody,guarantee and syndication
(3) Wealth management fees include trust, mutual funds and insurance
Credit Card Statistics
Cards in force
Active cards
Outstanding receivables (NT$m)
Outstanding revovling balance (NT$m)
YTD spending (NT$m)
Avg per-card spending per mo. (NT$)
90-day DLQ
30-day DLQ
YTD net charge-off ratio (annualized)
4Q 2009
Dec-09
1,924,327
1Q 2010
Dec-07 Dec-08 Dec-09 Jun-09 Sep-09 Mar-10
2008 2009
2,136,223
Mar-09
2,084,209 1,982,046
1,571,312 1,461,751
2,391,390 2,187,774 1,924,327
1,421,569 1,416,7351,451,4621,421,374
17,774 14,639
29,468 24,798 22,680
11,183 12,306 11,687
22,129 22,226
21,281
13,061
43,959 69,850
21,686
4,363 3,742
119,209 103,472 96,928
3,954 3,442 3,724
0.94%
3,306
0.49% 0.72% 0.63%
3.07% 2.99% 1.48%
1.02% 0.89%
3.02% 2.27% 1.92%
7.27%11.35% 8.81% 5.19% 6.80% 5.86%
2007 1Q 2009 2Q 2009 3Q 2009
1,421,374
22,680
11,183
96,928
3,954
0.49%
1.48%
5.19%
1,888,105
1,400,004
21,279
1.03%
1.93%
10,431
27,038
4,741
0.38%
Attachment4

Fubon Insurance - Financial summary
08-to-09 2010
2006 2007 2008 2009 Change 1Q 4Q 1Q YoY QoQ
Income statement data
Gross written premium 24,197 23,939 23,130 22,412 -3.1% 6,385 5,401 6,149 -3.7% 13.9%
Net written premium 14,858 15,127 15,588 15,444 -0.9% 3,975 3,947 4,240 6.7% 7.4%
Net earned premium 14,884 14,764 15,566 15,351 -1.4% 3,885 3,851 3,945 1.5% 2.5%
Net claims and claims adjustments 8,108 7,009 7,324 7,623 4.1% 1,582 2,012 2,113 33.6% 5.0%
underwriting & operating expense 5,521 5,778 5,736 5,406 -5.7% 1,402 1,482 1,385 -1.2% -6.6%
Underwriting profit 1,243 1,433 1,851 1,734 -6.3% 722 278 370 -48.7% 33.3%
Total investment income 1,948 1,862 1,460 1,458 -0.2% 277 674 762 175.0% 13.1%
Net non-operating income (365) (651) (820) (832) -1.4% (260) 16 46 N.M 196.5%
Income before tax 2,826 2,644 2,490 2,360 -5.2% 739 967 1,178 59.5% 21.8%
Net income 2,400 2,012 2,045 1,371 -33.0% 599 858 1,008 68.3% 17.4%
Balance sheet data
Fixed income assets 20,629 19,994 20,532 23,669 15.3% 18,835 23,669 24,372 29.4% 3.0%
Investment assets 41,533 43,138 42,780 47,564 11.2% 41,594 47,564 48,617 16.9% 2.2%
Total assets 51,590 54,448 59,047 63,368 7.3% 61,868 63,368 64,664 -3.7% 4.8%
Reserves for operations and liabilities 22,699 24,639 34,094 35,673 4.6% 35,205 35,673 36,333 3.2% 1.9%
Total liabilities 29,959 33,209 41,677 41,043 -1.5% 43,780 41,043 42,010 -4.0% 2.4%
Shareholders' equity 21,631 21,239 17,370 22,325 28.5% 18,088 22,325 22,654 25.2% 1.5%
Summary ratios
Net claim ratio 54.5% 47.5% 47.1% 49.7% 40.7% 52.2% 53.6%
Net expense ratio 37.1% 39.1% 36.8% 35.2% 36.1% 38.5% 35.1%
Net combined ratio 91.6% 86.6% 83.9% 84.9% 76.8% 90.7% 88.7%
Interest yield on fixed income investment 3.3% 3.7% 4.3% 3.8% 4.6% 3.9% 3.5%
Total investment return 4.3% 4.4% 3.4% 3.2% 2.6% 5.7% 6.3%
Solvency margin (NWP / Equity) 68.7% 71.2% 89.7% 69.2% 87.9% 70.7% 74.9%
Retention ratio 61.4% 63.2% 67.4% 68.9% 62.3% 73.1% 69.0%
Return on average assets 4.2% 3.8% 3.6% 2.2% 4.0% 5.3% 6.3%
Return on average equity 9.4% 9.4% 10.6% 6.9% 13.5% 15.7% 17.9%
Change2009NT$ millions, except for percentages
Full Year
Attachment 5

Fubon Life - Financial summary
YoY 2010
2007 2008 2009 Change 1Q 4Q 1Q YoY QoQ
Income statement data
First year premium(exclude investment-linked) 51,771 118,337 190,847 61.3% 43,864 65,126 69,600 58.7% 6.9%
Total earned premium (net) 153,903 208,517 290,488 39.3% 68,669 92,955 98,529 43.5% 6.0%
Total investment income 30,492 24,717 39,878 61.3% 7,278 11,166 10,931 50.2% -2.1%
Other income 14,846 10,925 2,779 -74.6% 1,097 463 425 -61.2% -8.1%
Total operating revenue 199,241 244,159 333,145 36.4% 77,045 104,584 109,884 42.6% 5.1%
Claim and benefit expense 88,387 92,787 83,580 -9.9% 17,166 27,844 27,305 59.1% -1.9%
Net commission expense 11,900 11,567 12,066 4.3% 3,142 3,213 3,342 6.4% 4.0%
Net provision in policy reserve 71,533 125,382 213,665 70.4% 52,693 66,976 74,012 40.5% 10.5%
General and administrative expense 12,952 12,194 10,868 -10.9% 2,565 2,846 2,492 -2.8% -12.4%
Total operating expense 185,236 242,236 321,408 32.7% 76,004 100,990 107,243 41.1% 6.2%
Net non-operating income (27) 139 133 -3.8% 22 45 20 -10.3% -55.7%
Income before tax 13,977 2,062 11,871 475.7% 1,063 3,639 2,661 150.4% -26.9%
Net income 12,128 1,612 10,870 574.4% 499 3,257 2,651 431.3% -18.6%
Balance sheet data
Fixed income assets 680,607 837,156 1,028,178 22.8% 876,372 1,028,178 1,114,690 27.2% 8.4%
Investment assets 762,608 894,578 1,131,029 26.4% 946,131 1,131,029 1,219,769 28.9% 7.8%
U-linked assets 130,071 113,874 157,693 38.5% 112,829 157,693 159,118 41.0% 0.9%
Total assets(1) 797,628 936,444 1,183,181 26.3% 985,439 1,183,181 1,273,460 29.2% 7.6%
Policy reserve(1) 701,533 825,319 1,038,127 25.8% 877,982 1,038,127 1,111,997 26.7% 7.1%
Total reserve(1) 713,520 838,315 1,052,437 25.5% 891,454 1,052,437 1,126,849 26.4% 7.1%
Total liabilities(1) 739,124 870,071 1,087,648 25.0% 927,089 1,087,648 1,179,285 27.2% 8.4%
Shareholders' equity 58,503 66,373 95,533 43.9% 58,350 95,533 94,175 61.4% -1.4%
Note(1) :excl. investment-linked
Summary ratios
Claims and benefits ratio 57.4% 44.5% 28.8% 25.0% 30.0% 27.7%
Expense ratio 8.4% 5.8% 3.7% 3.7% 3.1% 2.5%
Persistency ratio - 13th month N.A 88.2% 87.4% 89.2% 87.4% 86.3%
Return on average assets 1.6% 0.2% 1.0% 0.2% 1.1% 0.9%
Return on average equity 18.2% 2.6% 13.4% 3.2% 13.9% 11.2%
Interest yield on fixed income investment 2.81% 3.18% 3.27%
Total investment return 4.28% 3.16% 4.06%
Note: (1) Exclude investment-linked
(2) Assets under separate accounts are not included in ROA calculation.
(3) All data are on a pro forma basis.
NT$ millions, except for percentages2009 Change
Attachment6

Fubon Securities - Financial summary
08-to-09 2010
2006 2007 2008 2009 Change 1Q 4Q 1Q YoY QoQ
Income statement data
Brokerage commissions 3,721 5,046 3,291 4,382 33.2% 619 1,244 1,050 69.6% -15.6%
Net interest income 1,247 1,607 1,344 1,021 -24.1% 190 289 325 71.4% 12.6%
Fee income 276 210 165 244 48.1% 34 111 69 104.4% -38.0%
Net principal transactions 1,808 2,392 261 1,387 431.8% 267 211 (25) N.M N.M
Net financial products gains 239 (194) 168 57 -65.7% 1 60 34 4762.5% -43.7%
Total operating revenue 7,358 9,167 5,290 7,138 34.9% 1,122 1,945 1,458 30.0% -25.0%
Total operating expense 4,139 4,886 4,194 4,664 11.2% 882 1,461 1,151 30.6% -21.2%
Net non-operating income 653 382 253 277 9.4% 75 63 101 34.7% 59.5%
Income before tax 3,871 4,663 1,349 2,751 103.8% 315 547 408 29.4% -25.4%
Net income 2,859 3,923 1,199 2,408 100.7% 309 478 315 2.0% -34.1%
Balance sheet data
Margin loans 22,320 26,225 8,510 21,128 148.3% 10,875 21,128 21,218 95.1% 0.4%
Total assets 60,548 63,727 46,390 47,507 2.4% 39,012 47,507 48,388 24.0% 1.9%
Current liabilities 26,618 27,962 13,373 15,867 18.6% 10,574 15,867 16,670 57.6% 5.1%
Total liabilities 27,412 28,827 13,809 16,370 18.5% 11,015 16,370 17,191 56.1% 5.0%
Total shareholders' equity 33,136 34,900 32,581 31,137 -4.4% 27,997 31,137 31,196 11.4% 0.2%
Summary ratios
Consolidated data
Total expenses / Total revenues 56.3% 53.3% 79.3% 65.3% 78.6% 75.1% 78.9%
Return on average assets 4.8% 6.3% 2.2% 5.1% 2.9% 3.9% 2.6%
Return on average equity 8.9% 11.5% 3.6% 7.6% 4.1% 6.2% 4.0%
Margin loans / Total assets 36.9% 41.2% 18.3% 44.5% 27.9% 44.5% 43.9%
Margin loans / Shareholders' equity 67.4% 75.1% 26.1% 67.9% 38.8% 67.9% 68.0%
Equity / Total assets 54.7% 54.8% 70.2% 65.5% 71.8% 65.5% 64.5%
Other Data - Unconsolidated
Revenue / Employee 3.5 4.5 2.4 3.2 2.1 3.5 2.6
Commission / Broker 3.2 4.6 2.7 3.5 2.1 3.9 3.3
Compensation / Revenue 29% 28% 38% 32% 38% 39% 39%
NT$ millions, except for percentagesFull Year Change2009
Attachment 7

Fubon Asset Management - Financial summary
08-to-09 2010
2006 2007 2008 2009 Change 1Q 4Q 1Q YoY QoQ
Income statement data
Fee and commission income 707 697 422 464 10.0% 78 167 119 52.6% -28.7%
Total operating expense 416 422 350 349 -0.3% 74 99 95 28.4% -4.1%
Net non-operating income (588) (683) (657) (15) 97.7% (15) 1 (2)86.7% N.M
Income before tax (298) (408) (587) 100 N.M (11) 69 22 N.M -68.1%
Net income (393) (478) (366) 66 N.M (7) 51 18 N.M -65.0%
Balance sheet data
Total assets 1,224 1,045 924 1,003 8.5% 891 1,003 996 11.8% -0.7%
Shareholders' equity 1,075 597 865 932 7.7% 858 932 949 10.6% 1.8%
Other data
AUM 157,400 124,700 94,800 170,100 79.4% 115,700 170,100 164,700 42.4% -3.2%
Bond fund 93,300 49,600 46,200 56,800 22.9% 64,800 56,800 52,600 -18.8% -7.4%
Equity 18,600 24,000 12,200 23,700 94.3% 13,900 23,700 25,900 86.3% 9.3%
Others 45,500 51,100 36,400 89,600 146.2% 37,000 89,600 86,200 133.0% -3.8%
Summary ratios
Expense ratio 58.9% 60.5% 82.9% 75.2% 94.9% 59.3% 79.8%
Return on average assets -27.6% -42.1% -37.2% 6.9% -3.1% 21.2% 7.2%
Return on average equity -30.9% -57.2% -50.1% 7.4% -3.3% 22.7% 7.7%
NT$ millions, except for percentagesFull Year Change2009
Attachment8

Outstanding Shares
(million shares)
Issued shares : 8,125
Treasury shares : -
Outstanding shares 8,125
As of March 31, 2010
Attachment 9


