B&V Project 137064 Fuel Capability Demonstration Test Report 2 for the JEA Large-Scale CFB Combustion Demonstration Project 50 / 50 Blend Petroleum Coke and Pittsburgh 8 Coal Fuel Submitted to U.S. DEPARTMENT OF ENERGY National Energy Technology Laboratory (NETL) Pittsburgh, Pennsylvania 15236 Cooperative Agreement No. DE-FC21-90MC27403 December 3, 2004 DOE Issue, Rev. 1 Prepared by Black & Veatch for:
Transcript
B&V Project 137064
Fuel Capability Demonstration Test Report 2 for the
Submitted to U.S. DEPARTMENT OF ENERGY National Energy Technology Laboratory (NETL) Pittsburgh, Pennsylvania 15236 Cooperative Agreement No. DE-FC21-90MC27403
December 3, 2004
DOE Issue, Rev. 1
Prepared by Black & Veatch for:
B&V Project 137064
TABLE OF CONTENTS
1.0 INTRODUCTION .................................................................................................................1 1.1 TEST SCHEDULE ...............................................................................................................................1
2.0 SUMMARY OF TEST RESULTS........................................................................................7 2.1 TEST REQUIREMENTS........................................................................................................................7 2.2 VALVE LINE REQUIREMENTS .............................................................................................................7 2.3 TEST RESULTS ..................................................................................................................................7
3.0 BOILER EFFICIENCY TESTS ..........................................................................................11 3.1 CALCULATION METHOD...................................................................................................................11 3.2 DATA AND SAMPLE ACQUISITION.....................................................................................................12
4.0 AQCS INLET AND STACK TESTS ..................................................................................13 4.1 SYSTEM DESCRIPTION.....................................................................................................................13 4.2 UNIT EMISSIONS DESIGN POINTS ....................................................................................................13 4.3 EMISSION DESIGN LIMITS AND RESULTS .........................................................................................13 4.4 FLUE GAS EMISSIONS TEST METHODS ...........................................................................................15 4.5 CONTINUOUS EMISSION MONITORING SYSTEM................................................................................16
ATTACHMENTS.............................................................................................................................17 ATTACHMENT A - FUEL CAPABILITY DEMONSTRATION TEST PROTOCOL ATTACHMENT B - BOILER EFFICIENCY CALCULATION ATTACHMENT C - CAE TEST REPORT ATTACHMENT D - PI DATA SUMMARY ATTACHMENT E - ABBREVIATION LIST ATTACHMENT F - ISOLATION VALVE LIST ATTACHMENT G - FUEL ANALYSES - 50/50 BLEND PET COKE AND PITTSBURGH 8 ATTACHMENT H - LIMESTONE ANALYSES ATTACHMENT I - BED ASH ANALYSES ATTACHMENT J - FLY ASH (AIR HEATER AND PJFF) ANALYSES ATTACHMENT K - AMBIENT DATA, JAN. 27, 2004 AND JAN. 28, 2004 ATTACHMENT L - AMBIENT DATA, JAN. 29, 2004, JAN. 30, 2004, AND JAN. 31, 2004
Fuel Capability Demonstration Test Report #2 p-1 50 / 50 Blend Petroleum Coke and Pittsburgh 8 Coal Fuel
B&V Project 137064
1.0 INTRODUCTION
The agreement between the US Department of Energy (DOE) and JEA covering DOE participation in the Northside Unit 2 project required JEA to demonstrate fuel flexibility of the unit to utilize a variety of different fuels. Therefore, it was necessary for JEA to demonstrate this capability through a series of tests. The purpose of the test program was to document the ability of the unit to utilize a variety of fuels and fuel blends in a cost effective and environmentally responsible manner. Fuel flexibility would be quantified by measuring the following parameters: • Boiler efficiency • CFB boiler sulfur capture • AQCS sulfur and particulate capture • The following flue gas emissions
• Stack opacity This test report documents the results of JEA’s Fuel Capability Demonstration Tests firing a 50/50 blend of Petroleum Coke and Pittsburgh 8 coal for the JEA Large-Scale CFB Combustion Demonstration Project. The term “blend” will be used throughout this report to describe the 50/50 blend of the two fuels. The tests were conducted in accordance with the Fuel Demonstration Test Protocol in Attachment A. Throughout this report, unless otherwise indicated, the term “unit” refers to the combination of the circulating fluidized bed (CFB) boiler and the air quality control system (AQCS). The AQCS consists of a lime-based spray dryer absorber (SDA) and a pulse jet fabric filter (PJFF).
1.1 Test Schedule Unit 2 of the JEA Northside plant site is a Circulating Fluidized Bed Steam Generator designed and constructed by Foster-Wheeler. The steam generator was designed to deliver main steam to the steam turbine at a flow rate of 1,993,591 lb/hr, at a throttle pressure of 2,500 psig, and at a throttle temperature of 1,000 deg F when firing Pittsburgh 8 coal. The fuel capability demonstration test for the unit firing the blended coal was conducted over a five (5) day period beginning on January 27, 2004 and completed on January 31, 2004. During that five (5) day period, data were taken in accordance with the Test Protocol (Attachment A) while the unit was operating at 100% load, 80% load , 60% load, and 40% load.
Fuel Capability Demonstration Test Report #2 p-2 50 / 50 Blend Petroleum Coke and Pittsburgh 8 Coal Fuel
B&V Project 137064
The following log represents the sequence of testing: § Day 1 January 27, 2004:
o Unit at 100% load - turbine load set and maintained at approx. 300 MW. o Flue gas testing commenced at 1135 hours; completed at 2026 hours. o Boiler performance testing commenced at 1130 hours; completed at 1530
hours.
§ Day 2 January 28, 2004: o Unit at 100% load - turbine load set and maintained at approx. 300 MW. o Flue gas testing commenced at 1000 hours; completed at 1604 hours. o Boiler performance testing commenced at 1000 hours. o The A1 fuel feeder went off-line at approximately 1230 hours. A1 fuel feeder
back on line at approximately 1430 hours. The unit was allowed to stabilize. The test continued at 1600 hours. The test was completed at 1800 hours.
§ Day 3 January 29, 2004:
o Unit at 80% load - turbine load set and maintained at approx. 240 MW. o Unit began 2-hour stabilization period at 240 MW at 1315 hours. o Boiler performance testing commenced at 1500 hours after stabilization period
completed; test completed at 1900 hours. o Flue gas emissions data taken and recorded by CEMS system.
§ Day 3 January 29, 2004: (cont’d) o Unit load 60% load after completion of testing at 80% load - turbine load set and
maintained at approx. 180 MW. o Unit began 2-hour stabilization period at 180 MW at 2000 hours. o Boiler performance testing commenced at 2200 hours after stabilization period
completed; test completed at 0200 hours, Jan. 30, 2004. o Flue gas emissions data taken and recorded by CEMS system.
§ Day 4 January 30, 2004: o Unit load decreased to 40% load - turbine load set and maintained at approx.
120 MW. o Unit began 2-hour stabilization period at 120 MW at 1200 hours. o DCS failure tripped unit at approximately 1700 hours - 40% load test postponed
until January 31, 2004.
§ Day 5 January 31, 2004: o Unit load set at 40% - began stabilization period at 0700 hours. o Boiler performance testing began at 0900 hours after stabilization period
completed; test completed at 1300 hours. o Flue gas emissions data taken and recorded by CEMS system. o This concluded the testing of JEA Northside Unit 2 firing the 50/50 blended
Fuel Capability Demonstration Test Report #2 p-3 50 / 50 Blend Petroleum Coke and Pittsburgh 8 Coal Fuel
B&V Project 137064
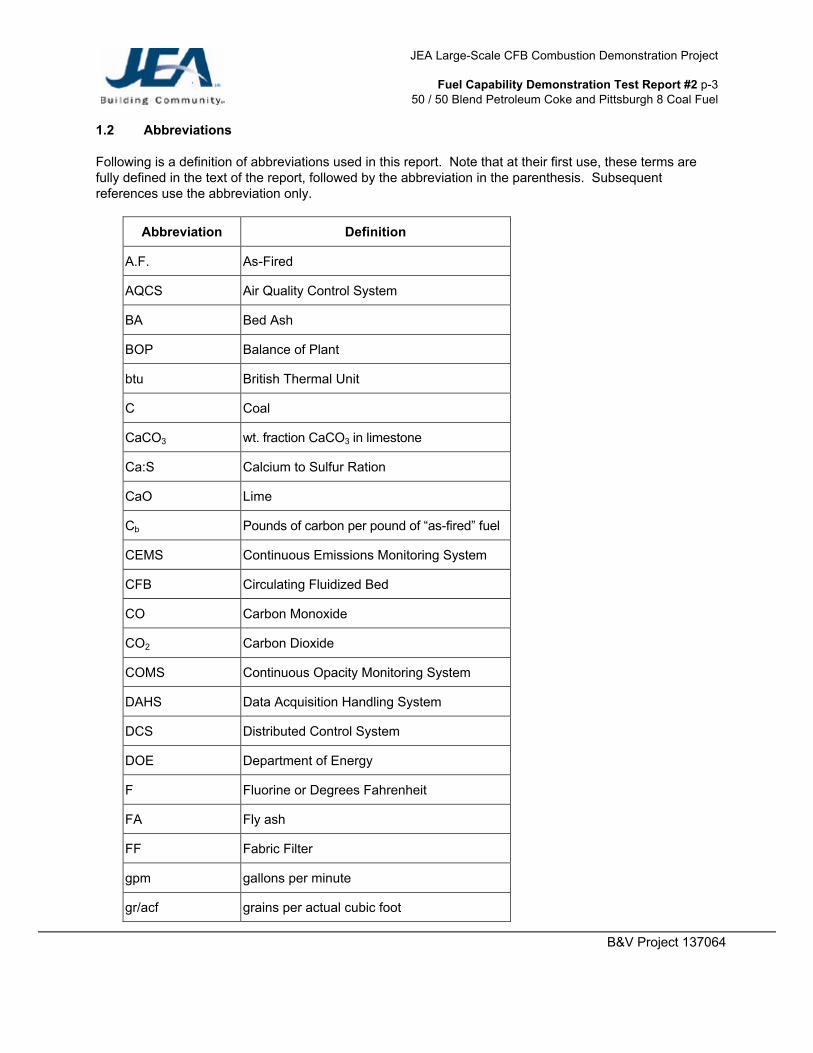
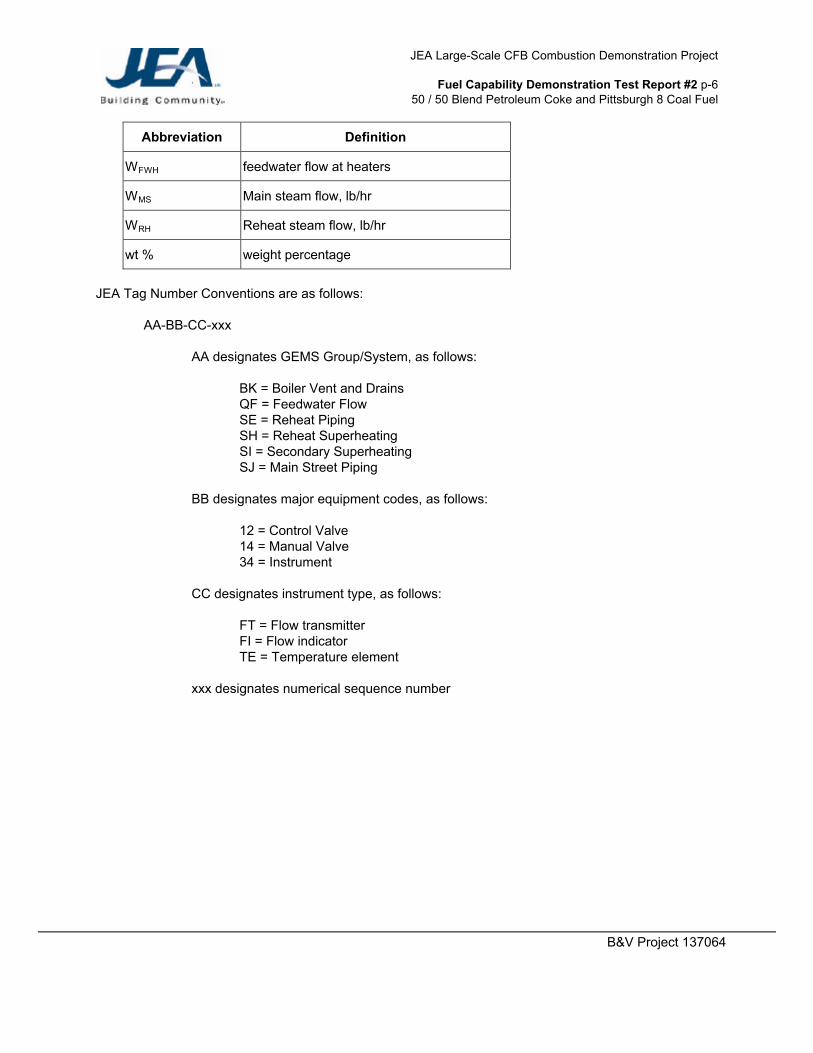
1.2 Abbreviations Following is a definition of abbreviations used in this report. Note that at their first use, these terms are fully defined in the text of the report, followed by the abbreviation in the parenthesis. Subsequent references use the abbreviation only.
Fuel Capability Demonstration Test Report #2 p-6 50 / 50 Blend Petroleum Coke and Pittsburgh 8 Coal Fuel
B&V Project 137064
Abbreviation Definition
WFWH feedwater flow at heaters
WMS Main steam flow, lb/hr
WRH Reheat steam flow, lb/hr
wt % weight percentage
JEA Tag Number Conventions are as follows: AA-BB-CC-xxx AA designates GEMS Group/System, as follows: BK = Boiler Vent and Drains
QF = Feedwater Flow SE = Reheat Piping SH = Reheat Superheating SI = Secondary Superheating SJ = Main Street Piping BB designates major equipment codes, as follows: 12 = Control Valve 14 = Manual Valve 34 = Instrument CC designates instrument type, as follows: FT = Flow transmitter FI = Flow indicator TE = Temperature element xxx designates numerical sequence number
Fuel Capability Demonstration Test Report #2 p-7 50 / 50 Blend Petroleum Coke and Pittsburgh 8 Coal Fuel
B&V Project 137064
2.0 SUMMARY OF TEST RESULTS
2.1 Test Requirements The Protocol required that the following tests be performed and the results be reported at four (4) different unit loads: § Unit Capacity, per cent (all capacities in Megawatts are gross MW). § Boiler Efficiency, per cent (100 % load only). § Main Steam and Reheat Steam Temperature, deg F. § Emissions (NOx, SO2, CO, and Particulate (see Section 4.0 of this report). No design performance data for the boiler firing the blended fuel were provided by Foster-Wheeler. For the purposes of this report, the results of the test were compared against the design performance data of the boiler produced by Foster-Wheeler, as follows:
Boiler efficiency (firing Pittsburgh 8 coal): 88.1 % HHV Boiler efficiency (firing Pet Coke): 90.0 % HHV Main steam flow at turbine inlet: 1,993,591 lb/hr Main steam temperature at turbine inlet: 1,000 deg F Main steam pressure at turbine inlet: 2,500 psig Hot reheat steam temperature at turbine inlet: 1,000 deg F
The average steam temperatures during the Test were compared with the limits described in the following sections (The average of the readings recorded every minute shall be determined to be the Test average):
a. Main steam temperature 1000 °F +10/-0 °F at the turbine throttle valve inlet from 75 to
100% of turbine MCR and 1000 °F +/-10 °F at the turbine throttle valve inlet from 60 to 75% of turbine MCR.
b. Hot reheat steam temperature 1000 °F +10/-0 °F at the turbine intercept valve inlet from
75 to 100% of turbine MCR and 1000 °F +/-10 °F at the turbine intercept valve inlet from 60 to 75% of turbine MCR.
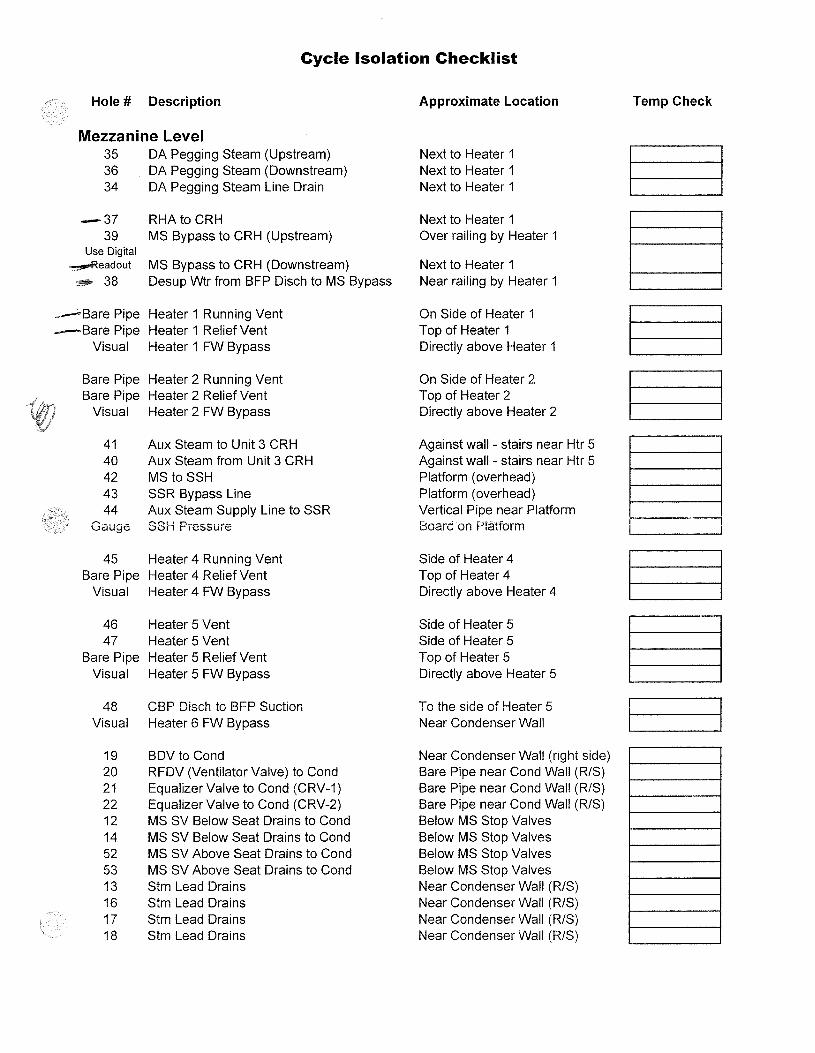
2.2 Valve Line-Up Requirements With the exception of isolating the blow down systems, drain and vent systems, and the soot blower system, the boiler was operated normally in the coordinated control mode throughout the boiler efficiency test period. Prior to the start of each testing period, a walk down was conducted to confirm the ‘closed’ position of certain main steam and feedwater system valves. A listing of these valves is included in Attachment F.
2.3 Test Results
The results of the 100% tests are summarized in Table 1. The results of the part-load tests are summarized in Table 2. The performance of the boiler met and/or exceeded all of the design values provided by Foster-Wheeler. Two and a half hours into the 80% MCR test, the A1 feeder tripped. The problem was fixed, the feeder was put back on line, and the unit was ramped back up to 80% load. The testing commenced at approximately 1600 hours after the unit was allowed
Fuel Capability Demonstration Test Report #2 p-8 50 / 50 Blend Petroleum Coke and Pittsburgh 8 Coal Fuel
B&V Project 137064
to stabilize - no further equipment problems were observed or recorded. No further problems with the fuel feeding system were observed or recorded during the remainder of the part-load testing periods.
TABLE 1 - TESTS RESULTS - 100% LOAD
Design
Maximum-Continuous
Rating (MCR)
January 27, 2004 Test (**corrected to MCR, see Note
4)
January 28, 2004 Test (**corrected to MCR, see Note
4) Boiler Efficiency (percent) 88.1 (Coal)
90.0 (Pet Coke) 91.6 **(Note 1) 91.7 **(Note 1)
Capacity Calculation (percent) NA 95.3 95.4 Main Steam (Turbine Inlet)
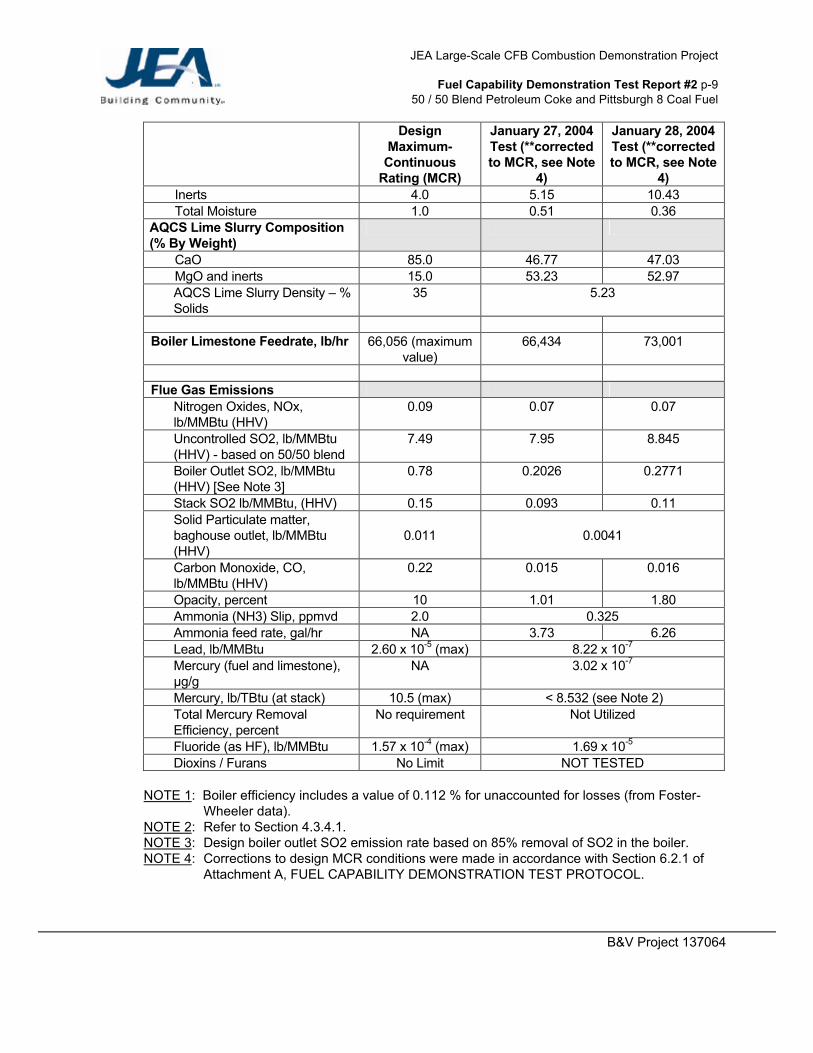
Opacity, percent 10 1.01 1.80 Ammonia (NH3) Slip, ppmvd 2.0 0.325 Ammonia feed rate, gal/hr NA 3.73 6.26 Lead, lb/MMBtu 2.60 x 10⁻⁵ (max) 8.22 x 10⁻⁷ Mercury (fuel and limestone), µg/g
NA 3.02 x 10⁻⁷
Mercury, lb/TBtu (at stack) 10.5 (max) < 8.532 (see Note 2) Total Mercury Removal Efficiency, percent
No requirement Not Utilized
Fluoride (as HF), lb/MMBtu 1.57 x 10⁻⁴ (max) 1.69 x 10⁻⁵ Dioxins / Furans No Limit NOT TESTED
NOTE 1: Boiler efficiency includes a value of 0.112 % for unaccounted for losses (from Foster-
Wheeler data). NOTE 2: Refer to Section 4.3.4.1. NOTE 3: Design boiler outlet SO2 emission rate based on 85% removal of SO2 in the boiler. NOTE 4: Corrections to design MCR conditions were made in accordance with Section 6.2.1 of
Attachment A, FUEL CAPABILITY DEMONSTRATION TEST PROTOCOL.
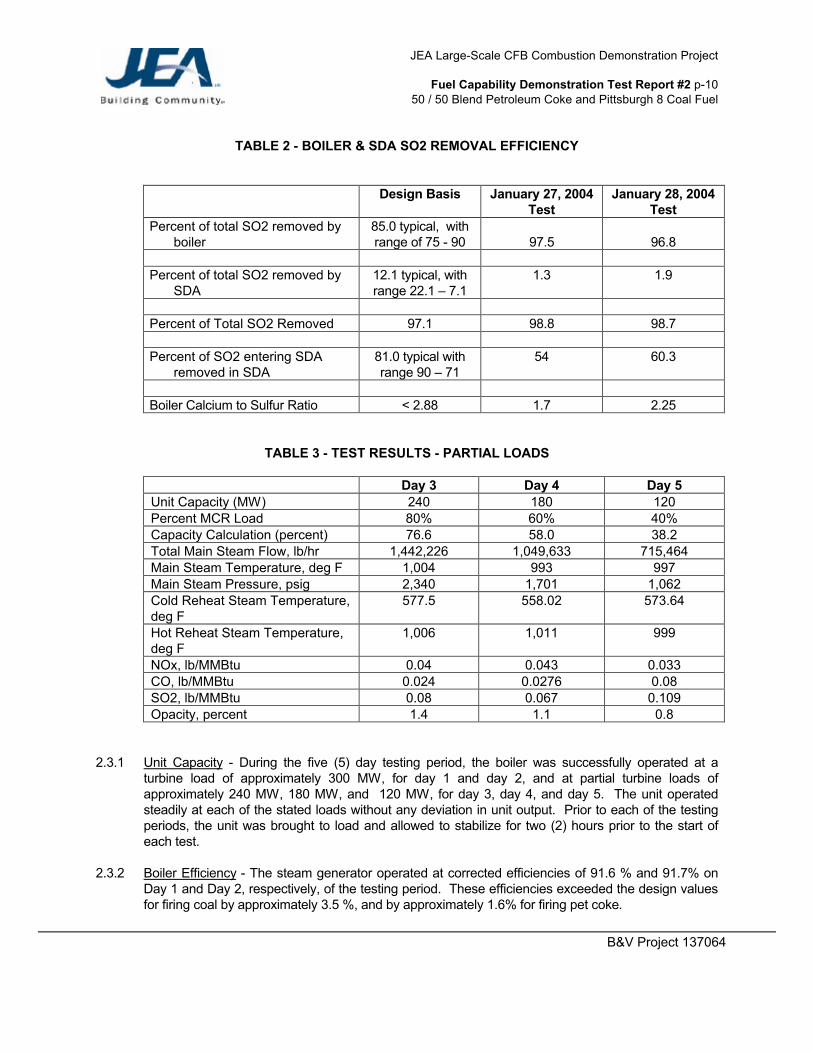
2.3.1 Unit Capacity - During the five (5) day testing period, the boiler was successfully operated at a
turbine load of approximately 300 MW, for day 1 and day 2, and at partial turbine loads of approximately 240 MW, 180 MW, and 120 MW, for day 3, day 4, and day 5. The unit operated steadily at each of the stated loads without any deviation in unit output. Prior to each of the testing periods, the unit was brought to load and allowed to stabilize for two (2) hours prior to the start of each test.
2.3.2 Boiler Efficiency - The steam generator operated at corrected efficiencies of 91.6 % and 91.7% on
Day 1 and Day 2, respectively, of the testing period. These efficiencies exceeded the design values for firing coal by approximately 3.5 %, and by approximately 1.6% for firing pet coke.
Fuel Capability Demonstration Test Report #2 p-11 50 / 50 Blend Petroleum Coke and Pittsburgh 8 Coal Fuel
B&V Project 137064
2.3.3 Steam Temperature - During both days at 100% load operation, the average corrected main steam temperature measured at the turbine inlet was 1,001 deg F, which is within the design tolerances of the unit. Additionally, the corrected hot reheat steam temperature measured at the turbine inlet was 1,018 deg F, which is also within the design tolerances of the unit. During partial load operation, the main steam temperatures and the hot reheat temperatures were within the design tolerances previously listed in Section 2.1.
2.3.4 Steam Production - The steam flows of the unit at the 100% load operation cases and partial load
operation cases were each determined by adding the main steam desuperheating system flow rates to the feed water system flow rates, and subtracting the continuous blow down flow rates and the sootblowing steam flow rates. The data for each of these systems were retrieved from the plant information system database. The main steam flow rates were corrected for deviations from the design MCR feedwater temperature. Although the corrected main steam flow rates determined for the 100% load operation cases were less than the design flow rates established by Foster-Wheeler, the main steam flow rates were adequate to maintain the steam turbine at the desired plant output. The main steam flow rates at the partial load operation cases were adequate to maintain the steam turbine at the required output.
2.3.5 Calcium to Sulfur Ratio (Ca:S) - The calcium to sulfur ratio represents the ability of the CFB boiler
and limestone feed system to effectively remove the sulfur dioxide produced by the combustion process of the boiler. The maximum ratio established for firing the blended coal was 2.88. The calculated calcium to sulfur ratios for Day 1 and Day 2 are approximately 1.7 and 2.25, respectively. These values represent SO2 removal efficiencies for the boiler of greater than 95 % which are acceptable values for a CFB. SO2 reductions of greater than 90% are typically achieved in a CFB with Ca:S ratios of 2 to 2.5. These values are dependent on the sulfur content in the fuel and the reactivity of the limestone.
3.0 BOILER EFFICIENCY TESTS
The unit was operated at a steady turbine load of approximately 300 MW (100% MCR) for two (2) consecutive days as prescribed in Section 2 of the Attachment A Test Protocol. During these two days, data were recorded via the PI (Plant Information) System and were also collected by independent testing contractors. These data were then used to determine the unit’s boiler efficiency. No significant operational restrictions were observed during testing at the 100% MCR condition.
3.1 Calculation Method
The boiler efficiency calculation method was based on a combination of the abbreviated heat loss method as defined in the ASME Power Test Code (PTC) 4.1, 1974, reaffirmed 1991, and the methods described in ASME PTC 4. The method was modified to account for the heat of calcination and sulfation within the CFB boiler SO2 capture mechanism. The methods have also been modified to account for process differences between conventional and fluidized bed boilers to account for the addition of limestone. These modifications account for difference in the dry gas quantity and the additional heat loss/gain due to calcinations / sulfation. A complete description of the modified procedures is included in Section 4.2 of Attachment A. Some of the heat losses included losses due to the heat in dry flue gas, unburned carbon in the bed ash and the fly ash, and the heat loss due to radiation and convection from the insulated boiler surfaces. A complete list of the heat losses can be found in Section 4.2.1 of Attachment A. The completed efficiency calculations are included in Attachment F to this report.
Fuel Capability Demonstration Test Report #2 p-12 50 / 50 Blend Petroleum Coke and Pittsburgh 8 Coal Fuel
B&V Project 137064
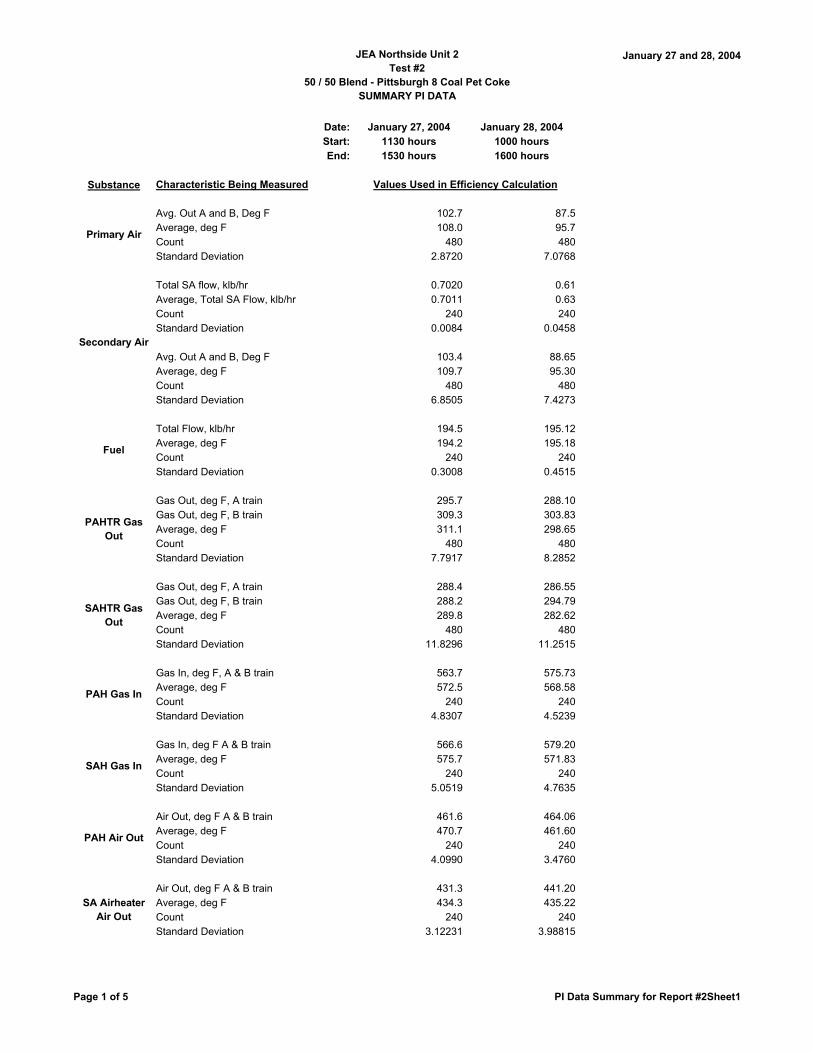
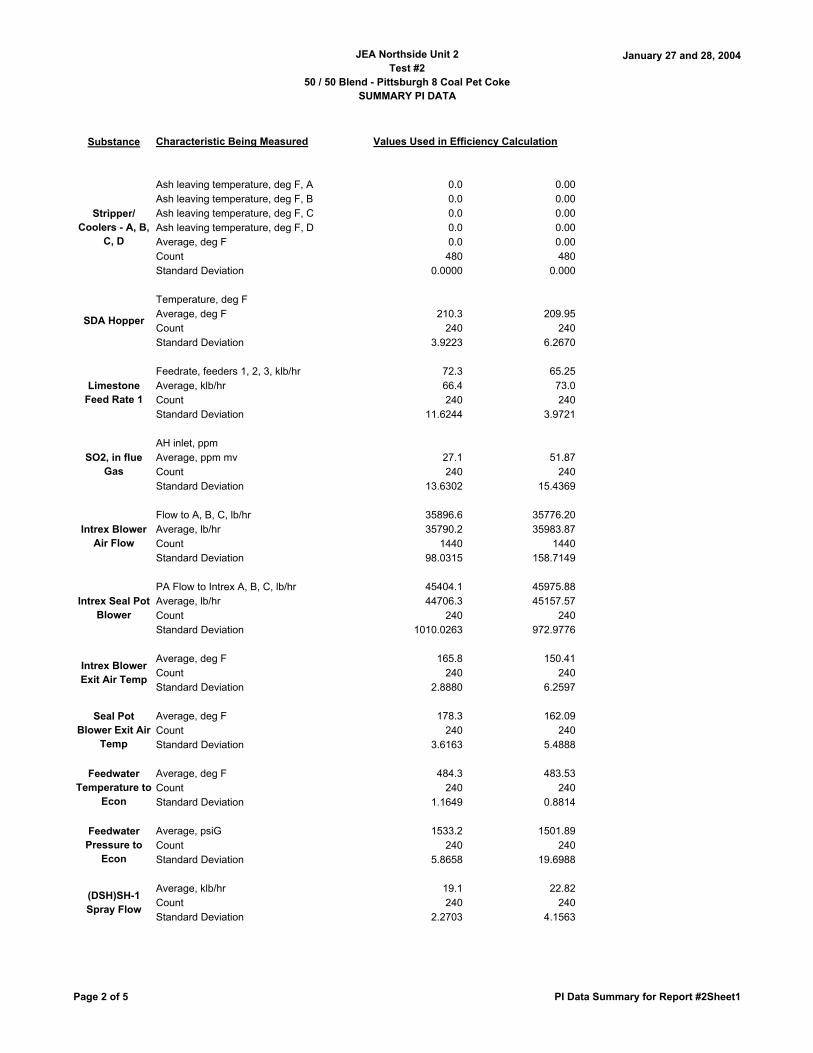
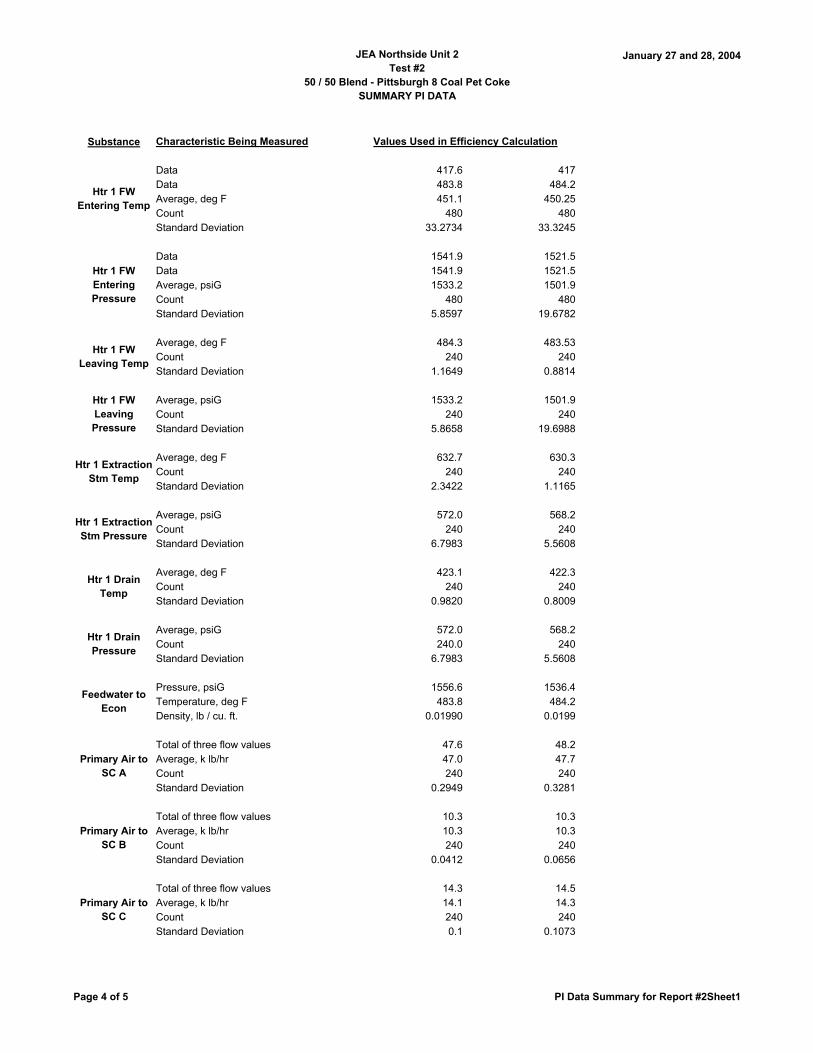
3.2 Data and Sample Acquisition
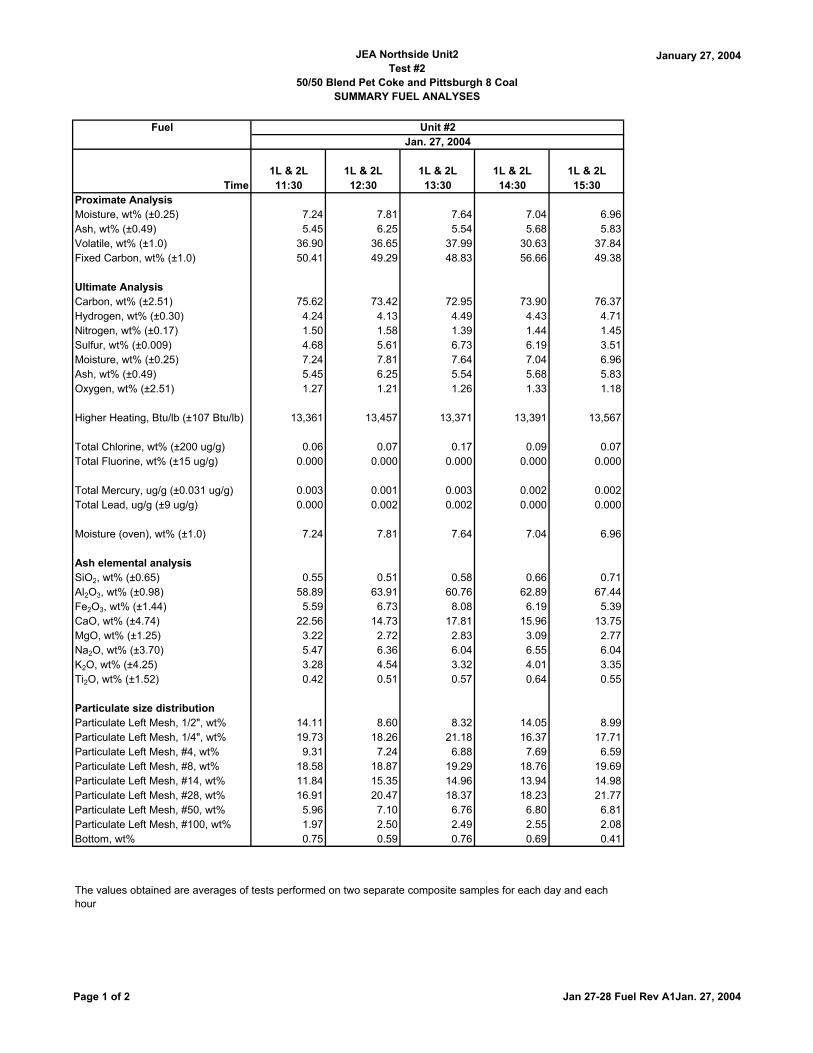
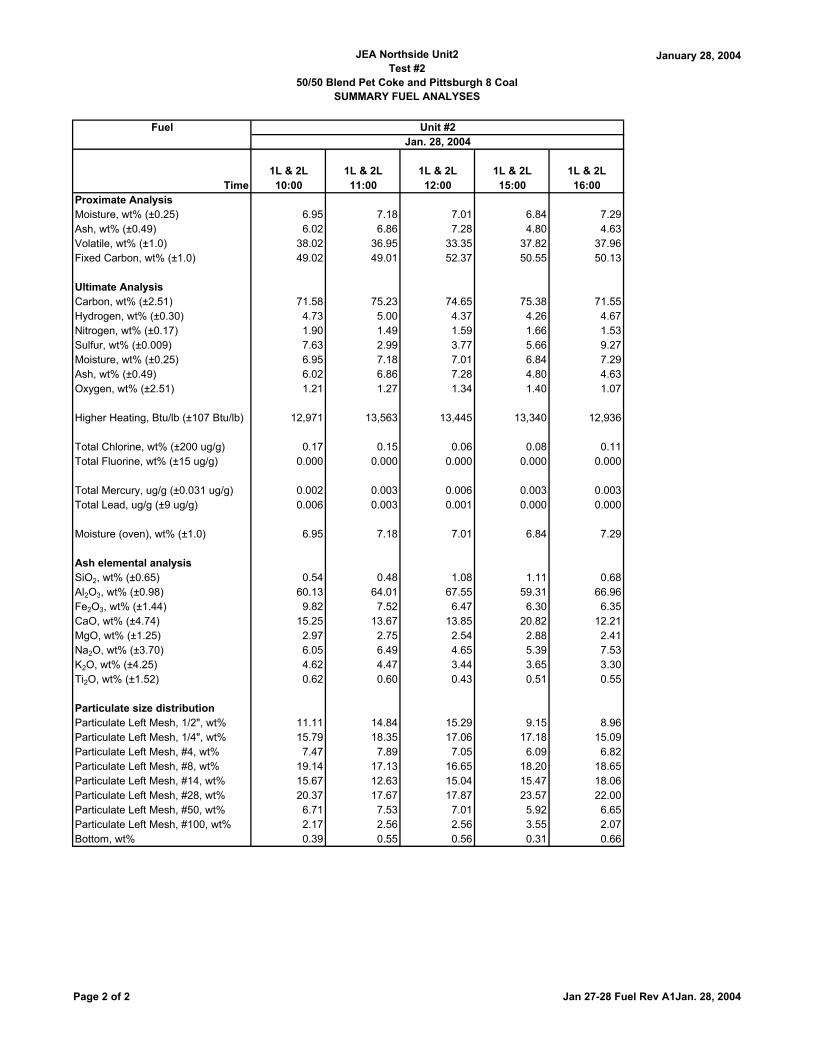
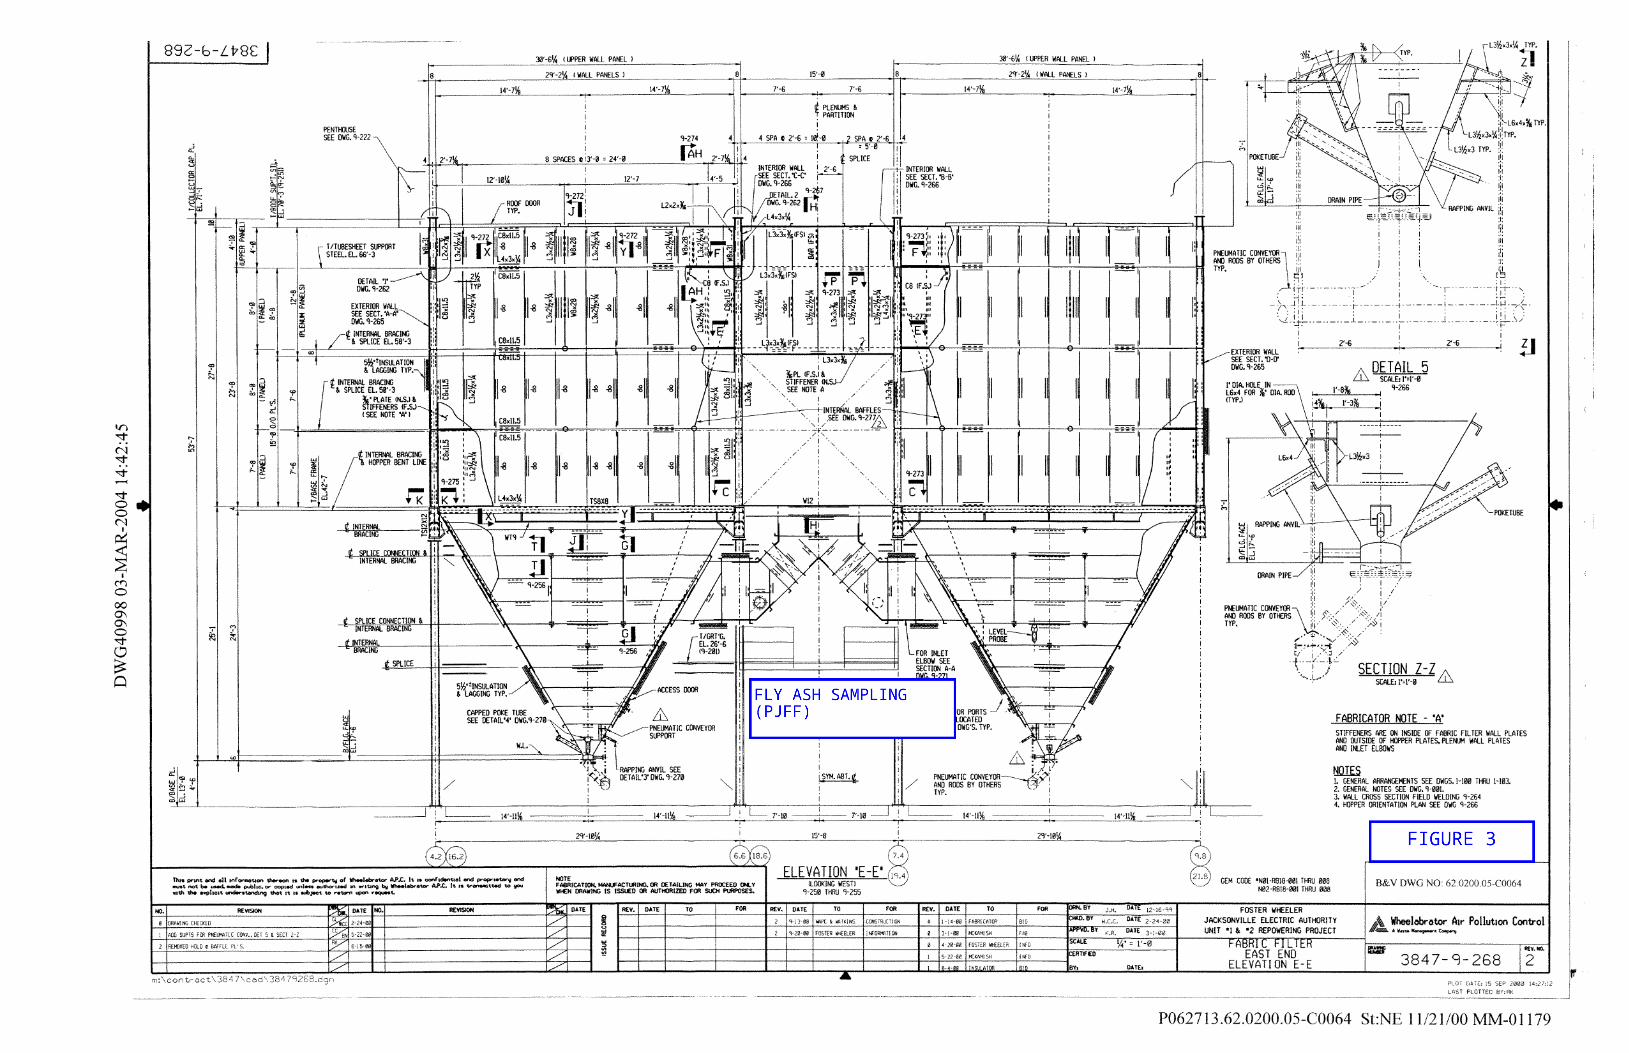
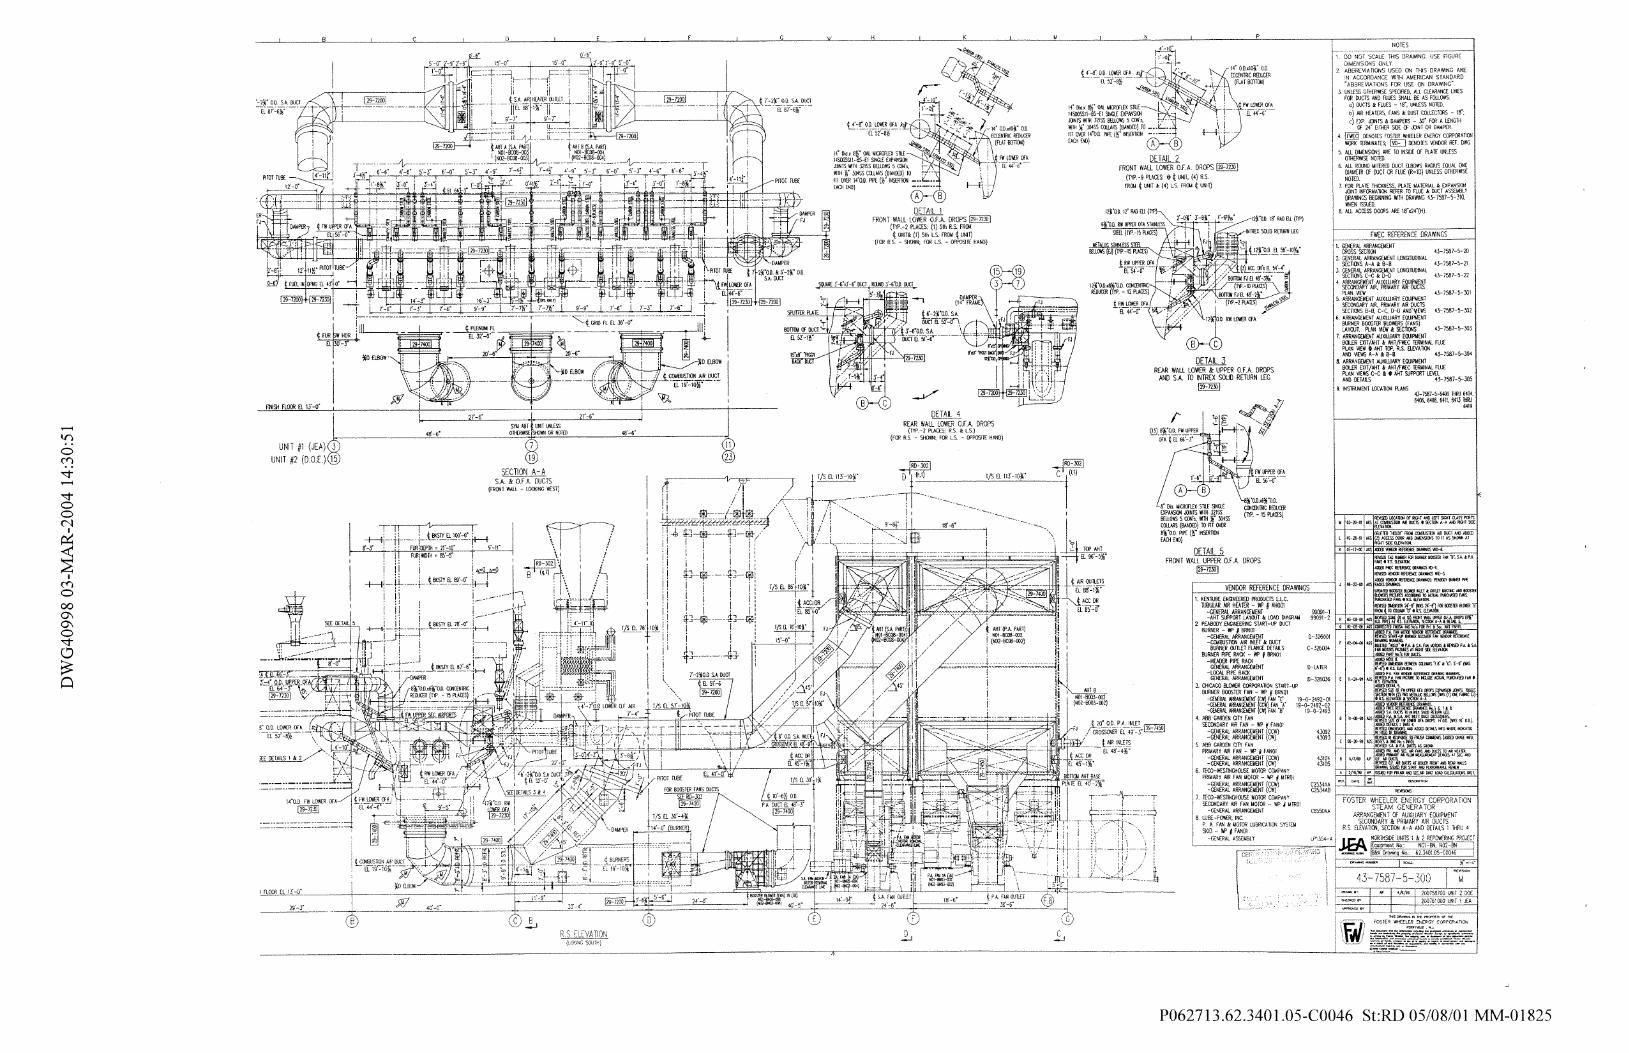
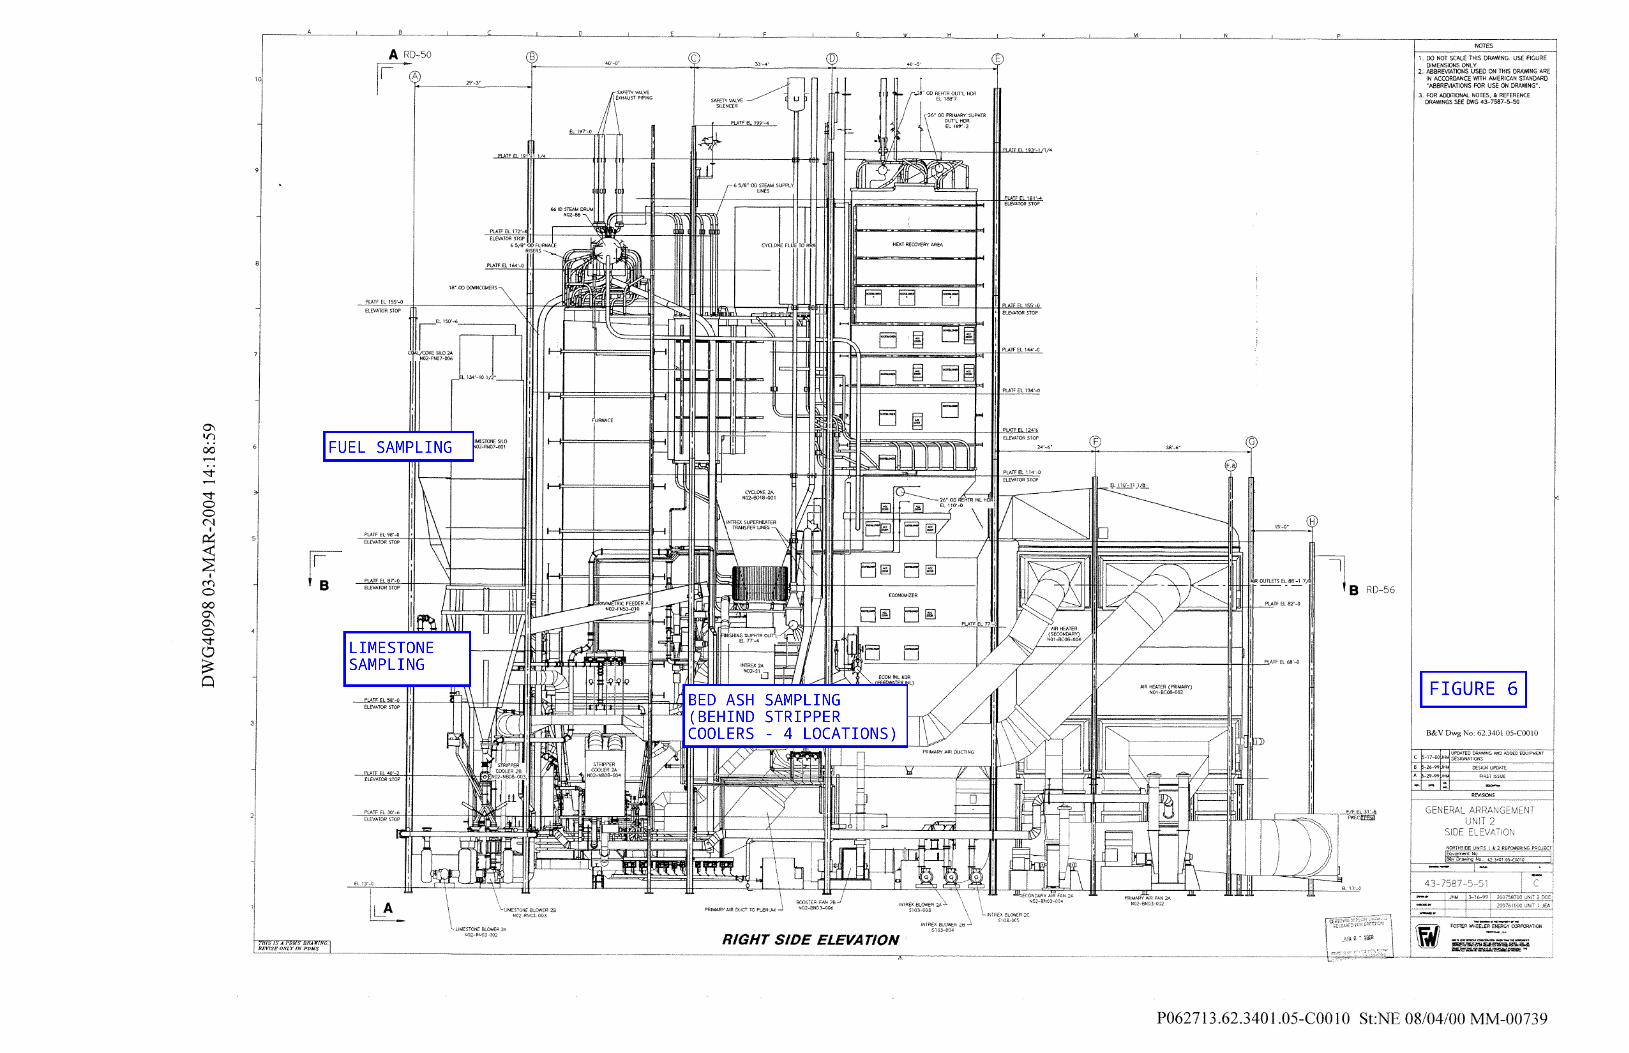
During the tests, permanently installed plant instrumentation was used to measure most of the data which were required to perform the boiler efficiency calculations. The data were collected electronically utilizing JEA’s Plant Information (PI) system. The data provided by the plant instrumentation is included in Attachment D, PI Data Summary. Additional data required for the boiler efficiency calculations were provided by two independent testing contractors, PGT/ESC, and Clean Air Engineering (CAE). A summary of this information is located in Attachments G, H, I, J, and K, lab analyses provided by PGT/ESC for the fuel, limestone, bed ash, fly ash, and environmental data, and Attachment C, CAE Test Report, respectively. As directed in the test protocol (Attachment A), test data for days 1 and 2 were taken and labeled by CAE and PGT. No flue gas sampling was performed on the unit during operations at reduced loads. Data were, however, recorded by the CEMS system and are reported in this document. The majority of the data utilized in the boiler efficiency calculation and sulfur capture performance, such as combustion air and flue gas temperatures and flue gas oxygen content, were stored and retrieved by the plant information system, as noted above. Data for the as-fired fuel, limestone, and resulting bed ash, fly ash, and exiting flue gas constituents were provided via laboratory analyses. Samples were taken in the following locations by PGT and forwarded to a lab for analysis. (Refer to Figures 1 thru 6 for approximate locations). Lime (Figure 1):
Lime slurry samples were taken from the sample valve located on the discharge of the lime slurry transfer pump. This valve is located in the AQCS Spray Dryer Absorber (SDA) pump room.
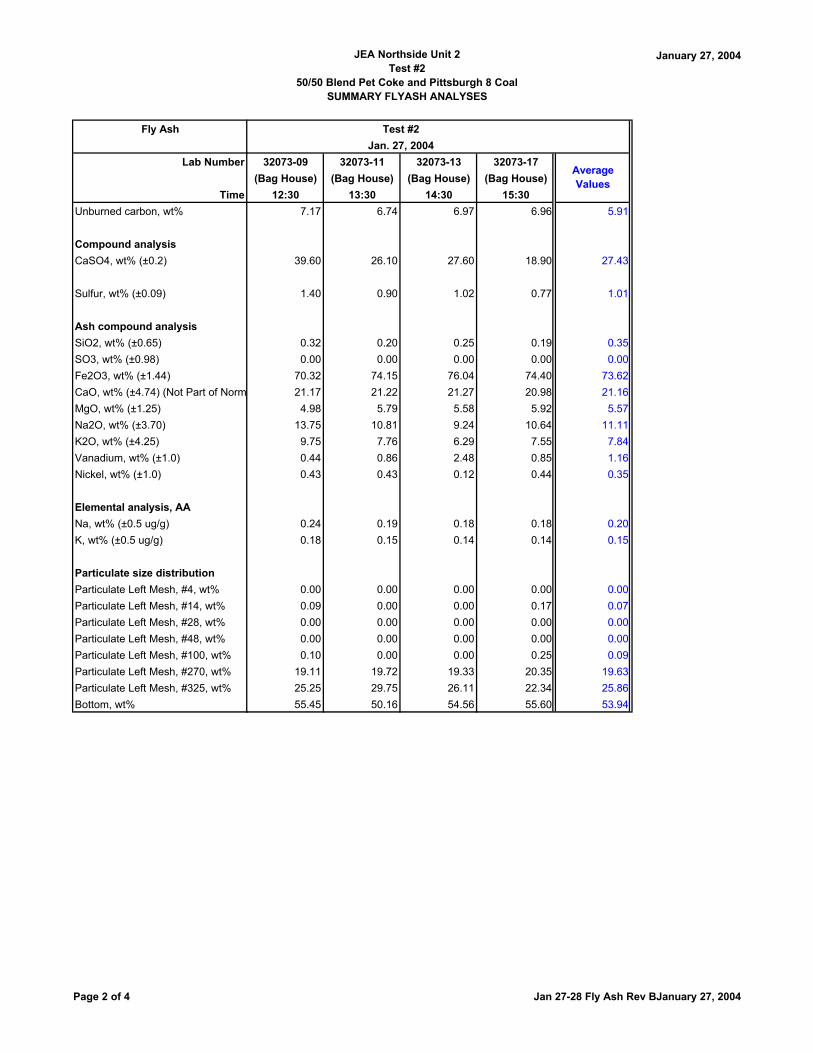
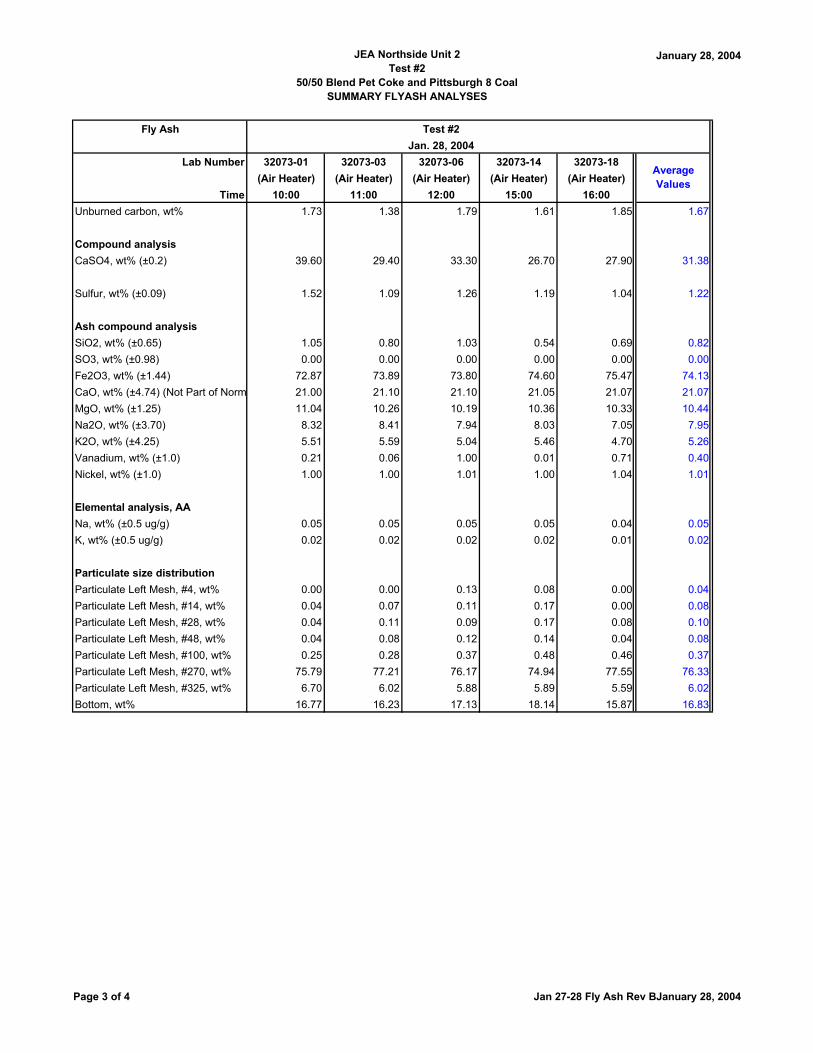
Fly Ash (Figures 2, 3, and 4):
Fly Ash samples were taken by two different methods. 1) Fly ash was taken by isokinetic sampling at the inlet to the SDA. These samples were taken
to determine ash loading rates and also obtain samples for laboratory analysis of ash constituents.
2) Fly ash was also taken by grab sample method in two different locations. One grab sample was taken ever hour at a single air heater outlet hopper and another grab sample at a single bag house fabric filter hopper.
Fuel (Figures 4, 5, and 6):
Fuel samples were taken from the sample port at the discharge end of each gravimetric fuel feeder. The fuel samples were collected using a coal scoop inserted through the 4 inch test port at each operating fuel conveyor.
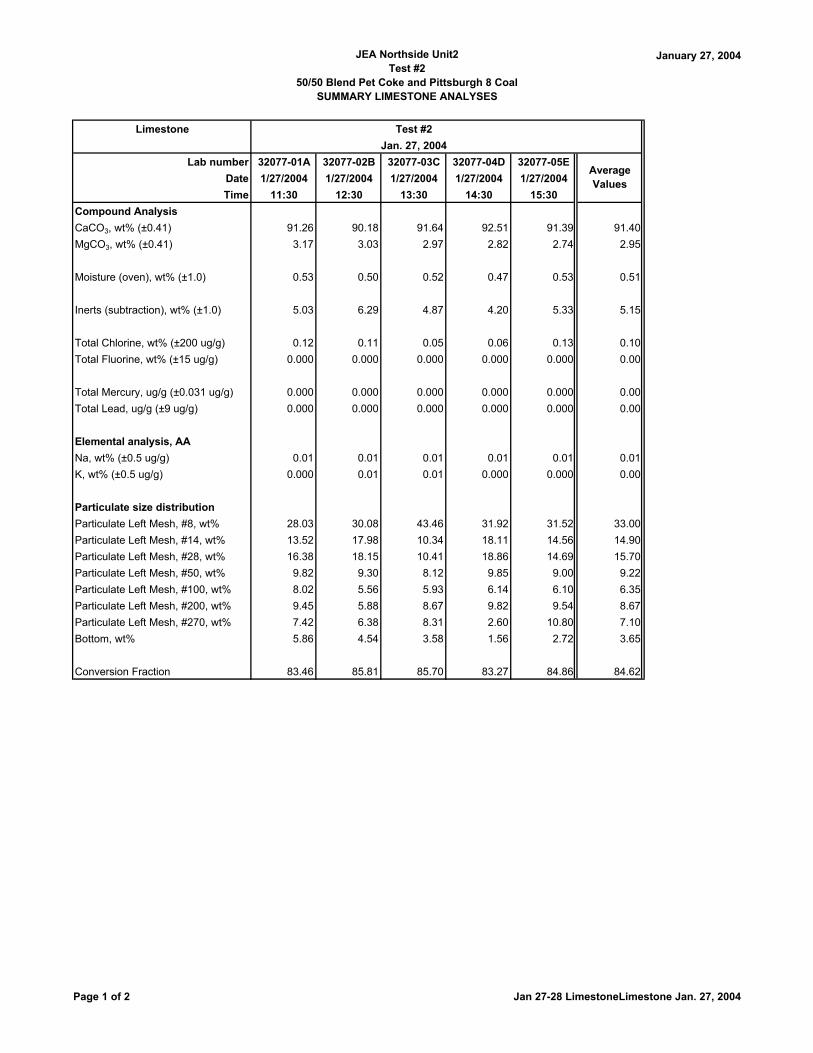
Limestone (Figures 4 and 6):
Limestone samples were taken from the outlet of each operating limestone rotary feeder. The samples were collected using a scoop passed into the flow stream of the 4 inch test ball valve in the neck of each feeder outlet.
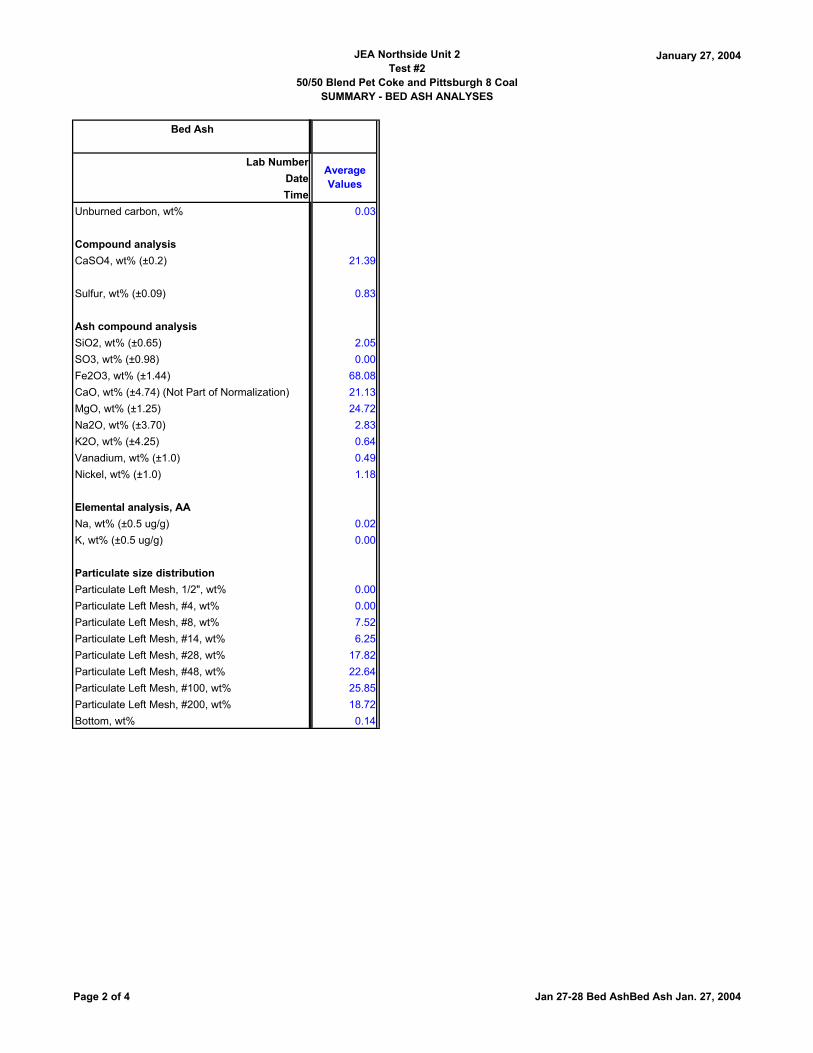
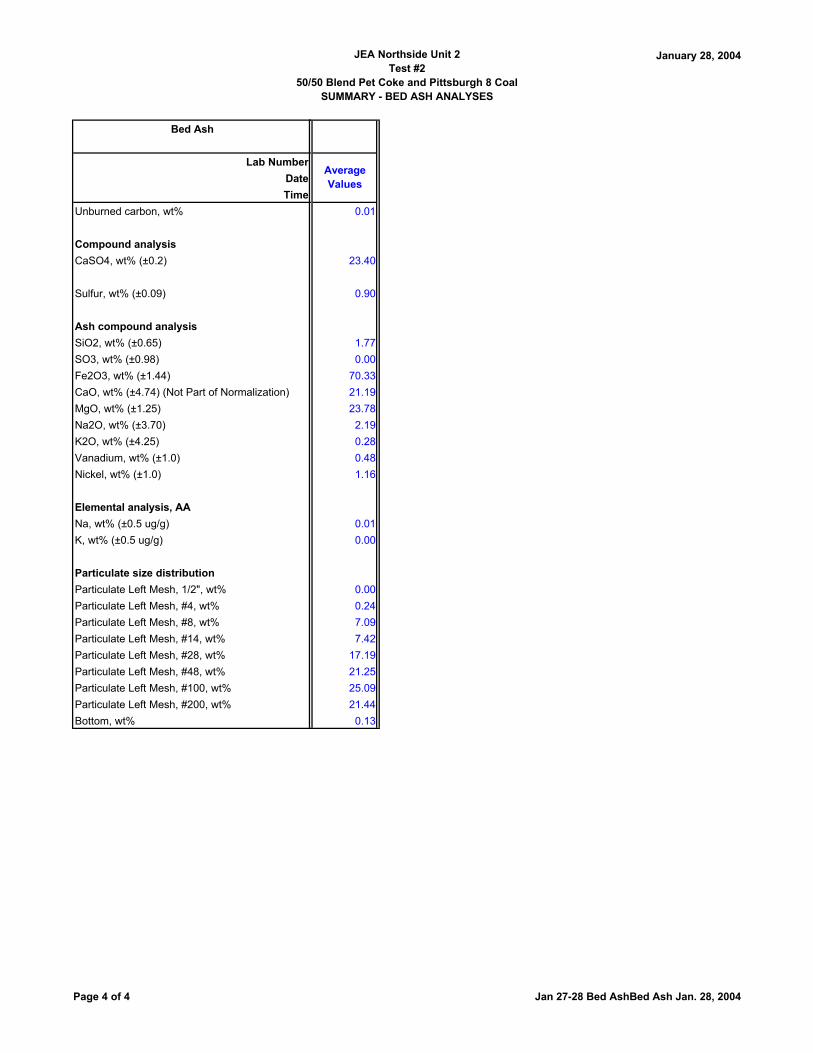
Bed Ash (Figure 6):
Bed Ash samples were taken from each of the operating stripper cooler rotary valve outlets. The samples were taken by passing a stainless steel scoop through the 4 inch test port at each operating stripper cooler.
Fuel Capability Demonstration Test Report #2 p-13 50 / 50 Blend Petroleum Coke and Pittsburgh 8 Coal Fuel
B&V Project 137064
As instructed by the Test Protocol, all of the samples were labeled and transferred to a lab for analysis. The average values were determined and used as input data for performing the boiler efficiency calculation. The results of the lab analyses are included in Attachments G, H, I, and J.
4.0 AQCS INLET AND STACK TESTS 4.1 System Description
The Unit 2 AQCS consists of a single, lime-based spray dryer absorber (SDA) and a multi-compartment pulse jet fabric filter (PJFF). The SDA has sixteen independent dual-fluid atomizers. The fabric filter has eight isolatable compartments. The AQCS system also uses reagent preparation and byproduct handling subsystems. The SDA byproduct solids/fly ash collected by the PJFF is pneumatically transferred from the PJFF hoppers to either the Unit 2 fly ash silo or the Unit 2 AQCS recycle bin. Fly ash from the recycle bin is slurried and reused as the primary reagent by the SDA spray atomizers. The reagent preparation system converts quicklime (CaO), which is delivered dry to the station, into a hydrated lime [Ca(OH)2] slurry, which is fed to the atomizers as a supplemental reagent.
4.2 Unit Emissions Design Points The following sections describe the desired emissions design goals of the unit. The tests were conducted in accordance with standard emissions testing practices and test methods as listed in Section 4.2.7. It should be noted that not all tests conducted fit exactly the 4 hour performance test period that was the basis of the fuel capability demonstration test. Several of the tests (especially those not based on CEMS) had durations that were different than the 4 hour performance period due to the requirements of the testing method and good engineering/testing practice. All sampling tests were done at the 100% load case only. All data at the 100%, 80%, 60% and 40% performance load tests were collected by the CEMS.
The following gaseous emissions were measured for each 4-hour interval during the Test (EPA Permit averaging period).
a. Nitrogen oxides (NOx) values in the flue gas as measured in the stack were expected to be less than 0.09 lb/MMBtu HHV fuel heat input. The hourly average lb/MMBtu values reported by the Continuous Emissions Monitoring system (CEMS) were used as the measure of NOx in the flue gas over the course of each fuel test. The average NOx values for Day 1 and Day 2, based on HHV, were 0.07 lb/MMBtu and 0.07 lb/MMBtu, respectively. Both of these values were less than the expected maximum value.
b. Sulfur dioxide (SO2) The design operating condition of the unit is to remove 85 percent
of the SO2 in the boiler, with the balance to make the permitted emission rate removed in the SDA. Burning performance coal with a boiler SO2 removal efficiency of 85%, the SO2 concentration at the air heater outlet was expected to be 1.12 lb/MMBtu, with an uncontrolled SO2 emission rate (at 0% SO2 removal) calculated to be 7.49 lb/MMBtu. JEA has chosen to operate at a much higher boiler SO2 removal rate than design. Part of the reason for this operating mode is that reliability of the limestone feed system during and after the startup period was inadequate, resulting in a substantial number of periods
Fuel Capability Demonstration Test Report #2 p-14 50 / 50 Blend Petroleum Coke and Pittsburgh 8 Coal Fuel
B&V Project 137064
with excess SO2 emissions. Over time the operations group has learned that if limestone feed is higher than normally desired the likelihood of excess emissions during an upset is reduced. Additionally, control of the AQCS slurry density at the desired density levels has been difficult due to some instrumentation and control issues that are not completely resolved yet. Modifications to increase the reliability and consistency of limestone feed are scheduled to be complete in late 2005, which should permit a change toward lower boiler SO2 removal and increased SDA removal.
The SO2 concentration at the SDA inlet was measured by an independent test contractor, Clean Air Engineering (CAE). These results are included in Attachment C. The average SO2 values for Day 1 and Day 2, based on HHV of the fuel, out of the air heaters and into the SDA, were 0.093 lb/MMBtu and 0.11 lb/MMBtu, respectively. Both of these values were below the expected outlet emission rate. In fact, the boiler removed 98.8% and 98.7% respectively, in comparison to the design removal rate of 85%. Uncontrolled SO2 emissions rates were calculated to be 7.95 lb/MMBtu and 8.845 lb/MMBtu, respectively, for an increased SO2 input of 6.1% and 18.1% above the design performance coal SO2 input of 7.49 lb/MMBtu.
The SO2 emissions from the stack during the execution of the tests were expected to be less than 0.15 lb/MMBtu. The hourly average lb/MMBtu values (based on HHV of the fuel) reported by CEMS were used as the measure of SO2 emissions from the stack for the test. The average SO2 values for Day 1 and Day 2, (based on HHV of the fuel) were 0.102 lb/MMBtu and 0.106 lb/MMBtu, respectively. These values were 32% and 29% lower than the 0.15 lb/MMBtu permitted emission rate.
b. Solid particulate matter in the flue gas at the fabric filter outlet was expected to be
maintained at less than 0.011 lb/MMBtu HHV fuel heat input. These values were measured at the stack by CAE. The average particulate matter value for the testing period was 0.004 lb/MMBtu which is below the expected maximum value.
4.3.2 CO Emissions Design Point
Carbon monoxide (CO) in the flue gas was expected to be less than or equal to 0.22 lb/MMBtu HHV fuel heat input at 100% MCR. This sample was measured at the stack by the plant CEMS. The average values for Day 1 and Day 2 were 0.015 lb/MMBtu and 0.016 lb/MMBtu, respectively. The average values were less than the maximum expected value.
4.3.3 SO3 Emissions Design Point Sulfur Trioxide (SO3) in the flue gas was assumed to be zero due to the high removal efficiency of the SDA. No testing was done for SO3 as explained in the Test Protocol located in Attachment A. See Section 4.2.3 of the Fuel Capability Test Protocol for the rationale.
4.3.4 NH3/ Lead/ Mercury/ Fluorine Emissions Design Points NH3, Lead, Mercury, and Fluorine gaseous emissions were measured during the Test (EPA Permit averaging period). Mercury sampling and analysis was performed at the inlet to the AQCS system in addition to the samples taken at the stack. Both samples were taken by CAE. Lead, ammonia and Fluorine were sampled only at the stack by CAE. The average values are indicated in Table 1.
Fuel Capability Demonstration Test Report #2 p-15 50 / 50 Blend Petroleum Coke and Pittsburgh 8 Coal Fuel
B&V Project 137064
4.3.4.1 Mercury Testing Anomaly
During the emissions tests, the reagent used in the fourth impinger of the Ontario Hydro sampling train was a 5% HNO3 (nitric acid) / 10% H2O2 (hydrogen peroxide) solution. Mercury levels in both the 5% / 10% reagent blank and the 5% / 10% portion of the field train blanks were elevated. The mercury concentration in the reagent field blanks of the other solutions (KCI, potassium chloride, and KMnO4, potassium permanganate) used in the Ontario Hydro sampling train was at the expected levels or below the detection limit. In accordance with the Ontario Hydro Method, the allowable blank adjustments have been made to the final results presented. A review of the total mercury in the coal was completed for comparison to measured values. The coal analyses indicated a mercury content of approximately 0.003 µg/g, with a limestone mercury content of 0.03 µg/g. This is equivalent to a total mercury content of 0.0007 lb/hr. This represents more mercury than what was measured by the independent test contractor at the inlet to the SDA. However due to the bias adjustment made by the independent test contractor, the removal efficiency was lower than expected. Subsequent tests should help determine the expected mercury removal efficiency of the unit.
4.3.5 Dioxin and Furan Emissions Design Points Dioxin and Furan gaseous emissions testing were not required for evaluation of the blended coal.
4.3.6 Opacity The opacity was measured by the plant CEMS/COMS (Continuous Opacity Monitoring System) to determine the opacity of the unit over a six minute block average during the test period. The maximum expected opacity was 10%. The testing indicated that the maximum opacity of the unit during the two day test was 1.8%, which is much less than the maximum opacity value.
4.4 Flue Gas Emissions Test Methods
The emissions test methods used for the demonstration test were based upon utilizing 40 CFR 60 based testing methods or the plant CEMS. The emissions tests were conducted by CAE. The following test methods were utilized:
• Particulate Matter at SDA Inlet – USEPA Method 17 • Particulate Matter at Stack – USEPA Method 5 • Oxides of Nitrogen at Stack – Plant CEMS • Sulfur Dioxide at SDA Inlet – USEPA Method 6C • Sulfur Dioxide at Stack – Plant CEMS • Carbon Monoxide at Stack – Plant CEMS • Ammonia at Stack – CTM 027 • Lead at Stack – USEPA Method 29 • Mercury at SDA Inlet – Ontario Hydro Method • Fluorine at Stack – USEPA Method 13B • Dioxin/Furans – PCDD/F
Specific descriptions of the testing methods (non-CEMS) are included in the Clean Air Engineering Emissions Test Report located in Attachment D of this document.
Fuel Capability Demonstration Test Report #2 p-16 50 / 50 Blend Petroleum Coke and Pittsburgh 8 Coal Fuel
B&V Project 137064
4.5 Continuous Emission Monitoring System
The plant CEMS was utilized for measurement of gaseous emissions as a part of the fuel capability demonstration and as listed in Section 4.2.7. The CEMS equipment was integrated by KVB-Entertec (now GE Energy Systems). The system is a dilution extractive system consisting of Thermo Environmental NOX, SO2, and CO2 analyzers. The data listed for CEMS in Section 4.2.7 originated from the certified Data Acquisition Handling System (DAHS).
Fuel Capability Demonstration Test Report #2 p-17 50 / 50 Blend Petroleum Coke and Pittsburgh 8 Coal Fuel
B&V Project 137064
Attachments
Attachment A - Fuel Capability Demonstration Test Protocol Attachment B - Boiler Efficiency Calculation Attachment C - CAE Test Report Attachment D - PI Data Summary Attachment E - Abbreviation List Attachment F - Isolation Valve List Attachment G - Fuel Analyses - 50/50 Blend Pet Coke and Pittsburgh 8 Coal Attachment H - Limestone Analyses Attachment I - Bed Ash Analyses Attachment J - Fly Ash (Air Heater and PJFF) Analyses Attachment K - Ambient Data, Jan. 27, 2004 and Jan. 28, 2004 Attachment L - Ambient Temperatures, Jan. 29, 2004, Jan. 30, 2004, and Jan. 31, 2004
Fuel Capability Demonstration Test Report #2 - ATTACHMENTS 50 / 50 Blend Petroleum Coke and Pittsburgh 8 Coal Fuel
B&V Project 137064
ATTACHMENT B
Boiler Efficiency Calculation
Jacksonville Electric Authority Unit Tested: Northside Unit 2 - Test #2 (50/50 Blend) Boiler Efficiency: 91.64 Test Date: January 27, 2004 Test Start Time: 11:30 AM Test End Time: 3:30 PM Test Duration, hours: 4
DATA INPUT SECTION - INPUT ALL DATA REQUESTED IN SECTION 1 EXCEPT AS NOTED
1. DATA REQUIRED FOR BOILER EFFICIENCY DETERMINATION
AS - TESTED
Average Value Units Symbol1.1 Fuel1.1.1 Feed Rate, lb/h 194,172 lb/h Wfe - Summation feeder feed rates - FN-34-FT-508, 528, 548, 568, 588, 608, 628, 668
Composition ("as fired")1.1.2 Carbon, fraction 0.7445 lb/lb AF fuel Cf - Laboratory analysis of coal samples obtained by grab sampling.1.1.3 Hydrogen, fraction 0.0440 lb/lb AF fuel Hf - Laboratory analysis of coal samples obtained by grab sampling.1.1.4 Oxygen, fraction 0.0125 lb/lb AF fuel Of - Laboratory analysis of coal samples obtained by grab sampling.1.1.5 Nitrogen, fraction 0.0147 lb/lb AF fuel Nf - Laboratory analysis of coal samples obtained by grab sampling.1.1.6 Sulfur, fraction 0.0534 lb/lb AF fuel Sf - Laboratory analysis of coal samples obtained by grab sampling.1.1.7 Ash, fraction 0.0575 lb/lb AF fuel Af - Laboratory analysis of coal samples obtained by grab sampling.1.1.8 Moisture, fraction 0.0734 lb/lb AF fuel H2Of - Laboratory analysis of coal samples obtained by grab sampling.1.1.9 Calcium, fraction 0.0000 lb/lb AF fuel Caf - Laboratory analysis of coal samples obtained by grab sampling - assume a value of zero if not reported.1.1.10 HHV 13,429 Btu/lb HHV - Laboratory analysis of coal samples obtained by grab sampling.
Composition1.3.2 Organic Carbon, wt fraction 0.0003 lb/lb BA Cbao - Laboratory analysis of bottom ash samples obtained by grab sampling.1.3.3 Inorganic Carbon, wt fraction 0.0000 lb/lb BA Cbaio - Laboratory analysis of bottom ash samples obtained by grab sampling.1.3.4 Total Carbon, wt fraction - CALCULATED VALUE DO NOT ENTER 0.0003 lb/lb BA Cba = Cbao + Cbaio1.3.5 Calcium, wt fraction 0.2113 lb/lb BA Caba - Laboratory analysis of bottom ash samples obtained by grab sampling.1.3.6 Carbonate as CO2, wt fraction 0.0000 lb/lb BA CO2ba - Laboratory analysis of bottom ash samples obtained by grab sampling.1.3.7 Bottom Ash Flow By Iterative Calculation - ENTER ASSUMED VALUE 42,543 lb/h Wbae
TO BEGIN CALCULATION
1.4 Fly Ash Composition
1.4.1 Organic Carbon, wt fraction 0.0169 lb/lb FA Cfao - Laboratory analysis of fly ash samples obtained by grab sampling.1.4.2 Inorganic Carbon, wt fraction 0.0000 lb/lb FA Cfaio - Laboratory analysis of fly ash samples obtained by grab sampling.1.4.3 Carbon, wt fraction - CALCULATED VALUE DO NOT ENTER 0.0169 lb/lb FA Cfa = Cfao + Cfaio1.4.4 Calcium, wt fraction 0.2096 lb/lb FA Cafa - Laboratory analysis of fly ash samples obtained by grab sampling.1.4.5 Carbonate as CO2, wt fraction 0.0000 lb/lb FA CO2fa - Laboratory analysis of fly ash samples obtained by grab sampling.1.4.6 Fly Ash Flow 30,492 LB/HR Wfam - Weight of fly ash from isokenetic sample collection.
Intrex Blower1.5.7 Flow Rate, lb/h 35,790 lb/h Wib - Plant instrument1.5.8 Blower Outlet Temperature, oF 166 oF tib
Seal Pot Blowers 1.5.9 Flow Rate, lb/h 44706 lb/h Wspb - Plant instrument1.5.10 Blower Outlet Temperature, oF 178 oF tspb
1 of 10
Jacksonville Electric Authority Unit Tested: Northside Unit 2 - Test #2 (50/50 Blend) Boiler Efficiency: 91.64 Test Date: January 27, 2004 Test Start Time: 11:30 AM Test End Time: 3:30 PM Test Duration, hours: 4
1.6 Ambient Conditions1.6.1 Ambient dry bulb temperature, °F 64.24 °F ta1.6.2 Ambient wet bulb temperature, °F 57.96 °F tawb1.6.3 Barometric pressure, inches Hg 29.99 inches Hg Patm1.6.4 Moisture in air, lbH2O/lb dry air 0.0087 lbH2O/lb dry air Calculated: H2OA - From psychometric chart at temperatures ta and tawb adjusted to test Patm.
1.7 Flue GasAt Air Heater Outlet
1.7.1 Temperature (measured), °F 304.70 °F Tg15 - Weighted average from AH outlet plant instruments (based on PA and SA flow rates)1.7.2 Temperature (unmeasured), °F Calculated
Composition (wet)1.7.3 O2 0.0450 percent volume O2 - Weighted average from test instrument1.7.4 CO2 Not Measured percent volume CO21.7.5 CO Not Measured percent volume CO1.7.6 SO2 Not Measured percent volume SO2
At Air Heater Inlet1.7.7 Temperature, °F 574.12 °F tG14 - Plant Instrument
Composition (wet)1.7.8 O2 0.0360 percent volume1.7.9 CO2 Not Measured percent volume1.7.10 CO Not Measured percent volume1.7.11 SO2 0.0027 percent volume measurement is in ppm
CEM Sample Extraction At Outlet Of Economizer Composition
Jacksonville Electric Authority Unit Tested: Northside Unit 2 - Test #2 (50/50 Blend) Boiler Efficiency: 91.64 Test Date: January 27, 2004 Test Start Time: 11:30 AM Test End Time: 3:30 PM Test Duration, hours: 4
2. REFERENCE TEMPERATURES
2.1 Average Air Heater Inlet Temperature 109.29
3. SULFUR CAPTURE The calculation of efficiency for a circulating fluid bed steam generator that includes injection of a reactive sorbent material, such as limestone, to reduce sulfur dioxide emissions is an iterative calculation to minimize the number of parameters that have to be measured and the number of laboratory material analyses that must be performed. This both reduces the cost of the test and increases the accuracy by minimizing the impact of field and laboratory instrument inaccuracies.
To begin the process, assume a fuel flow rate. The fuel flow rate is required to complete the material balances necessary to determine the amount of limestone used and the effect of the limestone reaction on the boiler efficiency. The resulting boiler efficiency is used to calculate a value for the fuel flow rate. If the calculated flow rate is more than 1 percent different than the assumed flow rate, a new value for fuel flow rate is selected and the efficiency calculation is repeated. This process is repeated until the assumed value for fuel flow and the calculated value for fuel flow differ by less than 1 percent of of the value of the calculated fuel flow rate.
3.1 ASSUMED FUEL FLOW RATE, lb/h 182,495 lb/h
3.2 ASSUMED SULFUR EMISSIONS, fraction 0.0295 fraction Can get reading from CEMS system3.3 Sulfur Capture, fraction 0.9705
4.3 Bottom Ash Flow Rate4.3.1 Total bottom ash including bed change 42,543.0267140 lb/h
4.4 Limestone Flow Rate
Iterate to determine calcium to sulfur ratio and limestone flow rate. Enter an assumed value for the calcium to sulfur ratio. Compare resulting calculated calcium to sulfur ratio to assumed value. Change assumed value until the difference between the assumed value and the calculated value is less than 1 percent of the assumed value.
4.4.1 ASSUMED CALCIUM to SULFUR RATIO 1.9940 mole Ca/mole S4.4.2 Solids From Limestone - estimated 0.933458109 lb/lb limestone4.4.3 Limestone Flow Rate - estimated 66434 lb/h4.4.4 Calculated Calcium to Sulfur Ratio 1.993961966 mole Ca/mole S
LImestone Flow Rate from PI Data, lb/h 66,4344.4.5 Difference Estimated vs Assumed - Ca:S -1.65859E-05 percent
4.4.6 Calculated Fly Ash Flow Rate 30,492 lb/h
4.4.7 Difference Calculated vs Measured 0.0000582144 percent
4.5 Total Dry Refuse4.5.1 Total Dry Refuse Hourly Flow Rate 73,035 lb/h4.5.2 Total Dry Refuse Per Pound Fuel 0.4002 lb/lb AF fuel
4.6 Heating Value Of Total Dry Refuse4.6.1 Average Carbon Content Of Ash 0.0072 fraction4.6.2 Heating Value Of Dry Refuse 104.84 Btu/lb
5. HEAT LOSS DUE TO DRY GAS
5.1 Carbon Burned Adjusted For Limestone5.1.1 Carbon Burned 0.7416 lb/lb AF fuel5.1.2 Carbon Adjusted For Limestone 0.7767 lb/lb AF fuel
CALCULATION SECTION - ALL VALUES BELOW CALCULATED BY EMBEDDED FORMULAS - DO NOT ENTER DATA BELOW THIS LINE - EXCEPT ASSUMED VALUES FOR ITERATIVE CALCULATIONS
Jacksonville Electric Authority Unit Tested: Northside Unit 2 - Test #2 (50/50 Blend) Boiler Efficiency: 91.64 Test Date: January 27, 2004 Test Start Time: 11:30 AM Test End Time: 3:30 PM Test Duration, hours: 4
Determine Amount Of Flue Gas
Iterate to determine carbon dioxide volumetric content of dry flue gas. Enter an assumed value for excess air. Compare resulting calculated oxygen content to the measure oxygen content. Change assumed value of excess air until the difference between the calculated oxygen content value and the measured value oxygen content value is less than 1 percent of the assumed value. Use the calculated carbon dioxide value in subsequent calculations.
5.2 Air Heater Outlet
5.2.1 ASSUMED EXCESS AIR at AIR HEATER OUTLET 27.984 percent
5.2.2 Corrected Stoichiometric O2, lb/lb fuel 2.3786 lb/lb AF fuel5.2.3 Corrected Stoichiometric N2, lb/lb fuel 7.9007 lb/lb AF fuel
5.2.4 Flue Gas Composition, Weight Basis, lb/lb AF Fuel5.2.4.1 Carbon Dioxide, weight fraction 2.8459 lb/lb AF fuel5.2.4.2 Sulfur Dioxide, weight fraction 0.0031 lb/lb AF fuel5.2.4.3 Oxygen from air less oxygen to sulfur capture, weight fraction 0.6398 lb/lb AF fuel5.2.4.4 Nitrogen from air, weight fraction 10.1116 lb/lb AF fuel5.2.4.5 Nitrogen from fuel, weight fraction 0.0147 lb/lb AF fuel5.2.4.6 Moisture from fuel, weight fraction 0.0734 lb/lb AF fuel5.2.4.7 Moisture from hydrogen in fuel, weight fraction 0.3931 lb/lb AF fuel5.2.4.8 Moisture from limestone, weight fraction 0.0019 lb/lb AF fuel5.2.4.9 Moisture from combustion air, weight fraction 0.1143 lb/lb AF fuel
5.2.5 Weight of DRY Products of Combustion - Air Heater OUTLET 13.6151 lb/lb AF fuel
Jacksonville Electric Authority Unit Tested: Northside Unit 2 - Test #2 (50/50 Blend) Boiler Efficiency: 91.64 Test Date: January 27, 2004 Test Start Time: 11:30 AM Test End Time: 3:30 PM Test Duration, hours: 4
5.2.20 Weight Fraction of WET Flue Gas Components -NOT USED IN CALCULATION5.2.20.1 Oxygen, fraction weight fraction5.2.20.2 Nitrogen, fraction weight fraction5.2.20.3 Carbon Dioxide, fraction weight fraction5.2.20.4 Carbon Monoxide, fraction weight fraction5.2.20.5 Sulfur Dioxide, fraction weight fraction5.2.20.6 Moisture, fraction weight fraction
5.3 Air Heater Inlet
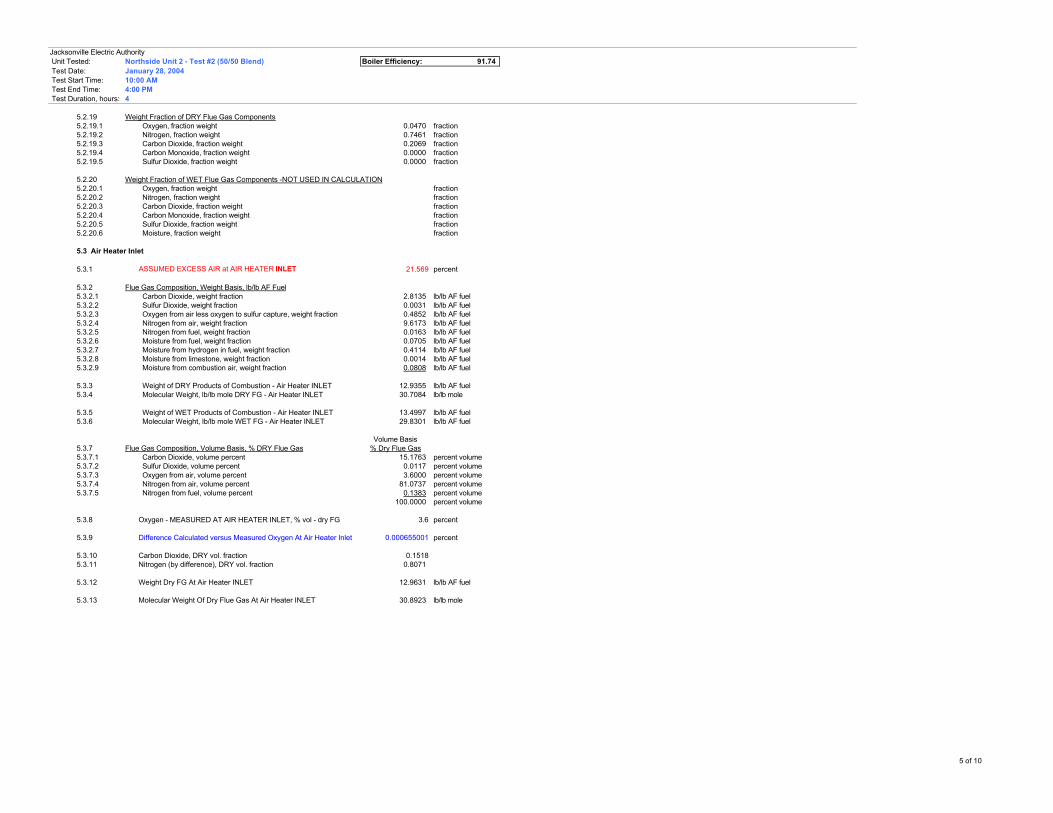
5.3.1 ASSUMED EXCESS AIR at AIR HEATER INLET 21.489 percent
5.3.2 Flue Gas Composition, Weight Basis, lb/lb AF Fuel5.3.2.1 Carbon Dioxide, weight fraction 2.8459 lb/lb AF fuel5.3.2.2 Sulfur Dioxide, weight fraction 0.0031 lb/lb AF fuel5.3.2.3 Oxygen from air less oxygen to sulfur capture, weight fraction 0.4853 lb/lb AF fuel5.3.2.4 Nitrogen from air, weight fraction 9.5984 lb/lb AF fuel5.3.2.5 Nitrogen from fuel, weight fraction 0.0147 lb/lb AF fuel5.3.2.6 Moisture from fuel, weight fraction 0.0734 lb/lb AF fuel5.3.2.7 Moisture from hydrogen in fuel, weight fraction 0.3931 lb/lb AF fuel5.3.2.8 Moisture from limestone, weight fraction 0.0019 lb/lb AF fuel5.3.2.9 Moisture from combustion air, weight fraction 0.1085 lb/lb AF fuel
5.3.3 Weight of DRY Products of Combustion - Air Heater INLET 12.9474 lb/lb AF fuel5.3.4 Molecular Weight, lb/lb mole DRY FG - Air Heater INLET 30.7361 lb/lb mole
5.3.5 Weight of WET Products of Combustion - Air Heater INLET 13.5242 lb/lb AF fuel5.3.6 Molecular Weight, lb/lb mole WET FG - Air Heater INLET 29.8375 lb/lb AF fuel
5.3.12 Weight Dry FG At Air Heater INLET 12.9405 lb/lb AF fuel
5.3.13 Molecular Weight Of Dry Flue Gas At Air Heater INLET 30.8291 lb/lb mole
5 of 10
Jacksonville Electric Authority Unit Tested: Northside Unit 2 - Test #2 (50/50 Blend) Boiler Efficiency: 91.64 Test Date: January 27, 2004 Test Start Time: 11:30 AM Test End Time: 3:30 PM Test Duration, hours: 4
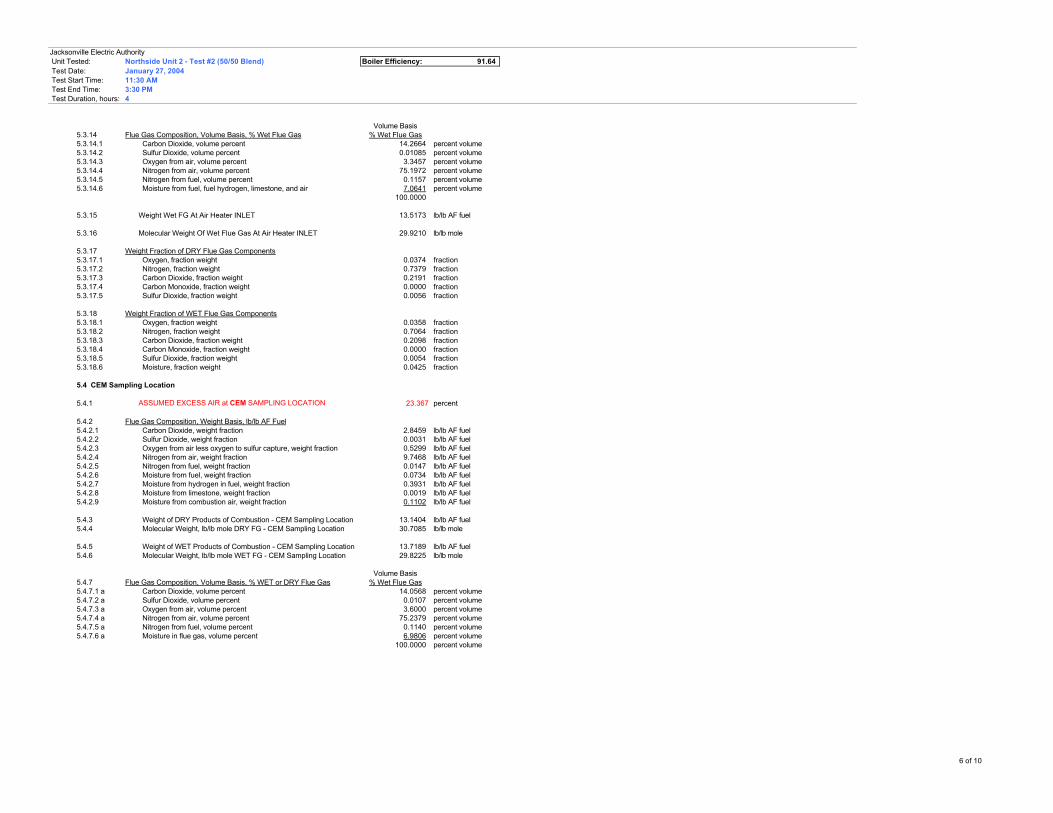
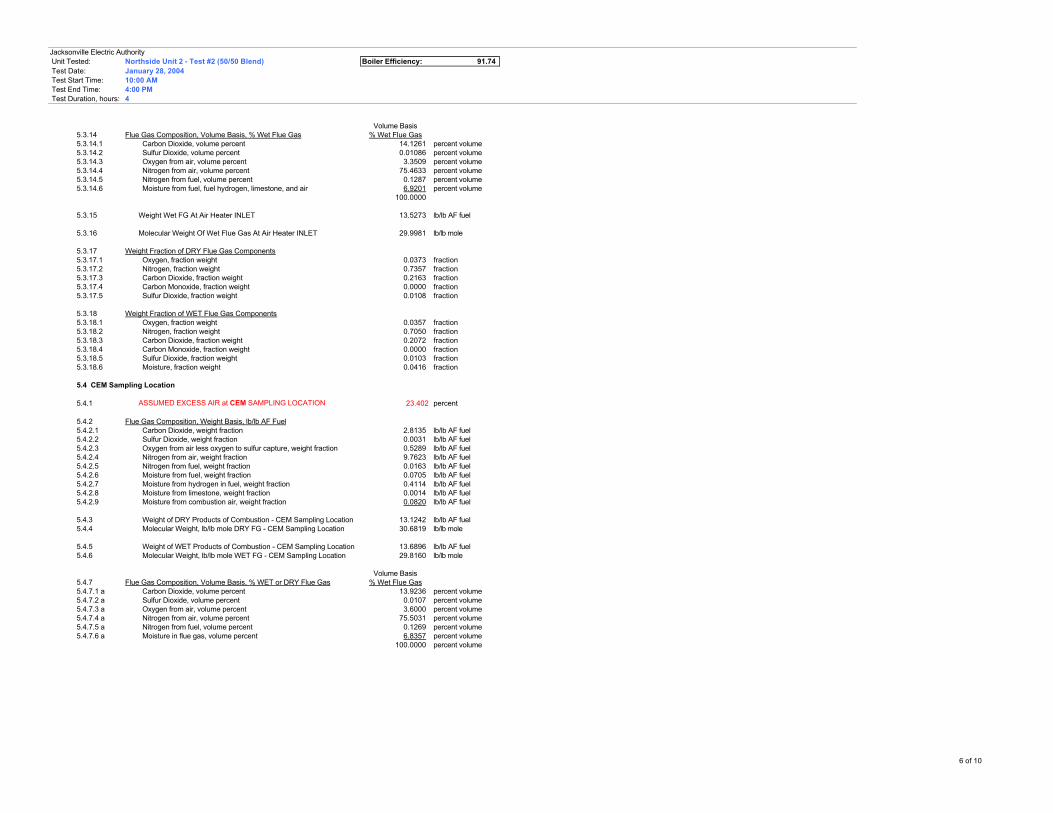
Volume Basis5.3.14 Flue Gas Composition, Volume Basis, % Wet Flue Gas % Wet Flue Gas5.3.14.1 Carbon Dioxide, volume percent 14.2664 percent volume5.3.14.2 Sulfur Dioxide, volume percent 0.01085 percent volume5.3.14.3 Oxygen from air, volume percent 3.3457 percent volume5.3.14.4 Nitrogen from air, volume percent 75.1972 percent volume5.3.14.5 Nitrogen from fuel, volume percent 0.1157 percent volume5.3.14.6 Moisture from fuel, fuel hydrogen, limestone, and air 7.0641 percent volume
100.0000
5.3.15 Weight Wet FG At Air Heater INLET 13.5173 lb/lb AF fuel
5.3.16 Molecular Weight Of Wet Flue Gas At Air Heater INLET 29.9210 lb/lb mole
5.4.1 ASSUMED EXCESS AIR at CEM SAMPLING LOCATION 23.367 percent
5.4.2 Flue Gas Composition, Weight Basis, lb/lb AF Fuel5.4.2.1 Carbon Dioxide, weight fraction 2.8459 lb/lb AF fuel5.4.2.2 Sulfur Dioxide, weight fraction 0.0031 lb/lb AF fuel5.4.2.3 Oxygen from air less oxygen to sulfur capture, weight fraction 0.5299 lb/lb AF fuel5.4.2.4 Nitrogen from air, weight fraction 9.7468 lb/lb AF fuel5.4.2.5 Nitrogen from fuel, weight fraction 0.0147 lb/lb AF fuel5.4.2.6 Moisture from fuel, weight fraction 0.0734 lb/lb AF fuel5.4.2.7 Moisture from hydrogen in fuel, weight fraction 0.3931 lb/lb AF fuel5.4.2.8 Moisture from limestone, weight fraction 0.0019 lb/lb AF fuel5.4.2.9 Moisture from combustion air, weight fraction 0.1102 lb/lb AF fuel
5.4.3 Weight of DRY Products of Combustion - CEM Sampling Location 13.1404 lb/lb AF fuel5.4.4 Molecular Weight, lb/lb mole DRY FG - CEM Sampling Location 30.7085 lb/lb mole
5.4.5 Weight of WET Products of Combustion - CEM Sampling Location 13.7189 lb/lb AF fuel5.4.6 Molecular Weight, lb/lb mole WET FG - CEM Sampling Location 29.8225 lb/lb mole
Volume Basis5.4.7 Flue Gas Composition, Volume Basis, % WET or DRY Flue Gas % Wet Flue Gas5.4.7.1 a Carbon Dioxide, volume percent 14.0568 percent volume5.4.7.2 a Sulfur Dioxide, volume percent 0.0107 percent volume5.4.7.3 a Oxygen from air, volume percent 3.6000 percent volume5.4.7.4 a Nitrogen from air, volume percent 75.2379 percent volume5.4.7.5 a Nitrogen from fuel, volume percent 0.1140 percent volume5.4.7.6 a Moisture in flue gas, volume percent 6.9806 percent volume
100.0000 percent volume
6 of 10
Jacksonville Electric Authority Unit Tested: Northside Unit 2 - Test #2 (50/50 Blend) Boiler Efficiency: 91.64 Test Date: January 27, 2004 Test Start Time: 11:30 AM Test End Time: 3:30 PM Test Duration, hours: 4
Volume Basis% Dry Flue Gas
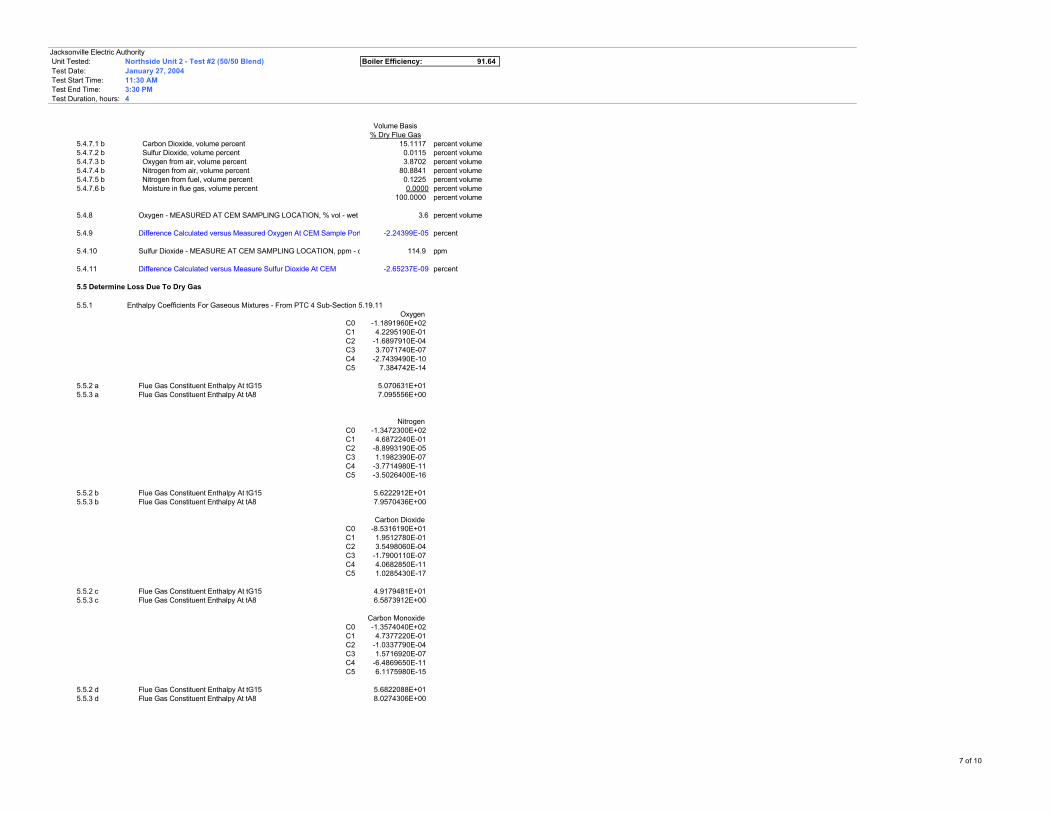
5.4.7.1 b Carbon Dioxide, volume percent 15.1117 percent volume5.4.7.2 b Sulfur Dioxide, volume percent 0.0115 percent volume5.4.7.3 b Oxygen from air, volume percent 3.8702 percent volume5.4.7.4 b Nitrogen from air, volume percent 80.8841 percent volume5.4.7.5 b Nitrogen from fuel, volume percent 0.1225 percent volume5.4.7.6 b Moisture in flue gas, volume percent 0.0000 percent volume
100.0000 percent volume
5.4.8 Oxygen - MEASURED AT CEM SAMPLING LOCATION, % vol - wet FG 3.6 percent volume
5.4.9 Difference Calculated versus Measured Oxygen At CEM Sample Port In Stack-2.24399E-05 percent
5.4.10 Sulfur Dioxide - MEASURE AT CEM SAMPLING LOCATION, ppm - dry FG 114.9 ppm
5.4.11 Difference Calculated versus Measure Sulfur Dioxide At CEM -2.65237E-09 percent
5.5 Determine Loss Due To Dry Gas
5.5.1 Enthalpy Coefficients For Gaseous Mixtures - From PTC 4 Sub-Section 5.19.11Oxygen
5.5.2 d Flue Gas Constituent Enthalpy At tG15 5.6822088E+015.5.3 d Flue Gas Constituent Enthalpy At tA8 8.0274306E+00
7 of 10
Jacksonville Electric Authority Unit Tested: Northside Unit 2 - Test #2 (50/50 Blend) Boiler Efficiency: 91.64 Test Date: January 27, 2004 Test Start Time: 11:30 AM Test End Time: 3:30 PM Test Duration, hours: 4
Jacksonville Electric Authority Unit Tested: Northside Unit 2 - Test #2 (50/50 Blend) Boiler Efficiency: 91.64 Test Date: January 27, 2004 Test Start Time: 11:30 AM Test End Time: 3:30 PM Test Duration, hours: 4
10. HEAT LOSS DUE TO MOISTURE IN ENTERING AIR
10.1 Determine Air Flow
10.1.1 Dry Air Per Pound Of AF Fuel 13.48 lb/lb AF fuel
10.2 Heat Loss Due To Moisture In Entering Air
10.2.1 Enthalpy Of Leaving Water Vapor 151.08 Btu/lb AF fuel10.2.2 Enthalpy Of Entering Water Vapor 53.62 Btu/lb AF fuel
10.2.3 Air Moisture Heat Loss, as tested 11.41 Btu/lb
10.3 HHV Percent Loss, as tested 0.08 percent
11. HEAT LOSS DUE TO LIMESTONE CALCINATION/SULFATION REACTIONS
11.1 Loss To Calcination
11.1.1 Limestone Calcination Heat Loss 221.58 Btu/lb AF Fuel
11.2 Loss To Moisture In Limestone
11.2.1 Limestone Moisture Heat Loss 2.08 Btu/lb AF Fuel
11.3 Loss From Sulfation
11.3.1 Sulfation Heat Loss -349.25 Btu/lb AF Fuel
11.4 Net Loss To Calcination/Sulfation
11.4.1 Net Limestone Reaction Heat Loss -125.59 Btu/lb AF Fuel
11.5 HHV Percent Loss -0.94 percent
12. HEAT LOSS DUE TO SURFACE RADIATION & CONVECTION
12.1 HHV Percent Loss 0.27 percent
12.1.1 Radiation & Convection Heat Loss 36.78 Btu/lb AF fuel
Jacksonville Electric Authority Unit Tested: Northside Unit 2 - Test #2 (50/50 Blend) Boiler Efficiency: 91.64 Test Date: January 27, 2004 Test Start Time: 11:30 AM Test End Time: 3:30 PM Test Duration, hours: 4
As TestedPercent Loss
13.1.9 Dry Flue Gas 4.7313.1.10 Moisture In Fuel 0.6113.1.11 H2O From H2 In Fuel 3.2813.1.12 Unburned Combustibles In Refuse 0.3113.1.13 Dry Refuse 0.0013.1.14 Moisture In Combustion Air 0.0813.1.15 Calcination/Sulfation -0.9413.1.16 Radiation & Convection 0.27
8.36
13.2 Boiler Efficiency (100 - Total Losses), percent 91.64
15.1 Determine Fuel Heat Input Based on Calculated Efficiency
15.1.1 Fuel Heat Input 2,450,735,926 Btu/h
15.1.2 Fuel Burned - CALCULATED 182,496 lb/h
15.1.3 Difference Assumed versus Calculated Fuel Burned -0.000699774 percent
10 of 10
Jacksonville Electric Authority Unit Tested: Northside Unit 2 - Test #2 (50/50 Blend) Boiler Efficiency: 91.74 Test Date: January 28, 2004 Test Start Time: 10:00 AM Test End Time: 4:00 PM Test Duration, hours: 4
DATA INPUT SECTION - INPUT ALL DATA REQUESTED IN SECTION 1 EXCEPT AS NOTED
1. DATA REQUIRED FOR BOILER EFFICIENCY DETERMINATION
AS - TESTED
Average Value Units Symbol1.1 Fuel1.1.1 Feed Rate, lb/h 195,177 lb/h Wfe - Summation feeder feed rates - FN-34-FT-508, 528, 548, 568, 588, 608, 628, 668
Composition ("as fired")1.1.2 Carbon, fraction 0.7368 lb/lb AF fuel Cf - Laboratory analysis of coal samples obtained by grab sampling.1.1.3 Hydrogen, fraction 0.0460 lb/lb AF fuel Hf - Laboratory analysis of coal samples obtained by grab sampling.1.1.4 Oxygen, fraction 0.0126 lb/lb AF fuel Of - Laboratory analysis of coal samples obtained by grab sampling.1.1.5 Nitrogen, fraction 0.0163 lb/lb AF fuel Nf - Laboratory analysis of coal samples obtained by grab sampling.1.1.6 Sulfur, fraction 0.0586 lb/lb AF fuel Sf - Laboratory analysis of coal samples obtained by grab sampling.1.1.7 Ash, fraction 0.0591 lb/lb AF fuel Af - Laboratory analysis of coal samples obtained by grab sampling.1.1.8 Moisture, fraction 0.0705 lb/lb AF fuel H2Of - Laboratory analysis of coal samples obtained by grab sampling.1.1.9 Calcium, fraction 0.0000 lb/lb AF fuel Caf - Laboratory analysis of coal samples obtained by grab sampling - assume a value of zero if not reported.1.1.10 HHV 13,251 Btu/lb HHV - Laboratory analysis of coal samples obtained by grab sampling.
Composition1.3.2 Organic Carbon, wt fraction 0.0001 lb/lb BA Cbao - Laboratory analysis of bottom ash samples obtained by grab sampling.1.3.3 Inorganic Carbon, wt fraction 0.0000 lb/lb BA Cbaio - Laboratory analysis of bottom ash samples obtained by grab sampling.1.3.4 Total Carbon, wt fraction - CALCULATED VALUE DO NOT ENTER 0.0001 lb/lb BA Cba = Cbao + Cbaio1.3.5 Calcium, wt fraction 0.2119 lb/lb BA Caba - Laboratory analysis of bottom ash samples obtained by grab sampling.1.3.6 Carbonate as CO2, wt fraction 0.0000 lb/lb BA CO2ba - Laboratory analysis of bottom ash samples obtained by grab sampling.1.3.7 Bottom Ash Flow By Iterative Calculation - ENTER ASSUMED VALUE 54,570 lb/h Wbae
TO BEGIN CALCULATION
1.4 Fly Ash Composition
1.4.1 Organic Carbon, wt fraction 0.0167 lb/lb FA Cfao - Laboratory analysis of fly ash samples obtained by grab sampling.1.4.2 Inorganic Carbon, wt fraction 0.0000 lb/lb FA Cfaio - Laboratory analysis of fly ash samples obtained by grab sampling.1.4.3 Carbon, wt fraction - CALCULATED VALUE DO NOT ENTER 0.0167 lb/lb FA Cfa = Cfao + Cfaio1.4.4 Calcium, wt fraction 0.2107 lb/lb FA Cafa - Laboratory analysis of fly ash samples obtained by grab sampling.1.4.5 Carbonate as CO2, wt fraction 0.0000 lb/lb FA CO2fa - Laboratory analysis of fly ash samples obtained by grab sampling.1.4.6 Fly Ash Flow 27,159 LB/HR Wfam - Weight of fly ash from isokenetic sample collection.
Intrex Blower1.5.7 Flow Rate, lb/h 35,984 lb/h Wib - Plant instrument1.5.8 Blower Outlet Temperature, oF 150 oF tib
Seal Pot Blowers 1.5.9 Flow Rate, lb/h 45158 lb/h Wspb - Plant instrument1.5.10 Blower Outlet Temperature, oF 162 oF tspb
1 of 10
Jacksonville Electric Authority Unit Tested: Northside Unit 2 - Test #2 (50/50 Blend) Boiler Efficiency: 91.74 Test Date: January 28, 2004 Test Start Time: 10:00 AM Test End Time: 4:00 PM Test Duration, hours: 4
1.6 Ambient Conditions1.6.1 Ambient dry bulb temperature, °F 39.96 °F ta1.6.2 Ambient wet bulb temperature, °F 43.19 °F tawb1.6.3 Barometric pressure, inches Hg 30.34 inches Hg Patm1.6.4 Moisture in air, lbH2O/lb dry air 0.0065 lbH2O/lb dry air Calculated: H2OA - From psychometric chart at temperatures ta and tawb adjusted to test Patm.
1.7 Flue GasAt Air Heater Outlet
1.7.1 Temperature (measured), °F 293.84 °F Tg15 - Weighted average from AH outlet plant instruments (based on PA and SA flow rates) 1.7.2 Temperature (unmeasured), °F Calculated
Composition (wet)1.7.3 O2 0.0450 percent volume O2 - Weighted average from test instrument1.7.4 CO2 Not Measured percent volume CO21.7.5 CO Not Measured percent volume CO1.7.6 SO2 Not Measured percent volume SO2
At Air Heater Inlet1.7.7 Temperature, °F 570.21 °F tG14 - Plant Instrument
Composition (wet)1.7.8 O2 0.0360 percent volume1.7.9 CO2 Not Measured percent volume1.7.10 CO Not Measured percent volume1.7.11 SO2 0.0052 percent volume measurement is in ppm
CEM Sample Extraction At Outlet Of Economizer Composition
Jacksonville Electric Authority Unit Tested: Northside Unit 2 - Test #2 (50/50 Blend) Boiler Efficiency: 91.74 Test Date: January 28, 2004 Test Start Time: 10:00 AM Test End Time: 4:00 PM Test Duration, hours: 4
2. REFERENCE TEMPERATURES
2.1 Average Air Heater Inlet Temperature 96.32
3. SULFUR CAPTURE The calculation of efficiency for a circulating fluid bed steam generator that includes injection of a reactive sorbent material, such as limestone, to reduce sulfur dioxide emissions is an iterative calculation to minimize the number of parameters that have to be measured and the number of laboratory material analyses that must be performed. This both reduces the cost of the test and increases the accuracy by minimizing the impact of field and laboratory instrument inaccuracies.
To begin the process, assume a fuel flow rate. The fuel flow rate is required to complete the material balances necessary to determine the amount of limestone used and the effect of the limestone reaction on the boiler efficiency. The resulting boiler efficiency is used to calculate a value for the fuel flow rate. If the calculated flow rate is more than 1 percent different than the assumed flow rate, a new value for fuel flow rate is selected and the efficiency calculation is repeated. This process is repeated until the assumed value for fuel flow and the calculated value for fuel flow differ by less than 1 percent of of the value of the calculated fuel flow rate.
3.1 ASSUMED FUEL FLOW RATE, lb/h 185,198 lb/h
3.2 ASSUMED SULFUR EMISSIONS, fraction 0.0269 fraction Can get reading from CEMS system3.3 Sulfur Capture, fraction 0.9731
4.3 Bottom Ash Flow Rate4.3.1 Total bottom ash including bed change 54,570.4521370 lb/h
4.4 Limestone Flow Rate
Iterate to determine calcium to sulfur ratio and limestone flow rate. Enter an assumed value for the calcium to sulfur ratio. Compare resulting calculated calcium to sulfur ratio to assumed value. Change assumed value until the difference between the assumed value and the calculated value is less than 1 percent of the assumed value.
4.4.1 ASSUMED CALCIUM to SULFUR RATIO 1.8606 mole Ca/mole S4.4.2 Solids From Limestone - estimated 0.96324464 lb/lb limestone4.4.3 Limestone Flow Rate - estimated 73001 lb/h4.4.4 Calculated Calcium to Sulfur Ratio 1.860570872 mole Ca/mole S
LImestone Flow Rate from PI Data, lb/h 73,0014.4.5 Difference Estimated vs Assumed - Ca:S 9.12915E-06 percent
4.4.6 Calculated Fly Ash Flow Rate 27,159 lb/h
4.4.7 Difference Calculated vs Measured 0.0000000026 percent
4.5 Total Dry Refuse4.5.1 Total Dry Refuse Hourly Flow Rate 81,729 lb/h4.5.2 Total Dry Refuse Per Pound Fuel 0.4413 lb/lb AF fuel
4.6 Heating Value Of Total Dry Refuse4.6.1 Average Carbon Content Of Ash 0.0056 fraction4.6.2 Heating Value Of Dry Refuse 81.44 Btu/lb
5. HEAT LOSS DUE TO DRY GAS
5.1 Carbon Burned Adjusted For Limestone5.1.1 Carbon Burned 0.7343 lb/lb AF fuel5.1.2 Carbon Adjusted For Limestone 0.7679 lb/lb AF fuel
CALCULATION SECTION - ALL VALUES BELOW CALCULATED BY EMBEDDED FORMULAS - DO NOT ENTER DATA BELOW THIS LINE - EXCEPT ASSUMED VALUES FOR ITERATIVE CALCULATIONS
Jacksonville Electric Authority Unit Tested: Northside Unit 2 - Test #2 (50/50 Blend) Boiler Efficiency: 91.74 Test Date: January 28, 2004 Test Start Time: 10:00 AM Test End Time: 4:00 PM Test Duration, hours: 4
Determine Amount Of Flue Gas
Iterate to determine carbon dioxide volumetric content of dry flue gas. Enter an assumed value for excess air. Compare resulting calculated oxygen content to the measure oxygen content. Change assumed value of excess air until the difference between the calculated oxygen content value and the measured value oxygen content value is less than 1 percent of the assumed value. Use the calculated carbon dioxide value in subsequent calculations.
5.2 Air Heater Outlet
5.2.1 ASSUMED EXCESS AIR at AIR HEATER OUTLET 28.056 percent
5.2.2 Corrected Stoichiometric O2, lb/lb fuel 2.3817 lb/lb AF fuel5.2.3 Corrected Stoichiometric N2, lb/lb fuel 7.9110 lb/lb AF fuel
5.2.4 Flue Gas Composition, Weight Basis, lb/lb AF Fuel5.2.4.1 Carbon Dioxide, weight fraction 2.8135 lb/lb AF fuel5.2.4.2 Sulfur Dioxide, weight fraction 0.0031 lb/lb AF fuel5.2.4.3 Oxygen from air less oxygen to sulfur capture, weight fraction 0.6397 lb/lb AF fuel5.2.4.4 Nitrogen from air, weight fraction 10.1305 lb/lb AF fuel5.2.4.5 Nitrogen from fuel, weight fraction 0.0163 lb/lb AF fuel5.2.4.6 Moisture from fuel, weight fraction 0.0705 lb/lb AF fuel5.2.4.7 Moisture from hydrogen in fuel, weight fraction 0.4114 lb/lb AF fuel5.2.4.8 Moisture from limestone, weight fraction 0.0014 lb/lb AF fuel5.2.4.9 Moisture from combustion air, weight fraction 0.0851 lb/lb AF fuel
5.2.5 Weight of DRY Products of Combustion - Air Heater OUTLET 13.6032 lb/lb AF fuel
Jacksonville Electric Authority Unit Tested: Northside Unit 2 - Test #2 (50/50 Blend) Boiler Efficiency: 91.74 Test Date: January 28, 2004 Test Start Time: 10:00 AM Test End Time: 4:00 PM Test Duration, hours: 4
5.2.20 Weight Fraction of WET Flue Gas Components -NOT USED IN CALCULATION5.2.20.1 Oxygen, fraction weight fraction5.2.20.2 Nitrogen, fraction weight fraction5.2.20.3 Carbon Dioxide, fraction weight fraction5.2.20.4 Carbon Monoxide, fraction weight fraction5.2.20.5 Sulfur Dioxide, fraction weight fraction5.2.20.6 Moisture, fraction weight fraction
5.3 Air Heater Inlet
5.3.1 ASSUMED EXCESS AIR at AIR HEATER INLET 21.569 percent
5.3.2 Flue Gas Composition, Weight Basis, lb/lb AF Fuel5.3.2.1 Carbon Dioxide, weight fraction 2.8135 lb/lb AF fuel5.3.2.2 Sulfur Dioxide, weight fraction 0.0031 lb/lb AF fuel5.3.2.3 Oxygen from air less oxygen to sulfur capture, weight fraction 0.4852 lb/lb AF fuel5.3.2.4 Nitrogen from air, weight fraction 9.6173 lb/lb AF fuel5.3.2.5 Nitrogen from fuel, weight fraction 0.0163 lb/lb AF fuel5.3.2.6 Moisture from fuel, weight fraction 0.0705 lb/lb AF fuel5.3.2.7 Moisture from hydrogen in fuel, weight fraction 0.4114 lb/lb AF fuel5.3.2.8 Moisture from limestone, weight fraction 0.0014 lb/lb AF fuel5.3.2.9 Moisture from combustion air, weight fraction 0.0808 lb/lb AF fuel
5.3.3 Weight of DRY Products of Combustion - Air Heater INLET 12.9355 lb/lb AF fuel5.3.4 Molecular Weight, lb/lb mole DRY FG - Air Heater INLET 30.7084 lb/lb mole
5.3.5 Weight of WET Products of Combustion - Air Heater INLET 13.4997 lb/lb AF fuel5.3.6 Molecular Weight, lb/lb mole WET FG - Air Heater INLET 29.8301 lb/lb AF fuel
5.3.12 Weight Dry FG At Air Heater INLET 12.9631 lb/lb AF fuel
5.3.13 Molecular Weight Of Dry Flue Gas At Air Heater INLET 30.8923 lb/lb mole
5 of 10
Jacksonville Electric Authority Unit Tested: Northside Unit 2 - Test #2 (50/50 Blend) Boiler Efficiency: 91.74 Test Date: January 28, 2004 Test Start Time: 10:00 AM Test End Time: 4:00 PM Test Duration, hours: 4
Volume Basis5.3.14 Flue Gas Composition, Volume Basis, % Wet Flue Gas % Wet Flue Gas5.3.14.1 Carbon Dioxide, volume percent 14.1261 percent volume5.3.14.2 Sulfur Dioxide, volume percent 0.01086 percent volume5.3.14.3 Oxygen from air, volume percent 3.3509 percent volume5.3.14.4 Nitrogen from air, volume percent 75.4633 percent volume5.3.14.5 Nitrogen from fuel, volume percent 0.1287 percent volume5.3.14.6 Moisture from fuel, fuel hydrogen, limestone, and air 6.9201 percent volume
100.0000
5.3.15 Weight Wet FG At Air Heater INLET 13.5273 lb/lb AF fuel
5.3.16 Molecular Weight Of Wet Flue Gas At Air Heater INLET 29.9981 lb/lb mole
5.4.1 ASSUMED EXCESS AIR at CEM SAMPLING LOCATION 23.402 percent
5.4.2 Flue Gas Composition, Weight Basis, lb/lb AF Fuel5.4.2.1 Carbon Dioxide, weight fraction 2.8135 lb/lb AF fuel5.4.2.2 Sulfur Dioxide, weight fraction 0.0031 lb/lb AF fuel5.4.2.3 Oxygen from air less oxygen to sulfur capture, weight fraction 0.5289 lb/lb AF fuel5.4.2.4 Nitrogen from air, weight fraction 9.7623 lb/lb AF fuel5.4.2.5 Nitrogen from fuel, weight fraction 0.0163 lb/lb AF fuel5.4.2.6 Moisture from fuel, weight fraction 0.0705 lb/lb AF fuel5.4.2.7 Moisture from hydrogen in fuel, weight fraction 0.4114 lb/lb AF fuel5.4.2.8 Moisture from limestone, weight fraction 0.0014 lb/lb AF fuel5.4.2.9 Moisture from combustion air, weight fraction 0.0820 lb/lb AF fuel
5.4.3 Weight of DRY Products of Combustion - CEM Sampling Location 13.1242 lb/lb AF fuel5.4.4 Molecular Weight, lb/lb mole DRY FG - CEM Sampling Location 30.6819 lb/lb mole
5.4.5 Weight of WET Products of Combustion - CEM Sampling Location 13.6896 lb/lb AF fuel5.4.6 Molecular Weight, lb/lb mole WET FG - CEM Sampling Location 29.8160 lb/lb mole
Volume Basis5.4.7 Flue Gas Composition, Volume Basis, % WET or DRY Flue Gas % Wet Flue Gas5.4.7.1 a Carbon Dioxide, volume percent 13.9236 percent volume5.4.7.2 a Sulfur Dioxide, volume percent 0.0107 percent volume5.4.7.3 a Oxygen from air, volume percent 3.6000 percent volume5.4.7.4 a Nitrogen from air, volume percent 75.5031 percent volume5.4.7.5 a Nitrogen from fuel, volume percent 0.1269 percent volume5.4.7.6 a Moisture in flue gas, volume percent 6.8357 percent volume
100.0000 percent volume
6 of 10
Jacksonville Electric Authority Unit Tested: Northside Unit 2 - Test #2 (50/50 Blend) Boiler Efficiency: 91.74 Test Date: January 28, 2004 Test Start Time: 10:00 AM Test End Time: 4:00 PM Test Duration, hours: 4
Volume Basis% Dry Flue Gas
5.4.7.1 b Carbon Dioxide, volume percent 14.9452 percent volume5.4.7.2 b Sulfur Dioxide, volume percent 0.0115 percent volume5.4.7.3 b Oxygen from air, volume percent 3.8641 percent volume5.4.7.4 b Nitrogen from air, volume percent 81.0430 percent volume5.4.7.5 b Nitrogen from fuel, volume percent 0.1362 percent volume5.4.7.6 b Moisture in flue gas, volume percent 0.0000 percent volume
100.0000 percent volume
5.4.8 Oxygen - MEASURED AT CEM SAMPLING LOCATION, % vol - wet FG 3.6 percent volume
5.4.9 Difference Calculated versus Measured Oxygen At CEM Sample Port In Stack -4.148E-06 percent
5.4.10 Sulfur Dioxide - MEASURE AT CEM SAMPLING LOCATION, ppm - dry FG 114.9 ppm
5.4.11 Difference Calculated versus Measure Sulfur Dioxide At CEM 0.000940575 percent
5.5 Determine Loss Due To Dry Gas
5.5.1 Enthalpy Coefficients For Gaseous Mixtures - From PTC 4 Sub-Section 5.19.11Oxygen
5.5.2 d Flue Gas Constituent Enthalpy At tG15 5.4097371E+015.5.3 d Flue Gas Constituent Enthalpy At tA8 4.8028593E+00
7 of 10
Jacksonville Electric Authority Unit Tested: Northside Unit 2 - Test #2 (50/50 Blend) Boiler Efficiency: 91.74 Test Date: January 28, 2004 Test Start Time: 10:00 AM Test End Time: 4:00 PM Test Duration, hours: 4
Jacksonville Electric Authority Unit Tested: Northside Unit 2 - Test #2 (50/50 Blend) Boiler Efficiency: 91.74 Test Date: January 28, 2004 Test Start Time: 10:00 AM Test End Time: 4:00 PM Test Duration, hours: 4
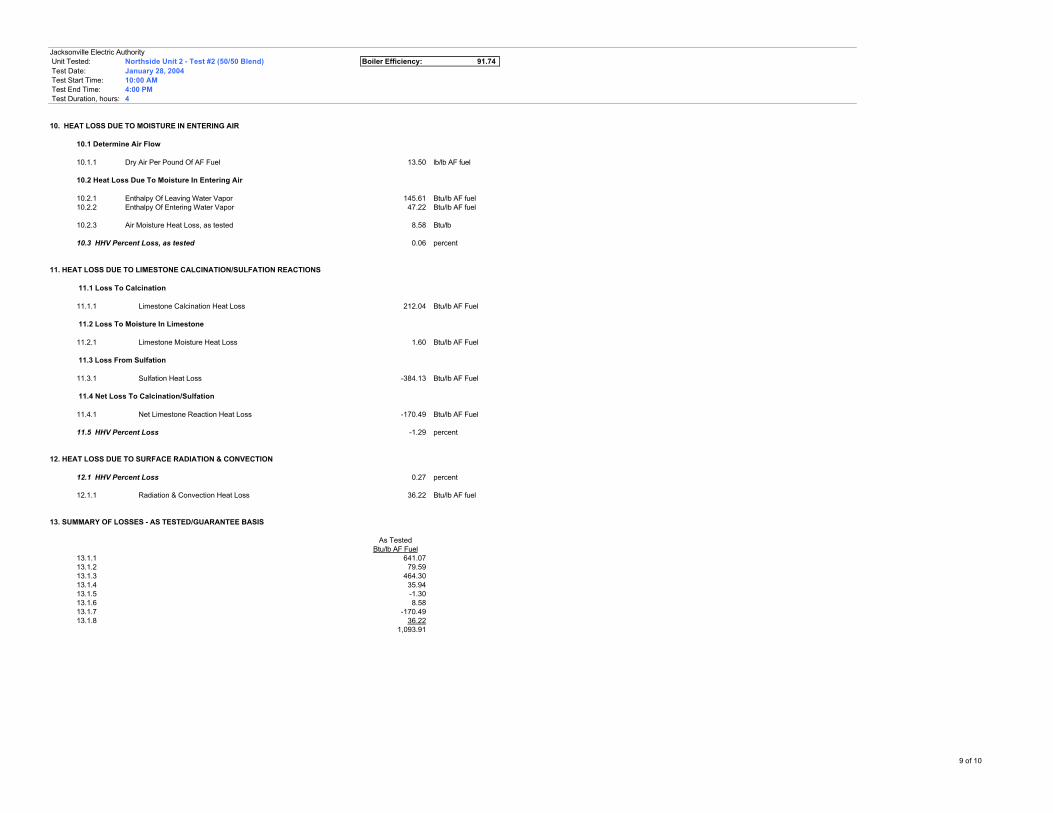
10. HEAT LOSS DUE TO MOISTURE IN ENTERING AIR
10.1 Determine Air Flow
10.1.1 Dry Air Per Pound Of AF Fuel 13.50 lb/lb AF fuel
10.2 Heat Loss Due To Moisture In Entering Air
10.2.1 Enthalpy Of Leaving Water Vapor 145.61 Btu/lb AF fuel10.2.2 Enthalpy Of Entering Water Vapor 47.22 Btu/lb AF fuel
10.2.3 Air Moisture Heat Loss, as tested 8.58 Btu/lb
10.3 HHV Percent Loss, as tested 0.06 percent
11. HEAT LOSS DUE TO LIMESTONE CALCINATION/SULFATION REACTIONS
11.1 Loss To Calcination
11.1.1 Limestone Calcination Heat Loss 212.04 Btu/lb AF Fuel
11.2 Loss To Moisture In Limestone
11.2.1 Limestone Moisture Heat Loss 1.60 Btu/lb AF Fuel
11.3 Loss From Sulfation
11.3.1 Sulfation Heat Loss -384.13 Btu/lb AF Fuel
11.4 Net Loss To Calcination/Sulfation
11.4.1 Net Limestone Reaction Heat Loss -170.49 Btu/lb AF Fuel
11.5 HHV Percent Loss -1.29 percent
12. HEAT LOSS DUE TO SURFACE RADIATION & CONVECTION
12.1 HHV Percent Loss 0.27 percent
12.1.1 Radiation & Convection Heat Loss 36.22 Btu/lb AF fuel
Jacksonville Electric Authority Unit Tested: Northside Unit 2 - Test #2 (50/50 Blend) Boiler Efficiency: 91.74 Test Date: January 28, 2004 Test Start Time: 10:00 AM Test End Time: 4:00 PM Test Duration, hours: 4
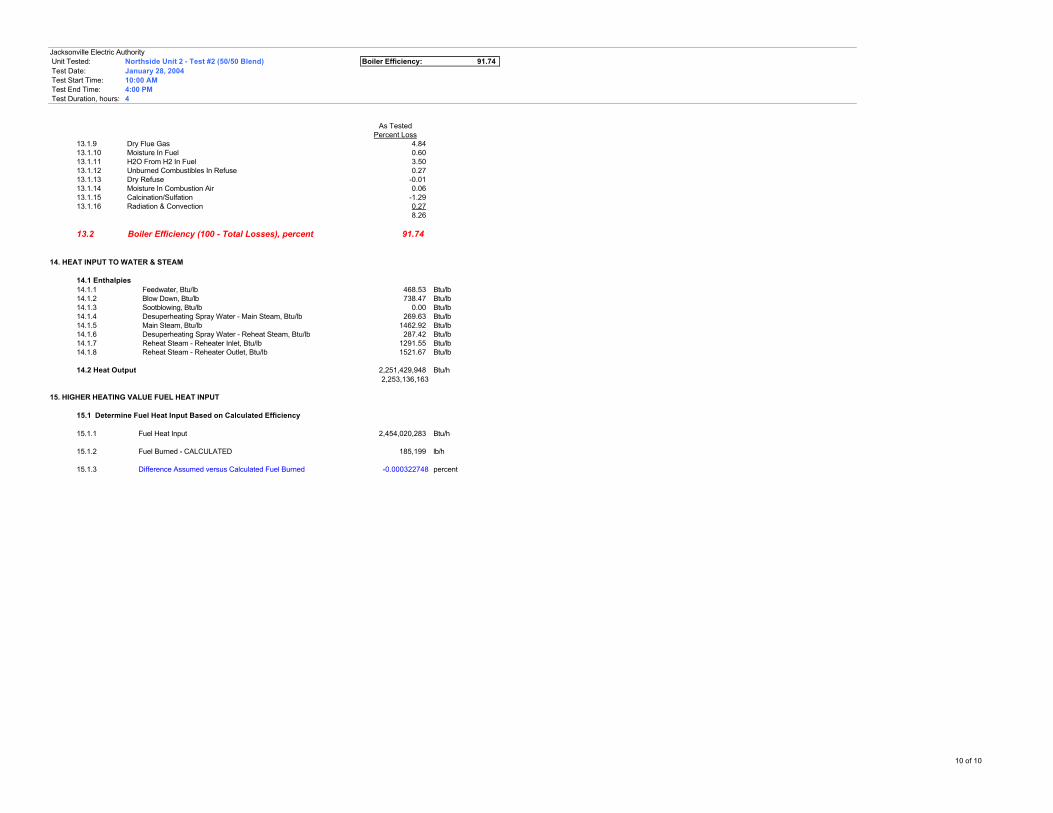
As TestedPercent Loss
13.1.9 Dry Flue Gas 4.8413.1.10 Moisture In Fuel 0.6013.1.11 H2O From H2 In Fuel 3.5013.1.12 Unburned Combustibles In Refuse 0.2713.1.13 Dry Refuse -0.0113.1.14 Moisture In Combustion Air 0.0613.1.15 Calcination/Sulfation -1.2913.1.16 Radiation & Convection 0.27
8.26
13.2 Boiler Efficiency (100 - Total Losses), percent 91.74
Fuel Capability Demonstration Test Report #2 - ATTACHMENTS 50 / 50 Blend Petroleum Coke and Pittsburgh 8 Coal Fuel
B&V Project 137064
ATTACHMENT C
CAE Test Report
Black & Veatch Corporation 10751 Deerwood Park Boulevard, Suite 130
Jacksonville, FL 32256
To the best of our knowledge, the data presented in this report are accurate and complete and error free, legible and representative of the actual emissions during the test program.
Timothy D. Rodak Manager, Pittsburgh Regional Office
BLACK & VEATCH CORPORATION Client Reference No: 137064.96.1400 JEA - NORTHSIDE GENERATING STATION CleanAir Project No: 9475-2 CONTENTS ii
Revision 0
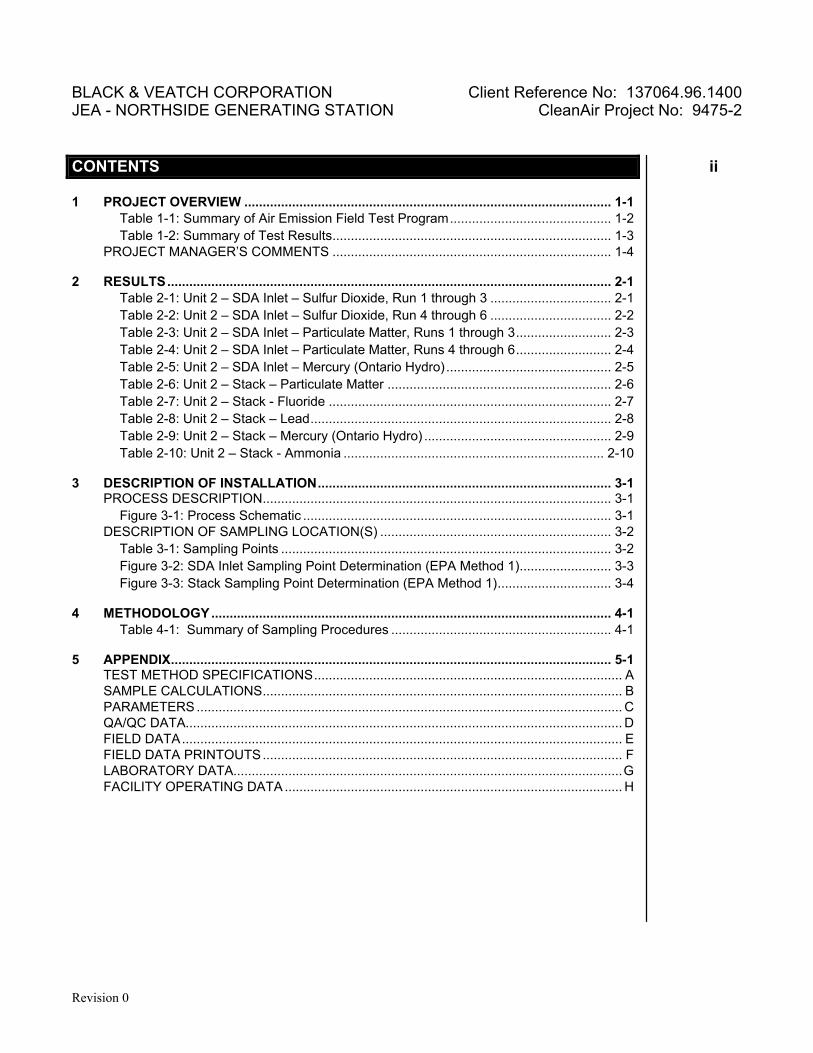
1 PROJECT OVERVIEW .................................................................................................... 1-1 Table 1-1: Summary of Air Emission Field Test Program............................................ 1-2 Table 1-2: Summary of Test Results............................................................................ 1-3
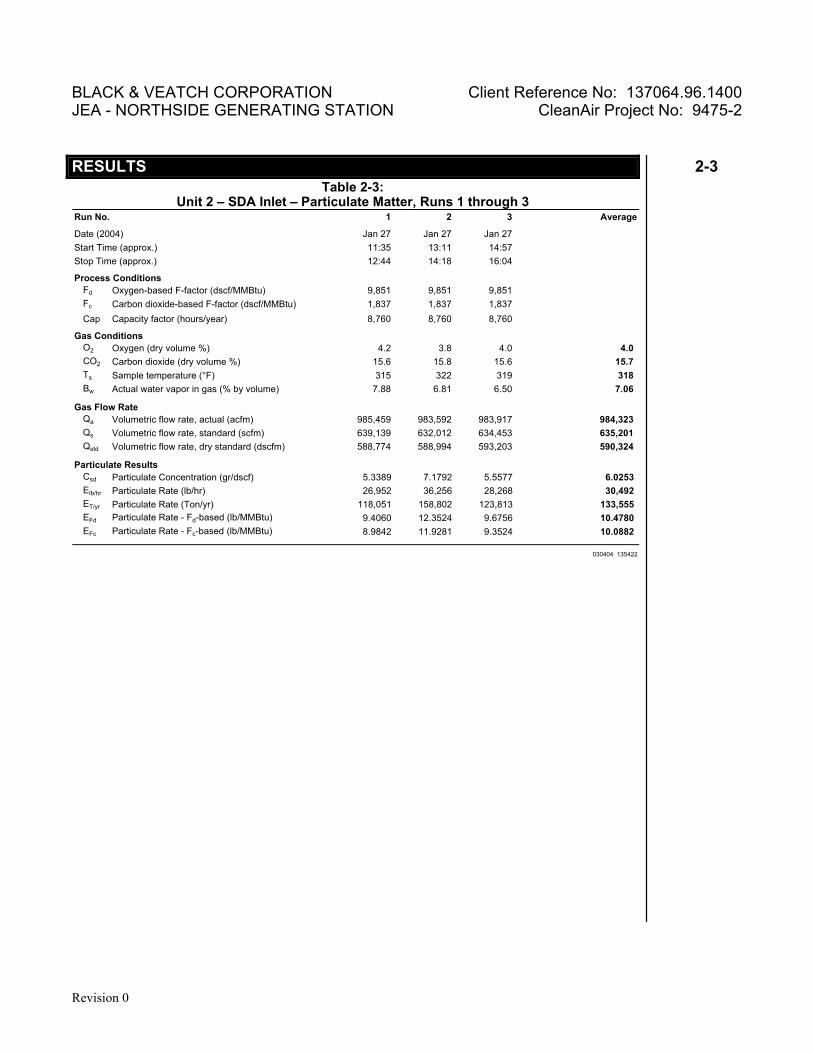
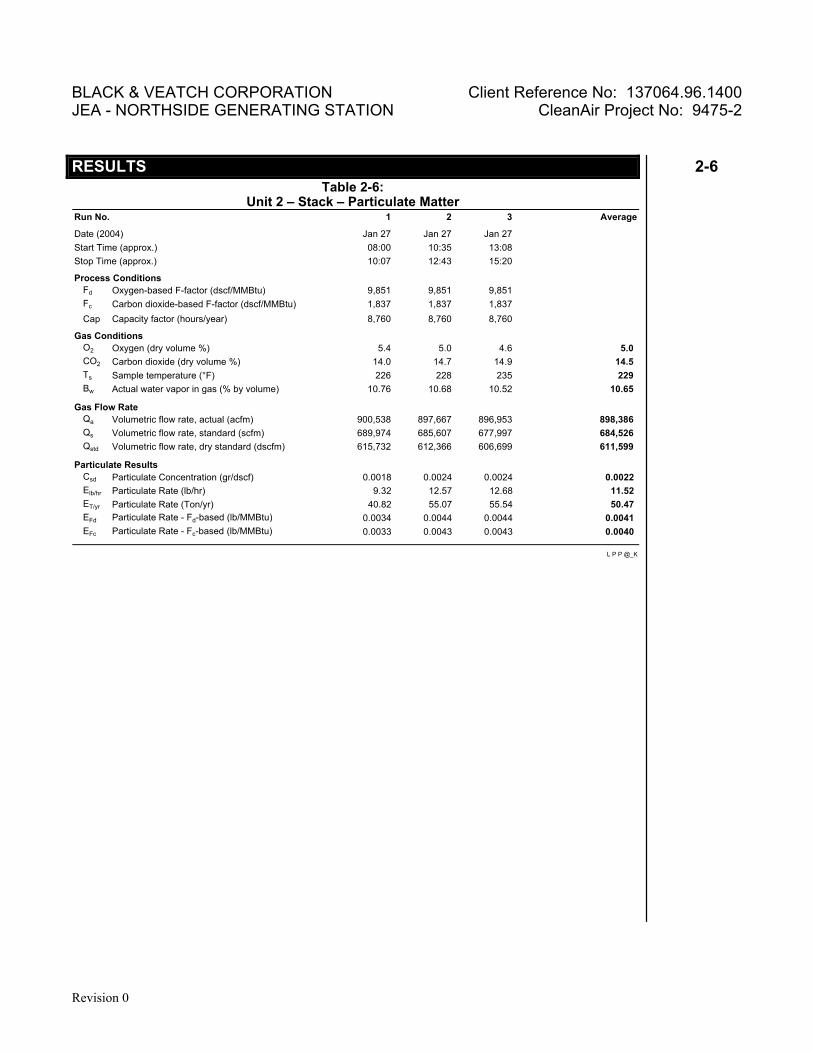
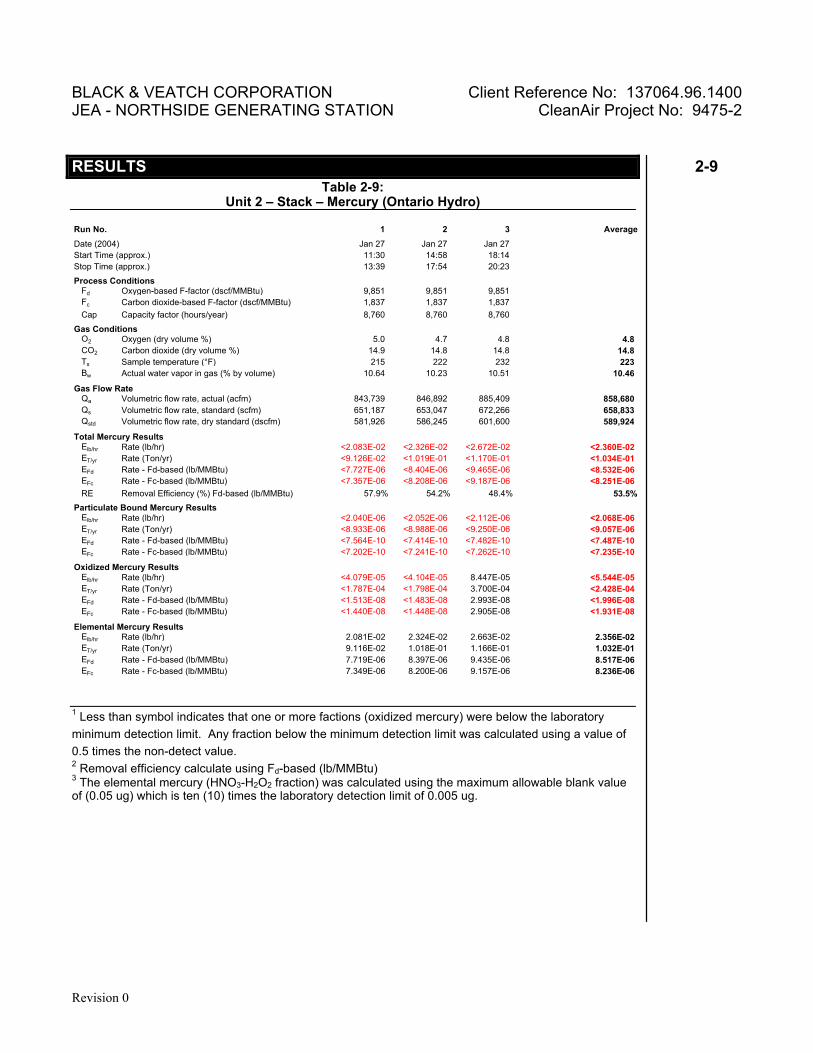
2 RESULTS......................................................................................................................... 2-1 Table 2-1: Unit 2 – SDA Inlet – Sulfur Dioxide, Run 1 through 3 ................................. 2-1 Table 2-2: Unit 2 – SDA Inlet – Sulfur Dioxide, Run 4 through 6 ................................. 2-2 Table 2-3: Unit 2 – SDA Inlet – Particulate Matter, Runs 1 through 3.......................... 2-3 Table 2-4: Unit 2 – SDA Inlet – Particulate Matter, Runs 4 through 6.......................... 2-4 Table 2-5: Unit 2 – SDA Inlet – Mercury (Ontario Hydro) ............................................. 2-5 Table 2-6: Unit 2 – Stack – Particulate Matter ............................................................. 2-6 Table 2-7: Unit 2 – Stack - Fluoride ............................................................................. 2-7 Table 2-8: Unit 2 – Stack – Lead.................................................................................. 2-8 Table 2-9: Unit 2 – Stack – Mercury (Ontario Hydro) ................................................... 2-9 Table 2-10: Unit 2 – Stack - Ammonia ....................................................................... 2-10
3 DESCRIPTION OF INSTALLATION................................................................................ 3-1 PROCESS DESCRIPTION............................................................................................... 3-1
Figure 3-1: Process Schematic .................................................................................... 3-1 DESCRIPTION OF SAMPLING LOCATION(S) ............................................................... 3-2
5 APPENDIX........................................................................................................................ 5-1 TEST METHOD SPECIFICATIONS.................................................................................... A SAMPLE CALCULATIONS.................................................................................................. B PARAMETERS .................................................................................................................... C QA/QC DATA....................................................................................................................... D FIELD DATA........................................................................................................................ E FIELD DATA PRINTOUTS.................................................................................................. F LABORATORY DATA..........................................................................................................G FACILITY OPERATING DATA ............................................................................................ H
BLACK & VEATCH CORPORATION Client Reference No: 137064.96.1400 JEA - NORTHSIDE GENERATING STATION CleanAir Project No: 9475-2 PROJECT OVERVIEW 1-1
Revision 0
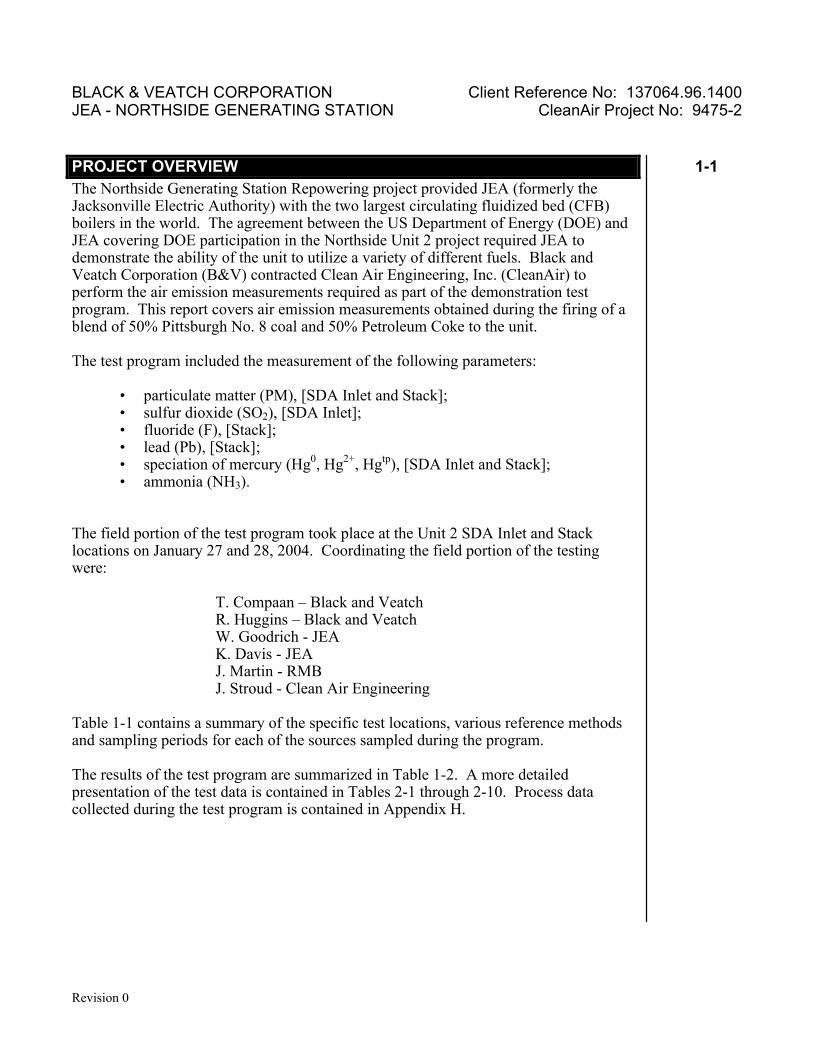
The Northside Generating Station Repowering project provided JEA (formerly the Jacksonville Electric Authority) with the two largest circulating fluidized bed (CFB) boilers in the world. The agreement between the US Department of Energy (DOE) and JEA covering DOE participation in the Northside Unit 2 project required JEA to demonstrate the ability of the unit to utilize a variety of different fuels. Black and Veatch Corporation (B&V) contracted Clean Air Engineering, Inc. (CleanAir) to perform the air emission measurements required as part of the demonstration test program. This report covers air emission measurements obtained during the firing of a blend of 50% Pittsburgh No. 8 coal and 50% Petroleum Coke to the unit. The test program included the measurement of the following parameters:
• particulate matter (PM), [SDA Inlet and Stack]; • sulfur dioxide (SO2), [SDA Inlet]; • fluoride (F), [Stack]; • lead (Pb), [Stack]; • speciation of mercury (Hg0, Hg2+, Hgtp), [SDA Inlet and Stack]; • ammonia (NH3).
The field portion of the test program took place at the Unit 2 SDA Inlet and Stack locations on January 27 and 28, 2004. Coordinating the field portion of the testing were: T. Compaan – Black and Veatch R. Huggins – Black and Veatch W. Goodrich - JEA K. Davis - JEA J. Martin - RMB J. Stroud - Clean Air Engineering Table 1-1 contains a summary of the specific test locations, various reference methods and sampling periods for each of the sources sampled during the program. The results of the test program are summarized in Table 1-2. A more detailed presentation of the test data is contained in Tables 2-1 through 2-10. Process data collected during the test program is contained in Appendix H.
1 Project Overview
BLACK & VEATCH CORPORATION Client Reference No: 137064.96.1400 JEA - NORTHSIDE GENERATING STATION CleanAir Project No: 9475-2 PROJECT OVERVIEW 1-2
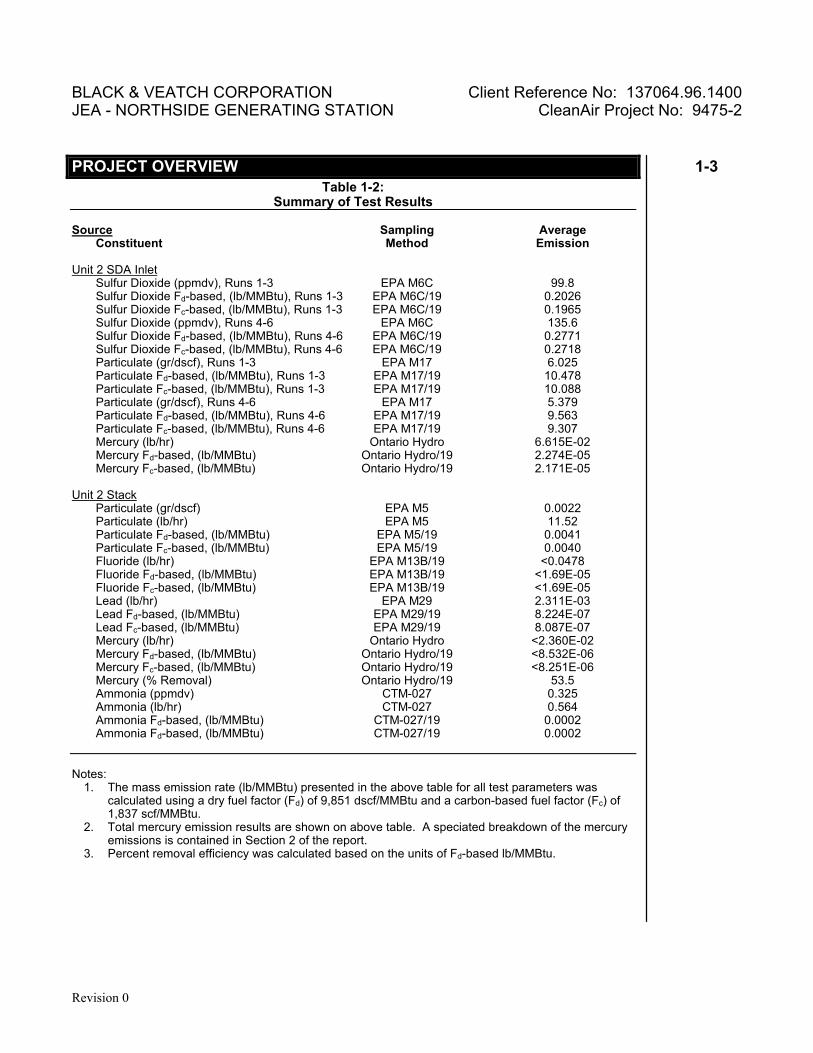
Notes: 1. The mass emission rate (lb/MMBtu) presented in the above table for all test parameters was
calculated using a dry fuel factor (Fd) of 9,851 dscf/MMBtu and a carbon-based fuel factor (Fc) of 1,837 scf/MMBtu.
2. Total mercury emission results are shown on above table. A speciated breakdown of the mercury emissions is contained in Section 2 of the report.
3. Percent removal efficiency was calculated based on the units of Fd-based lb/MMBtu.
BLACK & VEATCH CORPORATION Client Reference No: 137064.96.1400 JEA - NORTHSIDE GENERATING STATION CleanAir Project No: 9475-2 PROJECT OVERVIEW 1-4
Revision 0
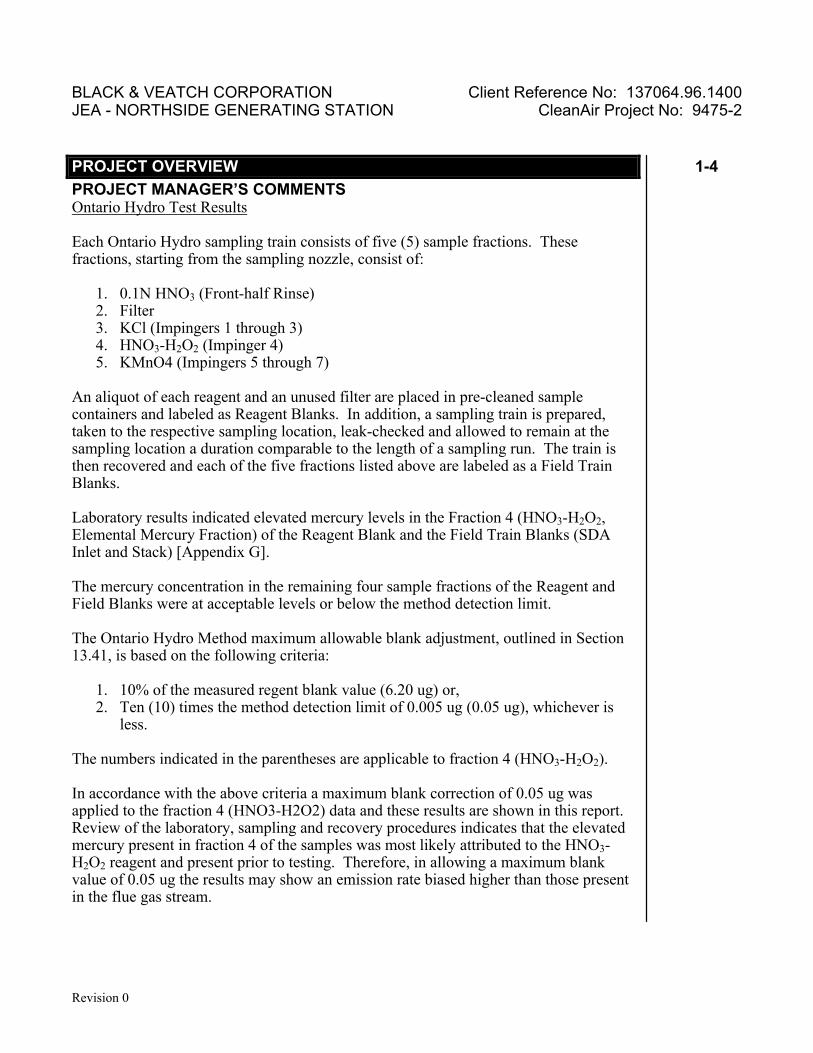
PROJECT MANAGER’S COMMENTS Ontario Hydro Test Results Each Ontario Hydro sampling train consists of five (5) sample fractions. These fractions, starting from the sampling nozzle, consist of:
An aliquot of each reagent and an unused filter are placed in pre-cleaned sample containers and labeled as Reagent Blanks. In addition, a sampling train is prepared, taken to the respective sampling location, leak-checked and allowed to remain at the sampling location a duration comparable to the length of a sampling run. The train is then recovered and each of the five fractions listed above are labeled as a Field Train Blanks. Laboratory results indicated elevated mercury levels in the Fraction 4 (HNO3-H2O2, Elemental Mercury Fraction) of the Reagent Blank and the Field Train Blanks (SDA Inlet and Stack) [Appendix G]. The mercury concentration in the remaining four sample fractions of the Reagent and Field Blanks were at acceptable levels or below the method detection limit. The Ontario Hydro Method maximum allowable blank adjustment, outlined in Section 13.41, is based on the following criteria:
1. 10% of the measured regent blank value (6.20 ug) or, 2. Ten (10) times the method detection limit of 0.005 ug (0.05 ug), whichever is
less. The numbers indicated in the parentheses are applicable to fraction 4 (HNO3-H2O2). In accordance with the above criteria a maximum blank correction of 0.05 ug was applied to the fraction 4 (HNO3-H2O2) data and these results are shown in this report. Review of the laboratory, sampling and recovery procedures indicates that the elevated mercury present in fraction 4 of the samples was most likely attributed to the HNO3-H2O2 reagent and present prior to testing. Therefore, in allowing a maximum blank value of 0.05 ug the results may show an emission rate biased higher than those present in the flue gas stream.
BLACK & VEATCH CORPORATION Client Reference No: 137064.96.1400 JEA - NORTHSIDE GENERATING STATION CleanAir Project No: 9475-2 PROJECT OVERVIEW 1-5
Revision 0
Based on the above information, applying a correction to the fraction 4 portion of the sample train equivalent to the fraction 4 value of the respective Field Blank Trains is recommended (i.e., SDA Inlet = 35.8 ug and Stack = 22.6 ug). Following this modified blank correction procedure the average total mercury emissions (Fd-based lb/MMBtu) at the SDA Inlet and Stack would be 1.426E-05 and 5.434E-07, respectively. This calculates to an average removal efficiency of 97.0%.
BLACK & VEATCH CORPORATION Client Reference No: 137064.96.1400 JEA - NORTHSIDE GENERATING STATION CleanAir Project No: 9475-2 RESULTS 2-1
Revision 0
Table 2-1: Unit 2 – SDA Inlet – Sulfur Dioxide, Run 1 through 3
Run No. 1 2 3 AverageDate (2004) January 27 January 27 January 27Start Time 11:35 13:11 14:57End Time 12:35 14:11 15:57Elapsed Time 1:00 1:00 1:00
1 The elemental mercury (HNO3-H2O2 fraction) was calculated using the maximum allowable blank value of (0.05 ug) which is ten (10) times the laboratory detection limit of 0.005 ug.
BLACK & VEATCH CORPORATION Client Reference No: 137064.96.1400 JEA - NORTHSIDE GENERATING STATION CleanAir Project No: 9475-2 RESULTS 2-6
Revision 0
Table 2-6: Unit 2 – Stack – Particulate Matter
Run No. 1 2 3 Average
Date (2004) Jan 27 Jan 27 Jan 27Start Time (approx.) 08:00 10:35 13:08Stop Time (approx.) 10:07 12:43 15:20
1 The "less than" sign indicates that the sample was below the laboratory minimum detection limit of 0.06 mg/liter.The minimum detection limit was used in the calculations. J Q K @_O
BLACK & VEATCH CORPORATION Client Reference No: 137064.96.1400 JEA - NORTHSIDE GENERATING STATION CleanAir Project No: 9475-2 RESULTS 2-8
Revision 0
Table 2-8: Unit 2 – Stack – Lead
Run No. 1 2 3 Average
Date (2004) Jan 27 Jan 27 Jan 27Start Time (approx.) 08:00 10:35 13:08Stop Time (approx.) 10:07 12:43 15:20
1 Less than symbol indicates that one or more factions (oxidized mercury) were below the laboratory minimum detection limit. Any fraction below the minimum detection limit was calculated using a value of 0.5 times the non-detect value. 2 Removal efficiency calculate using Fd-based (lb/MMBtu) 3 The elemental mercury (HNO3-H2O2 fraction) was calculated using the maximum allowable blank value of (0.05 ug) which is ten (10) times the laboratory detection limit of 0.005 ug.
BLACK & VEATCH CORPORATION Client Reference No: 137064.96.1400 JEA - NORTHSIDE GENERATING STATION CleanAir Project No: 9475-2 RESULTS 2-10
Revision 0
Table 2-10: Unit 2 – Stack - Ammonia
Run No. 1 2 3 Average
Date (2004) Jan 28 Jan 28 Jan 28Start Time (approx.) 08:00 10:02 11:34Stop Time (approx.) 09:08 11:11 12:39
BLACK & VEATCH CORPORATION Client Reference No: 137064.96.1400 JEA - NORTHSIDE GENERATING STATION CleanAir Project No: 9475-2 DESCRIPTION OF INSTALLATION 3-1
Revision 0
PROCESS DESCRIPTION The Jacksonville Electric Northside Generating Station Unit 2 consists of a 300 MW circulating fluidized bed (CFB) boiler a lime-based spray dryer absorber (SDA) and a pulse jet fabric filter (PJFF). The SDA has sixteen independent dual-fluid atomizers. The fabric filter has eight isolatable compartments. The control system also uses reagent preparation and byproduct handling subsystems. The SDA byproduct solids/fly ash collected by the PJFF is pneumatically transferred from the PJFF hoppers to either the Unit 2 fly ash silo or the Unit 2 AQCS recycle bin. Fly ash from the recycle bin is slurried and reused as the primary reagent by the SDA spray atomizers. The reagent preparation system converts quicklime (CaO), which is delivered dry to the station, into a hydrated lime [Ca(OH)2] slurry, which is fed to the atomizers as a supplemental reagent. The testing reported in this document was performed at the Unit 2 SDA Inlet and Stack locations. A schematic of the process indicating sampling locations is shown in Figure 3-1.
CFBBoiler SNCR
Air Heater
Spray Drier Absorber(SDA)
SDA Inlet Test PortsParticulate, Sulfur Dioxide
Mercury
Fabric FilterBaghouse
Induced Draft (ID) Fan
Main Stack
Main Stack Test PortsParticulate, Lead, Mercury, Fluoride
Ammonia, PCDD/PCDF
Figure 3-1: Process Schematic
3 Description of Installation
BLACK & VEATCH CORPORATION Client Reference No: 137064.96.1400 JEA - NORTHSIDE GENERATING STATION CleanAir Project No: 9475-2 DESCRIPTION OF INSTALLATION 3-2
Revision 0
DESCRIPTION OF SAMPLING LOCATION(S) Sampling point locations were determined according to EPA Method 1. Table 3-1 outlines the sampling point configurations. Figure 3-3 and 3-3 illustrate the sampling points and orientation of sampling ports for each of the sources tested in the program.
Table 3-1: Sampling Points
Run Points Minutes Total Location Constituent Method No. Ports per Port per Point Minutes Figure Unit 2 SDA Inlet SO2 6C 1-7 1 1 601 60 N/A Unit 2 SDA Inlet Particulate 17 1-7 4 6 2.5 60 3-1 Unit 2 SDA Inlet Mercury OH2 1-3 4 6 5 120 3-1 Unit 2 Stack Particulate 5 1-3 4 3 10 120 3-2 Unit 2 Stack Fluoride 13B 1-5 4 3 5 60 3-2 Unit 2 Stack Lead 29 1-3 4 3 10 120 3-2 Unit 2 Stack Mercury OH2 1-3 4 3 10 120 3-2 Unit 2 Stack Ammonia CTM-027 1-3 4 3 5 60 3-2 1 Sulfur Dioxide was sampled from a single point in the duct. Readings were collected at one-second intervals by the computer based data acquisition system and reported as one-minute averages. 2 Mercury was determined using the Ontario Hydro method.
BLACK & VEATCH CORPORATION Client Reference No: 137064.96.1400 JEA - NORTHSIDE GENERATING STATION CleanAir Project No: 9475-2 DESCRIPTION OF INSTALLATION 3-3
Revision 0
DESCRIPTION OF SAMPLING LOCATION (CONTINUED)
Sampling Point Port to Point Distance (in.) 1 76.9 2 54.0 3 38.2 4 25.5 5 14.5 6 4.5 Diameters to upstream disturbance: >2.0 Limit: 2.0 (minimum) Diameters to downstream disturbance: >0.5 Limit: 0.5 (minimum)
Figure 3-2: SDA Inlet Sampling Point Determination (EPA Method 1)
BLACK & VEATCH CORPORATION Client Reference No: 137064.96.1400 JEA - NORTHSIDE GENERATING STATION CleanAir Project No: 9475-2 DESCRIPTION OF INSTALLATION 3-4
Revision 0
DESCRIPTION OF SAMPLING LOCATION (CONTINUED)
Sampling Point Port to Point Distance (in.) 1 53.3 2 26.3 3 7.9 Diameters to upstream disturbance: >8.0 Limit: 2.0 (minimum) Diameters to downstream disturbance: >2.0 Limit: 0.5 (minimum)
Figure 3-3: Stack Sampling Point Determination (EPA Method 1)
BLACK & VEATCH CORPORATION Client Reference No: 137064.96.1400 JEA - NORTHSIDE GENERATING STATION CleanAir Project No: 9475-2 METHODOLOGY 4-1
Revision 0
Clean Air Engineering followed procedures as detailed in U.S. Environmental Protection Agency (EPA) Methods 1, 2, 3A, 4, 5, 6C, 13B, 23, 29, Conditional Test Method CTM-027 and the Ontario Hydro Method. The following table summarizes the methods and their respective sources.
Table 4-1: Summary of Sampling Procedures
Title 40 CFR Part 60 Appendix A Method 1 “Sample and Velocity Traverses for Stationary Sources” Method 2 “Determination of Stack Gas Velocity and Volumetric Flow Rate (Type S Pitot Tube)” Method 3A “Determination of Oxygen and Carbon Dioxide Concentrations in Emissions from
Stationary Sources (Instrumental Analyzer Procedure)” Method 4 “Determination of Moisture Content in Stack Gases” Method 5 “Determination of Particulate Emissions from Stationary Sources” Method 6C “Determination of Sulfur Dioxide Emissions from Stationary Sources (Instrumental
Analyzer Procedure)” Method 13B “Determination of Total Fluoride Emissions from Stationary Sources (Specific Ion
Electrode Method)” Method 23 “Determination of Polychlorinated Dibenzo-p-Dioxins and Polychlorinated
Dibenzofurans from Stationary Sources” Method 29 “Determination of Metals Emissions from Stationary Sources” Conditional Test Method CTM-027 “Procedure for the Collection and Analysis of Ammonia in Stationary Sources.” Draft Methods Ontario Hydro “Standard Test Method for Elemental, Oxidized, Particle-Bound and Total Mercury in
Flue Gas Generated from Coal-Fired Stationary Sources.” The EPA Methods (1 through 29) appear in detail in Title 40 of the Code of Federal Regulations (CFR). The Conditional Test Method and the Hydro Ontario Method appear in detail on the US EPA Emissions Measurement Center web page. All methods may be found on the World Wide Web at http://www.cleanair.com. Diagrams of the sampling apparatus and major specifications of the sampling, recovery and analytical procedures are summarized for each method in Appendix A. Clean Air Engineering followed specific quality assurance and quality control (QA/QC) procedures as outlined in the individual methods and in USEPA “Quality Assurance Handbook for Air Pollution Measurement Systems: Volume III Stationary Source-Specific Methods”, EPA/600/R-94/038C. Additional QA/QC methods as prescribed in Clean Air’s internal Quality Manual were also followed. Results of all QA/QC activities performed by Clean Air Engineering are summarized in Appendix D.
4 Methodology
BLACK & VEATCH CORPORATION Client Reference No: 137064.96.1400 JEA - NORTHSIDE GENERATING STATION CleanAir Project No: 9475-2 APPENDIX
Revision 0
TEST METHOD SPECIFICATIONS.................................................................................... A SAMPLE CALCULATIONS.................................................................................................. B PARAMETERS .................................................................................................................... C QA/QC DATA....................................................................................................................... D FIELD DATA........................................................................................................................ E FIELD DATA PRINTOUTS.................................................................................................. F LABORATORY DATA..........................................................................................................G FACILITY OPERATING DATA ............................................................................................ H
Particulate size distributionParticulate Left Mesh, 1/2", wt%Particulate Left Mesh, #4, wt%Particulate Left Mesh, #8, wt%Particulate Left Mesh, #14, wt%Particulate Left Mesh, #28, wt%Particulate Left Mesh, #48, wt%Particulate Left Mesh, #100, wt%Particulate Left Mesh, #200, wt%Bottom, wt%
0.03
21.39
0.83
2.050.00
68.0821.1324.722.830.640.491.18
0.020.00
0.000.007.526.25
17.8222.6425.8518.720.14
Average Values
Page 2 of 4 Jan 27-28 Bed AshBed Ash Jan. 27, 2004
JEA Northside Unit 2Test #2
50/50 Blend Pet Coke and Pittsburgh 8 CoalSUMMARY - BED ASH ANALYSES
Particulate size distributionParticulate Left Mesh, 1/2", wt%Particulate Left Mesh, #4, wt%Particulate Left Mesh, #8, wt%Particulate Left Mesh, #14, wt%Particulate Left Mesh, #28, wt%Particulate Left Mesh, #48, wt%Particulate Left Mesh, #100, wt%Particulate Left Mesh, #200, wt%Bottom, wt%
0.01
23.40
0.90
1.770.00
70.3321.1923.782.190.280.481.16
0.010.00
0.000.247.097.42
17.1921.2525.0921.440.13
Average Values
Page 4 of 4 Jan 27-28 Bed AshBed Ash Jan. 28, 2004
Particulate size distributionParticulate Left Mesh, #4, wt%Particulate Left Mesh, #14, wt%Particulate Left Mesh, #28, wt%Particulate Left Mesh, #48, wt%Particulate Left Mesh, #100, wt%Particulate Left Mesh, #270, wt%Particulate Left Mesh, #325, wt%Bottom, wt%
Particulate size distributionParticulate Left Mesh, #4, wt%Particulate Left Mesh, #14, wt%Particulate Left Mesh, #28, wt%Particulate Left Mesh, #48, wt%Particulate Left Mesh, #100, wt%Particulate Left Mesh, #270, wt%Particulate Left Mesh, #325, wt%Bottom, wt%