Fuel Cell System Cost for Transportation–2008 Cost Estimate National Renewable Energy Laboratory 1617 Cole Boulevard • Golden, Colorado 80401-3393 303-275-3000 • www.nrel.gov NREL is a national laboratory of the U.S. Department of Energy, Office of Energy Efficiency and Renewable Energy, operated by the Alliance for Sustainable Energy, LLC Contract No. DE-AC36-08-GO28308 Independent Review Published for the U.S. Department of Energy Hydrogen Program NREL/BK-6A1-45457 Revised May 2009
Transcript
Fuel Cell System Cost for Transportation–2008 Cost Estimate
National Renewable Energy Laboratory 1617 Cole Boulevard • Golden, Colorado 80401-3393 303-275-3000 • www.nrel.gov
NREL is a national laboratory of the U.S. Department of Energy, Office of Energy Efficiency and Renewable Energy, operated by the Alliance for Sustainable Energy, LLC Contract No. DE-AC36-08-GO28308
Independent Review Published for the U.S. Department of Energy Hydrogen Program
NREL/BK-6A1-45457
Revised May 2009
NOTICE
This report was prepared as an account of work sponsored by an agency of the United States government. Neither the United States government nor any agency thereof, nor any of their employees, makes any warranty, express or implied, or assumes any legal liability or responsibility for the accuracy, completeness, or usefulness of any information, apparatus, product, or process disclosed, or represents that its use would not infringe privately owned rights. Reference herein to any specific commercial product, process, or service by trade name, trademark, manufacturer, or otherwise does not necessarily constitute or imply its endorsement, recommendation, or favoring by the United States government or any agency thereof. The views and opinions of authors expressed herein do not necessarily state or reflect those of the United States government or any agency thereof.
Available electronically at http://www.osti.gov/bridge
Available for a processing fee to U.S. Department of Energy and its contractors, in paper, from:
U.S. Department of Energy Office of Scientific and Technical Information P.O. Box 62 Oak Ridge, TN 37831-0062 phone: 865.576.8401 fax: 865.576.5728 email: mailto:[email protected]
Available for sale to the public, in paper, from: U.S. Department of Commerce National Technical Information Service 5285 Port Royal Road Springfield, VA 22161 phone: 800.553.6847 fax: 703.605.6900 email: [email protected] online ordering: http://www.ntis.gov/ordering.htm
Printed on paper containing at least 50% wastepaper, including 10% post consumer waste.
From: Independent Review Panel, Fuel Cell System Cost for Transportation – 2008 Cost Estimate
To: Dr. Michael A. Duffy, NREL, DOE Hydrogen Systems Integrator
Subject: Independent Review Panel Report
Per the tasks and criteria of the Independent Review Charter of November 17, 2008, this is the Independent Review Panel’s unanimous technical conclusion, arrived at from data collection, document reviews, interviews, and deliberations between December 2008 and March 2009.
Conclusion Statement The Panel believes that a range of $60/kWnet to 80/kWnet is a valid estimation of the potential manufactured cost for an 80 kWnet fuel cell system, based on 2008 technology, extrapolated to a volume of 500,000 systems per year, and the constraints and conditions provided to the contractors by the DOE Hydrogen Fuel Cells and Infrastructure Technologies (HFCIT) Program and the Freedom Car and Fuel Partnership Fuel Cell Technical Team (FCTT). The range in calculated cost is consistent with the current maturity of technology, design, and manufacturing knowhow. The Panel believes the DTI calculated cost of $76/kWnet and the TIAX mean cost from their Monte Carlo analysis of $73/kWnet are credible representations of the cost within the provided constraints and conditions.
Rationale for Conclusion The Panel believes that the constraints and conditions provided to the contractors by HFCIT personnel and the FCTT are reasonable given the maturity of the technology. The primary parameters used by both contractors are manufacture of 500,000 systems per year at 80 kWnet with platinum-group-metal (PGM) priced at $1100/troy ounce and areal power density of 715 mW/cm2 at a total PGM loading of 0.25mg/cm2. However, operational factors and durability issues will influence materials and component selection and influence the overall cost analysis methodology and likely the manufactured cost.
The Panel and HFCIT deem appropriate the bottom-up methodology being used by DTI and TIAX to determine manufacturing cost by the use of representative stack, balance of plant (BOP), and system designs, considering that neither contractor has access to design, manufacturing cost, or performance data for actual components in a specific 80-kWnet system. Component and material suppliers, national laboratories, and auto industry representatives interviewed were in general agreement with the assumptions made and results developed, given the overall maturity of the 2008 technology and component designs.
Comparative analysis of the DTI and TIAX cost results at the subcomponent, component, subsystem, and system levels indicates a range in values consistent with the level of maturity of
ii
the design and manufacturing processes. Further, each contractor developed a cost estimate that was within the band of sensitivity analysis results of the other.
ANL Argonne National Laboratory BOM Bill of Material BOP balance of plant BOS balance of system CCM catalyst-coated membrane CEM compressor expander module with motor (occasionally CMEU) CFP carbon fiber paper CMEU Compressor Motor Expander Unit DFMA® Design for Manufacturing and Assembly DOE U.S. Department of Energy DTI Direct Technologies, Inc. ePTFE expanded polytetrafluroethylene EWH enthalpy wheel humidifier FC fuel cell FCTT Fuel Cell Tech Team FCV fuel cell vehicle GDE gas diffusion electrode GDL gas diffusion layer HC Hydrocarbon HFCIT Hydrogen, Fuel Cells and Infrastructure Technologies Program ICE internal combustion engine MEA membrane electrode assembly MH membrane hydrogen humidifier MPL microporous layer NREL National Renewable Energy Laboratory NSTF nano structured thin film OEM original equipment manufacturer PEM proton exchange membrane PFSA perfluorosulfonic acids PGM platinum group metal VGV variable guide vane
Conclusion Statement ................................................................................................................................ i
Rationale for Conclusion ........................................................................................................................... i
Acronyms and Abbreviations ...................................................................................................................... iii
1.0 Introduction The U.S. Department of Energy (DOE) Hydrogen, Fuel Cells and Infrastructure Technologies (HFCIT) Program Manager asked the National Renewable Energy Laboratory (NREL) to commission an independent review of the two proton exchange membrane (PEM) automotive system cost analyses contracted by the HFCIT Program. The NREL systems integrator is responsible for conducting independent reviews of progress toward meeting the HFCIT Program technical targets. An important technical target of the HFCIT Program is the 2010 PEM fuel cell system cost of $45/kWnet.
NREL commissioned an independent review panel of industry fuel cell experts (see Appendix A) to evaluate the cost estimation process and the results reported by TIAX LLC in its “Direct Hydrogen PEMFC Manufacturing Cost Estimation for Automotive Applications”1 and the Directed Technologies Inc. (DTI) cost estimate “Mass Production Cost Estimation of Direct H2 PEM Fuel Cell Systems for Automotive Applications.”2,3
Over the last several years, the HFCIT Program has contracted with TIAX and DTI to produce estimates of the high volume cost of manufacturing PEM fuel cell systems for transportation use. No manufacturer yet produces PEM fuel cells in the quantities needed to introduce fuel cell vehicles (FCVs) and related hydrogen infrastructure into the marketplace, so DOE needs these estimates to gauge progress toward meeting its target. The TIAX PEM automotive fuel cell system cost analysis is a continuation of the TIAX activities supported by the HFCIT Program. The most recent TIAX cost analysis has as its foundation the PEM system design developed by Argonne National Laboratory (ANL) that was used in the 2005 TIAX cost analysis.4
This analysis incorporates many of the most recent technology advances developed under the HFCIT PEM fuel cell program and recommendations from the original equipment manufacturers (OEMs) on the Fuel Cell Tech Team (FCTT). These advances provide the potential for lower cost pathways for commercializing the PEM fuel cell system for automotive applications. The production baseline for the TIAX cost analysis was 500,000 PEM fuel cell systems per year.
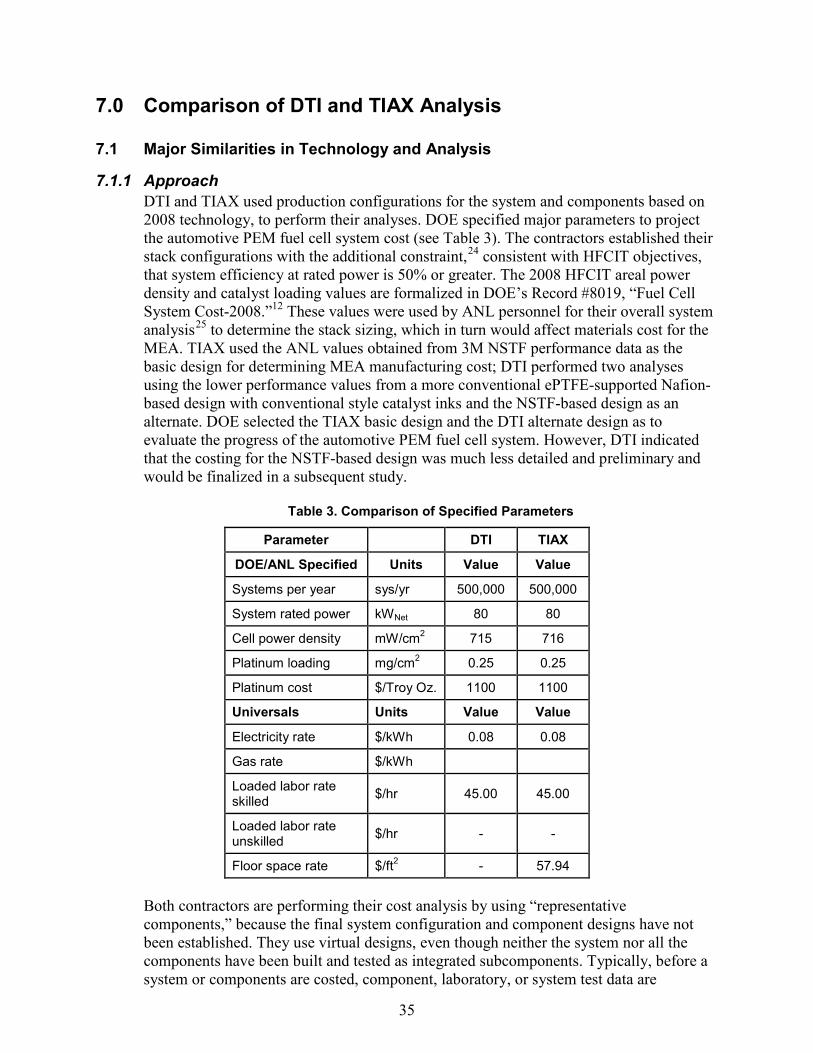
The DTI PEM automotive fuel cost analysis builds on the results of its 2007 cost analysis5 in which DTI estimated the materials and manufacturing costs of a specified 80 kWnet direct hydrogen PEM fuel cell system for powering light-duty automobiles. The PEM system proposed by DTI is a composite of elements from the HFCIT PEM fuel cell program, feedback from the FCTT, component suppliers, and OEMs that reflects DTI’s best judgment for the status of the technology. DTI estimated the system costs for three technology levels: a 2008 PEM fuel cell system that reflects 2007 technology but with new inputs from the HFCIT Program on catalyst loading and power density, a predicted 2010 technology system, a predicted 2015 technology system. The DTI analysis forecast PEM system costs based on the 2008 baseline data with production rates at 500,000 PEM fuel cell systems per year. The panel compared the DTI and TIAX cost analyses based on key specified parameters to forecast the automotive PEM fuel cell system cost. The DOE specified parameters are to manufacture 500,000 systems per year at 80
2
kWnet using 2008 technology with platinum priced at $1100/troy ounce. The ANL specified parameter for TIAX is an areal power density of 715 mW/cm2 at a total PGM loading of 0.25 mg/cm2. The impacts on cost of the differences in the PEM system designs of DTI and TIAX were assessed. TIAX and DTI manufacturing processes and component differences were also compared to assess their influence on cost and formalize any cost differential between the two independent evaluations. The panel identified areas of commonality in the DTI and TIAX cost analyses that benefit the HFCIT Program. Several improvements to the cost analyses efforts were proposed; the focus was on improving the clarity of the evaluation processes, imparting greater rigor to the analyses, and quantifying the cost improvements achieved by the HFCIT Program.
3
2.0 Objectives
• To establish and document a consensus technical appraisal of the validity of the reasonableness of the methodologies used by the contractors to estimate fuel cell system cost
• To determine the credibility of each contractor’s respective 2008 fuel cell estimates. These results are to be presented in a final report, including a one-page Summary Report with the panel’s consensus conclusions. Additional information, backup and supporting materials, and related conclusions and recommendations will be provided in the final report.
4
3.0 Panel’s Approach The primary sources of information for the Panel’s independent review are detailed technical presentations, reports, and communications provided by TIAX and DTI. The Panel supplemented this information with numerous interviews of technical experts throughout the fuel cell industry (Appendix B), including DOE HFCIT and FCTT staff. The Panel also performed literature research and examined project data and status reports. The Panel participated in a teleconference presentation from each contractor, reviewed the presentations, reports, and other inputs, and prepared a list of 60 questions that covered the full breadth of methodology and cost analysis. The questions were submitted to the contractors, who submitted oral and written responses. Both contractors (TIAX and DTI) participated in several interviews with the Panel and several one-on-one interviews with Panel members. The interviews and the written responses helped the Panel acquire a deeper understanding of background information and the cost analysis process that was not readily available from the presentations. The Panel interviewed the FCTT and the HFCIT Program team members to ascertain their inputs, requirements, and expectations for the cost analysis. The teams also completed written responses to additional sets of questions prepared for them. A comprehensive list of industry interviews completed the review process. Industry stakeholders and technologists critiqued the contractors’ cost analyses and accepted many of the conclusions and supportive recommendations. DTI and TIAX are at different stages in their analyses; specific comments on the approach for each follow. Neither DTI nor TIAX has access to design, manufacturing, or cost or performance data for actual components in a specific system, so the methodology to determine the system manufacturing cost is to use virtual stack, BOP and system designs (state-of-the-art technology that may have been built at the component or subcomponent level but not yet built and tested as an integrated hardware set). They are required to use this methodology because no test data are publicly available for full stacks and systems. Both contractors are using “representative components” as the basis to determine manufacturing costs and performance and the FCTT and the Panel agree that this technique is adequate given the maturity of the overall technology. It will likely yield results that do not significantly increase the spread in system cost. Few cost data are available for high-volume manufacture of stack and BOP components; thus, many assumptions must be made. Currently, only stack subcomponents (membrane, membrane electrode assembly [MEA], gas diffusion layer [GDL], etc.) are manufactured using processes that might be applicable at higher volumes, depending on final design criteria. The TIAX PEM automotive fuel cell cost analysis6 for 2008 being reviewed by the Panel is a continuation of the TIAX cost analysis activities7 supported by HFCIT. This most recent cost analysis incorporates the system design developed by ANL that was used in the 2005 TIAX cost analysis.8 The TIAX cost analysis reviewed here incorporates many of the most recent
5
technology advances developed under the HFCIT PEM fuel cell program. These advances provide lower cost pathways for the commercialization of the PEM fuel cell system for automotive applications.
TIAX, with the direction of the HFCIT Program and input from the FCTT, estimated the cost of an automotive PEM fuel cell system using a bottom-up approach based on TIAX’s database and industrial inputs for the analysis of the fuel cell stack and BOP components. The BOP cost analysis of the PEM automotive system by TIAX used two bottom-up costing tools: the TIAX Technology-Based Cost Model and the Boothroyd Dewhurst Design for Manufacturing and Assembly (DFMA®) commercial software. The DFMA analysis was performed on two BOP components and the TIAX Technology-Based Cost Model was used for the remainder. The PEM 2008 automotive fuel cell system cost analysis9 is an update to DTI’s 200710 cost analysis results. These results and other publicly available information11
form the foundation of the Panel’s analysis. DTI has used “best estimate” component and system designs based on its assessments of current technology, contractor input, and nonproprietary or open patent literature. DTI’s analysis is also founded on a bottom-up analysis that uses detailed DFMA analysis for every major component in the stack and BOP (total of 10) except for the membrane and GDL carbon fiber paper (CFP). Membrane and minor component cost inputs were determined from contractor quotes and the DTI experience base.
The evaluation of the DTI results is complicated by the cost of the stack configuration, which is based on different inputs. DTI sized its stack on the basis of the performance results attributed to nano structured thin film (NSTF) MEA technology used by ANL and TIAX; namely, 715 mA/cm2 at 0.25 mg PGM/cm2. However, DTI used the same manufacturing steps as it had selected for its more conventional expanded polytetrafluroethylene (ePTFE) Nafion and catalyst ink-based MEA design. This may appear to be inconsistent, but the FCTT, HFCIT, and the Panel agreed that this approach will yield a result that is not expected to significantly increase the spread in the overall calculated manufacturing cost. DTI and TIAX are continuously revising and updating their results and are in different stages of their HFCIT contracts. This makes direct comparison of their methodologies and cost results somewhat challenging. The Panel thus established a table with a common list of assumptions, design features, and costs and then had the contractors complete their respective portions of the table based on the expected final 2008 results, even though a final written narrative was not then available from either contractor. Even so, numerous clarifications and explanations for specific assumptions were required and obtained. DOE identified major assumptions to be used by the contractors; however, a more comprehensive comparison would require second-tier constraints.
6
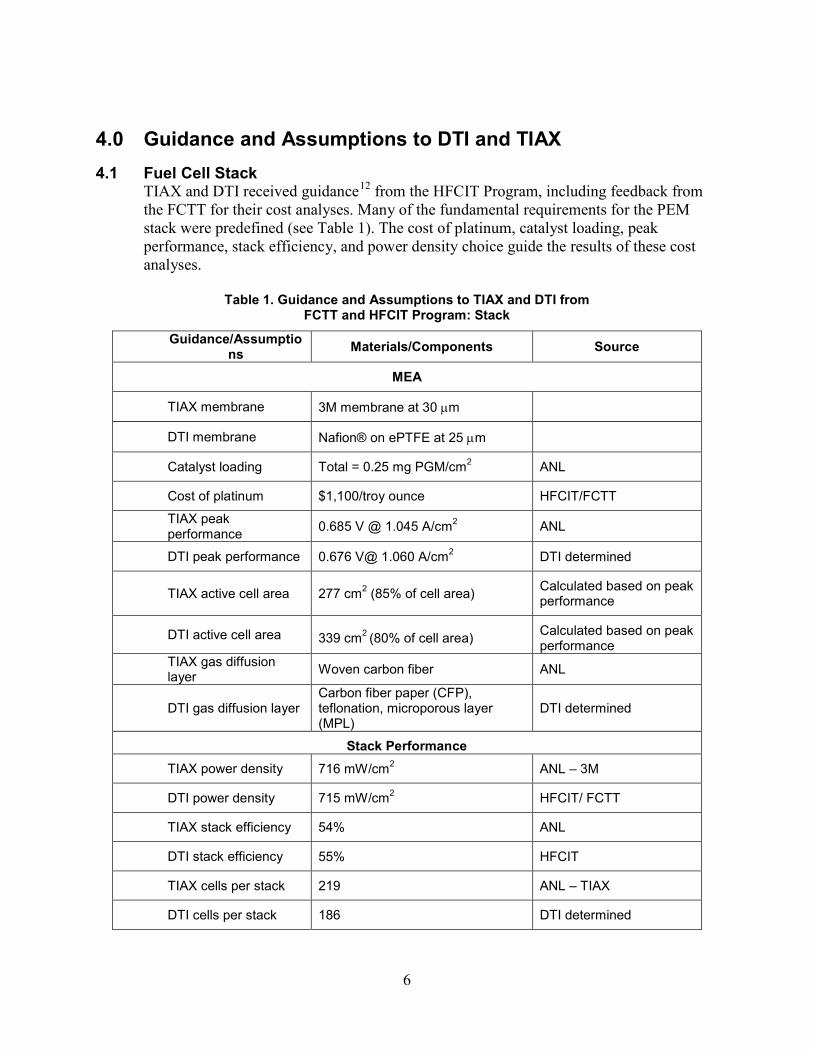
4.0 Guidance and Assumptions to DTI and TIAX 4.1 Fuel Cell Stack
TIAX and DTI received guidance12
Table 1
from the HFCIT Program, including feedback from the FCTT for their cost analyses. Many of the fundamental requirements for the PEM stack were predefined (see ). The cost of platinum, catalyst loading, peak performance, stack efficiency, and power density choice guide the results of these cost analyses.
Table 1. Guidance and Assumptions to TIAX and DTI from FCTT and HFCIT Program: Stack
OEM manufactures all stack components except the membrane and assembles the stack
HFCIT/FCTT
Mark-up non-membrane stack components*
None HFCIT/FCTT
Production volume 500,000 HFCIT/FCTT
* Membrane is purchased component with markup The catalyst loading and areal power density are founded on the performance of the 3M single cells that have operated under cyclic load for more than 7,300 hours.13
TIAX received guidance to assume the 3M NSTF catalyst technology and to use a 30-µm thick 3M membrane. The assumption of the 3M catalyst fixed the catalyst manufacturing approach and the method for manufacturing catalyst coated membrane for TIAX’s analysis. The data for the cell were supplemented by direct input from 3M that TIAX used to bolster the assumptions and estimates for the MEA manufacturing process. The direct information from 3M bestowed a level of confidence to the bottom-up analysis.
DTI received the guidance identified in Table 1 for catalyst loading and power density in sizing its stack, but was not required to assume the 3M NSTF catalyst or 3M membrane. DTI was not bound to use the 3M catalyst manufacturing method, and chose ePTFE-supported Nafion for the membrane, and a more standard catalyst ink formulation. DTI was able to choose its own GDL for its cost analysis, a nonwoven CFP-based design.
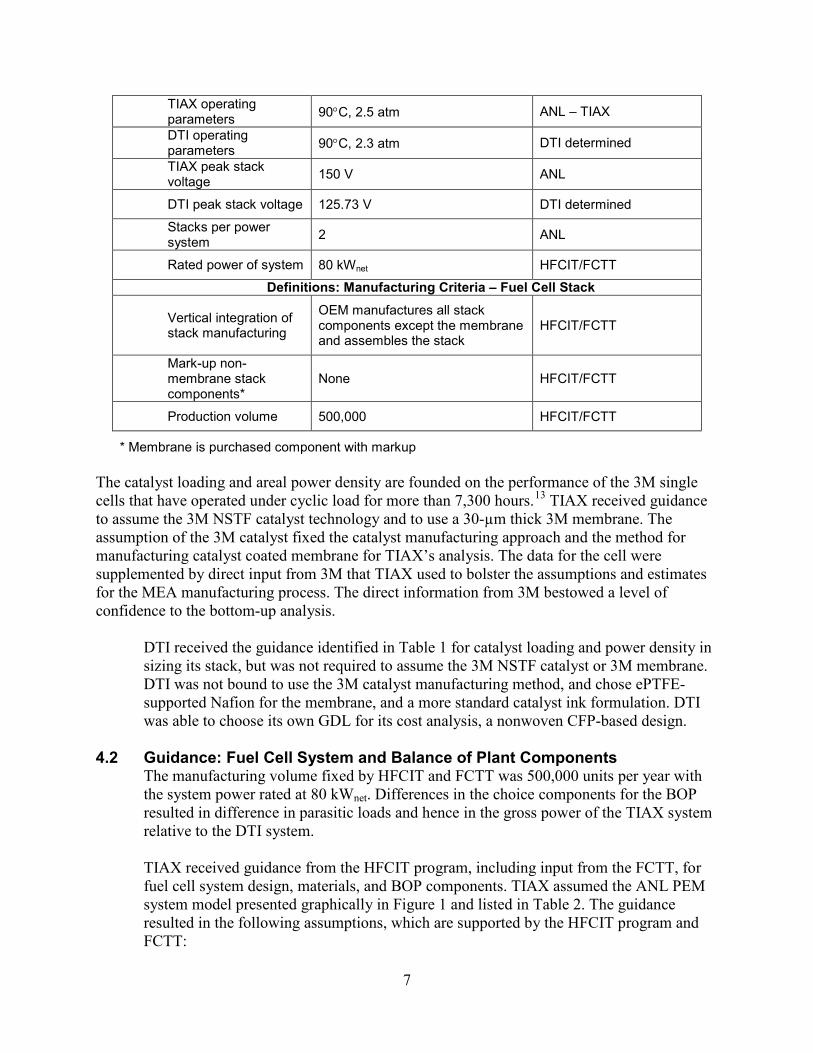
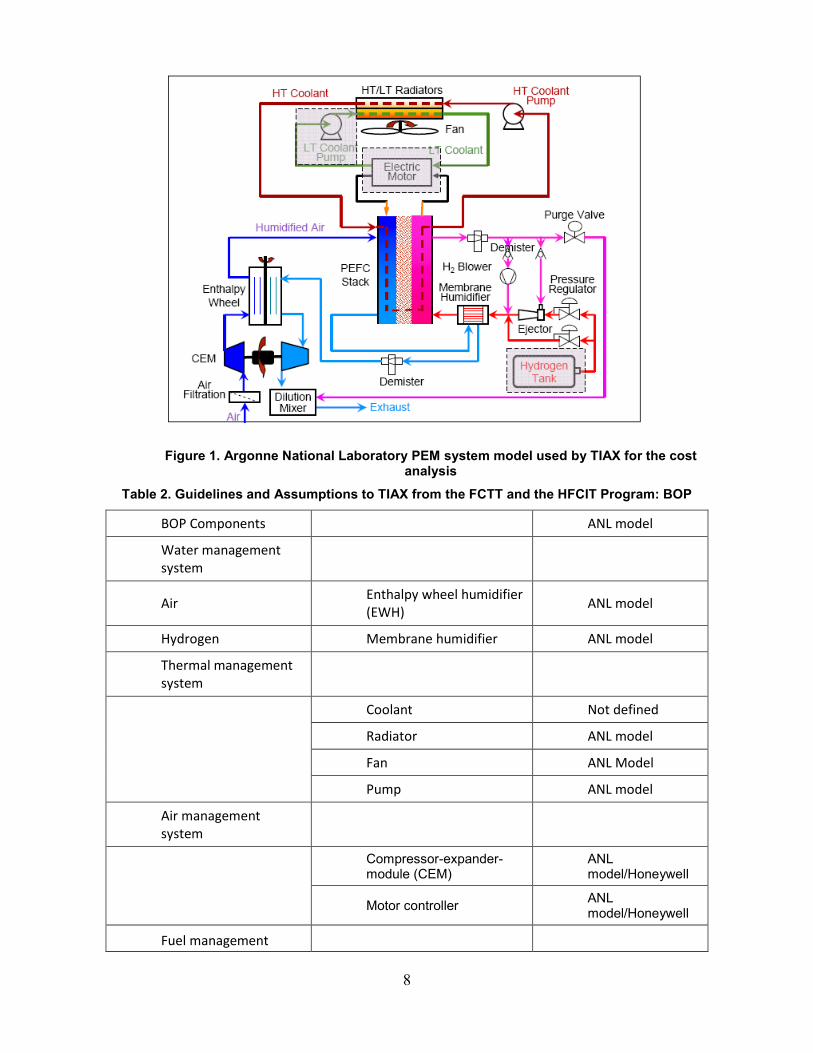
4.2 Guidance: Fuel Cell System and Balance of Plant Components The manufacturing volume fixed by HFCIT and FCTT was 500,000 units per year with the system power rated at 80 kWnet. Differences in the choice components for the BOP resulted in difference in parasitic loads and hence in the gross power of the TIAX system relative to the DTI system. TIAX received guidance from the HFCIT program, including input from the FCTT, for fuel cell system design, materials, and BOP components. TIAX assumed the ANL PEM system model presented graphically in Figure 1 and listed in Table 2. The guidance resulted in the following assumptions, which are supported by the HFCIT program and FCTT:
8
Figure 1. Argonne National Laboratory PEM system model used by TIAX for the cost
analysis
Table 2. Guidelines and Assumptions to TIAX from the FCTT and the HFCIT Program: BOP
BOP Components ANL model
Water management system
Air Enthalpy wheel humidifier (EWH)
ANL model
Hydrogen Membrane humidifier ANL model
Thermal management system
Coolant Not defined
Radiator ANL model
Fan ANL Model
Pump ANL model
Air management system
Compressor-expander-module (CEM)
ANL model/Honeywell
Motor controller ANL model/Honeywell
Fuel management
9
system
H2 blower ANL model
H2 ejectors ANL model
BOP Supplier based manufacture 15% markup
Gross System Power 86.9 kW ANL model
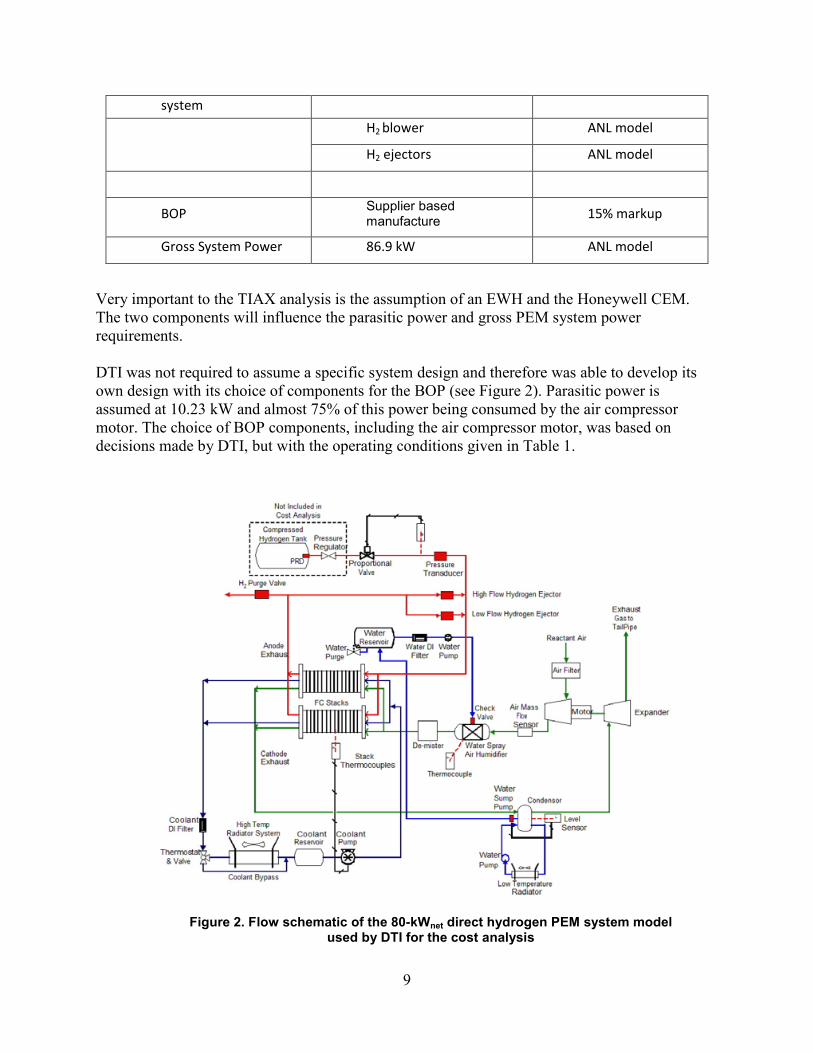
Very important to the TIAX analysis is the assumption of an EWH and the Honeywell CEM. The two components will influence the parasitic power and gross PEM system power requirements. DTI was not required to assume a specific system design and therefore was able to develop its own design with its choice of components for the BOP (see Figure 2). Parasitic power is assumed at 10.23 kW and almost 75% of this power being consumed by the air compressor motor. The choice of BOP components, including the air compressor motor, was based on decisions made by DTI, but with the operating conditions given in Table 1.
Figure 2. Flow schematic of the 80-kWnet direct hydrogen PEM system model
used by DTI for the cost analysis
10
5.0 DTI Cost Analysis
5.1 Elements of Methodology The main objective of the analysis is to estimate an overall cost for a complete 80-kWnet, direct hydrogen PEM fuel cell system based predominantly on materials and manufacturing costs. Various assumptions are used for these calculations, the most important of which will be discussed in Section 5.2. To understand the cost benefits associated with volume production, DTI looked at annual production rates of 1,000, 30,000, 80,000, 130,000, and 500,000 systems per year. However, for this analysis of the 2008 systems cost range, only the data for a production volume of 500,000 systems per year will be considered. DTI has made good use of DFMA methodology to evaluate all cost estimates, where supplier price quotes were not available. However, DTI departed somewhat from standard practices by ignoring markup assigned to such elements such as general and administrative, R&D, scrap, and profit. The implications of this departure from standard practices will be addressed in Section 9. The overall system design (see Figure 2) was based on DTI’s best approximation of the state-of-the-art technologies and how these might be assembled to achieve a functional unit. DTI used no proprietary information on system design in its system. As a result, it does not represent any system currently in use or under evaluation by OEMs or their respective suppliers. Materials costs were obtained from historical data or direct vendor quotations, where the latter were obtainable. For manufacturing cost, where direct data were not available, DTI used a combination of cycle time (machine time required to complete one part) and machine rate (hourly cost based on maintenance, utilities, other operating costs, and amortization of capital), plus tooling costs to estimate a cost per part. The assembly cost was simply estimated as the composite of the labor costs, any additional materials cost, and the amortization costs of any required equipment.
5.2 Assumptions DTI assumed there would be no change in overall system design as a function of increasing volume, but did assume changes in materials costs, manufacturing methods, and overhead expenses. For the MEA and bipolar plates, given the large numbers per system, manufacturing costs (even at low volumes) were considered to be similar to high-volume manufacturing. This was not the case for BOP components or stacks components such as end plates and current collectors. DTI assumed a composite membrane composed of an ePTFE support and Nafion ionomer, and that the catalyst-coated membrane (CCM) component of the MEA could be produced by double-sided, vertical die-slot coating of the membrane. The MEA was then
11
formed by heat and pressure bonding of the CCM and the GDL, with the latter containing a microporous layer (MPL). DTI assumed that the anode and cathode GDLs were identical. The MEA active area is assumed at 339 cm2, which is 80% of the total area of the unit cell, including gasketting. Based on guidance from DOE, ANL and the FCTT, DTI was asked to incorporate the most recent MEA performance data available from key developers. Analysis of these data led to the assumption of an MEA with 0.25 mg/cm2 PGM loading and an areal power density of 715 mW/cm2 using different manufacturing processes than those assumed by TIAX. These data were derived from inputs used by ANL in its overall system analysis. DTI essentially used these data to define the stack active area and cell count, which in turn were used to cost the materials. However, the manufacturing processes evaluated by DTI remained unchanged, as they were deemed to be representative, from a cost perspective, of the high-volume processes that might be used to produce a stack of the defined performance and size. The cost of platinum metal was assumed to be $1,100/troy ounce. It was further assumed that the system contained two stacks. The total number of active unit cells was estimated at 372. DTI assumed a unique design for each anode and cathode plate. Parasitic power is assumed at 10.23 kW; almost 75% of this power was consumed by the air compressor motor and the maximum stack temperature was pegged at 90°C. The system is assumed to operate at 0.677 V per cell with 1.8 oxidant stoichiometry and an operating pressure of 2.3 atm. The hydrogen loop is assumed to have no external humidification, with a 50% relative humidity inlet level for the oxidant based on water spray injection technology. The only operational assumption cited that could help provide freeze protection and freeze start is that the water will be drained on shutdown. The stack/system is assumed to undergo a five-hour conditioning process to achieve 95% of peak performance during factory acceptance testing. Beyond the elements one would normally see as part of a fuel cell system, the DTI analysis explicitly did not include fuel storage, energy storage devices, electric traction motor, or the traction inverter module. Labor rates for manufacturing processes are assumed to be $45/h for skilled labor. To calculate machine rate and cycle times leading to manufacturing cost estimates, DTI, where possible, benchmarked similar processes and equipment used in high-volume applications. Likely costs associated with R&D, product development and non-recurring engineering are assumed to be negligible or included in manufactured cost for components; the Panel believes that these costs are more significant and should be accounted for separately.
12
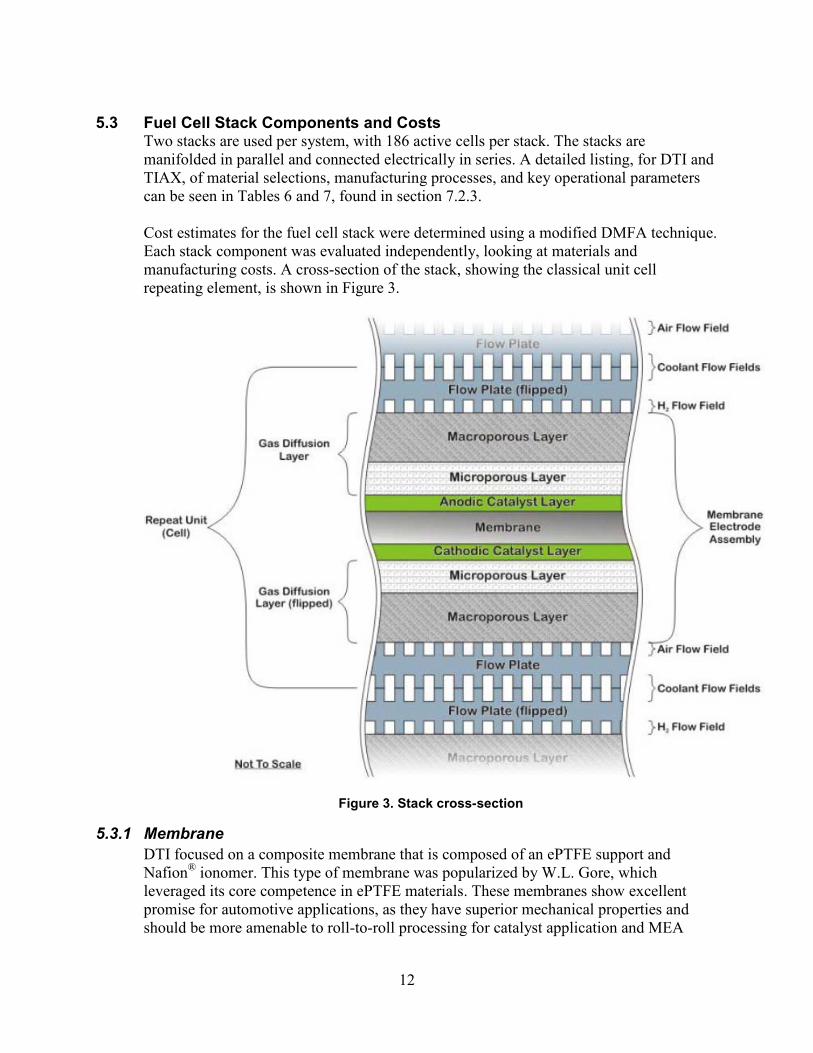
5.3 Fuel Cell Stack Components and Costs
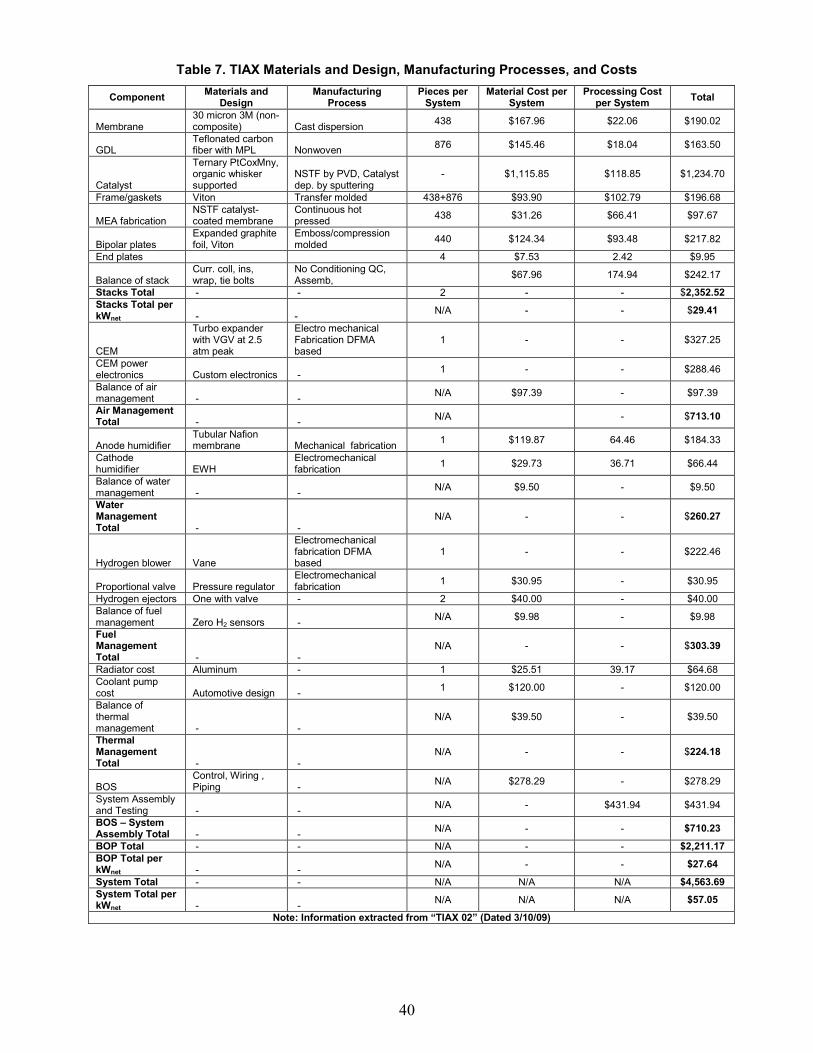
Two stacks are used per system, with 186 active cells per stack. The stacks are manifolded in parallel and connected electrically in series. A detailed listing, for DTI and TIAX, of material selections, manufacturing processes, and key operational parameters can be seen in Tables 6 and 7, found in section 7.2.3. Cost estimates for the fuel cell stack were determined using a modified DMFA technique. Each stack component was evaluated independently, looking at materials and manufacturing costs. A cross-section of the stack, showing the classical unit cell repeating element, is shown in Figure 3.
Figure 3. Stack cross-section
5.3.1 Membrane DTI focused on a composite membrane that is composed of an ePTFE support and Nafion® ionomer. This type of membrane was popularized by W.L. Gore, which leveraged its core competence in ePTFE materials. These membranes show excellent promise for automotive applications, as they have superior mechanical properties and should be more amenable to roll-to-roll processing for catalyst application and MEA
13
formation. The mechanical strength also allows for membranes to be made thinner, which reduces cost and increases power density. Other microporous materials such as expanded ultrahigh molecular weight polyethylene (Lydall Solutech BV) beyond ePTFE could further reduce costs and increase mechanical strength. These materials have already been made into composite membranes that have demonstrated excellent performance and durability under automotive cycling conditions. DTI used a 25-micron membrane in its analysis; however, membranes thinner than 18 microns are available as CCMs. These have higher performance and presumably lower cost at high volume. The cost of ePTFE should start to come down as more companies produce this material (the W.L. Gore core patent expired several years ago). Other competitive materials show promise in this and other applications. The cost assumed by DTI for Nafion in high volume ($92/kg) is aggressive and perhaps fails to take certain key business factors into consideration. Even at high volume, the total production quantity for perfluorosulfonic acids (PFSA), including Nafion, will likely be less than 300 tonnes per year. Also, the tonnage for DuPont will be much less, as the overall market will be split between four or five companies. Given the specialized nature of PFSA ionomers, only a few companies will be able to produce these materials. As such, data indicate limited pricing differential for these materials among suppliers; market share is determined by factors other than pricing. DTI notes that even at 500,000 stacks per year the total cost of membrane, which includes no margin at $92/kg for ionomer, plus membrane manufacturing cost, is only $33 million. This would hardly register in either DuPont or W.L. Gore’s bottom line. In this sole case DTI did, however, add markup to the cost projection of the membrane, assuming that an outside supplier to the OEMs would produce this component. Similar PFSA materials, as used in the fuel cell application, are also used in the chlor-alkali market. The membrane suppliers to this market will likely price membranes for fuel cells to protect their margins. On average, each key supplier sells about 50 tonnes of ionomer per year, as membrane, into the global chlor-alkali market. Finally, the ionomer companies are unlikely to build new capacity just to meet the 500,000 stacks per year demand – they would more likely build 5 to 10 times beyond this level to be in a position to meet future needs. This significant additional capital expense would have to be factored into the ionomer cost. If DTI’s curve of ionomer cost reduction as a function of volume is correct (see Figure 4)14
and if each supplier has about 50 tonnes/year of sales, the ionomer cost will be about $400/kg. If the cost of manufacturing the membrane does not change, this analysis (if correct) would increase the membrane cost to approximately $60/m2 at 500,000 stacks/year. This is a significant difference from the $16.62/m2 estimated by DTI, which assumes that all membrane is produced by a single supplier.
14
Save for new investment in capital, the membrane processing step will likely be a minor contributor to the overall membrane costs. However, the technology and expertise to produce quality membrane at the desired volume, especially using ePTFE, will be a clear differentiating factor among the suppliers.
Figure 4. Ionomer cost projection
5.3.2 Catalyst When we discuss catalyst, we refer to platinum metal and an ink formulation where platinum is dispersed on a carbon support material and then further dispersed into an ionomer ink with aqueous or aqueous alcoholic solvent mixtures. However, by far the greatest cost component of the ink is the platinum metal. The recent prices for platinum metal have varied considerably from the assumed value of $1,100/troy ounce, peaking at $2,280 in March 2008, and dropping to $782 in October 2008. However, the platinum price was set at $1,100/troy oz. by HFCIT for consistency in their year-to-year analysis. The price of platinum metal (when the technology is ready to produce 500,000 systems per year), will be pivotal to the OEM decision to proceed. The cost advantages associated with platinum recycling, hedging strategies, or the theory of catalyst leasing will be unlikely to significantly offset any negative impact of the absolute commodity price. Interestingly, many industry experts seem convinced that total loading of PGMs at 0.3 mg/cm2 or less will be sufficient to achieve the performance, operational flexibility and dynamic drive cycle durability required for commercial fuel cell automotive systems. At present, the cost analysis does not address the durability and operational flexibility that commercial fuel cell power trains will require. As such, there remains significant risk in the assumption that such low PGM loadings will be sufficient to achieve the required
15
overall product reliability, given the available materials, designs, and operational strategies. DTI assumed a simultaneous application of anode and cathode catalyst layers using a dual slot die process, with a vertically moving membrane. There are at least two key issues with this concept:
• The viscosity and rheology of the catalyst inks may not lend themselves to vertical processing at 10 m/min and 50-cm line width without running or smearing.
• Given the difference in thickness of anode and cathode coating layers, they will tend to dry unevenly and distort the membrane.
5.3.3 Gas Diffusion Layer The GDL is most often composed of a nonwoven carbon fiber/resin base material that is imbibed with a hydrophobicity agent to facilitate water management and an MPL to smooth the association with a CCM, or help avoid loss of catalyst, when the ink is applied directly to the GDL. Based on experiences of the Panel and interviews with industry, DTI’s assumption that anode and cathode GDLs will be identical, and as such do not require separate processing when a CCM is used to form the MEA is most likely not valid. Required differences in fluid management requirements of the anode and cathode, specifically in hydrophobicity, porosity and pore size distribution in MPLs will necessitate structural and design differences for the anode and cathode GDLs. This will likely have negative cost implications, based on the requirement for separate GDL processing of anode and cathode GDL, even when CCMs are used. There is still some evidence that work continues on woven, cloth-based GDL materials. These are believed to have more predictable water management properties, but are likely to be more expensive and less compatible with ultrathin membranes. Discrete MEAs based on cloth GDLs will have very limited rigidity, offering greater challenges in downstream processing and handling. Most suppliers are convinced that a GDL with MPL can be produced for $10–$15/m2 at high volume as a roll-goods material. Some even believe this cost is achievable if the GDL is sold as a discrete component. Further, supplier-based feedback indicates that this cost range is compatible with the assumption that the composition and structure of the anode and cathode GDL materials will differ somewhat. Given that two GDLs are required for each unit cell, the overall cost of this component, even at the low end of the range, is (as noted by DTI) higher than the projected cost of the membrane. This may identify the GDL as a new area of focus for significant cost reduction.
5.3.4 Membrane Electrode Assembly Manufacturing
DTI has assumed that the MEA will be produced in a roll-to-roll process by feeding the CCM, anode GDL, and cathode GDL into a hot press with a 90-second residence time
16
and a 30-second release, advance, and compress cycle, resulting in a finished MEA roll with a cycle time of 93 seconds for approximately 20 MEAs per cycle. As such, each pressing machine will take approximately 30 minutes to produce enough “raw” MEA for one stack. The number of simultaneous pressing machines, 146, raises significant concerns about consistency of product from line to line and the challenges in component inventory management and traceability in cases of performance issues at final testing. The “raw” MEA on a roll is then cut and sealed, depending on the specific dimensions as defined by the unit cell design. Efficiencies and yields for the cutting/slitting processes will be defined by the cell design and predetermined 50-cm roll width. DTI assumed in its specific example an “edge” waste through the slitter of at least 3.5-cm roll width, comprising GDL, catalyst, and membrane. Although this process is based on theoretical cell geometry, there is certain to be some waste. This material can be recycled, and the ionomer and platinum may be reusable. Finally, the discrete MEAs are sealed in an insertion molding process to complete what is often referred to as the 7-layer MEA. The number of individual machines required to meet the volume of sealed MEAs for 500,000 stacks per year is projected at 232, with a 99.7% utilization target. This is a staggering number of individual unit operations for a single processing step and raises issues associated with reproducibility and component tracking. This manufacturing step accounts for almost 90% of the cost associated with MEA production. Some MEA suppliers believe that the overall manufactured cost of an MEA can be lowered, and the required low platinum loadings achieved, if the catalyst is applied directly to the GDL. The assumption of near 100% yields and the virtual absence of costs associated with quality control measures—both on-line and at each main processing station—will be addressed in Section 9.
5.3.4.1 Sealing Sealing from a materials perspective is a relatively low-cost component as long as materials such as silicone are used as initially assumed in the DTI report. In the latter stages of the analysis, DTI selected the Henkel hydrocarbon-based sealing material. These materials are more expensive and may increase the manufacturing costs for the MEA. The process that DTI evaluated involves insertion molding to an MEA, followed by some sort of curing process. This process uses materials efficiently, but it needs to have almost 100% yield, given that any errors would cause the full MEA to be scrapped—a very expensive failure. The other challenge lies in the number of injection molding machines required to process the volume of MEA for 500,000 stacks per year. This is likely to be a significant capital expense and will probably require manual processing to remove the sealing material flash that is inherent to the process.
17
DTI ascribes a function of the sealing material to the provision of a rigid structure. It is difficult to imagine that the Henkel HC material, and certainly not silicone, could provide that function. As such, additional costs will likely be incurred to remove and handle this finished part into the stack assembly process.
5.3.5 Bipolar Plate DTI has evaluated carbon composite and metal-based materials as potential options for bipolar plates. In each case, DTI has correctly assumed a different flow field for each anode and cathode plate. Well-known Tier 1 automotive suppliers such as Dana Corporation continue to evaluate metal- and resin-based composites as candidates for bipolar plate materials. Many OEMs prefer metal-based plate materials for their overall robustness, increased volumetric power density, ease of design flexibility, well-established manufacturing and recycling/reuse processes, and what is believed to be a cost advantage. Cost depends on the base metal (stainless or carbon steel or even aluminum) and whether a separate coating will be required, which is still a matter of active debate. Proponents of coatings point to the need for protecting against corrosion and enhancing electrical conductivity to maximize performance. However, others believe that subtle surface modifications and system control of operating conditions will be less costly and sufficient to meet the needs for product performance and durability requirements. Nonetheless, a coating will add material and processing costs to the metal bipolar plate. In the latter stages of its analysis, DTI evaluated a proprietary technology for metal plates, developed by a small company called Treadstone Technologies, Inc. This involves applying a surface treatment that is currently based on a precious metal such as gold. The cost of the treatment, material, and process is close to $2/kW. The process is yet to be applied to a unit cell of a design for automotive applications. Excellent durability and stability have been demonstrated at steady state operation, but dynamic testing has yet to be performed, and/or data is not publicly available. Including the unproven surface treatment from Treadstone Technologies, Inc. in the analysis introduces a level of risk into the DTI cost evaluation for this component. In the case of injection-molded carbon powder/polymer composite plates, DTI has chosen polypropylene as a binding polymer. This is an inexpensive and readily available thermoplastic, but there may be creep and deformation at higher operating temperatures and pressures. However, the more commonly used thermosetting resins such as phenolics are not amenable to injection molding and require the more costly compression molding process for manufacture. These materials also have some issues with brittleness and tolerance control of fine design features. The cost difference for metal versus carbon composite plates will be determined based on the final choice of materials and processes required to meet design and operational specifications; however, the cost component will not likely be a significant deciding factor in the overall analysis.
5.3.6 Stack Assembly and Conditioning
18
The costs associated with endplates and current collectors are relatively insignificant compared with the cost of the MEAs, at around $0.60/kWgross. DTI has assumed a compression-molded composite endplate to reduce cost and decrease thermal losses. The combination of a composite endplate with a stack composed of nearly 400 metal plates may warrant further evaluation from an overall structural stability of design perspective. The stacks in the DTI study are compressed by metallic compression bands that are laser welded around the endplates that encapsulate the unit cells of the stack. The overall process of stack assembly was defined as semi-automated, requiring less time and labor. The 186 active cells are assembled in an automated process; the end cells and endplates with current collectors are added in a more manual process, along with the compression bands. The overall assembly process, including an initial fluids leak test, is estimated at $0.49/ kWgross. DTI has somewhat minimally accounted (e.g., $24 per system for air and fuel handling) for the means by which the two stacks will be individually and collectively manifolded for all the fluid inlets and outlets. For earlier fuel cell stack designs such as the Ballard Mk9, which was composed of four individual stacks, a rather sophisticated hardware element was used to facilitate the fluids in and out of the stacks. An evaluation of the requirements for such an assembly and the related costs would be beneficial to the overall analysis. Stack conditioning before shipping is challenging and costly. Ideally, the testing will be performed on all stacks to ensure that the final device meets the factory acceptance test specifications defined by the OEM. This testing also conditions the stack to achieve close to its peak performance by ensuring that the membrane and catalyst layers are rehydrated following the thermal process used to bond the MEAs. These tests require the stacks to be attached to a fuel cell test station that mimics the function of the BOP, or to the actual system that comprises the BOP components and control elements. If the former approach is taken, a significant capital expense must be assumed to build the required test stands and related infrastructure to ensure stack conditioning is not a bottleneck to the overall manufacturing process. The test stand that can perform the cycling conditions listed in the UTC patent for up to five stacks simultaneously is likely to cost more than the $100,000 cited by DTI, based on similar units produced by Greenlight Power Technologies and FuelCon. The infrastructure costs and gas costs for such tests are not insignificant and should be included. To be economically viable, some industry experts believe that stack conditioning needs to be reduced to less than 30 minutes. Others suggest that the most feasible approach is to couple stack conditioning with total system testing to obviate the need for expensive, dedicated test stations. The latter approach would require a high level of confidence that stacks and systems, as produced, meet design intent. This in turn would require substantial in-process quality control capabilities.
5.4 Fuel Cell System Configuration and BOP Components
19
The system design analyzed by DTI does not represent any specific OEM-driven design, but rather a composite of various elements collected from literature evaluation, DTI’s own experiences, and industry expert inputs. Although many stack and BOP components can individually meet design intent, the challenges and complexities of mixing these components into an integrated system are unclear. Tables 7 and 8, found in section 7.2.3, include a detailed list for DTI and TIAX of material selections, manufacturing processes, and key operational parameters. Significant financial support by governments and OEMs has been provided for stack component development, but the same cannot necessarily be said for BOP components. However, the proprietary activities undertaken directly by OEMs and their key suppliers have not been available for this review. To achieve a fully functioning system, the BOP components must be matured to the same level as the stack components. Most BOP components require more of an engineering development approach (as opposed to fundamental R&D). Significant challenges remain and expenditures are required to develop BOP components that meet functionality and cost requirements.
5.4.1 Air Management Subsystem Regardless of the growth profile of commercial FCVs, they will have to operate in an environment dominated by conventional internal combustion engine (ICE)-based vehicles for many decades to come. As such, volatile airborne contaminants could adversely affect the performance and durability of the stack, requiring an additional level of complexity and cost to the air filtering system. Basically, DTI broke down the air loop into its key subcomponent parts and priced the parts individually. A reality check aligned to this bottom-up approach was based on a specific quote from Opcon, a manufacturer of CMEU units used in FCVs, of $665 for 500,000 units per year. The analysis resulted in a projected cost per unit for the CMEU of $681.18. This number seems to have reasonable support from potential suppliers of such systems. However, the bottom-up analysis is based on a manufactured cost without provision for profit margin or the recovery of R&D and engineering development costs that the suppliers will incur in developing these BOP components. The supplier quote and DTI analysis have produced similar numbers for the air supply system, but they are both significantly higher than the $200 per unit DOE target, for an even lower volume of 100,000 units per year. The DTI numbers are more in line with estimates sourced from other potential suppliers of air supply systems targeted to meet DOE performance and operational specifications.
5.4.2 Fuel Management Subsystem Based on DOE guidelines, the hydrogen storage and related regulators are not included in this cost analysis. No external humidification is assumed to be required for the hydrogen loop. A step-down pressure regulator to feed hydrogen to the stack is part of the system.
20
Its cost has been estimated quite accurately based on similar devices currently in commercial use. A similar approach was taken for the high- and low-flow hydrogen ejectors. These recycle moist hydrogen back to the stack and provide some level of humidification to the fuel loop.
5.4.3 Thermal Management Subsystem The fuel cell system has both a high- and a low-temperature cooling loop. DTI used conventional fluid pumps for both, so costs estimates should be accurate. The greater risk here rests with the ability of these pumps to meet the overall reliability and operational requirements of a fuel cell system. If the costs were to double, for example, this could add a $1/ kWnet to the overall cost. DTI has assumed that radiators for FCVs will be similar to those used today in conventional vehicles. This has certainly not been the case to date, as additional radiators are required to cope with stack heat rejection at peak power and under other operational conditions. New technologies and alternative radiator designs with new materials may be required.
5.4.4 Water Management Subsystem DTI has assumed the use of a water spray humidifier for the air loop. This is a very low-technology, low-cost device. Given the overall importance of water management to total system performance and operational flexibility, such a relatively crude device will be unlikely to meet future requirements. As the level of sophistication increases, a corresponding increase in cost is also expected. Most research on air humidifier focuses on “tube and shell” type devices with expensive ionomer membranes materials such as Nafion, or the less mature, but potentially less expensive, plate-and-frame membrane-based humidifiers. The unique operating conditions to which these humidifiers will be exposed in a fuel cell system will likely increase the unit cost significantly beyond the $78.93 used in the DTI analysis.
5.4.5 System Controller and Sensors A fuel cell system is a complex array of fluid flows, mechanical elements, and electrical control elements. As in conventional vehicles, a robust overall control system will be essential to maximize performance and meet the reliability specifications. Projecting specifics about the design and operational challenges of controllers and hydrogen sensors for fuel cell systems is difficult, but the assumptions and costs estimated by DTI seem reasonable.
5.4.6 System Assembly and Testing In addition to the specific BOP components, DTI has accounted for the usual array of wiring, ducting, hoses, and piping that will be required. In aggregate, these are not insignificant costs, accounting for $10.74/kWnet.
21
DTI performed a high-level system assembly analysis that focused on the major elements. There are many parallels to be drawn from the classical automotive assembly systems, and a more detailed benchmarking here would be of great value. This is particularly of interest given that most OEMs already have some level of experience with manual assembly of fuel cell systems. DTI assumed a 10-min system functionality test, given that the stack has already undergone separate testing. At 500,000 units per year, the system will probably be sufficiently robust and sophisticated that it can be quickly tested by on-board controller interface to computer monitoring stations. It would be instructive to understand how the DTI estimate of $1.40/kWnet for system assembly and testing matches with similar costs for conventional ICE-based power trains, or for a hybrid electric power train such as the Prius, which is today being assembled in volumes close to 500,000 systems per year.
5.5 Cost Estimation Process Unlike more classical cost analyses by OEMs for conventional power train systems, DTI did not, at the request of DOE, include the usual 10% cost contingency to help account for inaccuracies. This seems reasonable at this stage of maturity, given the level of uncertainties associated with the overall system design and the lack of data on durability or reliability of the specified components. DTI performed a sensitivity analysis on the cost factors that have the greatest impact on the overall system cost should the assumed value be inaccurate. These analyses included component costs, performance characteristics such as power density and stack conditioning, plus labor rates. In combination, these factors provide for a huge margin of potential error in the total system cost estimation, ranging from as low as $72/kWnet to as high as $98/kWnet.
5.6 Findings and Areas for Improvement Given the complexity of the analysis, combined with the uncertainties and differing levels of maturity surrounding stack and BOP components, ultimate operating conditions, and the very limited data on component level or system level durability, the DTI methodology and findings are reasonable. The sensitivity weighed average cost of $76/kWnet as determined by DTI may be an underestimate based on the factors listed below. However, any corrections based on implementing the suggested improvements would still keep the cost range for the system below the maximum value defined in DTI’s sensitivity analysis. The critical influence of platinum pricing, platinum loading, and the implications for total system performance (power density) and durability have been well documented. All other areas of sensitivity to total system cost pale in significance when matched to these factors. In evaluating the methodology and specifics of the DTI cost analysis, the following areas have been identified as appropriate for additional levels of scrutiny:
22
• The level of data used to support a loading of 0.25 mg/cm2 is quite limited, especially in regard to the stack test operating conditions and how they map to the available inputs from a fuel cell system.
• The assumption that the various stack and BOP components assembled into the “virtual” total system, as defined by DTI, will work together to produce the specified power density.
• The membrane cost projection is at high risk, based on the assumption of a single supplier and the omission of what may be significant costs associated with ionomer production scale-up and business factors associated with maintaining margin in other high volume applications.
• The assumption of a completely vertical supply chain, beyond the provision of the membrane, should be challenged as a sensitivity element to overall costs.
• The impact to yield, quality, and inventory control of using hundreds of individual manufacturing units for MEA production merits further evaluation.
• Manufacturing processes and costs related to CCM production and MEA sealing. • The cost sensitivity associated with necessary activities related to R&D, product
development, and Non-Recurring Engineering. • Stack manifolding – more sophisticated components to manage fluid flows to and among
the stacks on the system. • Evaluation of cost implications for non-classical radiator designs. • Impact on reactant gas purity from a cost perspective. • The test station and infrastructure costs related to stack conditioning. • The assumptions and cost implications associated unit process yields, on-line process
quality control, and inventory management. • The component material costs, capital investments, and manufacturing costs associated
with the bipolar plate (including cost of critical design features and implications for manufacturing yield and functionality).
• Evaluation of a more sophisticated level of air humidification. • Potential requirement for humidity sensors for the stack. • Cost implication of thermal and electrical insulation (electromagnetic interference). • Benchmarking of system assembly costs to high-volume assembly of large, complex
engines.
23
6.0 TIAX Cost Analysis 6.1 Elements of Methodology
The TIAX cost analysis for the stack is based on the fuel cell system model developed by ANL, identified in Section 4, using properties of the 3M NSTF platinum alloy catalyst for anode and cathode. The NSTF catalysts are applied to a 3M, 30-µm membrane. The basis for using these materials is the total low loading of the catalyst (0.25 mg PGM/cm2) and the related high power density data (716 mW/cm2). This MEA has demonstrated more than 7,300 hours of durability in a single cell under load cycling. No durability data are reported for the 3M MEAs operating in a fuel cell stack. TIAX received guidance from the HFCIT Program, which included input from the FCTT, for fuel cell system design, materials, BOP components, and factors to be included or excluded from the cost analysis.12 The guidance resulted in several assumptions supported by the HFCIT Program and FCTT that are listed in Table 1.
The data for the MEA were supplemented by direct input from 3M that was used by TIAX to bolster the assumptions and estimates for the MEA manufacturing process. The direct information from 3M bestowed a level of assurance for the bottom-up analysis by TIAX. 6.2 Fuel Cell Stack Components and Costs 6.2.1 Membrane The bottom-up high-volume membrane cost established by TIAX is $15.70/m2, based on a cast dispersion production process and is equivalent to $340.85/kg manufactured membrane cost. The analysis anticipates 6 million m2 annual production for the membrane based on the 3M PSFA 30-µm design. There are no full-scale production facilities for the 3M ionomer or membrane. TIAX reports the membrane is fabricated at a pilot scale. TIAX assumed application of the DuPont process to make the 3M membrane, which may have some inherent risk because this membrane has a shorter side chain and as such will have different dissolution characteristics. The costs of the 3M ionomer and processing it into membranes are anticipated to be higher than the traditional Nafion materials. Industry discussions confirmed the higher cost risk associated with the short side chain membrane. TIAX assumed that the 3M ionomer raw material cost is the same as Nafion cost ($80/lb or $176/kg) in the baseline case verifying this risk. However, TIAX’s sensitivity analysis over the ionomer cost ranges from $44/kg to $220/kg and demonstrates the rather dynamic membrane cost ranges of ~$8/m2 to ~$18/m2 on an active area basis. From Figure 4 and the assumption of five membrane manufacturers, the cost of membrane would be $400/kg or ~$60/m2, which is considerably higher than the TIAX estimate. The transition from low rate membrane production (100 stacks per year) to high rate production for 500,000 80-kW PEM fuel cell systems will require a large capital investment. Unlike the competitive membranes, most of which have business in the chlor-alkali market, this may be a costly and higher risk investment for 3M. TIAX suggested capital cost for high rate production will not be a major contributor to membrane cost. Industry inputs suggested the transition from
24
low volume production to high volume production will be accomplished in small, gradual steps and that the cost of capital for gradual growth in membrane production will not be an important factor. On the other hand, the chemical industry rarely invests in gradual manufacturing equipment and invests in large-scale plants to optimize capital investment. Industries with established large-scale non-fuel cell membrane production facilities will, based on industry interviews, have a cost advantage. The advantages are not addressed in the 2008 TIAX analysis. Industry interviews identified that TIAX had not worked directly with membrane producers for the membrane cost analysis. Some industry inputs suggested $15.70/m2 was a low value, but TIAX did not appear to be off by an order of magnitude. The DuPont report15
referenced by TIAX suggested costs in the range of $25/m2 for a ~50µm thick membrane; a 67% increase in material which scales directly to the approximately $10/m2 higher cost in the DuPont report. The impact of the shorter side chain 3M polymer remains uncertain.
Industry interviews also identified alternative membrane materials that are reported to have high performance; durability and reliability were available at thicknesses less than 20 µm. Assuming the same scaling factors reported above for a single membrane manufacturer, the membrane cost would drop to $10/m2 the lower range of the TIAX sensitivity analysis. Overall the TIAX membrane cost analysis covers a broad enough base to properly represent the cost of membrane for a single large producer. 6.2.2 Catalyst The DOE Hydrogen Program Record12 defines the PGM content at 0.25 mg/cm2 with a 0.35 mg/kWgross PGM content. The PGM content permitted in terms of net power for the PEM system is 0.39 mg PGM/kWnet. The 3M MEA using platinum-cobalt-manganese alloy for the anode and cathode catalysts is the foundation for the TIAX cost analysis of the stack. TIAX anode catalyst loading is 0.083 mg PGM/cm2, which is higher than the nominal 0.05 mg PGM/cm2 of the 3M anode; the cathode catalyst loading is 0.167 mg/cm2. The use of cobalt or manganese at the anode could lead to oxidation of these materials at open circuit. Open circuit testing by 3M demonstrated a 28 mV gain at rated power; however they also report a 30% loss in electrochemical surface area with 10,000 cycles of 0.6V to 1.2V.using cyclic voltammetry13. Per DOE’s recommendation, TIAX assumed the price of platinum to be $1,100/troy ounce, based on its average price for the last five years. TIAX considers the most recent surge in platinum price in 2008 to more than $2,200/troy ounce to be an anomaly, which is consistent with feedback from industry. Industry stated that platinum availability was not anticipated to inhibit the introduction of automotive fuel cell systems. Based on industry input, more than 90% of the platinum ever processed is still available, and the primary product is only a small part of the platinum production and possible short-term supply perturbations may occur; however, growth in platinum production will likely offset short-term interruption. PGM producers already participate in the recycle industry and there is a network for collecting and reusing the PGM. The collection network may need to be expanded for future automotive applications and it appears to be better defined in Europe than in the United States. TIAX in a separate analysis16 concurs with industry input and stated that growth of the PEM automotive market could be constrained by primary supply capacity, but that platinum resources are sufficient to meet the PEM automotive market.
25
Industry does not anticipate a sudden uptick in platinum demand due to FCVs because at 0.25 mg/cm2 platinum at 500,000 stacks per year, the additional demand accounts for less than 10% of current global production. PEM fuel cell automotive entry is anticipated to be a gradual penetration into the market. The slow introduction of the hybrid vehicle into the world market is cited as an example; first introduced in Japan in 1997, the Prius was not introduced into the U.S. market until 2001. By 2008, hybrid sales had not reached the 500,000 level established by the FCTT and the HFCIT Program for the TIAX analysis.17,18
Industry forecasts no sudden demand for PGM because the introduction of the FCV is anticipated to follow the hybrid pattern and take up to two decades to reach 10% market share.
Although not part of the TIAX cost analysis under review, ownership of the PGM is a topic of high interest to several of the industry interviewees. The overall opinion from industry contacts for this study was that leasing beyond a two- to three-month period would be very costly and there is not a high incentive for industry to participate. TIAX properly reports the high proportion of cost the catalyst contributes to the electrode, MEA, stack, and system. The vacuum sputter coating of the catalyst onto an inert, non-conducting support material is a new manufacturing approach for fuel cell catalyst. Some industry inputs alluded to increased catalyst fabrication costs with the use of vacuum deposition methods. If an increased cost of manufacturing is associated with vacuum sputtering of the catalyst on the support whiskers, its contribution is small compared to the 90% of the electrode cost attributed to the PGM. The TIAX sensitivity analysis indicates that PGM material cost dominates the manufacturing cost. The non-conducting support whisker material requires that the manufacturing process produce a structure with continuous metal-to-metal (PGM-to-PGM) contact for the electrode layer to maintain electronic conductivity. This could be a challenge if PGM ripening or agglomeration becomes a significant failure mechanism, as has been observed in some designs. The PGM-to-PGM contact defines a radically new, very thin structure for the electrode. The high wet-ability of the PGM and the very thin electrode structure can lead to blockage of the reactants at the catalyst interface by water which would decrease cell performance. Modification of the electrode composition will solve this problem; however, the solution may require increased and unique manufacturing complexity. The analysis did not address this detail and it is not clear that the solution to this unique problem was accounted for in the TIAX technology-based bottom-up cost model. 6.2.3 Gas Diffusion Layer The TIAX cost analysis defines the GDL made from woven graphite fiber. This is an unusual choice because no OEM contacted by the Panel used woven graphite fiber GDLs. Industry interviews verified that the GDL manufacturers had little to no demand for such materials in automotive applications. TIAX reported the FCTT and the HFCIT Program requested the GDL woven graphite fiber be used in their cost analysis. Based on industry interviews, the cost of a fully treated GDL manufactured at production rates consistent with 500,000, 80-kWnet PEM systems per year would be ~$15/m2. The industry estimate is twice that of the TIAX cost projection. The difference in cost was not obvious to the industry representatives because the
26
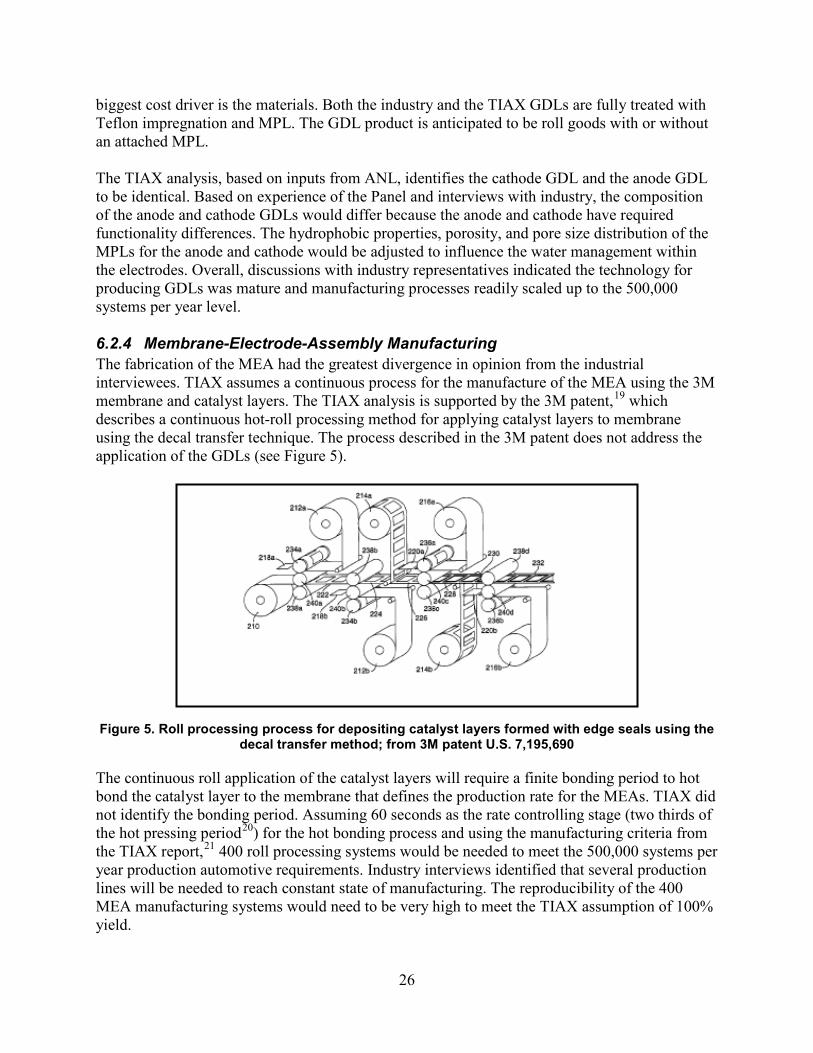
biggest cost driver is the materials. Both the industry and the TIAX GDLs are fully treated with Teflon impregnation and MPL. The GDL product is anticipated to be roll goods with or without an attached MPL. The TIAX analysis, based on inputs from ANL, identifies the cathode GDL and the anode GDL to be identical. Based on experience of the Panel and interviews with industry, the composition of the anode and cathode GDLs would differ because the anode and cathode have required functionality differences. The hydrophobic properties, porosity, and pore size distribution of the MPLs for the anode and cathode would be adjusted to influence the water management within the electrodes. Overall, discussions with industry representatives indicated the technology for producing GDLs was mature and manufacturing processes readily scaled up to the 500,000 systems per year level. 6.2.4 Membrane-Electrode-Assembly Manufacturing The fabrication of the MEA had the greatest divergence in opinion from the industrial interviewees. TIAX assumes a continuous process for the manufacture of the MEA using the 3M membrane and catalyst layers. The TIAX analysis is supported by the 3M patent,19
Figure 5. Roll processing process for depositing catalyst layers formed with edge seals using the decal transfer method; from 3M patent U.S. 7,195,690
which describes a continuous hot-roll processing method for applying catalyst layers to membrane using the decal transfer technique. The process described in the 3M patent does not address the application of the GDLs (see Figure 5).
The continuous roll application of the catalyst layers will require a finite bonding period to hot bond the catalyst layer to the membrane that defines the production rate for the MEAs. TIAX did not identify the bonding period. Assuming 60 seconds as the rate controlling stage (two thirds of the hot pressing period20) for the hot bonding process and using the manufacturing criteria from the TIAX report,21
400 roll processing systems would be needed to meet the 500,000 systems per year production automotive requirements. Industry interviews identified that several production lines will be needed to reach constant state of manufacturing. The reproducibility of the 400 MEA manufacturing systems would need to be very high to meet the TIAX assumption of 100% yield.
27
TIAX did not discuss fabricating multiple MEAs with a wide membrane, forming a continuous, edge-to-edge coating of catalyst, and subsequently applying wide GDLs before slitting the wide MEA into rolls ready for die cutting. The concept of an edge-to-edge coated membrane may have technical difficulties with corrosion and shorting of the catalyst layers. Although the wide membrane with edge-to-edge catalyst coating may provide the highest production rate, the durability will need to be demonstrated. Several manufacturers who are experienced in the production of thin film systems support the concept of continuous hot-roll processing for the manufacture of MEAs. They expressed a high level of confidence that the hot-roll application of the catalyst layer could be developed. Those who supported this approach agreed that the TIAX estimate for capital equipment was in “the right ballpark,” as were the labor estimates. The high cost of catalyst fixes the overall cost of the MEA. Some industry representatives do not support the hot-roll processing technology and consider a discrete hot-pressing step as the only feasible approach to MEA production. They addressed two issues:
• The poor mechanical strength of the membrane
• The requirement to accurately register the anode and cathode catalyst layers, i.e. alignment of the catalyst layers with an edge seal forming a “picture frame” around the bonded catalyst layers.
Some manufacturers report the catalyst extends to the edge of the MEA without detrimental effects on the durability of the MEA. This will require additional verification. The poor mechanical strength of PFSA membranes is well documented, and many manufacturers believe the hot-roll processing step may introduce too high a stress factor. The hot-roll application of the catalyst layer will be the rate-controlling process and will require large rolls or moving laminating surfaces to maintain the hot compression of the catalyst layer onto the membrane. These manufacturers suggest that the mechanical weakness inherent in PFSA does not permit hot-roll attachment of the catalyst layers to the membrane. Multiple roll processing stages will be needed to apply all the catalyst layers and GDLs to form the MEA. It was not clear whether one roll process fabrication system could do both electrodes and GDLs. If the GDL application requires an additional roll processing line, the number of roll processing lines must increase from 400 to 800 to meet 500,000 units per year production. Misalignment of the anode and cathode layers can lead to tearing of the friable membrane when a stack is placed under compressive load. MEA manufacturers suggested that in-line quality control, not included in the TIAX analysis, would be needed to ensure the catalyst layers align. Six components would need to be hot-roll bonded: anode catalyst layer, cathode catalyst layer, anode GDL, cathode GDL, anode edge seal, and cathode edge seal. This may be too complicated for a single roll processing line, and multiple roll processing lines will be needed. This would increase the capital investment. The TIAX analysis did not address the possible need for 800 to possibly 1,600 roll processing lines.
28
Some industry representatives proposed discrete step hot pressing as an alternative to continuous roll hot pressing. This semi-continuous process requires a bonding step of 60 to 90 seconds to attach the catalyst layers to the membrane. One approach involved depositing the catalyst layer onto the MPL of the GDL to form a gas diffusion electrode (GDE) with subsequent bonding of the membrane to the catalyst coated GDLs. The proponents of this method believe anode and cathode gas diffusion electrodes can be simultaneously bonded to the membrane to reduce the number of processing steps. In the view of these manufacturers, the discrete hot pressing manufacture of MEAs resolves the registration issues with the bonding of two catalyst layers. A manufacturing concern with the semi-continuous process is the application movement and handling of the friable, thin membrane. Some manufacturers suggested a semi-continuous process that involved stopping the delivery of the membrane from a roll. This would introduce stresses that would lead to tearing of the membrane. A primary concern is the large number of hot presses and the repeatability of the discrete process that would be necessary to fabricate the nearly 186 million MEAs for 500,000 vehicles, almost 800 MEAs per minute using the TIAX assumptions. The number of presses required to produce identical MEAs would exceed 1,100, assuming only one hot press operation per MEA and 90 seconds per hot pressing step. Quality control becomes an important factor with hundreds of thousands of components manufactured by multiple presses. The MEA manufacturers proposing semi-continuous processes with discrete hot pressing stages for the manufacture of MEAs state their approach will be more than able to fabricate and meet the cost objectives of MEAs for the automotive applications. The TIAX cost analysis assumes 100% yield for the fabrication of the MEAs without quality control measurements. Discussions with industrial manufacturers that use either the continuous or semi-continuous process did not validate the TIAX 100% yield assumption. They recognize that quality control is a major problem. Membrane and MEA production using traditional processes will have to change because the quality requirements will need to be greater than six sigma. Based on industry input, quality control would not be a major cost factor but could be as high as 1% to 2% of the present cost, which is equivalent to the labor cost identified by TIAX. Industry and the Panel do not support the TIAX 100% yield assumption. 6.2.5 Bipolar Plates The 2008 TIAX report assumes the bipolar plates are manufactured by GrafTech using expanded graphite foil. This approach is a carryover from the 2005 TIAX cost analysis.4 GrafTech reserved commenting on improvements to its manufacturing process ahead of submitting a detailed report to DOE at the end of February 2009. As such, these details were not available in time for this review. GrafTech has an ongoing DOE-sponsored R&D program. The GrafTech 2008 annual merit review reports the 2005 cost of the bipolar plates at $10/kW. TIAX estimated the 2008 cost at $2.70/kW. The reduction is associated with the increase in power density of the 2008 technology. The $/m2 cost of the bipolar plate projected by TIAX is the same for 2008 as in 2005; $18/m2. To achieve the production rates associated with 500,000 PEM automotive systems, multiple process lines will be needed to provide identical quality bipolar plates. More than 50% of the bipolar plate cost is attributed to the materials, capital cost represents 14% of the cost, and the balance is for labor, equipment, tooling, etc. For multiple production facilities, the capital equipment investment to produce 500,000 systems per year is more than $30 million.
29
TIAX has considered alternative methods for manufacturing bipolar plates, including the composite graphite bipolar plates prepared by compression molding. The physical and chemical properties for compression-molded composite graphite plates can fulfill the requirements of the bipolar plate. Multicavity molds are proposed as a mass production method, although multiple hot presses will still be needed to meet the production volume demand for 500,000 PEM systems per year. The capital cost requirements forecast by manufacturers are anticipated to be in the same range as the expanded graphite foil capital cost, which is, however, amenable to anticipated lower manufacturing costs afforded by continuous roller embossing. TIAX may benefit from revisiting the composite plate manufacturer and updating that cost analysis. An alternative TIAX did not discuss is metal plates. High rate manufacturing is a proposed benefit of metal plate manufacture using stamp embossing. A limitation may be the stability of the plate and poisoning of the PEM systems by metal ions from corrosion of the bipolar plate, which contaminates and reduces the functionality of the PEM membrane by increasing resistance and potentially reducing power output. The cost of the metal bipolar plates is forecast by some to be lower than composite graphite plates or expanded graphite foil plates. The low cost is not totally assured, because most developers anticipate the metal plate will require an inert surface to prevent the metal from corroding and to maintain high electronic conductivity to the GDL. To facilitate the combined fluid flow properties for the anode, cathode, and cooling system, multiple plates will need to be welded with assured sealing to prevent the reactant and cooling fluids from mixing; similar to the bonding anode and cathode plates together needed for composite carbon-based bipolar plates. The cost analysis may benefit from a comparison of metal plate cost, expanded graphite foil plate cost, and composite graphite plate cost. 6.2.6 Stack Assembly and Conditioning The TIAX cost analysis estimates the total stack cost by collecting all the subcomponent manufactured costs: MEA, bipolar plate, stack manifolds, stack compression load system, and endplates, along with fasteners and summing the cost of all these components together. To this the TIAX analysis assigns a stack assembly cost of $3/kW. Automation is addressed using robots to deliver components to stack assembly positions and a robot to assemble the stack. As the stack height increases, a motorized table repositions the stack to optimize the movement of the assembly robot. Assembly of a complete 80 kWnet stack is forecast at 77 minutes; this is assumed to include placing the stack under controlled compressive load. TIAX cost analysis forecast the production of 4,167 80-kWnet stacks per day using the operating parameters previously described. To meet the production volume consistent with 500,000 PEM fuel cell systems, 267 stack assembly stations will be needed. Sufficient information was not available in the TIAX analysis to calculate the capital investment per stack assembly station; however, TIAX did report that capital expenditures would control the cost for low-volume production, but at high-volume production the materials (primarily PGM) control the cost. The stack assembly uses passive, stationary placement pins as guides to align the stack components. TIAX forecasts no in-line quality control procedures. The lack of quality control functions for the stack assembly may be a problem for this procedure. Alignment of MEAs and bipolar plates is critical to prevent stress buildup in the stacks and fracture or tearing of the membrane. Post-stack assembly quality controls are included in the form of leak testing and
30
stack voltage measurements. These two tests fit in the category of go/no go testing. Reworks at this end stage of the overall process become very time consuming and costly. Conditioning of the fuel cell stack is not included in the TIAX cost analysis. The analysis may assume the technology is mature enough that conditioning is not required, but this approach is not validated by fuel cell manufacturers’ experience. Industry experts report conditioning of one to two hours for most stacks will likely be required. The conditioning cost includes labor, reactants, and capital equipment, and is almost 70% the cost of the membrane. The fuel cell stack conditioning would represent 2% of the total stack cost. 6.2.7 Vertical Integration of Stack Manufacture TIAX assumed vertical fuel cell stack manufacturing at the OEM facility with the objective of minimizing cost and reducing markup of fuel cell stack components. Many of the industry interviewees had a positive response to the concept of vertical integration. This was a change from the 2005 independent review22
results, where the industry agreed that no one company had—or could afford—all the technology to achieve vertical integration. Other input from industry suggested vertical integration will vary by OEM. Some OEMs have a culture that would be receptive to vertical integration; others have a manufacturing culture that depends heavily on the supply network, even for critical engine components. Whether the OEMs that depend heavily on the supply network would consider collocation was not determined.
Collocating facilities at an OEM site could improve the overall efficiency and would significantly reduce transportation costs. A collocated supplier network for the fuel cell stack components may not eliminate markup, but could provide a base for lower costs. A variation of the collocation concept would include licensing of the manufacturing technology to the OEM. Both approaches may appear to reduce the risk for the supplier; however, collocation may be at the full risk of the supplier and, in such cases, only the OEM would benefit from collocation. 6.2.8 Power Density The power density used for the stack in the 2008 TIAX cost analysis was increased to 716 mW/cm2 from the 2005 value of 600 mW/cm2. The increase is sufficient to decrease the PGM content of the stack by 19% compared to the 2005 data. Using the 2008 platinum cost, this yields an $8.50/kWgross savings for the automotive PEM power system. 6.2.9 Stack Cost Saving Based on Catalyst Alone The catalyst loading in 2008 TIAX cost analysis is 0.5 mg/cm2 less than the 2005 catalyst loading. Concurrently the 2008 cell area active area is 277 cm2, reduced from 323 cm2 in 2005. These changes, when integrated with the increase in power density of the stack, yield a total reduction in PGM of 81.6 g per system. Based on the gross power of the 2008 PEM system and $35.4/g PGM, the total saving is ~$33/kWnet from the reduction in catalyst loading and increase in power density. 6.3 Fuel Cell System Configuration and Balance of Plant Components
TIAX received guidance from the HFCIT program, along with input from ANL and FCTT, for fuel cell system design, BOP components, and factors to be included or excluded from the cost analysis. The guidance resulted in identification of the subsystems
31
for the BOP. The subsystems and components are identified in Table 2 and the ANL fuel cell system design is given in Figure 1. Tables 7 and 8 include a detailed list for DTI and TIAX of material selections, manufacturing processes, and key operational parameters. The water management system database was augmented with inputs from the membrane humidifier manufacturer PermaPure and the EWH manufacturer Emprise. The direct information from 3M and the manufacturers of water management systems bestowed a level of assurance to the bottom-up analysis by TIAX.
6.3.1 Air Management Subsystem The major components for the air management subsystem defined by ANL are the CEM and the motor controller. Honeywell developed the designs of these components and supplied specification data to ANL. TIAX received open literature reports from Honeywell based on Honeywell’s contracts with DOE. The bottom-up cost analysis approach of TIAX for the CEM was based on the proprietary DFMA software. The TIAX estimated cost of the CEM, including motor and controller, is $535/unit. TIAX expressed a confidence level of 50%–60% in this analysis. Industry indicated the CEM cost would be higher, possibly by a factor of 2, which is consistent with TIAX’s 50% confidence level. The cost target set by DOE is considered low by industry and a difficult target to meet given the operational and design constraints. ANL identified some potential technical difficulties for the CEM that could increase its cost. ANL reports that detailed discussions with Honeywell suggest that CEM targets will not be met and the parasitic power will be increased. TIAX identified parasitic power at 6.9 kW for the 80-kWnet stack. Industry experts identified the getting the rotation speed up and the bearing technology rotating at 100,000–120,000 rpm as significant cost barriers. TIAX used Caterpillar/Garrett electro-assist turbochargers for comparison and to develop costs for the internal structure of the CEM; however, the motor speeds of the turbochargers are much lower, which makes the motors less expensive than the CEM motor. The turbocharger is a close approximation for a commercial CEM, but it is not considered viable because of differences in performance requirements. The present cost of a Volkswagen replacement turbocharger part is more than $1,000.23
6.3.2 Fuel Management Subsystem The fuel management subsystem has a hydrogen blower as a major component and two ejectors (see Figure 1). TIAX estimated the cost of the hydrogen recirculation blower based on published information and patents on the Parker Hannifin Model 55 Univane™ rotary compressor. TIAX used the DFMA software to apply its bottom-up approach. The projected cost of the hydrogen recirculation blower is $193 per unit at a production rate of 500,000 units per year. Ejectors for hydrogen recirculation are an established technology; TIAX determined their cost with “experience-based estimates” and did not use the bottom-up approach. The cost of each ejector was $20. Total cost for the fuel management subsystem was $274 or $304 OEM cost with 15% markup. The cost per kWnet for the fuel management subsystem was $3.80. The Panel and industry interviewees accepted this cost as representative for 500,000 subsystems.
32
6.3.3 Thermal Management Subsystem The thermal management subsystem is founded on established technology and manufacturing methods. TIAX used its technology-based cost model to conduct a bottom-up cost analysis and established the OEM cost at $225, which includes the 15% markup. The cost per kWnet was $2.80. Industry representatives and the Panel accepted this cost as representative for manufacture at 500,000 subsystems. As in the case of the DTI analysis of the thermal management system, TIAX has assumed that radiators for FCVs will be similar to those used today in conventional vehicles. This has certainly not been the case to date, as additional radiators are required to cope with stack heat rejection at peak power and under other operational conditions. New technologies and alternative radiator designs with new materials may be required. 6.3.4 Water Management Subsystem The water management subsystem identified by TIAX is not considered representative of today’s technology or future PEM technology by the industry experts and the Panel. The major components of the water management subsystem are the EWH and the membrane hydrogen humidifier (MH). The major technical issue is with the EWH; based on industry interviews and FCTT, no fuel cell OEM uses the EWH to humidify the air. The EWH is introduced to the system via the ANL model and has the advantage that the air exiting the CEM (see Figure 1) does not need to be cooled before it enters the EWH. Replacing the EWH with a Nafion tube humidifier would require a precooler between the CEM and the humidifier. This is not a new issue and was resolved by DaimlerChrysler, which used an exhaust gas-cooled intercooler between the CEM and the membrane humidifier. The downside is that Nafion-based humidifiers are expensive. No other type of humidifier was identified by TIAX and only PermaPure was identified as a manufacturer. Nafion causes many problems, especially at temperatures of 90°C or higher. A PermaPure humidifier could cost as much as $10,000. The MH is identical to the membrane humidifier discussed as a replacement for the EWH. The MH has the same high cost issues. The TIAX cost analysis identified the water management subsystem cost at $260 or $3.30/kWnet. The EWH cost was $184; the membrane humidifier was $66. Replacement of the EWH with an air side membrane humidifier would lead to a cost reduction that might compensate for the addition of an intercooler. 6.3.5 System Assembly and Testing The TIAX analysis includes no conditioning and testing of the PEM system. It identifies assembly cost at $5.50/kWnet, which represents 10% of the TIAX baseline cost, but TIAX does not offer any detailed explanation of this cost. TIAX’s bottom-up cost tools are both identified as having assembly costing methods. TIAX’s presentation would benefit from a better discussion of the system assembly costs.
6.4 Cost Estimation Process
33
The bottom-up cost estimation processes used by TIAX are successful and valid for forecasting the cost of fuel cell components that have similar counterparts in today’s marketplace. The cost forecasts for the thermal and fuel management subsystems were well received by industry and the Panel. TIAX acknowledged that the bottom-up cost estimation processes, when applied to emerging technology for stack components and BOP subsystems, carry a much higher risk. The CEM cost forecast was considered low by industry, and TIAX’s own level of confidence was rated at 50% to 60%. The bottom-up analysis of the MEA manufacturing process did not provide a high level of visibility for the analysis approach or clearly identify the assumptions used by TIAX to estimate the manufacturing cost. The analysis omitted several factors that industry typically uses to determine the cost of an emerging technology:
• Conditioning of the stack • Nonrecurring engineering cost (including manufacturing R&D, personnel training, and
quality control procedures development), which could influence the cost of the PEM fuel cell system
• Scrap rates and rework costs. The assumptions of 100% yield for the MEA and bipolar plate should be reviewed for validity. 6.5 Findings and Areas for Improvement As expected, PGMs dominate the cost of the PEM fuel cell for automotive applications. The TIAX 2008 automotive cost analysis has two critical differentiating factors compared to the 2005 TIAX cost analysis, and are founded on the performance of the 3M catalyst in a single cell: 1) reducing the catalyst loading to 0.25 mg PGM/cm2, and 2) increasing the power density to 716 mW/cm2.
• When comparing the effect of the PGM reduction in the 2008 TIAX analysis to the 2005
TIAX data, the total platinum content of the automotive PEM fuel cell system is reduced by 81.6 g PGM. The reduction has a major impact on the projected cost of the 80-kW nominal automotive PEM fuel cell system and reduces the cost (using the 2008 $35.40/g PGM value) by $2,888 per system or $36.10/kWnet.
• The mean 2008 OEM cost from the TIAX Monte Carlo analysis is $73/kWnet; the 2005
OEM mean cost is $97/kW (the 2005 analysis assumes a mean PGM cost of $900 per troy ounce, a decrease of $24/kWnet). Other cost factors increased between 2005 and 2008, but the improvement in the mean cost can be entirely attributed to the reduction in catalyst brought about by the change to the 3M NSTF catalyst design and demonstrated performance of 716mW/cm2 at 0.25 mg PGM/cm2.
• The manufacture of MEAs was dramatically changed by the 3M catalyst design. Some
industry representatives suggested the very low catalyst loadings and different structure of the 3M catalyst required a change in manufacturing procedures. The continuous hot-roll application of catalyst layers to the membrane had mixed response from industry and
34
Panel representatives, several of whom consider continuous hot-roll decal transfer of the 3M catalyst to be a feasible manufacturing method. Others suggest that hot-roll processing will not achieve the high rates needed for the 500,000 units/year 80-kWnet PEM fuel cell automotive system. The discussion by TIAX of the MEA manufacturing process was not sufficient to answer the manufacturing questions and did not address the number of continuous hot-roll applications (hot pressing stages) that would be needed to fabricate the 3M-based MEA.
• Several manufacturers thought the 3M membrane cost was low. The Panel and industry
considered the cost of the short chain ionomer to be a concern. Input suggested that the capital expenditure for a facility to produce ionomer would be very high, and higher still if done in stages as the demand for FCVs increases.
• The EWH for air loop humidification is not supported by any industry representatives or
FCTT members. ANL should strongly consider the design change to a membrane humidifier for the water management on the air side.
• Some industry representatives challenged the cost of the CEM as being too low and
considered the 2015 DOE target for the CEM to be too difficult to meet.
35
7.0 Comparison of DTI and TIAX Analysis 7.1 Major Similarities in Technology and Analysis
7.1.1 Approach DTI and TIAX used production configurations for the system and components based on 2008 technology, to perform their analyses. DOE specified major parameters to project the automotive PEM fuel cell system cost (see Table 3). The contractors established their stack configurations with the additional constraint,24 consistent with HFCIT objectives, that system efficiency at rated power is 50% or greater. The 2008 HFCIT areal power density and catalyst loading values are formalized in DOE’s Record #8019, “Fuel Cell System Cost-2008.”12 These values were used by ANL personnel for their overall system analysis25
to determine the stack sizing, which in turn would affect materials cost for the MEA. TIAX used the ANL values obtained from 3M NSTF performance data as the basic design for determining MEA manufacturing cost; DTI performed two analyses using the lower performance values from a more conventional ePTFE-supported Nafion-based design with conventional style catalyst inks and the NSTF-based design as an alternate. DOE selected the TIAX basic design and the DTI alternate design as to evaluate the progress of the automotive PEM fuel cell system. However, DTI indicated that the costing for the NSTF-based design was much less detailed and preliminary and would be finalized in a subsequent study.
Table 3. Comparison of Specified Parameters
Parameter DTI TIAX
DOE/ANL Specified Units Value Value
Systems per year sys/yr 500,000 500,000
System rated power kWNet 80 80
Cell power density mW/cm2 715 716
Platinum loading mg/cm2 0.25 0.25
Platinum cost $/Troy Oz. 1100 1100
Universals Units Value Value
Electricity rate $/kWh 0.08 0.08
Gas rate $/kWh
Loaded labor rate skilled $/hr 45.00 45.00
Loaded labor rate unskilled $/hr - -
Floor space rate $/ft2 - 57.94 Both contractors are performing their cost analysis by using “representative components,” because the final system configuration and component designs have not been established. They use virtual designs, even though neither the system nor all the components have been built and tested as integrated subcomponents. Typically, before a system or components are costed, component, laboratory, or system test data are
36
available that demonstrate the critical performance parameters and assist in cost tradeoffs. This is not the case for many key elements of this study and, for the most part, only a virtual system is being costed. The argument in support of this approach is that although the specific component costing may be inaccurate, it is representative of the cost for the selected and tested components that will be used in the final system for commercial production. Both the DOE HFCIT and the FCTT have accepted this approach as being adequate, considering the limited availability of actual test data. The Panel believes this approach is valid but will result in a wider range for the system cost projections and a higher overall risk. Both contractors are also making use, albeit to a differing degree, of commercially available DFMA software to calculate materials and processing costs for the selected component design, where vendor quotes are not available. DTI has used detailed DFMA for approximately 10 major components; TIAX has used this approach for two major components. As long as the selected design is representative of the final design, the calculated cost values should be representative of the final cost. Both the DOE and the FCTT have accepted this approach as well, as there are no other alternatives. Use of the DFMA process cost knowledge base for general machining processes (drilling, turning, milling, grinding, stamping, welding, etc.) will help reduce the spread in manufacturing costs between the contractors.
7.2. Major Differences in Technology and Analysis
7.2.1 Approach Manufacturing volume and system sizing, as calculated by the contractors using the DOE/ANL specifications as input and their own design configurations and assumptions (as described in Sections 5 and 6), are shown in Table 4. Major differences are immediately apparent and are discussed below. Manufacturing volume and rate are based on the available labor hours each year; DTI has chosen 240 days with two, seven-hour shifts and 97.6% utilization, whereas TIAX has chosen 240 days at 20 hours per day with 100% utilization. The overall impact is that the equipment would be amortized earlier in the TIAX case, which would increase manufacturing costs slightly. Parasitic loss at rated power detail is compared at the maximum power operating point in Table 5. The difference in parasitic power of 3.3 kW for the DTI system results in a 3.8% increase in stack and system size that increases both stack and BOP component costs for a total of $2.88/kWnet. The ANL-based thermodynamic analysis used by TIAX should be more representative of an actual system design except for the use of the EWH, but the detail of the component analysis provided by DTI appears to have incorporated more of the pieces that may have been overlooked in the TIAX analysis. The major contribution to the difference is the CEM cost, which needs further scrutiny and would benefit from a relaxation of the cathode stoichiometry, while maintaining stack performance, as expected in more advanced systems. The parasitic power increase has a ripple effect throughout the system and directly affects the MEA active area or cell count and hence the total PGM content.
37
Table 4. Manufacturing Volume and Stack and System Sizing
Parameter DTI TIAX
Manufacturing Volume Units
Systems per hour sys/h 152.46 104
Cells per hour cells/h 56,716 45,625
Active area per hour m2/h 1,924 1,265
Stack and System Sizing Units
Rated power ambient temperature °C - -
Rated power ambient pressure atm - -
Rated power ambient relative humidity relative humidity - -
Rated power minimum vehicle speed (for cooling) mph - -
Parasitic loss at rated power kWe 10.23 6.93
Stack power at system rated power kWgross 90.23 86.93
Stack efficiency at system rated power % 55 54
System/stack voltage at rated power V 251.45 300.00
Stack amperage at rated power A 359 290
Volts per cell at rated power (beginning of life) V 0.676 0.685
Cells per system cells/sys 372 438
Watts per cell W 243 198
Cell active area cm2 339 277
Number of stacks per system stacks/sys 2 2
PGM (Platinum) mg 31527 30353
Table 5. Comparison of System Parasitic Power Losses
The two contractors determine system voltage and stack configuration differently. TIAX based its design on the system voltage requirement determined by the FCTT of 300 volts and an 85% active area; DTI has maintained the number of cells at 372 and uses an 80% active area. The net effect is shown in Table 4. The difference in PGM content of the stack is a direct consequence of the higher parasitic power of the DTI system. DTI and TIAX use different approaches to determine their baseline system configurations. DTI established its configuration as a “best estimate” from a composite of many manufacturers and an overall analysis of the necessary components to establish the defined automotive fuel cell system. Alternatively, TIAX uses a system configuration that was thermodynamically modeled by ANL using its internally developed system analysis codes denoted as General Computational Toolkit (GCTool) and Powertrain System Analysis Toolkit (PSAT). Both contractors use their selected configuration to develop a list of required components in conjunction with critical reactant flow rates, pressure levels, and sizing to be used in determining their manufactured cost. The BOP determined from the system configuration is a significant contributor to the overall system cost (approximately 50%) and requires equal attention to that given to the stack.
7.2.2 Fuel Cell System Configuration The DTI and TIAX configurations, presented in Figures 1 and 2, respectively, are compared below at the summary level. Both use two pressurized, liquid cooled stacks totaling 80 kWnet having a direct hydrogen supply with hydrogen recirculation and a pressurized air supply provided by a motor-driven compressor supplemented by an expander (CMEU). DTI selected a lobed positive displacement machine for the compressor and expander; TIAX uses rotary machines, a mixed-flow compressor, and a radial inflow turbine. The reactant supplies are humidified by different means: DTI uses water condensed from the cathode exhaust in a radiator to humidify the air by direct water injection; TIAX uses the cathode exhaust to humidify the air using an enthalpy wheel and the hydrogen by a membrane humidifier. DTI does not humidify the hydrogen fuel. The DTI diagram appears to be more complex, only because DTI included some second-level components (mass and pressure sensors, filters, bypass lines, etc.); TIAX chose not to show them. DTI developed a lengthier BOM with approximately 42 components compared to 25 for TIAX. This may be due to the system configuration differences or a more detailed BOM by DTI. The Panel expects that to be complete, the TIAX configuration would need an air flow sensor, at least one hydrogen sensor (2008 technology), and a more detailed coolant system with thermostat, possibly a filter/deionizer and reservoir. The DTI configuration would need a diverter valve upstream of its ejectors. Typically, the minor components would contribute at least 15% to the BOP cost and add at least 10% to the parasitic losses, which would require three to five more cells for the stacks. The BOM and the component designs developed from the system configuration form the basis for the detailed costing and the overall quality of the cost analysis.
7.2.3 Component Technology and Assumptions The major component and technology assumptions for materials design and manufacturing processes and the resulting material and processing costs are compared in Tables 6, 7 and 8.
39
Table 6. DTI Materials and Design, Manufacturing Processes, and Costs
System Assembly and Testing - - N/A - $431.94 $431.94
BOS – System Assembly Total - - N/A - - $710.23
BOP Total - - N/A - - $2,211.17 BOP Total per kWnet - - N/A - - $27.64
System Total - - N/A N/A N/A $4,563.69 System Total per kWnet - - N/A N/A N/A $57.05
Note: Information extracted from “TIAX 02” (Dated 3/10/09)
41
Table 8. Comparison of DTI/TIAX Costs in $ and $/kWnet
Delta $ (DTI-TIAX) Delta $/kWnet( DTI-TIAX)
Component Material Cost per System
Processing Cost per System
Total Material Cost per System
Processing Cost per System
Total
Membrane $43.47 $31.38 $74.85 $0.54 $0.39 $0.94 GDL $126.15 $32.15 $158.30 $1.58 $0.40 $1.98 Catalyst $90.22 ($47.74) $42.49 $1.13 ($0.60) $0.53 Frame/gaskets $235.47 $34.00 $269.46 $2.94 $0.42 $3.37 MEA fabrication ($31.26) ($35.37) ($66.63) ($0.39) ($0.44) ($0.83) Bipolar plates $187.50 $92.86 $280.36 $2.34 $1.16 $3.50 End plates $37.72 $0.03 $37.75 $0.47 $0.00 $0.47 Balance of stack - - ($134.51) - - ($1.68) Stacks Total - - $662.07 - - $8.28 Stacks Total per kWnet - - $8.27 - - CEM - - $353.93 - - $4.42 CEM power electronics - - ($88.46) - - ($1.11) Balance of air management - - $24.71 - - $0.31 Air Management Total - - $290.18 - - $3.63 Anode humidifier - - ($184.33) - - ($2.30) Cathode humidifier - - $12.49 - - $0.16 Balance of water management - - $185.34 - - $2.32 Water Management Total - - $13.50 - - $0.17 Hydrogen blower - - ($222.46) - - ($2.78) Proportional valve - - $269.05 - - $3.36 Hydrogen ejectors - - $45.20 - - $0.57 Balance of fuel management - - $62.02 - - $0.78 Fuel Management Total - - $153.81 - - $1.92 Radiator cost - - $85.32 - - $1.07 Coolant pump cost - - ($57.00) - - ($0.71) Balance of thermal management - - $79.30 - - $0.99 Thermal Management Total - - $107.62 - - $1.35 BOS - - $581.70 - - $7.27 System assembly and testing - - ($319.93) - - ($4.00) BOS – System Assembly Total - - $261.77 - - $3.27 BOP Total - - $826.88 - - $10.34 BOP Total per kWnet - - $10.34 - - System Total - - $1,488.95 - - $18.61 System Total per kWnet - - $18.61 - - - 7.2.3.1 Fuel Cell Stack Components and Costs The stack cost ranges from $29.42/kWnet for TIAX to $37.68/kWnet for DTI, or approximately 50% of their respective system totals. Stack design features common to both contractors include:
42
• One cooling plane per cell (In the case of the metal plate, the cooling channels are formed by the union of the anode and cathode plate, forming the bipolar plate with no additional cooling plates)
• Two stacks arranged so that they are electrically in series and manifolded in parallel. Although the stacks were sized with common areal power density and catalyst loadings, they are composed of different component materials and designs and used different manufacturing processes (see Tables 6 and 7). There are surprisingly large differences in the material cost per kWnet that are beyond that expected with DTI’s larger stack: GDL (DTI-$271, TIAX-$145), MEA frame/gasket (DTI-$329, TIAX-$94) (Viton used by TIAX is expensive and more difficult to process than HC) and plate material (DTI-$311, TIAX-$124) (vendors predict that the graphitic foil plate material used by TIAX will be very low cost). Large differences in plate processing costs (DTI-$531, TIAX-$424), as well as stack assembly cost (DTI-$107, TIAX-$242) are addressed below. The cost deltas are compared on a $ and a $/kWnet basis in Table 8.
• The GDL carbon paper material chosen by DTI is normally less expensive than the carbon cloth used by TIAX, so the large cost difference is unexpected and unsupported by conventional wisdom. HFCIT/FCTT input to TIAX was to use woven material for unknown reasons that may result from unpublished information.
• DTI switched to the Henkel HC material, which has lower cost per unit volume than the Viton material used by TIAX. DTI also updated its design for metal plates and found that a larger volume of gasket material was needed, which increased the cost. The total MEA gasket cost of $5.83/kWnet is nearly as high as the plate of $6.23/kWnet. Although the DTI plate has 80% active area compared to TIAX’s 85% and the DTI stack is 3.8% larger, those effects are not large enough to account for the difference. If the increased seal volume (cross-section × seal length) is due to the metal plate design, that design should be revisited.
• Plate materials and design differ significantly between the two contractors; DTI uses stamped 316L SS sheet with corrosion protection by the Treadstone process, whereas TIAX uses expanded graphite foil, resin impregnated, embossed to the desired shape. If the Treadstone process is fully verified and becomes economically viable, the auto industry may prefer the SS sheet just because there is near zero processing waste. The lower cost plates used by TIAX may result in a higher cost for assembly as bipolar plates.
• Stack assembly is more costly for the TIAX design, perhaps because of the plate material or the overall design configuration. It could also be more expensive as a result of the unsophisticated pick-and-place stack assembly technique, which requires a multitude of assembly machines that would be a constant source of poor quality without frequent maintenance.
7.2.3.2 Balance of Plant Components and Costs The BOP cost ranges from $27.64/kWnet for TIAX to $37.98/kWnet for DTI, or approximately 50% of the total. The BOP is composed of five major subsystems: air management, fuel management, water management and humidification, thermal management, and system assembly and control. Each subsystem is composed of multiple subcomponents; the two contractors use different combinations of these. The differences between each subsystem are highlighted below.
• The air management subsystem is composed of the air supply and control components, which contribute 32% to 33% of the total BOP cost. The contractors use very different components in their selected systems: DTI chose positive displacement machines and
43
TIAX uses centrifugal machines. Unfortunately, no low-cost commercial device is produced in high volumes and operates in the pressure/flow regime necessary for the current automotive PEM systems. The specifications are difficult because a pressure ratio of 2.3 to 2.5 with a turndown ratio up to about 20/1 is required. Thus, components with limited availability of design and performance data need to be costed. The positive displacement machines of a lobe or vane type require tight tolerances or wear surfaces, or both, and are limited to low velocities, which then require a larger machine. The efficiency of the centrifugal machines is limited by tip clearance; they operate at very high rpm to attain the required specific speed. They also generally require variable nozzles or guide vanes to meet performance requirements and maintain reasonable efficiency over the operating range. Further, they generally need oil-free operation and durable bearing technology (traditional foil-bearing technology must cope with variable rpm and high turndown). Surprisingly, the positive displacement approach at approximately $1000 is $300 more expensive than the centrifugal approach with variable guide vanes. However, industry input on cost varied from $500 to $1000 depending on type and requirements. If the pressure ratio and turndown remain where they are for the final commercial designs (if stacks cannot operate at lower pressure and higher temperature), further work is needed on the design and costing of the air supply and control components. If the stack designs are improved so that the operating conditions become less demanding (or the problems ameliorated by heavy hybridization with energy storage devices), a much simpler centrifugal solution would become available and the expander function would not be required. The expander is typically one fourth to one third of the total air delivery system cost.
• The fuel management subsystem is composed of the hydrogen storage container and high-pressure regulator (neither of which were intended to be included in these fuel cell system analyses), a low-pressure regulator or proportional flow control valve, either two ejectors or an ejector and hydrogen pump to recirculate hydrogen, and a purge valve to remove nitrogen and non-condensables. The total cost for these components is 14% to 15% of the total BOP cost. Because ejectors typically operate in a narrow range, at least two must be used in conjunction with a diverter valve (not shown in the DTI system) to cover the full operating range of the fuel cell system. The TIAX system uses a hydrogen pump instead of a second ejector to cover the low hydrogen flow range. Although this is a more expensive approach, it provides greater control than the passive ejector and would lead to higher efficiency at low power levels. Both systems use a purge valve, but the TIAX system mixes the purge gas with the exhaust. The more complete and more realistic TIAX fuel management system shows the advantage of having a full thermodynamic system analysis as the basis for the BOP design. Unexpectedly, the simpler DTI system with an expensive proportional valve costs approximately $150 more than the more sophisticated TIAX system with a hydrogen pump. The Panel expects that the proportional valve should cost significantly less than a motor-driven pump.
• The water management (humidification) subsystems chosen by the contractors are completely different. DTI humidifies the cathode air with a direct water injection system that is supplied from a condenser in the exhaust stream. TIAX humidifies the cathode air
44
with a cordierite-based EWH, and the hydrogen with a tubular Nafion® bundle-based MH using the cathode exhaust stream as the water source. DTI’s direct water injection system, which can be quite economical, requires tight control over thermal gradients and has difficulty operating transiently over a wide power range. Besides their cost, the EWH and MH have mechanical and chemical stability problems: the EWH has been plagued by seal and wear problems and the MH cannot operate at nominal FC system temperatures and generally requires an exhaust cooler. These components are satisfactory for costing only with the understanding that they are only representative of the final configuration. The contractors calculated a total water management subsystem cost that is 9% to 12% of the total BOP cost and within $10 of each other. In the Panel’s view, both costs need further study.
• The contractors chose the same conventional thermal management subsystem configuration, which consists of a radiator, water pump, and controls. The interesting result is that although the subsystem cost was 10% to 11% of the total BOP cost, there was about a $100 difference in the costs. Further, in the DTI costing, the radiator was $150 and the pump was $63; in the TIAX costing, the radiator was $65 and the pump was $120. In the Panel’s view this subsystem cost analysis has room for improvement.
• The BOS and System Assembly cost element indicated in Tables 6, 7 and 8 consists of the remaining parts necessary for BOP operation, including the overall system control and the assembly and test of the subsystems. This cost amounts to 32% to 33% of the BOP cost with DTI at $972 and TIAX at $710, nearly a $260 difference. The DTI BOP appears to have greater detail and includes more of the realistically necessary items.
7.2.4 Component Manufacturing Costs • The MEA and stack manufacturing costs are the most difficult to project because they
have the fewest data on which to base an estimate and there are so many alternate approaches. In general, both contractors use roll-to-roll processes and assume process times based on discrete manufacturing techniques. DTI used DFMA analysis for major stack components, while TIAX used their own internally developed Technology-Based Cost Model. The MEA and stack manufacturing costs evaluated by DTI and TIAX were covered in detail in Sections 5 and 6, respectively.
When directly compared in Table 8, the total processing costs for the DTI composite membrane (ePTFE supported Nafion ionomer) and conventional catalyst ink-based MEA (membrane, catalyst ink, frame, and fabrication) is $0.21/kWnet, which is less expensive than that for the TIAX analysis of the 3M NSTF-based MEA. If the ePTFE substrate had been included in the TIAX analysis, the difference would have been even larger. The performance data used by ANL for their analysis were obtained by 3M with an ePTFE composite membrane.13 When the material costs are compared for un-gasketed/framed MEA, the DTI (Nafion-based) cost is $1.28/kWnet more than that for TIAX. When processing costs are added, the DTI cost difference shrinks to only $0.63/kWnet. The cost impact of the 3.8% larger stack required by DTI alone has added $1.43/kWnet to the cost of the DTI-configured MEA. The TIAX-costed configuration will increase further when the material and processing costs for the ePTFE are added to the TIAX cost.
45
The bottom line is that there are not significant differences in the MEA cost between the two contractors, even though the assumed MEA configuration is markedly different, which speaks to the dominant effect of materials costs.
• The manufacturing cost for the BOP components was calculated using one of three techniques; establishing costs based on supplier quotes, using internal experience based techniques (i.e., TIAX’s Technology-Based Cost Model) and the DFMA technique used in most of the auto industry and other high volume manufacturing industries. Both contractors used the DFMA costing approach as indicated in Tables 6 and 7 to attain the least subjective results for their major electromechanical components. TIAX used DFMA in a detailed manner for the hydrogen recirculation blower and the CMEU; DTI used it in a detailed manner for the CMEU, air humidifier, belly pan, and wiring harness. DFMA is certainly the preferred approach and lends credibility to the results.
7.2.5 Sensitivity and Monte Carlo Analyses
• Each contractor performed sensitivity analyses, and both concluded that power density, platinum loading, and platinum cost are by far the most dominant parameters for the stack and for the system as a whole. TIAX also provided a sensitivity analysis for the BOP that indicated the CEM component was the dominant factor in the BOP. Both sets of results depend heavily on the subjective decisions for the maximum and minimum of the selected parameters.
• TIAX performed a Monte Carlo Analysis that projected a mean system cost of $73/kWnet. It would be beneficial for DTI to perform a similar analysis.
7.3. Findings • The constraints and conditions imposed by DOE for performing the cost study are
reasonable and appropriate.
• The overall approach for determining the stack and BOP manufacturing cost results is adequate, considering the limited availability of published component and system data.
• The stack cost ranges from $29.41/kWnet TIAX to $37.68/kWnet for DTI, or approximately 48% to 52% of the total cost, respectively.
• The BOP cost ranges from $27.64/kWnet for TIAX to $37.98/kWnet for DTI or approximately 52% to 48% of the total, respectively.
• A thermodynamically correct system configuration by DTI would improve its ability to select and size components, which would influence the overall cost analysis.
• TIAX component cost results would benefit from greater use of DFMA.
• Both contractors would improve their results by securing additional input from suppliers.
• The combined results indicate there is substantial room for improvement, as evidenced by results indicating that components with the same function (e.g., MEA sealing) can have a factor of 2 difference in calculated cost.
• TIAX analysis would benefit from the development of a more detailed BOM for the system to identify all its required components and capture its true cost.
• The BOP costs are less solid than those for the stack and reflect the wide range of possibilities for the system configuration and its cost elements
46
• Because MEA, GDL, plates, and other stack components are made in quantities of multiple hundreds for each system, and because the BOP components are made in ones for each system and the capital cost per unit of production is higher, a greater emphasis on developing a high-volume supply base for BOP component manufacture is needed.
47
8.0 Additional Observations Given the relative immaturity of the overall fuel cell system and the significant remaining gaps in actual data on final materials, design, and operational characteristics, there is real value in having the cost analysis performed by two independent contractors. This is especially true when each contractor takes a different approach based on the breadth of available information and risks associated with the lack of data on real systems. TIAX leveraged the work of ANL in stack and system components and design, based on a self-consistent thermodynamic model. DTI chose to configure the stack and system from industry input and its experience base. TIAX mostly used proprietary techniques in its bottom-up cost analyses for major components; DTI mostly used the more standard DFMA approach. Both approaches have strengths and some areas where improvements and modifications could lower the risk calculation of system costs. These suggested improvements are discussed in Section 9. The Panel was impressed overall with the thoroughness and level of detail the contractors presented in their cost analyses. This is especially relevant given the large number of variables and unknowns in the components and design of a fuel cell system that could be cost-effectively manufactured at 500,000 systems per year for use in a commercial FCV.
48
9.0 Recommendations Through a combination of feedback and interactions with TIAX, DTI, DOE, the FCTT, and a large and varied collection of external experts, the Panel used its significant industry experience to make the following recommendations. For ease of comprehension, the recommendations are segmented by major subsystem, manufacturing process, assembly, and testing, and general comments.
9.1 Fuel Cell Stack and Stack Assembly In both cost analyses, the stack comprised approximately 50% of the overall cost of the system. Not surprisingly, approximately 50% of this cost was attributed to the cost of the stack electrode structure, which today is dominated by the commodity pricing associated with platinum metal. The following areas for improvement were identified collectively from the analysis of both cost studies:
• The catalyst loading reduction, combined with the stated increase in power density, accounts for all the cost reduction achieved since the 2005 TIAX study. This reinforces the dominant effects on costs of catalyst loading and power density, and raises an interesting issue as to how further significant cost reductions will be achieved.
• The experimental evidence used to support a loading of 0.25 mg/cm2 and the resultant stack power density is quite limited, especially as they relate to the stack test operating conditions and how they in turn map to the available inputs from a fuel cell system such as:
o Level of humidification o Reactant gas stoichiometry and pressure o Gas purity.
• The assumption that the various stack components, often analyzed as independent units, will interface effectively to produce the specified power density is a risk in the absence of specific test data.
• The membrane cost projection is at high risk based on the assumption of a single supplier and the omission of what may be significant costs associated with ionomer production scale-up and business factors associated with maintaining margin in other high-volume applications.
• The likely higher cost of short chain-based PFSA ionomers does not appear to be reflected in the analysis.
• Fluid manifolds for the stacks will likely require more sophisticated and expensive components than are currently being analyzed.
• The assumptions and cost implications associated with unit process yields, on-line process quality control, and inventory management are not included in the cost analysis.
• The component materials cost, capital investments, and manufacturing costs associated with the bipolar plate (including cost of critical design features and implications to manufacturing yield and functionality) require further evaluation.
• Given the percentage cost attributed to the GDL, this should be an area of further evaluation for cost reduction, especially in the case of woven GDL materials,
• There is a wide disparity in the MEA frame/gasket and plate costs between the vendors that requires further study of the design, materials, and manufacturing processes.
49
9.2 Fuel Cell System and Balance of Plant Components • Both contractors, especially TIAX, need to establish and cost a more complete BOM. • Given the challenging issue of heat rejection at peak power, the cost implications for non-
classical radiator materials and designs would benefit from evaluation. • DTI’s use of a thermodynamically correct model for the system would enhance
confidence in its analyses. • The contractors should adopt a common, industry-accepted methodology for component
cost analysis such as DMFA for more consistent future comparisons. • Further work on air humidification components and integration into the overall system is
required for anode and cathode loops. This functionality is a critical contributor to both performance and durability.
• The EWH is not supported as a viable commercial product for the fuel cell automotive application.
• The cost analysis for the CEM is believed to be too low and warrants more detailed validation work with prospective suppliers. However, requirements for the reactant supply and control systems are in transition and depend on the identification of the stack input/output constraints.
9.3 Manufacturing Process, Assembly, and Testing • Lack of detail and related data on the specifics of high-volume MEA manufacturing for
the 3M NSTF technology highlights a particular risk in these cost numbers. • The impact to yield, quality, and inventory control of using hundreds of individual
manufacturing units for MEA production and MEA sealing warrants further evaluation. • The link between MEA design and the evaluated manufacturing processes, especially
where the design implies the 3M NSTF technology, deserves a more detailed review. • The assumption that a CCM with the low catalyst loading assumed in this work can be
manufactured using a continuous vertical dual slot die is likely flawed. • The use of economy of scale assumptions, based on what appears to be low estimates for
low-volume production, poses a risk when applied to the estimation of higher volume production. These values are not consistent with present costs for PEM systems used in pre-automotive applications such as forklift trucks and emergency backup power.
• The test station and infrastructure costs related to stack conditioning require a more detailed analysis.
• The assumptions and cost implications associated with unit process yields, on-line process quality control, and inventory management need to be estimated more effectively. This is especially true for processing steps that are assumed to require hundreds of “identical” pieces of manufacturing equipment to achieve the required output.
• Specific benchmarking of system assembly costs to high-volume assembly of large, complex engines would add value to the overall cost analysis.
9.4 General Comments • The cost impact of component, subsystem, and total system durability is an essential
requirement as the overall design matures. • More in-depth consultation by the contractors with prospective component suppliers
would further reduce risks in cost estimation processes and potentially enhance confidence in component compatibility across the system.
50
• There are incidences when the same or a similar component such as the MEA frame/gasket has produced wildly different cost estimations. The contractors should work together to resolve these differences.
• An evaluation of major component wear out and the related impact to system power degradation and cost should be considered as the system design matures.
• The development and clear description of a detailed BOM for the system would help build confidence in the cost estimation processes.
• The assumption of an almost completely vertical supply chain, beyond the provision of the membrane, or potentially the MEA, should be challenged as a sensitivity element in the overall costs.
• The cost sensitivity associated with required activities related to manufacturing R&D, product development, and nonrecurring engineering and their impact on manufactured cost of components is a neglected area of analysis.
• A potential requirement for humidity sensors should be evaluated as a means of enhancing performance and as an indicator of system malfunction.
• Cost implications of thermal and electrical insulation (to avoid electromagnetic interferences) should be evaluated.
• The cost target DOE assigned to the CEM would benefit from further analysis, taking into account comparable technologies used in products today and potential supplier inputs.
51
10.0 Conclusions Overall, the Panel believes that the constraints and conditions DOE HFCIT and the FCTT provided to the contractors are reasonable given the maturity of the technology. However, operational factors and durability issues need to begin to influence materials and component selection as well as the overall cost analysis methodology. Given the relative lack of maturity in materials and components for a commercially viable fuel cell system, and hence the limited availability of data, each contractor has performed a meaningful and representative evaluation of the potential cost of an 80-kWnet automotive fuel cell system at 500,000 units per year. These estimates are necessary for DOE to gauge progress toward meeting its targets and to determine future DOE-sponsored research efforts. Future studies should provide greater insights into component compatibility across the whole system and enable DOE to assign a risk factor to the likely functionality of the cost-estimated assembly. The demonstration of cost reduction provides confidence in the progress of fuel cell technology to meet the commercial needs of automotive applications, but the detailed breakdown of the major costs also identifies areas of focus for future R&D. With this in mind, the Panel believes that additional directed efforts which foster the maturation of the system configuration and cost reduction of BOP components will be advantageous to the overall program objectives. Each contractor delivered a cost estimate for the total systems that was within the sensitivity analysis of each other’s evaluations. The Panel believes that a range of $60/kWnet to 80/kWnet is a valid estimate of the potential manufactured cost for an 80-kWnet fuel cell system, based on 2008 technology, extrapolated to a volume of 500,000 systems per year.
52
11.0 References
1. Sinha, J.; Lasher, S.; Yang, Y.; Kopf, P. 2008. “Direct Hydrogen PEMFC Manufacturing Cost Estimation for Automotive Applications.” Presented to Independent Peer Review Panel by TIAX LLC.
2. James, B.; Kalinowski, J. 2008. “Mass Production Cost Estimation of Direct H2 PEM Fuel Cell Systems for Automotive Applications.” Status Presentation for Independent Review of the 2008 Cost Estimates, Directed Technologies Inc.
3. James, B.; Kalinowski, J. 2009 Personal communication regarding preliminary 2009 cost estimation results.
4. Carlson, E.J.; Kopf, P.; Sinha, J.; Sriramulu, S.; Yang, Y. 2005. Cost Analysis of PEM Fuel Cell Systems for Transportation – September 30, 2005. NREL/SR-560-39104.
5. James, B.; Kalinowski, J. 2008. “Mass Production Cost Estimation for Direct H2 PEM Fuel Cell Systems for Automotive Applications: 2007 Update, February 29, 2008 Final Version.” Contract No. GS-10F-0099J to the U.S. Department of Energy’s Energy Efficiency and Renewable Energy Office Hydrogen, Fuel Cells & Infrastructure Technologies Program.
6. Sinha, J.; Lasher, S.; Yang, Y.; Kopf, P. 2008. “Direct Hydrogen PEMFC Manufacturing Cost Estimation for Automotive Applications.” Presented to Independent Peer Review Panel by TIAX LLC.
7. Sinha, J.; Lasher, S.; Yang, Y.; Kopf, P. 2008. “Direct Hydrogen PEMFC Manufacturing Cost Estimation for Automotive Applications.” 2008 DOE Hydrogen Program Review, Project ID # FC8.
8. Carlson, E.J.; Kopf, P.; Sinha, J.; Sriramulu, S.; Yang, Y. 2005. Cost Analysis of PEM Fuel Cell Systems for Transportation – September 30, 2005. NREL/SR-560-39104.
9. DTI Presentation to Panel December 2008.
10. Mass Production Cost Estimation for Direct H2 PEM Fuel Cell Systems for Automotive Applications: 2007 Update.
11. DTI AMR 2008.
12. Garland, N.; Marcinkoski, J. 2008. DOE Hydrogen Program Record, Record #L 8019.
13. Debe, M. 2008. “Advanced Cathode Catalysts and Supports for PEM Fuel Cells.” Presented at the 2008 DOE Hydrogen Program Review, 3M Company.
14. James, B.; Kalinowski, J. 2008. “Mass Production Cost Estimation for Direct H2 PEM Fuel Cell Systems for Automotive Applications: 2007 Update, February 29, 2008 Final Version.” Contract No. GS-10F-0099J to the U.S. Department of Energy’s Energy Efficiency and Renewable Energy Office Hydrogen, Fuel Cells & Infrastructure Technologies Program (Figure 35).
15. Curtin, D. E.; Watkins, M.A. 2002. “High Volume, Low Cost Manufacturing Process for Nafion® Membranes.” DuPont Fuel Cells, E.I. du Pont de Nemours and Company, 2002 Fuel Cell Seminar, Palm Springs, California, November 2002.
53
16. Kromer, M.; Rhodes, T.; Guernsey, M. 2008. “Update on Platinum Availability and Assessment of Platinum Leasing Strategies for Fuel Cell Vehicles.” Presented at the 2008 DOE Merit Review Project ID# AN12.
17. Hybrid Cars. 2009. J.D. Power Sees Three-Fold Growth for Hybrids by 2015. www.hybridcars.com/news/jd-power-forecasts-three-fold-growth-hybrids-and-diesels.html. Last accessed February 22, 2009.
18. SPEEDtv.com. 2008. AUTOS: Hybrid sales down in 2008. www.speedtv.com/article_print_view/928971. Last accessed February 22, 2009.
19. U.S. Patent No. 7,195,690.
20. Wheeler, D.; Sverdrup, G. 2008. 2007 Status of Manufacturing: Polymer Electrolyte Membrane (PEM) Fuel Cells. Prepared for the U.S. Department of Energy by the National Renewable Energy Laboratory. NREL/TP-560-41655.
21. 240 work days per year, 20 hours per work day: Reference 3.
22. Wheeler, D.; Chow, C.; Watkins, D.; Farris, P. 2006. Fuel Cell System for Transportation – 2005 Cost Estimate; Independent Review – October 2006. National Renewable Energy Laboratory, NREL/BK-150-40160.
23. Personal communication with parts department, Midwestern Auto Group, Dublin, OH.
24. Hydrogen, Fuel Cells & Infrastructure Technologies Program. 2007. Multi Year Research, Development and Demonstration Plan. EERC, DOE.
25. Ahluwalia, R. et al. 2008. “Fuel Cell System Analysis.” Presented at the 2008 DOE Merit Review, Project ID# fc6.
The National Renewable Energy Laboratory identified and contracted with three fuel cell industry experts who have combined experience of more than 90 years in R&D and manufacturing and more than 60 years specifically in fuel cells.
Dr. William Ernst, sole proprietor of EnerSysCon, specializes in fuel cell technology and provides management and technical consulting services to the energy conversion industry. One of the founders of Plug Power in 1997, he held the position of Vice President and Chief Scientist during his tenure. Dr. Ernst was responsible for proton exchange membrane (PEM) fuel cell technology assessment and advanced development, as well as technical initiatives within the government sector. Most recently, he investigated the applicability of solid oxide fuel cell technology to various continuous power applications. Earlier, Dr. Ernst was business area manager of the Technology Division at Mechanical Technology, Inc. (MTI), where he was the architect of the PEM fuel cell program and was responsible for technical management and development of the PEM fuel cell, Stirling machines and other businesses.
Dr. Charles Stone, sole proprietor of EON Consultants Ltd, specializes in fuel cell technologies and provides strategic business and technical consulting services in various fields of green energy. Dr. Stone began his career with Ballard Power Systems in 1990 as a research scientist after completing his Ph.D. at the University of British Columbia. He took on increasingly senior roles at Ballard, becoming vice-president of research & development in 2002. In this role, Dr. Stone had overall responsibility for fuel cell stack technology development, in addition to executive responsibility for intellectual property. During his tenure at Ballard, he developed significant expertise in establishing and managing key strategic supplier and end user partner relationships. Dr. Stone left Ballard in March 2007 to start his own consulting firm in the area of green energy. He has advised various government and private entities on technology and product development strategy, supplier and end user development activities, as well as technology and product portfolio management. Mr. Douglas Wheeler, sole proprietor of DJW TECHNOLOGY, LLC, provides complete services in the areas of manufacturing, cost analysis and market analysis for fuel cell systems, hydrogen production technology, and hydrogen purification technology. Mr. Wheeler was manager of technology and government contracts at UTC Fuel Cells (now UTC Power) for 18 years. At UTC Fuel Cells, he managed the Advanced Technology team during UTC Fuel Cells’ transition from phosphoric acid fuel cells to PEM fuel cells. DJW TECHNOLOGY’s expertise in Proton Exchange Membrane fuel cells, Phosphoric acid fuel cells and reforming of hydrocarbons to fuel cell grade hydrogen provides the basis for contracts with the U.S. Department of Energy through the National Renewable Energy Laboratory, the U.S. Department of Defense, the University of Hawaii, and private industry. Research and development programs support the Office of Naval Research and the Naval Research Laboratory. DJW TECHNOLOGY’s technical expertise in stationary, portable, and transportation fuel cells is complemented by expertise in renewable energy and energy efficiency. Management experience and communications skills allow DJW TECHNOLOGY to provide a full range of services
55
Appendix B
Interviews for Independent Review of DTI and TIAX Cost Analysis
Companies • Directed Technologies, Inc (DTI) • TIAX, LLC • 3M Company • Arkema Group • Asahi Kasei Chemical Group • Ballard Material Products • Former Ballard Power Systems Senior Staff Member • BASF • Bosch • Dana Corporation/Victor Reinz • DuPont E I DE NEMOURS & CO, DuPont Fuel Cells • E4tech • Honeywell International Inc. • Johnson Matthey • Plug Power Inc. • Perma Pure • Rensselaer Polytechnic Institute • SGL Carbon Group • Treadstone • Vairex Corp • W. L. Gore & Associates
Organizations • Automotive Fuel Cell Cooperation Corp (AFCC) • FreedomCar and Fuel Partnership Fuel Cell Technical Team (FCTT) • Hydrogen Fuel Cells and Infrastructure Technologies (HFCIT) Team
National Laboratories • Argonne National Laboratory (ANL) • National Renewable Energy Laboratory (NREL)