26 AERO QUARTERLY QTR_02 | 07 Fuel Conservation Strategies: Cost Index Explained by Bill Roberson, Senior Safety Pilot, Flight Operations This article is the first in a series exploring fuel conservation strategies. cost inDex DefineD The CI is the ratio of the time-related cost of an airplane operation and the cost of fuel. The value of the CI reflects the relative effects of fuel cost on overall trip cost as compared to time-related direct operating costs. In equation form: CI = Time cost ~ $/hr Fuel cost ~ cents/lb The range of allowable cost indices is shown in Figure 1. The flight crew enters the company- calculated CI into the control display unit (CDU) of the FMC. The FMC then uses this number and other performance parameters to calculate econ- omy (ECON) climb, cruise, and descent speeds. For all models, entering zero for the CI results in maximum range airspeed and minimum trip fuel. This speed schedule ignores the cost of time. Conversely, if the maximum value for CI is entered, the FMC uses a minimum time speed schedule. This speed schedule calls for maximum flight envelope speeds, and ignores the cost of fuel (see fig. 2). VARIABLE FUEL PRICES, FUEL TANKERING, AND FUEL HEDGING MAKE THE COST INDEX CALCULATION COMPLICATED. Used appropriately, the cost index (CI) feature of the flight management computer (FMC) can help airlines significantly reduce operating costs. However, many operators don’t take full advantage of this powerful tool.
Transcript
26aero quarterly qtr_02 | 07
Fuel Conservation Strategies:cost index explained
by Bill Roberson, Senior Safety Pilot, flight Operations
This article is the first in a series exploring fuel conservation strategies.
cost inDex DefineD
the ci is the ratio of the time-related cost of an airplane operation and the cost of fuel. the value of the ci reflects the relative effects of fuel cost on overall trip cost as compared to time-related direct operating costs.
in equation form: ci =time cost ~ $/hr
Fuel cost ~ cents/lb
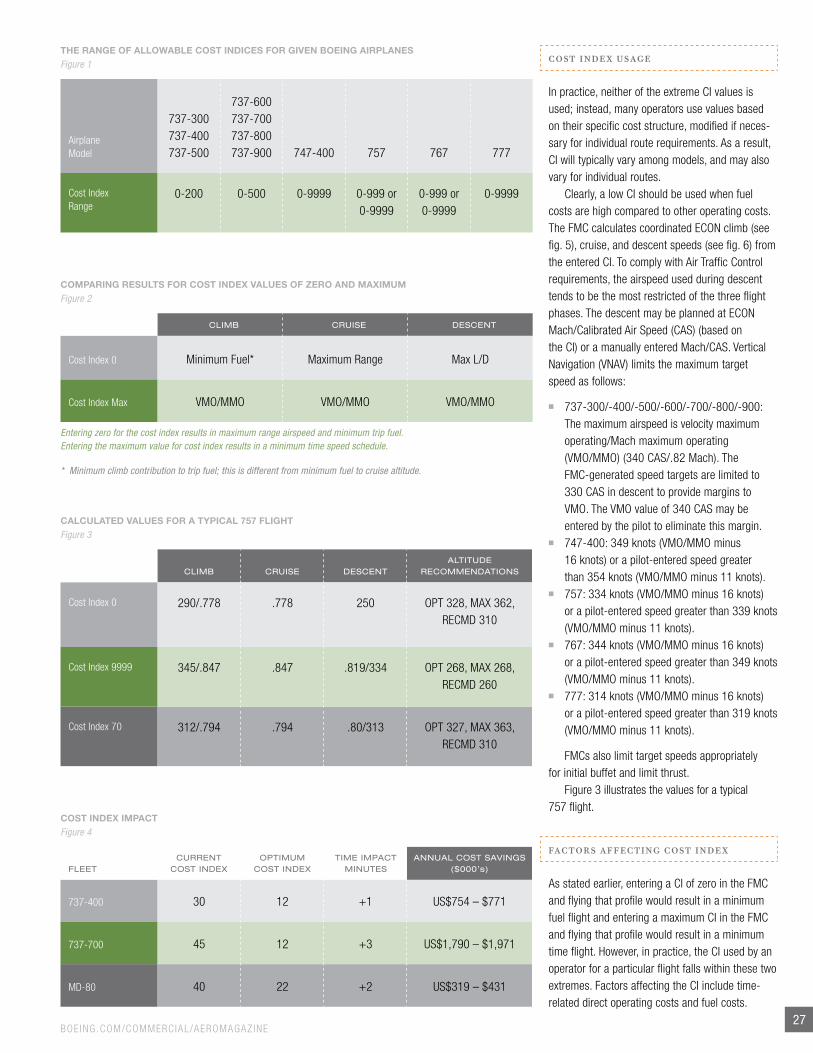
the range of allowable cost indices is shown in Figure 1. the flight crew enters the company-calculated ci into the control display unit (cDu) of the Fmc. the Fmc then uses this number and other performance parameters to calculate econ-omy (econ) climb, cruise, and descent speeds.
For all models, entering zero for the ci results in maximum range airspeed and minimum trip fuel. this speed schedule ignores the cost of time.
conversely, if the maximum value for ci is entered, the Fmc uses a minimum time speed schedule. this speed schedule calls for maximum flight envelope speeds, and ignores the cost of fuel (see fig. 2).
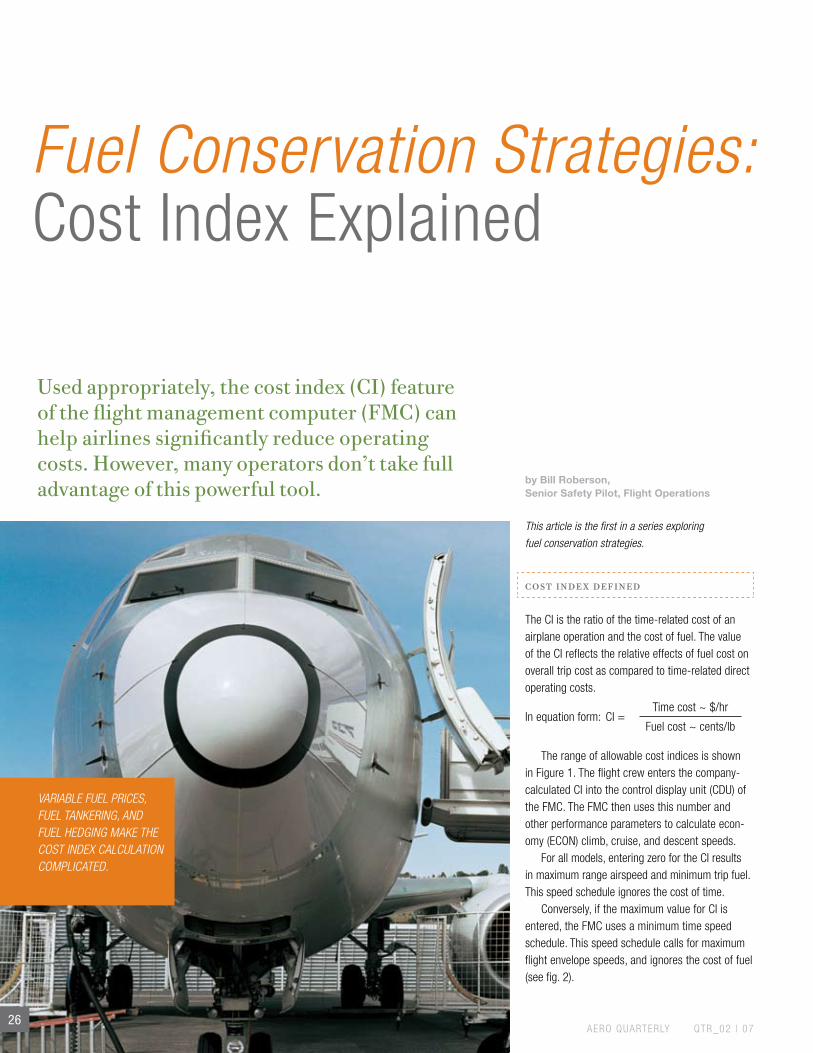
VARIAbLE FUEL PRICES, FUEL TANKERING, ANd FUEL HEdGING MAKE THE COST INdEX CALCULATION COMPLICATEd.
Used appropriately, the cost index (CI) feature of the flight management computer (FMC) can help airlines significantly reduce operating costs. However, many operators don’t take full advantage of this powerful tool.
27boeing.com/commercial/aeromagazine
THE RAngE Of ALLOWABLE COST inDiCES fOR giVEn BOEing AiRPLAnES
COMPARing RESuLTS fOR COST inDEx VALuES Of zERO AnD MAxiMuM
Figure 2
Climb Cruise DesCent
cost index 0 minimum Fuel* maximum range max l/D
cost index max vmo/mmo vmo/mmo vmo/mmo
Entering zero for the cost index results in maximum range airspeed and minimum trip fuel. Entering the maximum value for cost index results in a minimum time speed schedule.
* Minimum climb contribution to trip fuel; this is different from minimum fuel to cruise altitude.
CALCuLATED VALuES fOR A TyPiCAL 757 fLigHT
Figure 3
757 ExAMPLEClimb Cruise DesCent
AltituDe reCommenDAtions
cost index 0 290/.778 .778 250 opt 328, maX 362, recmD 310
cost index 9999 345/.847 .847 .819/334 opt 268, maX 268, recmD 260
cost index 70 312/.794 .794 .80/313 opt 327, maX 363, recmD 310
COST inDEx iMPACT
Figure 4
FleetCurrent
Cost inDeXoPtimum
Cost inDeXtime imPACt
minutesAnnuAl Cost sAvings
($000’s)
737-400 30 12 +1 uS$754 – $771
737-700 45 12 +3 uS$1,790 – $1,971
mD-80 40 22 +2 uS$319 – $431
cost inDex usage
in practice, neither of the extreme ci values is used; instead, many operators use values based on their specific cost structure, modified if neces-sary for individual route requirements. as a result, ci will typically vary among models, and may also vary for individual routes.
clearly, a low ci should be used when fuel costs are high compared to other operating costs. the Fmc calculates coordinated econ climb (see fig. 5), cruise, and descent speeds (see fig. 6) from the entered ci. to comply with air traffic control requirements, the airspeed used during descent tends to be the most restricted of the three flight phases. the descent may be planned at econ mach/calibrated air Speed (caS) (based on the ci) or a manually entered mach/caS. vertical navigation (vnav) limits the maximum target speed as follows:
n 737-300/-400/-500/-600/-700/-800/-900: the maximum airspeed is velocity maximum operating/mach maximum operating (vmo/mmo) (340 caS/.82 mach). the Fmc-generated speed targets are limited to 330 caS in descent to provide margins to vmo. the vmo value of 340 caS may be entered by the pilot to eliminate this margin.
n 747-400: 349 knots (vmo/mmo minus 16 knots) or a pilot-entered speed greater than 354 knots (vmo/mmo minus 11 knots).
n 757: 334 knots (vmo/mmo minus 16 knots) or a pilot-entered speed greater than 339 knots (vmo/mmo minus 11 knots).
n 767: 344 knots (vmo/mmo minus 16 knots) or a pilot-entered speed greater than 349 knots (vmo/mmo minus 11 knots).
n 777: 314 knots (vmo/mmo minus 16 knots) or a pilot-entered speed greater than 319 knots (vmo/mmo minus 11 knots).
Fmcs also limit target speeds appropriately for initial buffet and limit thrust.
Figure 3 illustrates the values for a typical 757 flight.
factors affecting cost inDex
as stated earlier, entering a ci of zero in the Fmc and flying that profile would result in a minimum fuel flight and entering a maximum ci in the Fmc and flying that profile would result in a minimum time flight. However, in practice, the ci used by an operator for a particular flight falls within these two extremes. Factors affecting the ci include time-related direct operating costs and fuel costs.
28
Altit
ude
b
coSt inDeX increaSing
ci = 0 (minimum fuel)
minim
um tim
e from point a to b
Distance
Final cruiSe altituDe
a
Altitude
a
coSt inDeX increaSing
minimum time to
point b
max
imum
gra
dien
t
Distance
b
initial cruiSe altituDe
ci =
0 (m
inim
um fu
el)
b
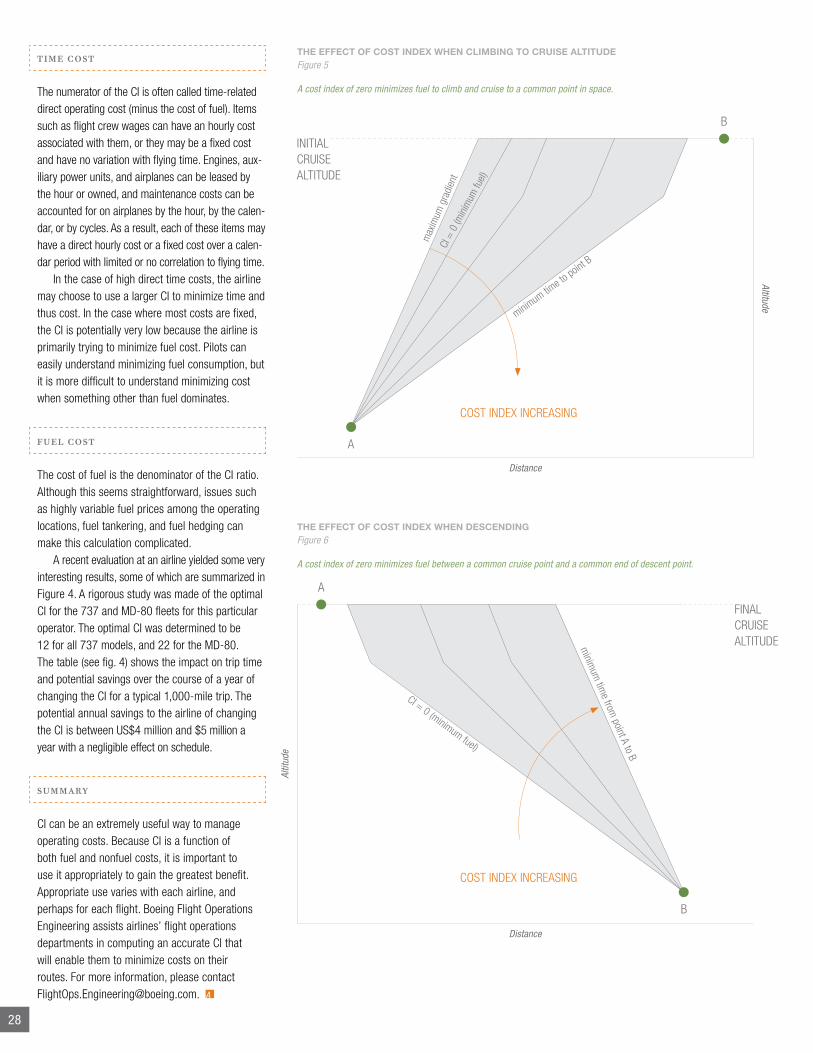
THE EffECT Of COST inDEx WHEn DESCEnDingFigure 6
A cost index of zero minimizes fuel between a common cruise point and a common end of descent point.
time cost
the numerator of the ci is often called time-related direct operating cost (minus the cost of fuel). items such as flight crew wages can have an hourly cost associated with them, or they may be a fixed cost and have no variation with flying time. engines, aux-iliary power units, and airplanes can be leased by the hour or owned, and maintenance costs can be accounted for on airplanes by the hour, by the calen-dar, or by cycles. as a result, each of these items may have a direct hourly cost or a fixed cost over a calen-dar period with limited or no correlation to flying time.
in the case of high direct time costs, the airline may choose to use a larger ci to minimize time and thus cost. in the case where most costs are fixed, the ci is potentially very low because the airline is primarily trying to minimize fuel cost. pilots can easily understand minimizing fuel consumption, but it is more difficult to understand minimizing cost when something other than fuel dominates.
fuel cost
the cost of fuel is the denominator of the ci ratio. although this seems straightforward, issues such as highly variable fuel prices among the operating locations, fuel tankering, and fuel hedging can make this calculation complicated.
a recent evaluation at an airline yielded some very interesting results, some of which are summarized in Figure 4. a rigorous study was made of the optimal ci for the 737 and mD-80 fleets for this particular operator. the optimal ci was determined to be 12 for all 737 models, and 22 for the mD-80. the table (see fig. 4) shows the impact on trip time and potential savings over the course of a year of changing the ci for a typical 1,000-mile trip. the potential annual savings to the airline of changing the ci is between uS$4 million and $5 million a year with a negligible effect on schedule.
summary
ci can be an extremely useful way to manage operating costs. because ci is a function of both fuel and nonfuel costs, it is important to use it appropriately to gain the greatest benefit. appropriate use varies with each airline, and perhaps for each flight. boeing Flight operations engineering assists airlines’ flight operations departments in computing an accurate ci that will enable them to minimize costs on their routes. For more information, please contact [email protected].
THE EffECT Of COST inDEx WHEn CLiMBing TO CRuiSE ALTiTuDE Figure 5
A cost index of zero minimizes fuel to climb and cruise to a common point in space.
22Aero quArterly qtr_04 | 07
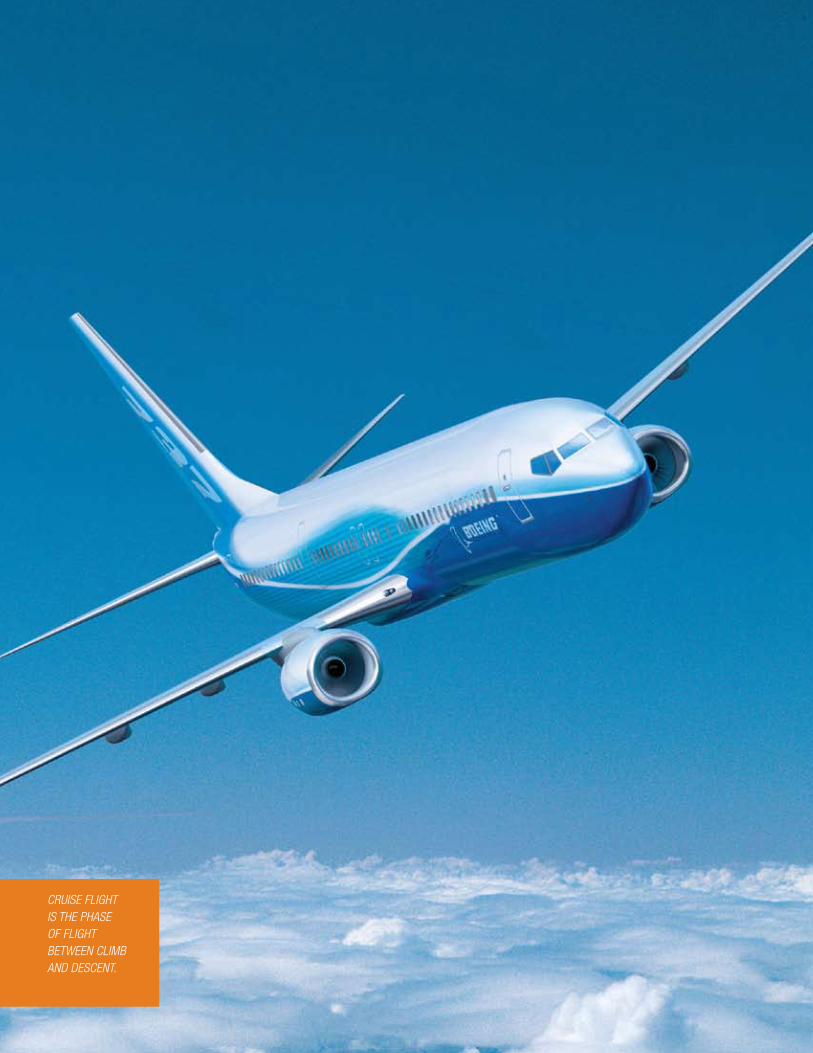
CRuiSE FLigHT iS THE pHASE OF FLigHT BETWEEN CLiMB AND DESCENT.
23WWW.boeing.com/commerciAl/AeromAgAzine
by William Roberson, Senior Safety Pilot, Flight Operations; Robert Root, Flight Operations Engineering; and Dell adams, Flight Operations Engineer
This article is the second in a series exploring fuel conservation strategies.
Fuel Conservation Strategies: cruise Flight
A good understanding of cruise flight can not only help crews operate efficiently and save their companies money, but can also help them deal with low fuel situations. As an additional benefit, the less fuel consumed, the more environmentally friendly the flight.
this article defines cruise flight, presents various cruise schemes, and outlines the effects of wind on cruise speed calculations. it also discusses the relationship between cruise flight and cost index (ci) which was discussed in the first article in this series, “Fuel conservation Strategies: cost index explained” in the secondquarter 2007 AERO.
used appropriately, the ci feature of the flight management computer (Fmc) can help airlines significantly reduce operating costs. However, many operators don’t take full advantage of this powerful tool.
Cruise flight defined
cruise flight is the phase of flight that falls between climb and descent. the largest percentages of trip time and trip fuel are consumed typically in this phase of flight. As an aside, unanticipated low altitude maneuvering, which also impacts trip time and fuel significantly, can often be avoided through appropriate cruise planning.
the variables that affect the total time and fuel burn are speed selection, altitude selection, and, to some degree, center of gravity (cg). this article focuses on speed selection.
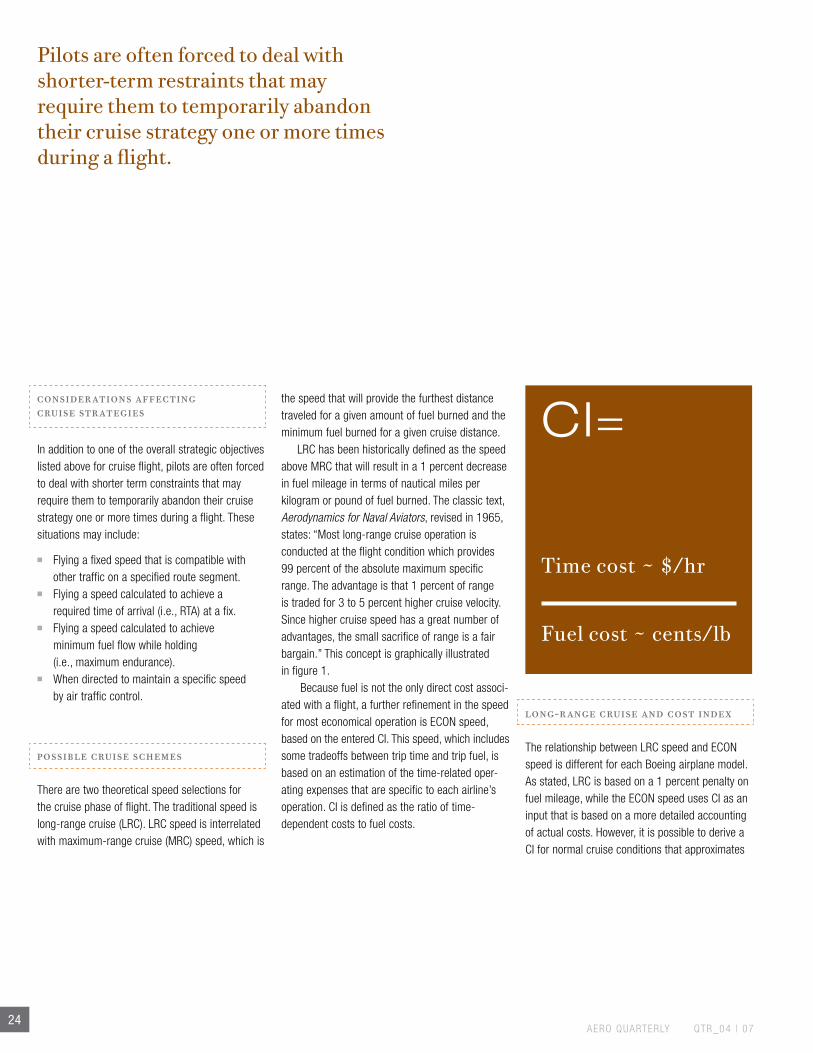
A number of highlevel objectives may influence speed selection. these objectives, which depend on the perspective of the pilot, dispatcher, performance engineer, or operations planner, can be grouped into five categories:
1. maximize the distance traveled for a given amount of fuel (i.e., maximum range).
2. minimize the fuel used for a given distance covered (i.e., minimum trip fuel).
3. minimize total trip time (i.e., minimum time).4. minimize total operating cost for the trip
(i.e., minimum cost, or economy [econ] speed).5. maintain the flight schedule.
the first two objectives are essentially the same because in both cases the airplane will be flown to achieve optimum fuel mileage.
24Aero quArterly qtr_04 | 07
Considerations affeCting Cruise strategies
in addition to one of the overall strategic objectives listed above for cruise flight, pilots are often forced to deal with shorter term constraints that may require them to temporarily abandon their cruise strategy one or more times during a flight. these situations may include:
■ Flying a fixed speed that is compatible with other traffic on a specified route segment.
■ Flying a speed calculated to achieve a required time of arrival (i.e., rtA) at a fix.
■ Flying a speed calculated to achieve minimum fuel flow while holding (i.e., maximum endurance).
■ When directed to maintain a specific speed by air traffic control.
possiBle Cruise sCheMes
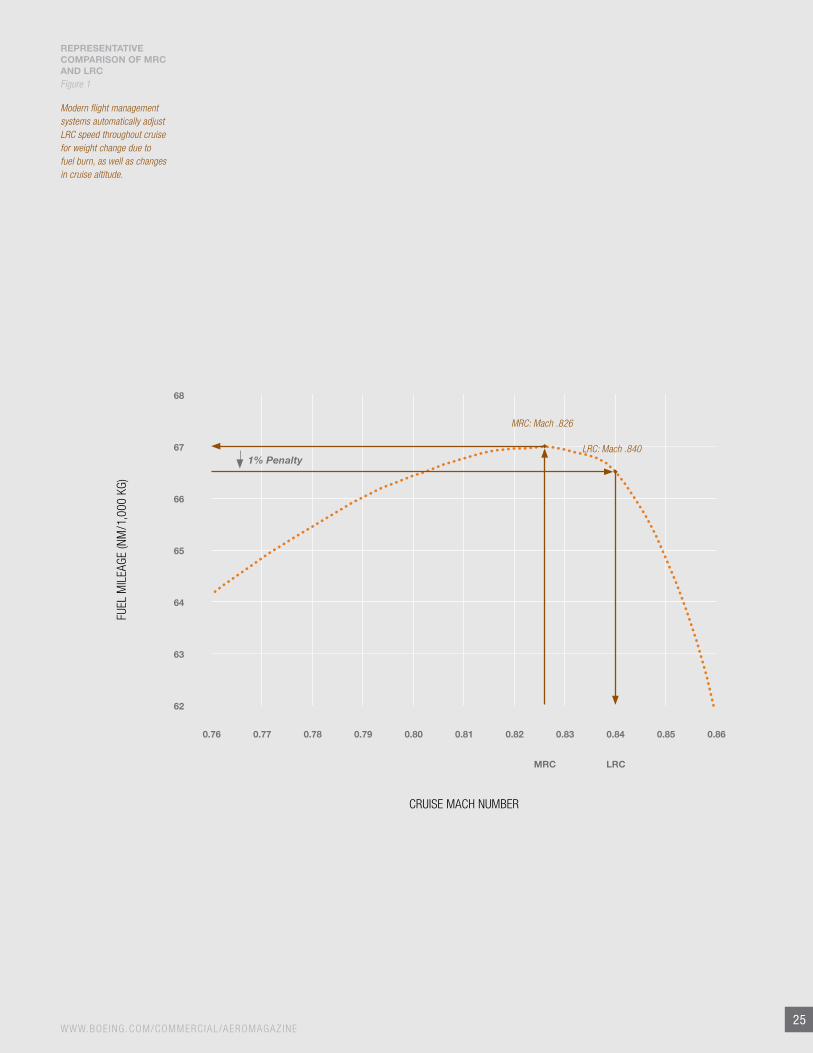
there are two theoretical speed selections for the cruise phase of flight. the traditional speed is longrange cruise (lrc). lrc speed is interrelated with maximumrange cruise (mrc) speed, which is
the speed that will provide the furthest distance traveled for a given amount of fuel burned and the minimum fuel burned for a given cruise distance.
lrc has been historically defined as the speed above mrc that will result in a 1 percent decrease in fuel mileage in terms of nautical miles per kilogram or pound of fuel burned. the classic text, Aero dynamics for Naval Aviators, revised in 1965, states: “most longrange cruise operation is conducted at the flight condition which provides 99 percent of the absolute maximum specific range. the advantage is that 1 percent of range is traded for 3 to 5 percent higher cruise velocity. Since higher cruise speed has a great number of advantages, the small sacrifice of range is a fair bargain.” this concept is graphically illustrated in figure 1.
because fuel is not the only direct cost associated with a flight, a further refinement in the speed for most economical operation is econ speed, based on the entered ci. this speed, which includes some tradeoffs between trip time and trip fuel, is based on an estimation of the timerelated operating expenses that are specific to each airline’s operation. ci is defined as the ratio of timedependent costs to fuel costs.
CI=
Time cost ~ $/hr
Fuel cost ~ cents/lb
long-range Cruise and Cost index
the relationship between lrc speed and econ speed is different for each boeing airplane model. As stated, lrc is based on a 1 percent penalty on fuel mileage, while the econ speed uses ci as an input that is based on a more detailed accounting of actual costs. However, it is possible to derive a ci for normal cruise conditions that approximates
Pilots are often forced to deal with shorter-term restraints that may require them to temporarily abandon their cruise strategy one or more times during a flight.
Modern flight management systems automatically adjust LRC speed throughout cruise for weight change due to fuel burn, as well as changes in cruise altitude.
26Aero quArterly qtr_04 | 07
lrc in terms of the cruise speed that results. Figure 2 shows the approximate relationship for boeing commercial airplanes.
it is very important to note that the lrc speed is almost universally higher than the speed that will result from using the ci selected by most carriers. if faced with a low fuel situation at destination, many pilots will opt to fly lrc speed thinking that it will give them the most miles from their remaining fuel. As shown in figure 2, the best strategy to conserve fuel is to select a very low cost index, with zero providing the maximum range. Any pilot can easily demonstrate this during cruise flight by inputting different cis into the Fmc and comparing with lrc by observing the predicted fuel at destination.
effeCts of wind on Cruise speed
in addition to more accurately optimizing costs, there is one other benefit of flying econ instead of lrc with most boeing airplanes. the lrc speed calculated by the Fmc is typically not adjusted for winds at cruise altitude but the econ speed is. As a result, lrc is ideal only for zero wind conditions, while the econ speed is optimized for all cruise wind conditions.
For example, in the presence of a strong tailwind, the econ speed will be reduced in order to maximize the advantage gained from the tailwind during the cruise. conversely, the econ speed will be increased when flying into a headwind in cruise to minimize the penalty associated with the headwind (see example in fig. 3).
the relationship Between operating Costs and Cost index
if fuel prices increase relative to other costs, a corresponding reduction in ci will maintain the most economical operation of the airplane. if, however, an airline experiences rising hourly costs, an increase in ci will retain the most economical operation. in either case, the changing ci will result in changes to the cruise speed calculated by the Fmc. even calculating a cost index based on approximate time costs and flying econ speed can yield significant cost benefits to the airline.
to be used most effectively, ci should be based on a comprehensive evaluation of an operator’s specific operating costs. For this reason, flight crews typically receive a recommended ci value from their flight operations department, and it is generally not advisable to deviate from this value unless specific shortterm constraints demand it.
suMMary
in order for flight crews to achieve optimum cruise operation, it is necessary to first understand the flight’s strategic objectives, and then to select the cruise speed that best meets these objectives. it is equally important to recognize that realworld situations may result in the need for deviations from the overriding strategy. Appropriate use varies with each airline, and sometimes even for each flight.
boeing Flight operations engineering assists airlines’ flight operations departments in computing an accurate ci that will enable them to minimize costs on their routes. For more information, please contact [email protected].
27WWW.boeing.com/commerciAl/AeromAgAzine
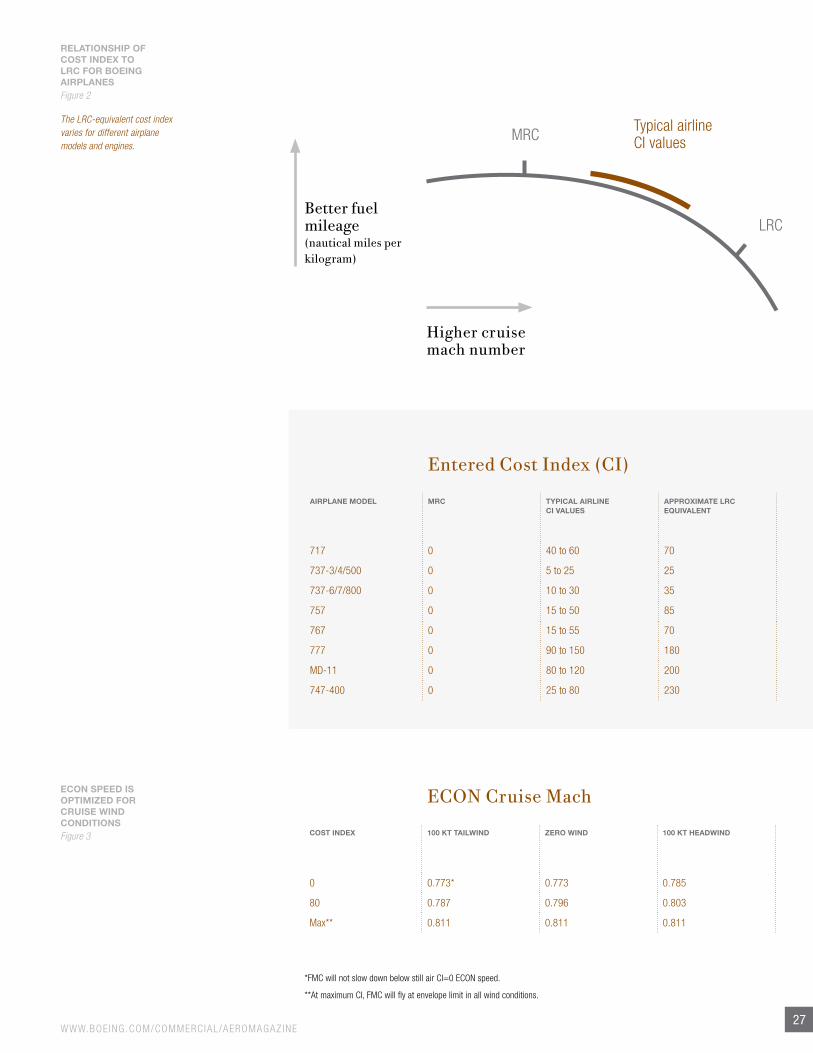
ECON Cruise Mach
COST iNDEX 100 kT TailWiND ZERO WiND 100 kT hEaDWiND
0 0.773* 0.773 0.785
80 0.787 0.796 0.803
max** 0.811 0.811 0.811
RElaTiONShiP OF COST iNDEX TO lRC FOR BOEiNG aiRPlaNES Figure 2
The LRC-equivalent cost index varies for different airplane models and engines.
*Fmc will not slow down below still air ci=0 econ speed.
**At maximum ci, Fmc will fly at envelope limit in all wind conditions.
ECON SPEED iS OPTimiZED FOR CRUiSE WiND CONDiTiONSFigure 3
Entered Cost Index (CI)
aiRPlaNE mODEl mRC TyPiCal aiRliNE Ci ValUES
aPPROXimaTE lRC EqUiValENT
717 0 40 to 60 70
7373/4/500 0 5 to 25 25
7376/7/800 0 10 to 30 35
757 0 15 to 50 85
767 0 15 to 55 70
777 0 90 to 150 180
mD11 0 80 to 120 200
747400 0 25 to 80 230
Higher cruise mach number
Better fuel mileage(nautical miles per kilogram)
mrctypical airlineci values
lrc
Aero quArterly qtr_04 | 0824
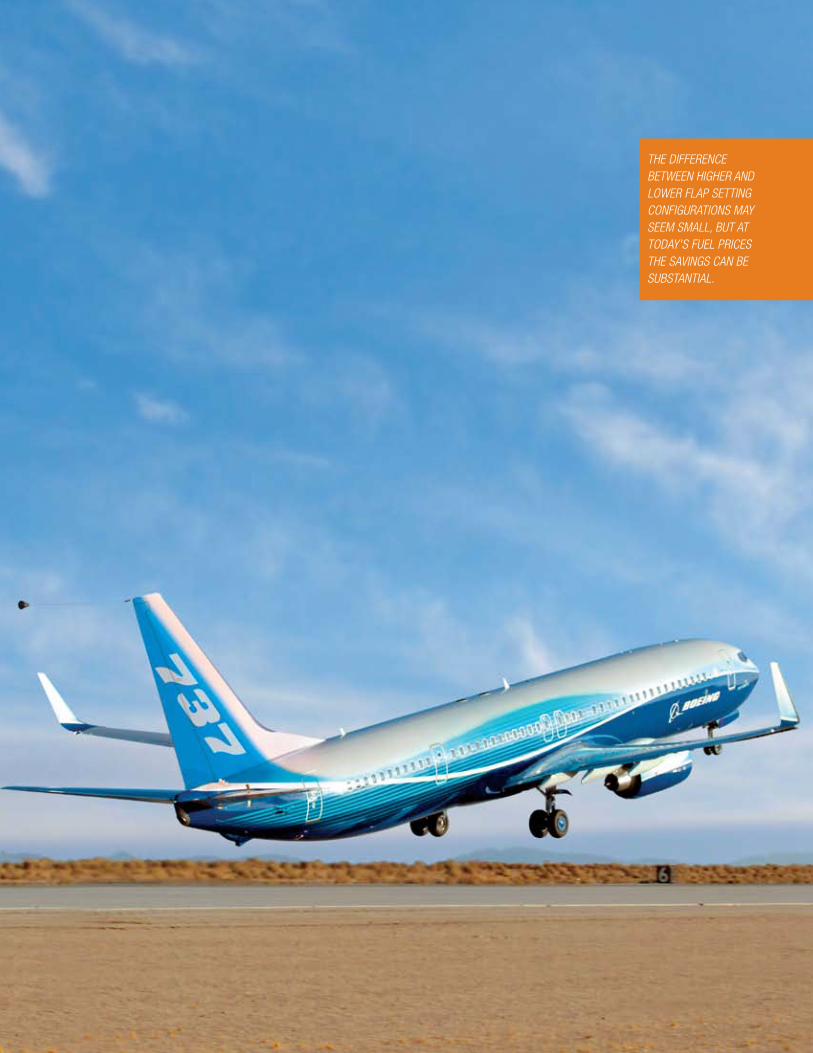
THE DIFFERENCE BETWEEN HIGHER AND LOWER FLAP SETTING CONFIGURATIONS MAY SEEM SMALL, BUT AT TODAY'S FUEL PRICES THE SAVINGS CAN BE SUBSTANTIAL.
WWW.boeing.com/commerciAl/AeromAgAzine25
this article discusses strategies for fuel savings during the takeoff and climb phases of flight. Subse quent articles in this series will deal with the descent, approach, and landing phases of flight, as well as auxiliarypowerunit usage strategies. the first article in this series, “cost index explained,” appeared in the secondquarter 2007 AERO. it was followed by “cruise Flight” in the fourthquarter 2007 issue.
takeoff and climB fuel conServation StrategieS
in the past, when the price of jet fuel increased by 20 to 30 cents per u.S. gallon, airlines did not concern themselves with fuel conservation in the takeoff and climb segment of the flight because it represents only 8 to 15 percent of the total time of a medium to longrange flight.
but times have clearly changed. Jet fuel prices have increased over five times from 1990 to 2008. At this time, fuel is about 40 percent of a typical airline’s total operating cost. As a result, airlines are reviewing all phases of flight to determine how fuel burn savings can be gained in each phase and in total.
this article examines the takeoff and climb phase for four types of commercial airplanes to illustrate various takeoff and climb scenarios and how they impact fuel usage. these analyses look at shortrange (e.g., 717), mediumrange (e.g., 737800 with winglets), and longrange (e.g., 777200 extended range and 747400) airplanes.
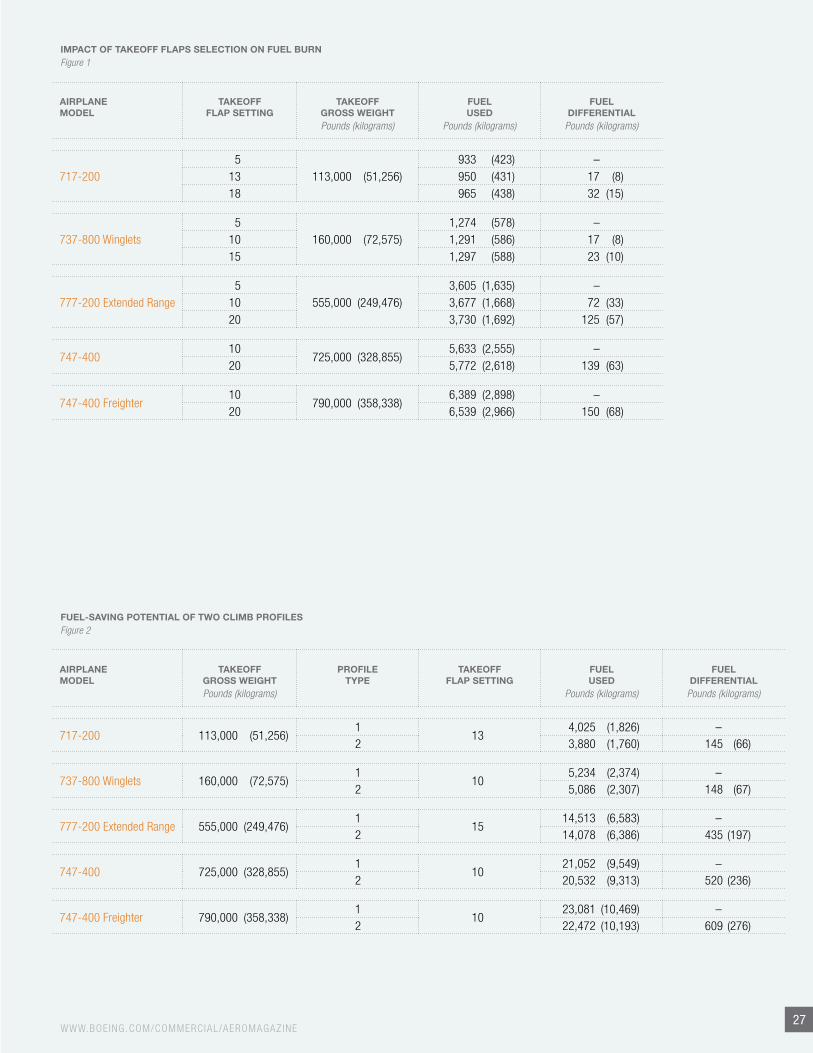
An important consideration when seeking fuel savings in the takeoff and climb phase of flight is the takeoff flap setting. the lower the flap setting, the lower the drag, resulting in less fuel burned. Figure 1 shows the effect of takeoff flap setting on
fuel burn from brake release to a pressure altitude of 10,000 feet (3,048 meters), assuming an acceleration altitude of 3,000 feet (914 meters) above ground level (Agl). in all cases, however, the flap setting must be appropriate for the situation to ensure airplane safety.
Higher flap setting configurations use more fuel than lower flap configurations. the difference is small, but at today’s prices the savings can be sub stantial — especially for airplanes that fly a high number of cycles each day.
For example, an operator with a small fleet of 717s which flies approximately 10 total cycles per day could save 320 pounds (145 kilograms) of fuel per day by changing its normal takeoff flaps setting from 18 to 5 degrees. With a fuel price of uS$3.70 per u.S. gallon, this would be approximately uS$175 per day. Assuming each airplane
Fuel Conservation Strategies:takeoff and climb By William Roberson, senior safety Pilot, flight Operations; and James A. Johns, flight Operations Engineer, flight Operations Engineering
This article is the third in a series exploring fuel conservation strategies.
Every takeoff is an opportunity to save fuel. If each takeoff and climb is performed efficiently, an airline can realize significant savings over time. But what constitutes an efficient takeoff? How should a climb be executed for maximum fuel savings? The most efficient flights actually begin long before the airplane is cleared for takeoff.
Aero quArterly qtr_04 | 0826
is flown 350 days per year, the airline could save approxi mately uS$61,000 a year. if an airline makes this change to a fleet of 717 airplanes that averages 200 cycles a day, it could save more than uS$1 million per year in fuel costs.
using these same assumptions on fuel price, the potential fuel savings for an operator of a small fleet of 747400s whose airplanes average a total of three cycles per day would be approximately 420 u.S. pounds (191 kilograms) of fuel per day, or approximately uS$230. During a year, the operator could save approximately uS$84,000. these savings are not as dramatic as the shortrange transport airplane, but clearly they increase as the fleet size or number of cycles grows.
operators need to determine whether their fleet size and cycles are such that the savings would make it worthwhile to change procedures and pilot training. other important factors that determine whether or not it is advisable to change standard takeoff settings include obstacles clearance, runway length, airport noise, and departure procedures.
Another area in the takeoff and climb phase where airlines can reduce fuel burn is in the climbout and cleanup operation. if the flight crew per forms acceleration and flap retraction at a lower altitude than the typical 3,000 feet (914 meters), the fuel burn is reduced because the drag is being reduced earlier in the climb out phase.
comparing the fuel uSage of two Standard climB profileS
Figure 2 shows two standard climb profiles for each airplane. these simplified profiles are based on the international civil Aviation organization (icAo) procedures for Air navigation Services Aircraft operations (pAnSopS) noise Abatement Departure procedures (nADp) nADp 1 and nADp 2 profiles. profile 1 is a climb with acceleration and flap retraction beginning at 3,000 feet (914 meters) Agl, which is the noise climbout procedure for closein noise monitors. profile 2 is a climb with accelera tion to flap retraction speed beginning at 1,000 feet (305 meters) Agl, which is the noise climbout proce dure for farout noise monitors. As a general rule, when airplanes fly profile 2,
tHe role of tHe fligHt crew in fuel conservation
every area of an airline has a part to play in reducing the cost of the operation. but the flight crew has the most direct role in cutting the amount of fuel used on any given flight.
the flight crew has opportunities to affect the amount of fuel used in every phase of flight without compromising safety. these phases include planning, ground operations, taxi out, takeoff, climb, cruise, descent, approach, landing, taxi in, and maintenance debrief.
top fuel conservation strategies for flight crews include:
n take only the fuel you need.n minimize the use of the auxiliary power unit.n taxi as efficiently as possible.n take off and climb efficiently.n Fly the airplane with minimal drag.n choose routing carefully.n Strive to maintain optimum altitude.n Fly the proper cruise speed.n Descend at the appropriate point.n configure in a timely manner.
WWW.boeing.com/commerciAl/AeromAgAzine27
fUEl-sAving POTEnTiAl Of TWO CliMB PROfilEs Figure 2
AiRPlAnE MODEl
TAKEOff gROss WEigHT Pounds (kilograms)
PROfilE TyPE
TAKEOff flAP sETTing
fUEl UsED
Pounds (kilograms)
fUEl DiffEREnTiAl
Pounds (kilograms)
717200 113,000 (51,256)1
13 4,025 (1,826) –
2 3,880 (1,760) 145 (66)
737800 Winglets 160,000 (72,575)1
10 5,234 (2,374) –
2 5,086 (2,307) 148 (67)
777200 extended range 555,000 (249,476)1
15 14,513 (6,583) –
2 14,078 (6,386) 435 (197)
747400 725,000 (328,855)1
10 21,052 (9,549) –
2 20,532 (9,313) 520 (236)
747400 Freighter 790,000 (358,338)1
10 23,081 (10,469) –
2 22,472 (10,193) 609 (276)
iMPACT Of TAKEOff flAPs sElECTiOn On fUEl BURn Figure 1
AiRPlAnE MODEl
TAKEOff flAP sETTing
TAKEOff gROss WEigHT Pounds (kilograms)
fUEl UsED
Pounds (kilograms)
fUEl DiffEREnTiAl
Pounds (kilograms)
717200 5
113,000 (51,256) 933 (423) –
13 950 (431) 17 (8) 18 965 (438) 32 (15)
737800 Winglets 5
160,000 (72,575) 1,274 (578) –
10 1,291 (586) 17 (8)15 1,297 (588) 23 (10)
777200 extended range 5
555,000 (249,476) 3,605 (1,635) –
10 3,677 (1,668) 72 (33)20 3,730 (1,692) 125 (57)
74740010
725,000 (328,855) 5,633 (2,555) –
20 5,772 (2,618) 139 (63)
747400 Freighter10
790,000 (358,338) 6,389 (2,898) –
20 6,539 (2,966) 150 (68)
Aero quArterly qtr_04 | 0828
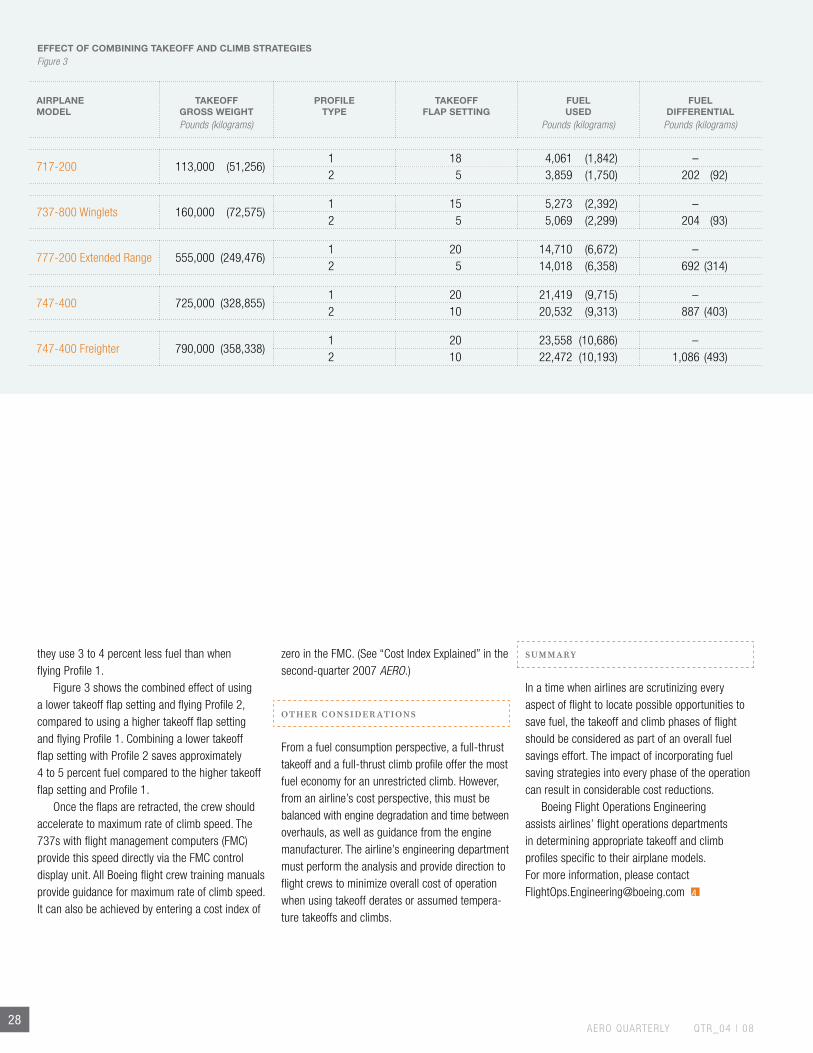
they use 3 to 4 percent less fuel than when flying profile 1.
Figure 3 shows the combined effect of using a lower takeoff flap setting and flying profile 2, compared to using a higher takeoff flap setting and flying profile 1. combining a lower takeoff flap setting with profile 2 saves approximately 4 to 5 percent fuel compared to the higher takeoff flap setting and profile 1.
once the flaps are retracted, the crew should accelerate to maximum rate of climb speed. the 737s with flight management computers (Fmc) provide this speed directly via the Fmc control display unit. All boeing flight crew training manuals provide guidance for maximum rate of climb speed. it can also be achieved by entering a cost index of
zero in the Fmc. (See “cost index explained” in the secondquarter 2007 AERO.)
other conSiderationS
From a fuel consumption perspective, a fullthrust takeoff and a fullthrust climb profile offer the most fuel economy for an unrestricted climb. However, from an airline’s cost perspective, this must be balanced with engine degradation and time between overhauls, as well as guidance from the engine manufacturer. the airline’s engineering department must perform the analysis and provide direction to flight crews to minimize overall cost of operation when using takeoff derates or assumed temperature takeoffs and climbs.
Summary
in a time when airlines are scrutinizing every aspect of flight to locate possible opportunities to save fuel, the takeoff and climb phases of flight should be considered as part of an overall fuel savings effort. the impact of incorporating fuel saving strategies into every phase of the operation can result in considerable cost reductions.
boeing Flight operations engineering assists airlines’ flight operations departments in deter mining appropriate takeoff and climb profiles specific to their airplane models. For more infor mation, please contact [email protected]
EffECT Of COMBining TAKEOff AnD CliMB sTRATEgiEsFigure 3
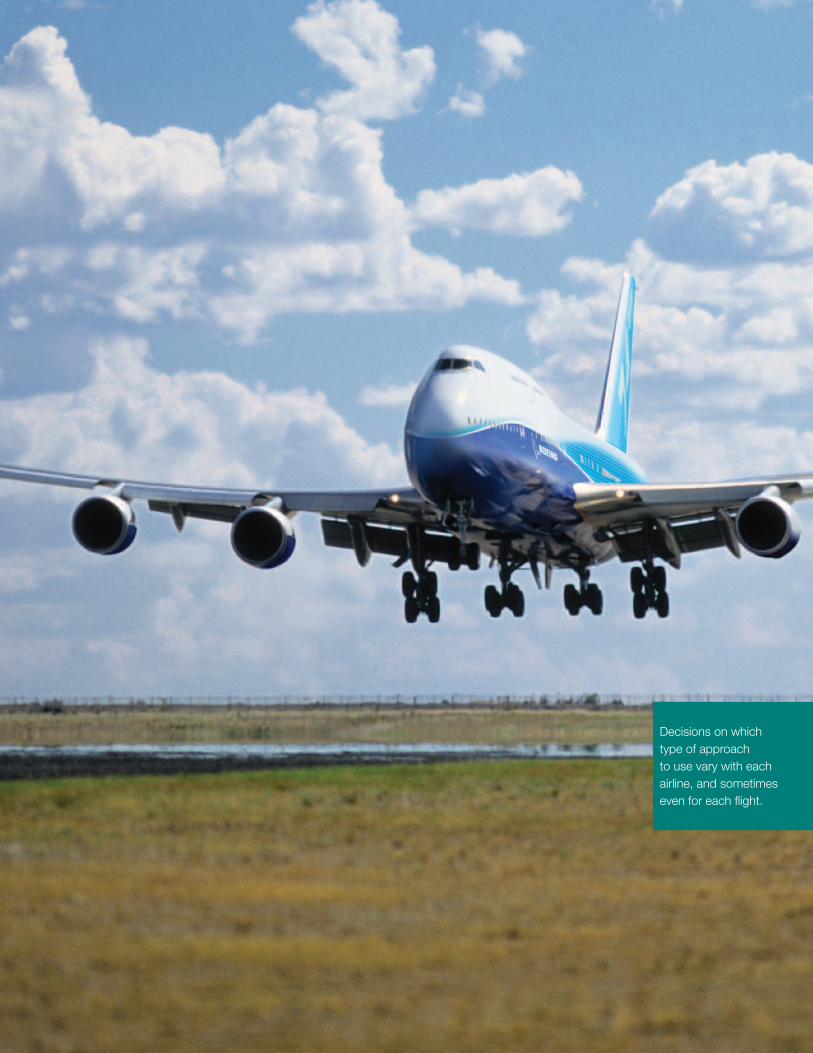
Decisions on which type of approach to use vary with each airline, and sometimes even for each flight.
25www.boeing.com/commercial/aeromagazine
Fuel conservation Strategies: Descent and approach
This article is the fourth and final in a series exploring fuel conservation strategies. It discusses strategies for saving fuel during the descent and approach phases of flight. The first article in this series, “Cost Index Explained,” appeared in the second-quarter 2007 aero. It was followed by “Cruise Flight” in the fourth-quarter 2007 issue and “Takeoff and Climb” in the fourth-quarter 2008 issue.
Fuel conservation is a significant concern of every airline. an airline can choose an approach procedure and flap setting policy that uses the least amount of fuel,
but it should also consider the trade-offs involved with using this type of procedure.
in this article, two types of approaches are analyzed: the standard approach and the low-drag or delayed-flaps approach. the cost of a missed approach is also discussed.
The sTandard approach
boeing flight crew training manuals and/or flight crew operating manuals (Fcom) define standard approach profiles for every boeing model. these profiles include specific flap settings and when to select
them during various parts of the approach (see fig. 1).
The low-drag or delayed-flaps approach
if the approach is not being conducted in adverse conditions that would make it difficult to achieve stabilized approach criteria, the final flap selection may be delayed until just prior to 1,000 feet above field elevation (aFe) to conserve fuel and reduce noise and emissions or to accom-modate speed requests by air traffic control. this approach is known as a low-drag,
the descent and approach phases of flight represent the flight crew’s final opportunities to reduce fuel consumption during flight. by carefully planning the airplane’s descent and appropriately using drag and high lift devices, the flight crew can ensure a safe landing while saving fuel.
By william roberson, chief Pilot research, and
James a. Johns, Flight operations engineer, Flight operations engineering
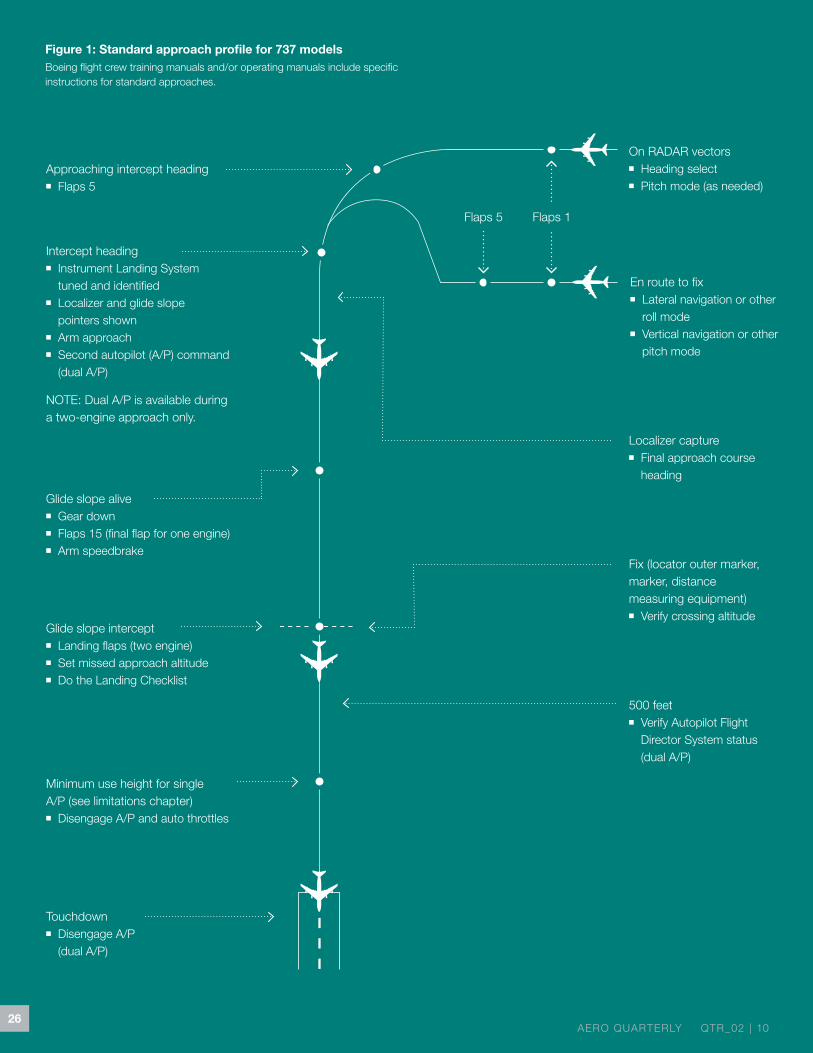
figure 1: standard approach profile for 737 modelsboeing flight crew training manuals and/or operating manuals include specific instructions for standard approaches.
approaching intercept heading■■ Flaps 5
intercept heading■■ instrument landing System
tuned and identified■■ localizer and glide slope
pointers shown■■ arm approach■■ Second autopilot (a/P) command
(dual a/P)
note: Dual a/P is available during a two-engine approach only.
glide slope alive■■ gear down■■ Flaps 15 (final flap for one engine)■■ arm speedbrake
touchdown■■ Disengage a/P
(dual a/P)
on raDar vectors■■ Heading select■■ Pitch mode (as needed)
glide slope intercept■■ landing flaps (two engine)■■ Set missed approach altitude■■ Do the landing checklist
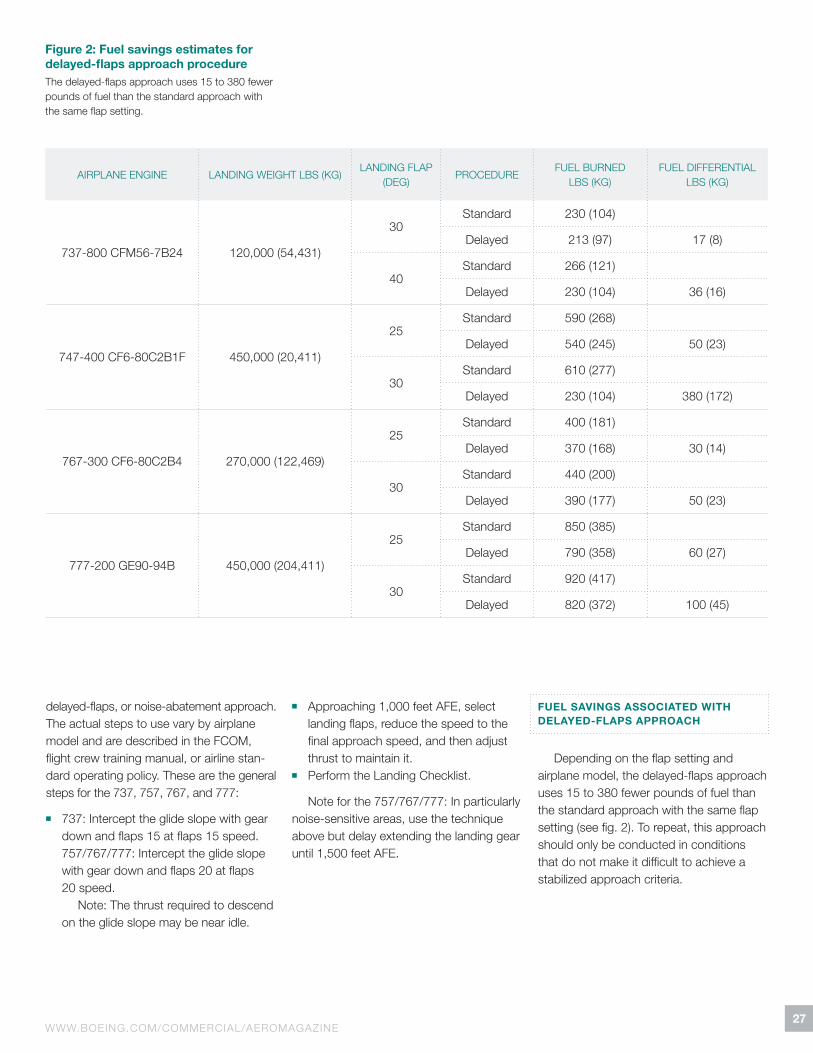
figure 2: fuel savings estimates for delayed-flaps approach procedurethe delayed-flaps approach uses 15 to 380 fewer pounds of fuel than the standard approach with the same flap setting.
delayed-flaps, or noise-abatement approach. the actual steps to use vary by airplane model and are described in the Fcom, flight crew training manual, or airline stan-dard operating policy. these are the general steps for the 737, 757, 767, and 777:
■■ 737: intercept the glide slope with gear down and flaps 15 at flaps 15 speed. 757/767/777: intercept the glide slope with gear down and flaps 20 at flaps 20 speed.
note: the thrust required to descend on the glide slope may be near idle.
■■ approaching 1,000 feet aFe, select landing flaps, reduce the speed to the final approach speed, and then adjust thrust to maintain it.
■■ Perform the landing checklist.
note for the 757/767/777: in particularly noise-sensitive areas, use the technique above but delay extending the landing gear until 1,500 feet aFe.
fuel savings associaTed wiTh delayed-flaps approach
Depending on the flap setting and airplane model, the delayed-flaps approach uses 15 to 380 fewer pounds of fuel than the standard approach with the same flap setting (see fig. 2). to repeat, this approach should only be conducted in conditions that do not make it difficult to achieve a stabilized approach criteria.
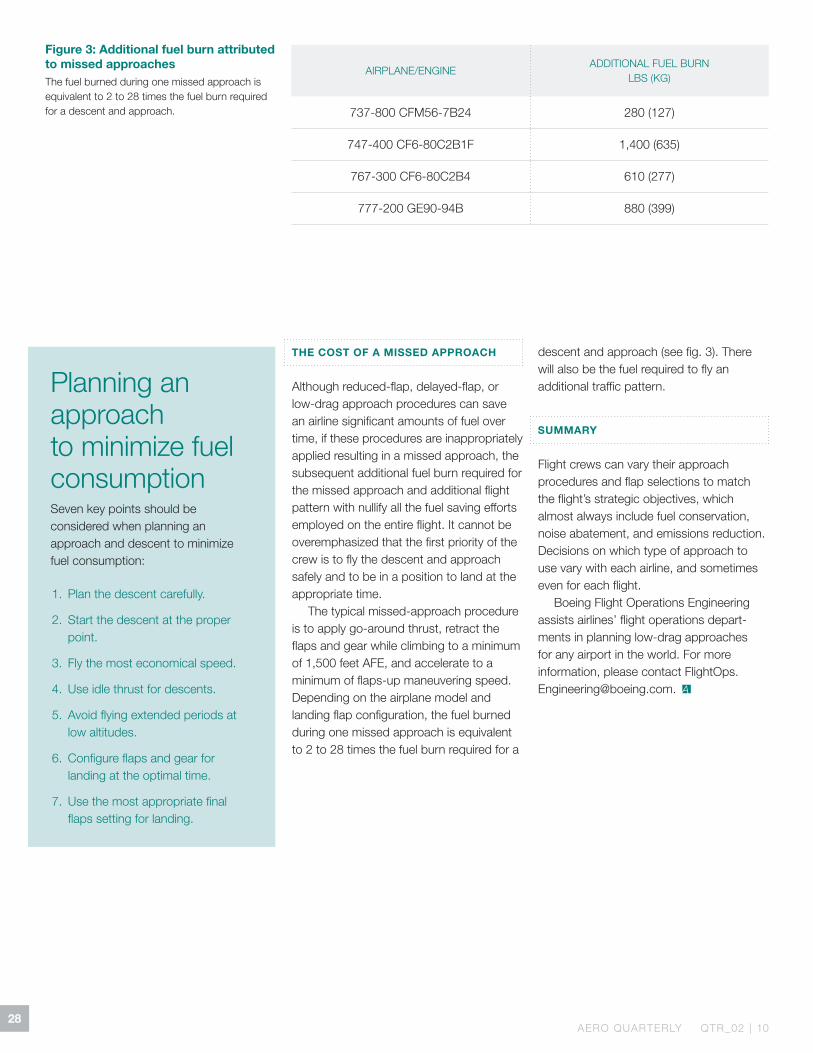
figure 3: additional fuel burn attributed to missed approachesthe fuel burned during one missed approach is equivalent to 2 to 28 times the fuel burn required for a descent and approach.
Planning an approach to minimize fuel consumption Seven key points should be considered when planning an approach and descent to minimize fuel consumption:
1. Plan the descent carefully.
2. Start the descent at the proper point.
3. Fly the most economical speed.
4. use idle thrust for descents.
5. avoid flying extended periods at low altitudes.
6. configure flaps and gear for landing at the optimal time.
7. use the most appropriate final flaps setting for landing.
The cosT of a missed approach
although reduced-flap, delayed-flap, or low-drag approach procedures can save an airline significant amounts of fuel over time, if these procedures are inappropriately applied resulting in a missed approach, the subsequent additional fuel burn required for the missed approach and additional flight pattern with nullify all the fuel saving efforts employed on the entire flight. it cannot be overemphasized that the first priority of the crew is to fly the descent and approach safely and to be in a position to land at the appropriate time.
the typical missed-approach procedure is to apply go-around thrust, retract the flaps and gear while climbing to a minimum of 1,500 feet aFe, and accelerate to a minimum of flaps-up maneuvering speed. Depending on the airplane model and landing flap configuration, the fuel burned during one missed approach is equivalent to 2 to 28 times the fuel burn required for a
descent and approach (see fig. 3). there will also be the fuel required to fly an additional traffic pattern.
summary
Flight crews can vary their approach procedures and flap selections to match the flight’s strategic objectives, which almost always include fuel conservation, noise abatement, and emissions reduction. Decisions on which type of approach to use vary with each airline, and sometimes even for each flight.
boeing Flight operations engineering assists airlines’ flight operations depart-ments in planning low-drag approaches for any airport in the world. For more information, please contact [email protected].