81
© Josh Estey SUMBA ICONIC ISLAND REPORTS WINROCK INTERNATIONAL AUGUST 2010 Fuel Independent Renewable Energy “Iconic Island” Preliminary Resource Assessment Sumba & Buru Islands - Indonesia

© J
osh
Este
y
Sum
ba Ic
on
Ic IS
lan
d R
Epo
RtS
WInRock IntERnatIonal auguSt 2010
Fuel Independent Renewable Energy “Iconic Island”Preliminary Resource AssessmentSumba & buru Islands - Indonesia

1 | P a g e
FUEL INDEPENDENT RENEWABLE ENERGY “ICONIC ISLAND”
PRELIMINARY RESOURCE ASSESSMENT SUMBA & BURU ISLANDS - INDONESIA August 2010
2 | P a g e
TABLE OF CONTENTS
TABLE OF CONTENTS ....................................................................................................................................... 2
TABLE OF FIGURES .......................................................................................................................................... 5
LIST OF TABLES ................................................................................................................................................ 7
INTRODUCTION AND SUMMARY .................................................................................................................... 8
CHAPTER 1. SUMBA ISLAND .......................................................................................................................... 10
1.1. Geography Demography & Administration ........................................................................................ 10
1.1.1 Introduction ............................................................................................................................... 10
1.2. Renewable Energy Resource Assessment .......................................................................................... 13
1.2.1 Introduction ............................................................................................................................... 13
1.3. Hydro Resource Assessment (Hydro potential on Sumba) ................................................................. 15
1.3.1 Introduction ............................................................................................................................... 15
1.3.2 Mamboro Waterfall ................................................................................................................... 16
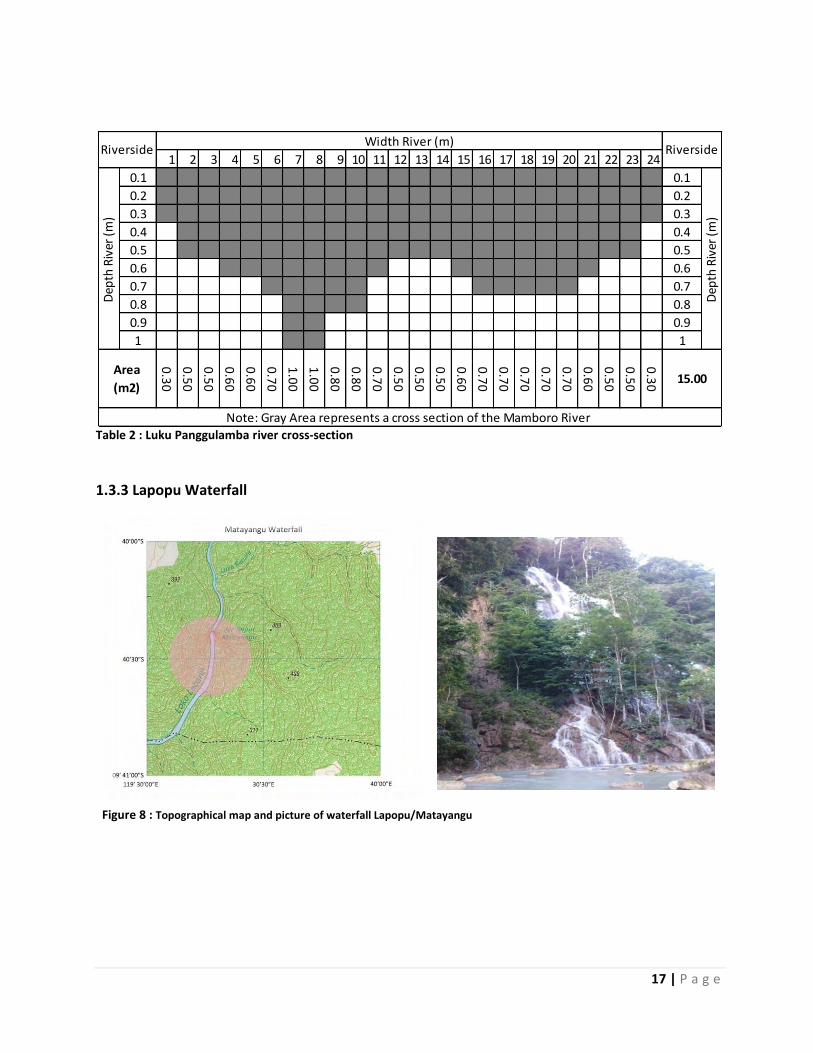
1.3.3 Lapopu Waterfall ........................................................................................................................ 17
1.3.4 Lowa Waterfall ........................................................................................................................... 18
1.3.5 Lokomboro Waterfall ................................................................................................................. 19
1.3.6 Lukat Waterfall ........................................................................................................................... 20
1.3.8 Predicted Power ......................................................................................................................... 22
1.4 Wind Resource Assessment (Wind potential on Sumba) .................................................................... 23
1.4.1 Introduction ............................................................................................................................... 23
1.4.2 Potential Wind Sites ................................................................................................................... 25
1.4.3 A Prediction of Theoretical Wind Energy Power potential on the island of Sumba .................. 30
1.5. Solar PV Resource Assessment (Solar PV potential on Sumba) .......................................................... 31
1.5.1 Introduction ............................................................................................................................... 31
1.5.2 Potential Sites............................................................................................................................. 31
1.5.3 Predicted Power ......................................................................................................................... 32
1.6. Biogas Resource Assessment (SMALL biogas potential on Sumba) .................................................... 33
1.6.1 Introduction ............................................................................................................................... 33
1.6.2 Desk research ............................................................................................................................. 33
1.6.3 Stakeholder consultation ........................................................................................................... 35
1.7. Biofuels Resource Preliminary Assessment Sumba ............................................................................ 38
1.7.1 Introduction ............................................................................................................................... 38
1.7.2 Biofuel Development Sumba ..................................................................................................... 38

3 | P a g e
1.7.3 Biofuel Potential Sumba Based on Land Suitability ................................................................... 40
1.8. RE Potential for Electrification ............................................................................................................ 42
1.8.1 Introduction ............................................................................................................................... 42
1.8.2 PLN baseline & Planning and growth ......................................................................................... 43
1.9. Integrated supply demand analyses ................................................................................................... 44
1.9.1 Waikabubak System ................................................................................................................... 44
1.9.2 Waingapu System ....................................................................................................................... 44
1.9.3 Replacing fossil fuel power generation with Renewable Energy ............................................... 45
1.10. Transport and Fuel consumption Statistics ...................................................................................... 46
CHAPTER 2. BURU ISLAND ............................................................................................................................ 47
2.1. Geography Demography & Administration ........................................................................................ 47
2.1.1 Introduction ............................................................................................................................... 47
2.1.2 Logistics; impairing Buru’s development ................................................................................... 50
2.2. Renewable Energy Resource Assessment .......................................................................................... 52
2.2.1 Introduction ............................................................................................................................... 52
2.3. Hydro Resource Assessment (Hydro potential on Buru) .................................................................... 54
2.3.1 Introduction ............................................................................................................................... 54
2.3.2 Predicted Power ......................................................................................................................... 56
2.4. Wind Resource Assessment (Wind potential on Buru) ...................................................................... 56
2.4.1 Introduction ............................................................................................................................... 56
(1) Airport wind data .................................................................................................................. 57
(2) NASA Wind Data ................................................................................................................... 58
(3) Third party wind data ........................................................................................................... 59
(4) Potential Wind Sites ............................................................................................................. 59
2.4.3 A Prediction of Theoretical Wind Energy Power potential on the island of Buru ..................... 64
2.5. Solar PV Resource Assessment ........................................................................................................... 65
2.5.1 Solar PV potential on Buru ......................................................................................................... 65
2.5.2 Predicted Power ......................................................................................................................... 66
2.6. Biogas Resource Assessment (SMALL biogas potential on Buru) ....................................................... 66
2.6.1 Introduction ............................................................................................................................... 66
2.6.2 Desk research ............................................................................................................................. 66
2.7. Biofuels Resource Preliminary Assessment Buru ............................................................................... 68
2.7.1 Introduction ............................................................................................................................... 68
2.7.2 Biofuel Development Buru ......................................................................................................... 69
2.7.3 Biofuel Potential Buru Based on Land Suitability ....................................................................... 69
4 | P a g e
2.8. RE Potential for Electrification ............................................................................................................ 71
2.8.1 Introduction ............................................................................................................................... 71
2.8.2 PLN baseline & Planning and growth ........................................................................................ 72
2.8.3 Integrated supply demand analyses......................................................................................... 74
2.8.4 Replacing fossil fuel power generation with Renewable Energy ............................................... 75
2.8.5 Transport and Fuel consumption Statistics ................................................................................ 76
Chapter 3. ...................................................................................................................................................... 77
A comparison of Candidates Islands Buru and Sumba ................................................................................. 77
3.1 Introduction ......................................................................................................................................... 77
3.2 Sumba and Buru; a summarized comparison ...................................................................................... 77

5 | P a g e
TABLE OF FIGURES
Figure 1 : Administrative map Sumba ............................................................................................. 10 Figure 2 : Transnusa airlines at Tambolaka airport .......................................................................... 11 Figure 3 : 10W Stand alone wind turbine and PV for communication applications ........................... 13 Figure 4 : The PV-wind hybrid system and solar PV pump system .................................................... 13 Figure 5 : Renewable energy potential in Sumba ............................................................................ 14 Figure 6 : Estimation methods of water current flow and river cros section contour ........................ 16 Figure 7 : Topographical maps of waterfall Mamboro and Luku Panggulamba river ......................... 16 Figure 8 : Topographical map and picture of waterfall Lapopu/Matayangu ..................................... 17 Figure 9 : Luku Waiwuang / Wanokaka river monthly average debit ............................................... 18 Figure 10 : Topographical maps of waterfall Lowa and Lowa river ..................................................... 18 Figure 11 : Topographical map and picture of the PLN owned micro hydro ‘Lokomboro’ 800 kw ........ 19 Figure 12 : Luku Mareha / Kalada river monthly average volume flow .............................................. 20 Figure 13 : Topographical map and picture of waterfall Lukat ........................................................... 20 Figure 14 : Kambaniru dam .............................................................................................................. 21 Figure 15 : Kambaniru river monthly average volume flow in M3/s ................................................... 22 Figure 16 : Typical construction of micro hydro power plant ............................................................. 22 Figure 17 : Wind potential map of Sumba ........................................................................................ 24 Figure 18 : Eight direction pictures of Hambapraing .......................................................................... 26 Figure 19 : Topographical map of Hambapraing ................................................................................ 27 Figure 20 : Topographical map of Palakahembi site .......................................................................... 27 Figure 21 : Eight direction pictures of Palakahembi site .................................................................... 28 Figure 22 : Eight direction pictures of Lawola site ............................................................................. 29 Figure 23 : Topographical map of Lawola ......................................................................................... 30 Figure 24 : Solar insolation in Indonesia ........................................................................................... 31 Figure 25 : Solar insolation at kelurahan Kambajawa, kecamatan Kanatang (Nasa) ........................... 32 Figure 26 : The monthly average production (Homer) ....................................................................... 32 Figure 27 : Traditional Sumbanese house ......................................................................................... 33 Figure 28 : Cattle on Sumba ............................................................................................................. 34 Figure 29 : Biogas brochures from PT.Media Inovasi Transfer ........................................................... 36 Figure 30 : Traditional stable ........................................................................................................... 36 Figure 31 : Jathropa plantation ........................................................................................................ 38 Figure 32 : Lontar palm plantations .................................................................................................. 40 Figure 33 : Land suitability map ....................................................................................................... 41 Figure 34 : Map of an existing PLN grid and power plants in Sumba .................................................. 43 Figure 35 : Daily load profile and power supply in Waikabubak system ............................................. 44 Figure 36 : Daily load profile and power supply in Waingapu system................................................. 45 Figure 37 : Administrative map Buru ................................................................................................ 47 Figure 38 : Lake Rana and beach north Buru ..................................................................................... 48 Figure 39 : Rice paddies south west of Namlea ................................................................................. 50 Figure 40 : Transportation ............................................................................................................... 51 Figure 41 : Landing strip & airport Namlea ...................................................................................... 52 Figure 42 : Renewable energy potential in Buru ............................................................................... 53 Figure 43 : Micro hydro (25 kW) and 50 W Solar home system Buru .................................................. 54 Figure 44 : 5 kW Photo voltaic system and solar PV pump system ..................................................... 54
6 | P a g e
Figure 45 : Satellite picture of deforestation and logging operation ................................................... 55 Figure 46 : Way Geren Dam and monthly average debit fluctuations ................................................. 55 Figure 47 : Weather station at Namlea airport and wind speed data (2003, 2005, 2006, 2007 and 2008 ......................................................................................................................................................... 57 Figure 48 : Wind speed estimation with Web based tool ................................................................... 59 Figure 49 : Transportation to Seith, East Buru & a view from the air ................................................... 60 Figure 50 : Eight direction pictures of Seith ........................................................................................ 61 Figure 51 : Eight direction pictures of Karang Jaya .............................................................................. 62 Figure 52 : Eight direction pictures of Karang Jaya (Coast) .................................................................. 63 Figure 53 : Wind sites Namlea ........................................................................................................... 64 Figure 54 : The average daily solar radiation on Buru island ............................................................... 65 Figure 55 : Solar insolation at site (Nasa) ........................................................................................... 65 Figure 56 : The monthly average electric production of a 5kW centralized PV (homer) ........................ 66 Figure 57 : Cattle on Buru .................................................................................................................. 67 Figure 58 : Transmigrate farmer villages west of Namlea .................................................................. 67 Figure 59 : Buru land suitability map .................................................................................................. 70 Figure 60 : Wild sago west of Namlea ................................................................................................ 71 Figure 61 : Map of an existing PLN grid and power plants in Buru ...................................................... 73 Figure 62 : Namlea daily load profile .................................................................................................. 74

7 | P a g e
LIST OF TABLES
Table 1 : Sumba geography, demography and indicators; source: BPS, 2009. NTT in figures ............. 11 Table 2 : Luku Panggulamba river cross-section .............................................................................. 17 Table 3 : Lowa river cross section ................................................................................................... 19 Table 4 : Lukat river cross section ................................................................................................... 21 Table 5 : Hydro energy potential sites; estimated predicted power ................................................. 23 Table 6 : Potential wind energy sites and estimated potential in MW installed capacity................... 25 Table 7 : Prediction of wind energy potential .................................................................................. 30 Table 8 : Large livestock population by kind and regency 2008; source: BPS, 2009. NTT in figures ..... 35 Table 9 : Estimated biogas potential Sumba .................................................................................... 37 Table 10 : Land suitability and biofuel feedstock potential for selected crops .................................... 41 Table 11 : Jatropha curcas seed yields in India (source: adapted from SRIPHL 2006) ........................... 42 Table 12 : Available/operational diesel generators Waikabubak system (source: PLN NTT) ................ 44 Table 13 : Available diesel generator in Waingapu system (Source: PLN NTT) .................................... 45 Table 14 : Transport statistic and fuel consumption Sumba ............................................................... 46 Table 15 : Buru geography, demography and indicators; source: BPS, 2004. Buru in figures ............... 48 Table 16 : The utilization of renewable energy in Buru island ............................................................ 54 Table 17 : Predicted power from hydro energy potential sites (public work department) ................... 56 Table 18 : Wind Roughness Class reference table .............................................................................. 58 Table 19 : Nasa Wind Data ............................................................................................................... 58 Table 20 : The estimatation of Wind energy potential on potential sites............................................ 64 Table 21 : Large livestock population by kind and regency 2009; source: BPS, 2009. Buru in figures ... 67 Table 22 : Estimated biogas potential Buru ....................................................................................... 68 Table 23 : Land suitability and biofuel feedstock potential for selected crops .................................... 70 Table 24 : Electrification ratios Maluku province ............................................................................... 72 Table 25 : Diesel generator installed on Namlea, Mako and Air Buaya systems .................................. 74 Table 26 : Transport statistics and fuel consumption Buru and South Buru ........................................ 76 Table 27 : Sumba & Buru summarized comparison ........................................................................... 79

8 | P a g e
INTRODUCTION AND SUMMARY
Late June 2010 Winrock was commissioned by Dutch organization HIVOS to implement a first thorough and in-depth assessment on two islands and screen them against set of criteria in order to determine their respective ‘attractiveness’ as candidates for a ‘fossil fuel independent pilot Island’ Iconic Island’. An earlier scoping report prepared for Hivos by Miki Salman in December 2009 explains the background against which this particular study was commissioned, as follows;
Hivos is considering the possibility to start a project to provide renewable energy to an island in Indonesia. The aim would be to completely end the reliance on fossil fuels. The project should on the one hand provide energy to the inhabitants, but on the other hand also attract interest, cooperation and funding from institutions and companies inside and outside Indonesia. The connection between providing renewable energy, poverty alleviation and bringing the fight on climate change to small islands in Indonesia may not be immediately clear to all audiences. In climate change discourse, small islands are most often mentioned in the context of their vulnerability to rising sea levels, and not at all in their contribution to global carbon emission. What is often overlooked is the fact that many of these islands are often entirely dependent on outside sources of energy. Development and welfare of its inhabitants are held hostage as a result. Renewable energy may offer solutions to this problem, as they do not really lack the potential for local and sustainable sources of energy. Two islands Sumba (in ‘East Nusa Tenggara’) and Buru (in ‘The Moluccas’) were selected for further and more in-depth analyses based on an agreed Terms of Reference (TOR). This report endeavors to answer the basic research question whether or not the islands under scrutiny can become fossil fuel impendent in light of the available and verifiable Renewable Energy sources as found on these islands. Secondly, it aims to reduce the level of complexity by assessing islands against criteria that either inhibit or enable project implementation these include criteria of general logistics and perceived support of local authorities and stakeholders. Desk research was done in anticipation and preparation of site survey and -validation. Site survey proved to be effective in obtaining a better understanding of the actual circumstances and setting in which the future project would be required to be implemented. Chapter 1 and 2 present the findings of respectively the Sumba and Buru assessment. A socio-economic background is followed by a detailed resource assessment based on available data. GIS mapping tools were used to provide the reader with a clear and summarized picture of the islands as to the locations of renewable energy resources, the PLN power lines and generation capacity, suitability of land (for biofuels), annual precipitation, protected forest and other features. In Chapter 3 a scoring chart was devised in order to obtain an ‘apple to apple’ comparison between islands. Certainly the scoring chart could be extended by introducing additional criteria and way factors and in this fashion reduce the coarseness of ‘island appraisal’. It is recommended that additional qualitative discussions takes place that includes less straightforward imperatives, such as the relative priority of island’s development of both the GOI and HIVOS. In conclusion, Sumba seems to have the upper hand being the island with the best technical and institutional potential for the implementation of the ‘iconic island concept’. Even though the island has a large number of inhabitants (> 600,000), which may set hurdles as to the scale of the project, wind, hydro and biogas resources are found throughout the country and has a better road and power line

9 | P a g e
infrastructure. Moreover this island can be reached in less than 5 hours from Jakarta (via Bali). In addition both the local government and the PLN seemed very eager to be involved in the project. This beautiful island which has a great potential for development of notably tourism and agriculture is amongst the least developed islands in terms of electrification ratio and percentage of poor inhabitants in Indonesia. Buru scores lower on most criteria although its population size of about 140,000 is viewed as ideal for the project. Different renewable energy resources are available in throughout the island. The island is blessed with high annual precipitation and numerous smaller and larger rivers which suggest that hydro power development would be the most obvious choice for electrification (both ‘on-grid’ and ‘off-grid’). On the other hand deforestation has taken its toll and as a result river flows/debits are highly variable and have led to flooding on numerous occasions. In addition it is fairly common that traffic between districts is disrupted because of land-slides. Finally it takes two days to reach the island which could impair project implementation and development. On the other hand the island was found to have geothermal resources in excess of what would be required to cover electric power needs in the years to come. Moreover bio-ethanol could be produced from Sago palm than grows west of Namlea as it is currently not harvested. Furthermore wind resources were indentified on a number of locations. In general the production of biofuels for power generation and transport is a concern in terms of technical and commercial viability; successful projects are few and far between hence its development on these islands is likely to be complex and will need far-reaching technical and institutional expertise in order to be successful, even at small village based scale. In short, both islands are suitable candidates for the ‘grand concept’ i.e. the ‘Iconic island’. A final choice is much dependent on development priorities of HIVOS its GOI counterparts. In any case priorities and targets need to be set for the scope and time line of the project. It may be overly ambitious to cover (1) replacement of current fossil fuel power generation, (2) increase electrification ratio’s, (3) increase off-grid electrification, (4) replacing fossil fuel for transport with biofuels and (5) replacing use of firewood and petroleum for cooking with biogas, under the one and the same project.

10 | P a g e
CHAPTER 1. SUMBA ISLAND
1.1. Geography Demography & Administration
1.1.1 Introduction
Sumba is an island located in the eastern part of The Indonesian Archipelago between Sumbawa Island to the Northwest, West Timor to the East and Australia to the far South at a distance of about 700 km. The island is part of East Nusa Tenggara province (Nusa Tenggara Timur), and one of the four largest islands in NTT. The total land area is approximately 11,052 km2, which is about one fourth of the size of the Netherlands, and has a population of only 656,259 inhabitants and a density of 58.62 inhabitants per km2 [for comparison Java Island has a density of 968 inhabitants per km2]. The island is mountainous with small pockets of flat land, and its highest point is Wanggameti Mountain (1,225 meters), as shown on the base map of Sumba below. Administratively the island belongs to East Nusa Tenggara province, and is divided into four regencies (kabupaten), West Sumba, Southwest Sumba, Central Sumba, and East Sumba. The biggest city is Waingapu, which is capital city to East Sumba district.
Figure 1: Administrative map Sumba

11 | P a g e
Table 1: Sumba geography, demography and indicators; source: BPS, 2009. NTT in figures
Central Sumba stands out as the poorest regencies while East Sumba is better off with lower poverty rates and higher income per capita. Transportation infrastructure and facilities are still very limited in terms of quantity, quality and frequency of flights. There are two airports and one seaport in the island. The airports are Tambolaka in West Sumba and Waingapu in East Sumba. Flights to Tambolaka are served by Transnusa Airlines from Denpasar, four times a week and take around one hour travel time, while Waingapu can be reached via Denpasar and Surabaya, each with around 1.5 and 3 hours travel time. Both Merpati and Batavia airlines serve the latter route.
Figure 2: Transnusa airlines at Tambolaka airport
Seaport harbor is located in Waingapu, East Sumba. It was built in 1908, and was renovated in 1972 and 1988 to increase its capacity to serve large freighters as well as sailing boats. This port also serves as entry point for fuel distribution for the island1.
1 See: http://www.pertamina.com/index.php?option=com_content&task=view&id=3858&Itemid=1200.
Description East Sumba West Sumba Central Sumba Southwest Sumba Total
Area [km2] 7,001 737 1,869 1,445 11,052
Population 220,559 103,481 60,151 263,666 647,857
Population Density [per km2] 32 140 32 182 58
Name of Capital City Waingapu Waikabubak Waibakul Tambolaka -
Number of Districts 22 6 4 8 40
GDRP [in Billion IDR] 1,175 595 225 725 2,720
% contribution of Agriculture to GDRP 33.90 39.61 58.53 61.94 48.00
Coconut production (tons/yr) 3,378 3,018 1,637 4,974 13,007
Buffalo population 29,687 16,611 10,145 19,204 75,647
Fisheries (tons/yr) 11,204 1,817 1,614 1,484 16,119
Schools 300 105 90 248 743
Hospitals 2 2 - 1 5
Illiteracy rate in % (above 10 years) 13.16 21.06 23.00 27.45
East Sumba West Sumba Central Sumba Southwest Sumba National
2008 Per Capita Income [in Million IDR]** 2.71 2.41 1.46 1.28 8.01
Poverty Rate [%] 23.31* 42.74 83.55 42.74 14.15
*province poverty rate district data unavailable ** Base on 2000 constant price
12 | P a g e
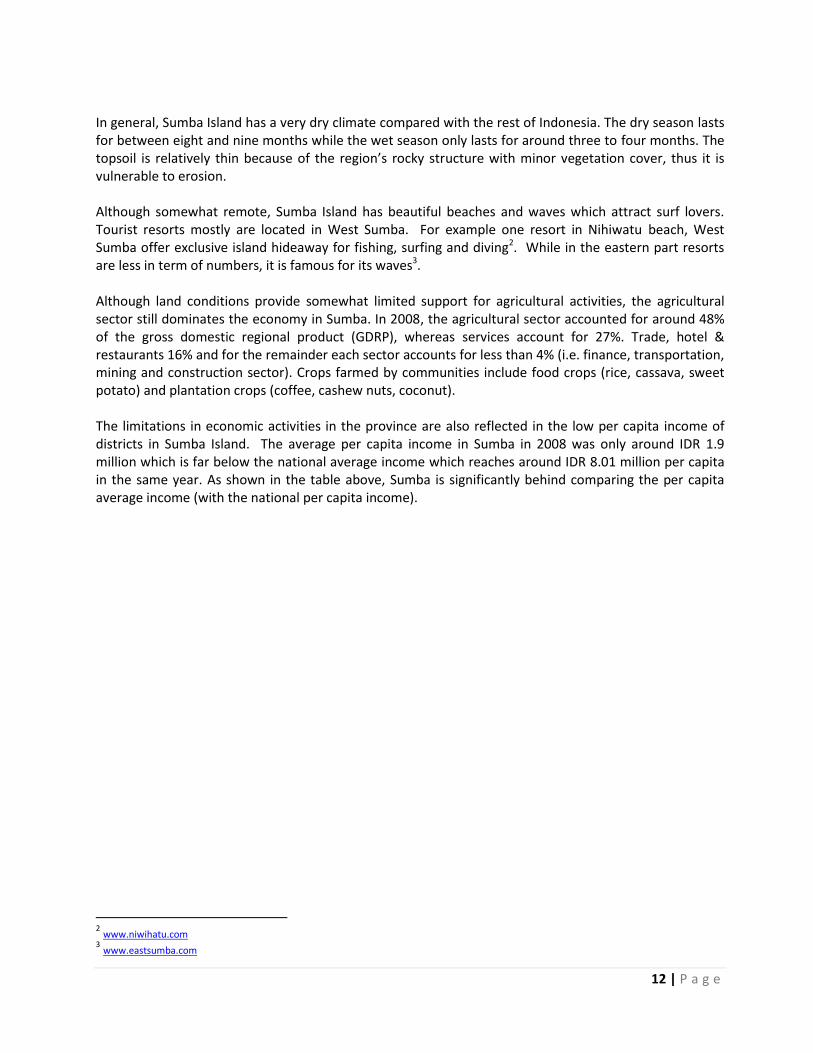
In general, Sumba Island has a very dry climate compared with the rest of Indonesia. The dry season lasts for between eight and nine months while the wet season only lasts for around three to four months. The topsoil is relatively thin because of the region’s rocky structure with minor vegetation cover, thus it is vulnerable to erosion. Although somewhat remote, Sumba Island has beautiful beaches and waves which attract surf lovers. Tourist resorts mostly are located in West Sumba. For example one resort in Nihiwatu beach, West Sumba offer exclusive island hideaway for fishing, surfing and diving2. While in the eastern part resorts are less in term of numbers, it is famous for its waves3. Although land conditions provide somewhat limited support for agricultural activities, the agricultural sector still dominates the economy in Sumba. In 2008, the agricultural sector accounted for around 48% of the gross domestic regional product (GDRP), whereas services account for 27%. Trade, hotel & restaurants 16% and for the remainder each sector accounts for less than 4% (i.e. finance, transportation, mining and construction sector). Crops farmed by communities include food crops (rice, cassava, sweet potato) and plantation crops (coffee, cashew nuts, coconut). The limitations in economic activities in the province are also reflected in the low per capita income of districts in Sumba Island. The average per capita income in Sumba in 2008 was only around IDR 1.9 million which is far below the national average income which reaches around IDR 8.01 million per capita in the same year. As shown in the table above, Sumba is significantly behind comparing the per capita average income (with the national per capita income).
2 www.niwihatu.com
3 www.eastsumba.com
13 | P a g e
1.2. Renewable Energy Resource Assessment
1.2.1 Introduction
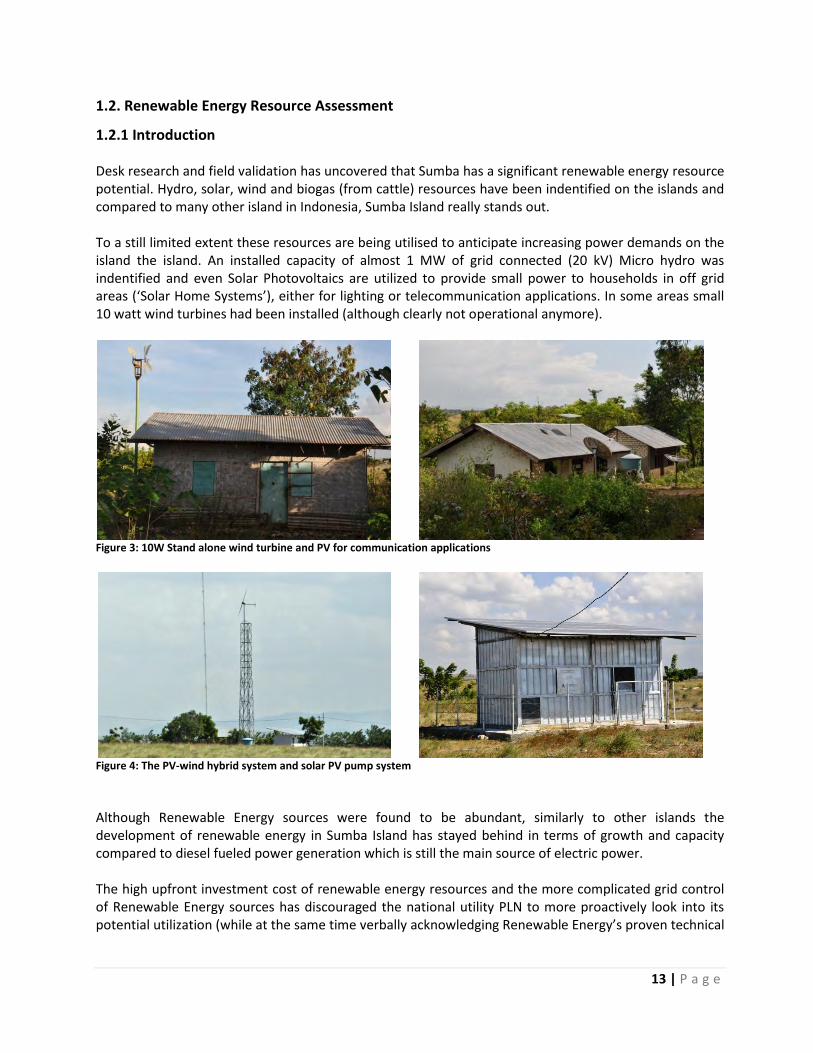
Desk research and field validation has uncovered that Sumba has a significant renewable energy resource potential. Hydro, solar, wind and biogas (from cattle) resources have been indentified on the islands and compared to many other island in Indonesia, Sumba Island really stands out. To a still limited extent these resources are being utilised to anticipate increasing power demands on the island the island. An installed capacity of almost 1 MW of grid connected (20 kV) Micro hydro was indentified and even Solar Photovoltaics are utilized to provide small power to households in off grid areas (‘Solar Home Systems’), either for lighting or telecommunication applications. In some areas small 10 watt wind turbines had been installed (although clearly not operational anymore).
Figure 3: 10W Stand alone wind turbine and PV for communication applications
Figure 4: The PV-wind hybrid system and solar PV pump system Although Renewable Energy sources were found to be abundant, similarly to other islands the development of renewable energy in Sumba Island has stayed behind in terms of growth and capacity compared to diesel fueled power generation which is still the main source of electric power. The high upfront investment cost of renewable energy resources and the more complicated grid control of Renewable Energy sources has discouraged the national utility PLN to more proactively look into its potential utilization (while at the same time verbally acknowledging Renewable Energy’s proven technical
14 | P a g e
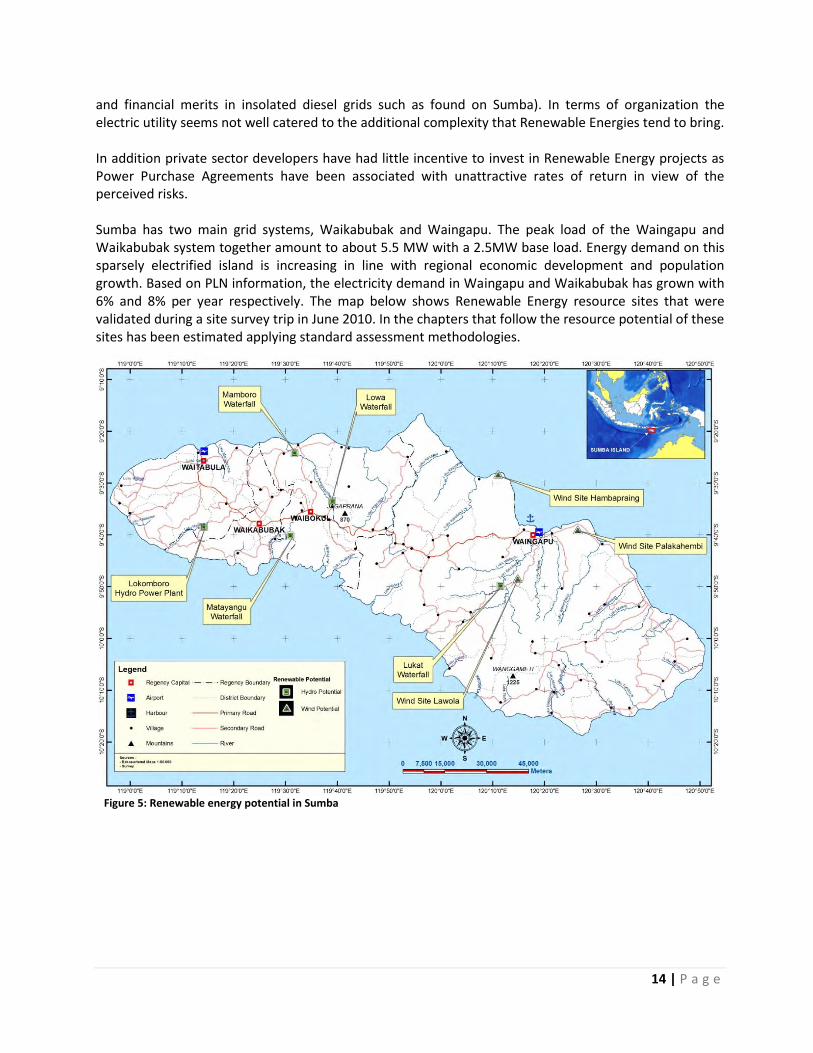
and financial merits in insolated diesel grids such as found on Sumba). In terms of organization the electric utility seems not well catered to the additional complexity that Renewable Energies tend to bring. In addition private sector developers have had little incentive to invest in Renewable Energy projects as Power Purchase Agreements have been associated with unattractive rates of return in view of the perceived risks. Sumba has two main grid systems, Waikabubak and Waingapu. The peak load of the Waingapu and Waikabubak system together amount to about 5.5 MW with a 2.5MW base load. Energy demand on this sparsely electrified island is increasing in line with regional economic development and population growth. Based on PLN information, the electricity demand in Waingapu and Waikabubak has grown with 6% and 8% per year respectively. The map below shows Renewable Energy resource sites that were validated during a site survey trip in June 2010. In the chapters that follow the resource potential of these sites has been estimated applying standard assessment methodologies.
Figure 5: Renewable energy potential in Sumba
15 | P a g e
1.3. Hydro Resource Assessment (Hydro potential on Sumba)
1.3.1 Introduction
The hydro energy resource potential is concentrated mostly in the western part of Sumba island and in addition some sites are located in the central and eastern part Sumba island. Sites in West Sumba with the most significant potential are the Lapopu/Matayangu/Wanokaka waterfall and the Lokomboro waterfall, which have a measured net ‘head’ (i.e. the measurement of vertical drop from the intake to the outlet at the proposed hydro site) of 70 meters and 45 meters respectively. The Lokomboro waterfall has been utilised to generate (up to) 800kW of electricity since 1999 and is fully owned by PLN. A PLN officer informed the survey team that additional 400kW of electric capacity is planned to build in the future. It was unclear however how this would be funded and when construction would take place4. The Lokomboro micro hydro power plant is connected to the PLN medium voltage (20 kV) of the Waikabubak grid system. Meanwhile, in the East Sumba, the site with the most significant hydro potential site is the Lukat/Maidang water, which has a measured head of 15 meters and is located about 30 km up river Kambaniru. At the Kambaniru Dam located just outside the capital of Waingapu there is an existing 8kW microhydro installation which had been installed since 1996 but fell in disrepair after flooding more than 10 years ago (an officer at the Dam did not recall the exact year). According to the Kupang Post the Kambaniru Dam was planned to be utilized for a micro hydro installation with a electric capacity of a total of 2 MW (in two phases 1 MW at the time5
. During the survey team’s visits there were no signs of any imminent construction and even a PLN planning officer was not able to shed more light on the planned construction. A number of potential hydro sites visited during the site survey trip to Sumba which took place from 16 to 19 June 2010, are discussed briefly in the chapters below. The survey focused on those locations with a relatively large discharge and height difference with the objective to identify those locations where hydro power plants could be constructed and could potentially generate electricity at a low comparative cost. It is also safe to say that Sumba also holds a significant potential for much smaller, village based hydro systems with capacities below 100 kW. The data obtained during the site survey serves a first attempt to estimate the electric potential of namely those locations that are envisioned to hold the highest potential.
4 http://datapotensi.imidap.org/index.php/potensi/listexistmmch. 5 http://image.pos-kupang.com/read/artikel/40591
16 | P a g e
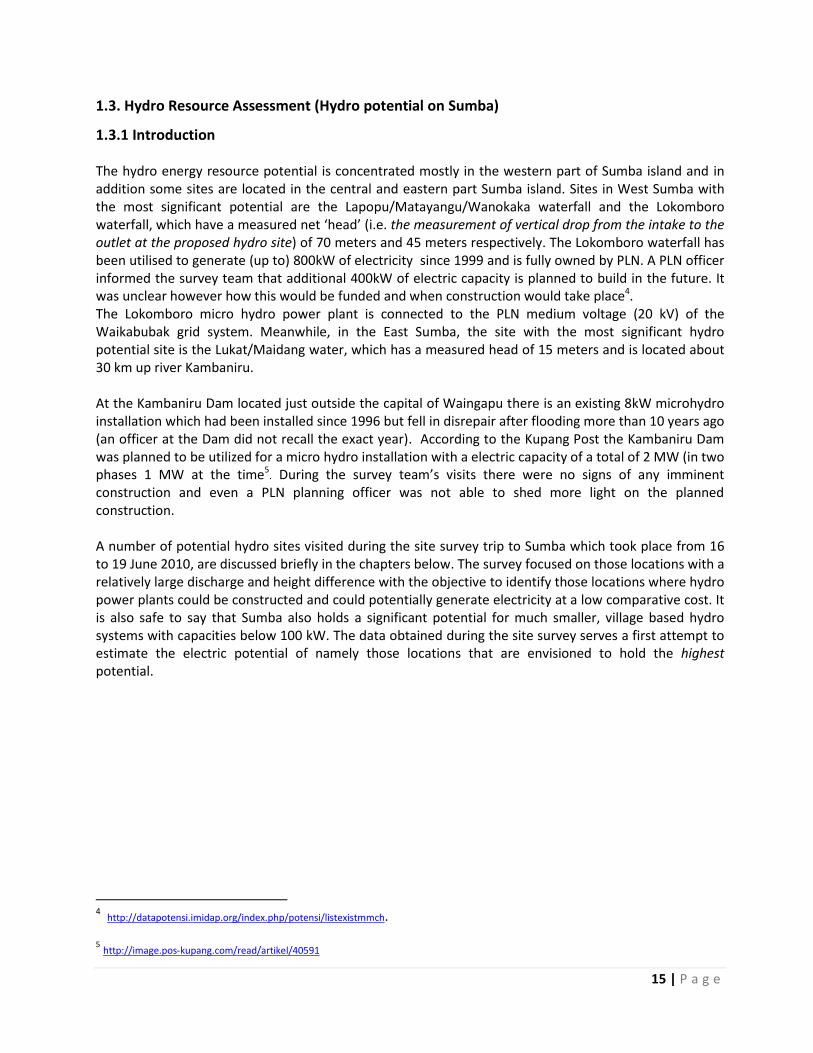
Figure 6: Estimation methods of water current flow and river cros section contour
1.3.2 Mamboro Waterfall
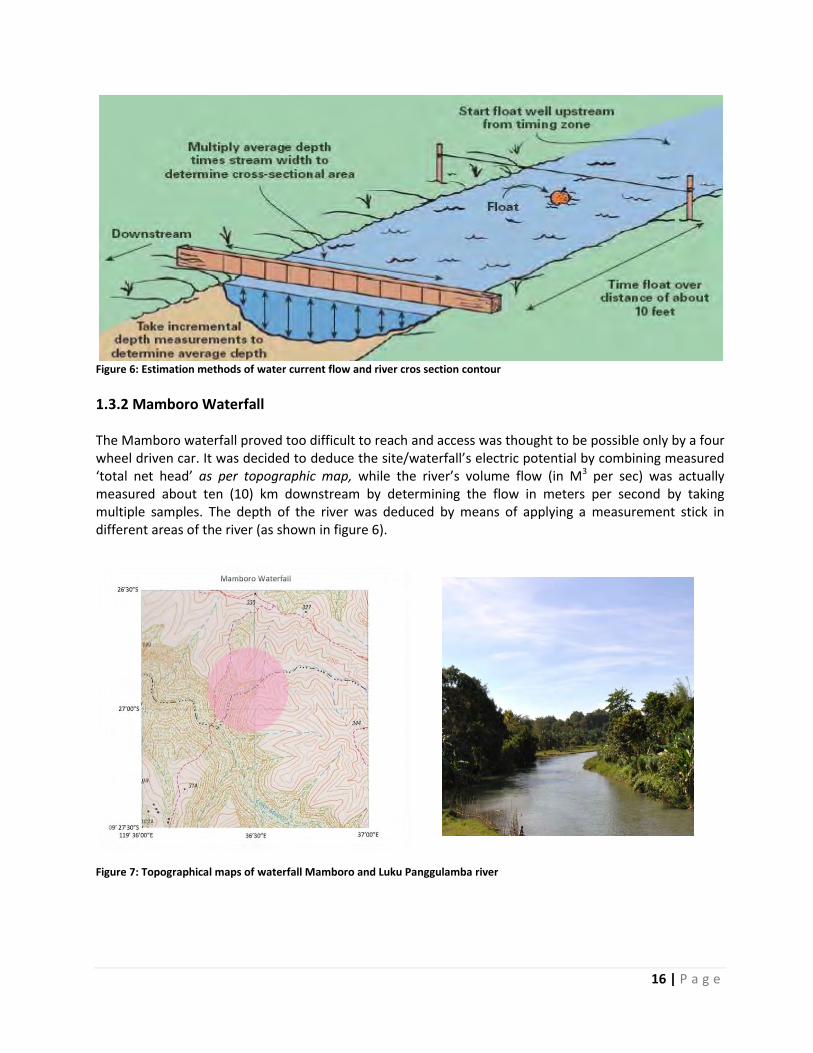
The Mamboro waterfall proved too difficult to reach and access was thought to be possible only by a four wheel driven car. It was decided to deduce the site/waterfall’s electric potential by combining measured ‘total net head’ as per topographic map, while the river’s volume flow (in M3 per sec) was actually measured about ten (10) km downstream by determining the flow in meters per second by taking multiple samples. The depth of the river was deduced by means of applying a measurement stick in different areas of the river (as shown in figure 6).
Figure 7: Topographical maps of waterfall Mamboro and Luku Panggulamba river
17 | P a g e
1 2 3 4 5 6 7 8 9 10 11 12 13 14 15 16 17 18 19 20 21 22 23 24
0.1 0.1
0.2 0.2
0.3 0.3
0.4 0.4
0.5 0.5
0.6 0.6
0.7 0.7
0.8 0.8
0.9 0.9
1 1
0.3
0
0.5
0
0.5
0
0.6
0
0.6
0
0.7
0
1.0
0
1.0
0
0.8
0
0.8
0
0.7
0
0.5
0
0.5
0
0.5
0
0.6
0
0.7
0
0.7
0
0.7
0
0.7
0
0.7
0
0.6
0
0.5
0
0.5
0
0.3
0
Note: Gray Area represents a cross section of the Mamboro River
Width River (m)
Dep
th R
iver
(m
)
Riverside
Area
(m2)
Riverside
Dep
th R
iver
(m
)
15.00
Table 2 : Luku Panggulamba river cross-section
1.3.3 Lapopu Waterfall
Figure 8 : Topographical map and picture of waterfall Lapopu/Matayangu
18 | P a g e
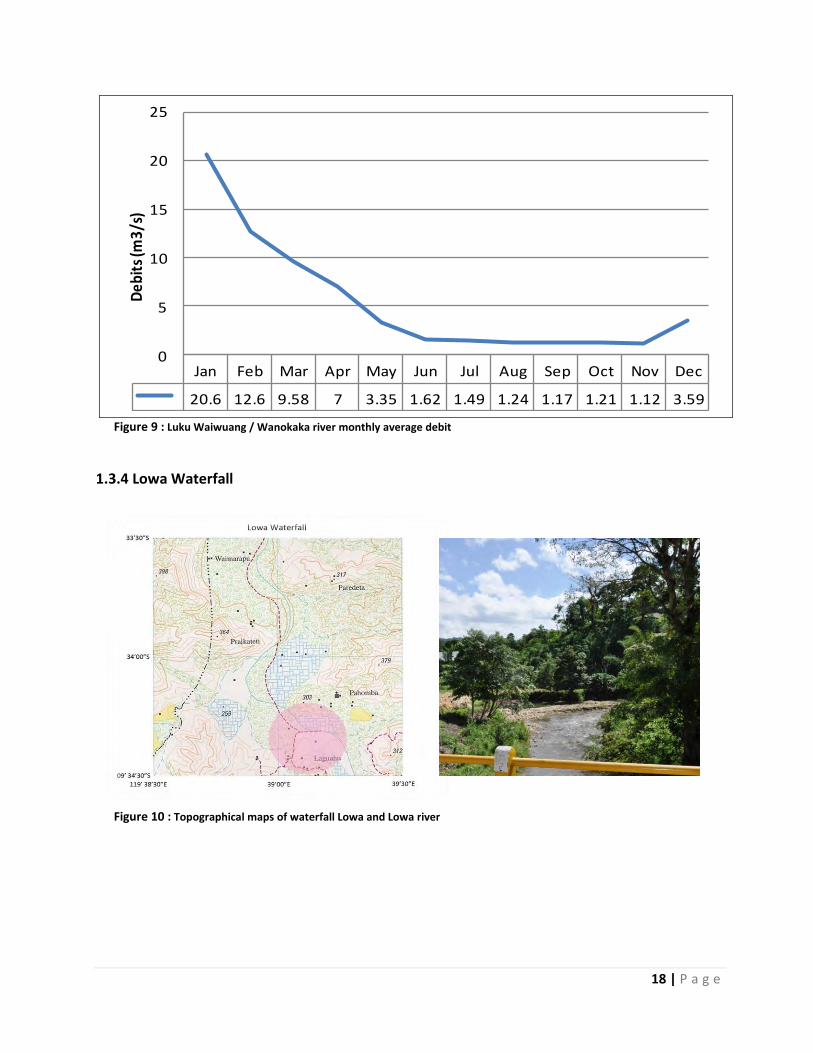
Figure 9 : Luku Waiwuang / Wanokaka river monthly average debit
1.3.4 Lowa Waterfall
Figure 10 : Topographical maps of waterfall Lowa and Lowa river
Jan Feb Mar Apr May Jun Jul Aug Sep Oct Nov Dec
20.6 12.6 9.58 7 3.35 1.62 1.49 1.24 1.17 1.21 1.12 3.59
0
5
10
15
20
25
Deb
its (
m3/
s)

19 | P a g e
1 2 3 4 5 6 7 8 9 10
0.1 0.1
0.2 0.2
0.3 0.3
0.4 0.4
0.5 0.5
0.6 0.6
0.7 0.7
0.8 0.8
0.9 0.9
1 1
0.20
0.20
0.20
0.30
0.30
0.30
0.40
0.50
0.50
0.60Note: Gray Area Represents a cross-section of the Lowa
River
RiversideWidth River (m)
RiversideDe
pth
Rive
r (m
)
Dept
h Ri
ver (
m)
Area
(m2)3.50
Table 3 : Lowa river cross section
The access road condition to waterfall Lowa is similar to Mamboro waterfall and located at the National Park/Forest area. Therefore, the ‘total head’ was deduced by referring to the topographical map, the while volume flow was measured by means of flow timing samples and measurement stick (the results are shown in table 3).
1.3.5 Lokomboro Waterfall
Figure 11: Topographical map and picture of the PLN owned micro hydro ‘Lokomboro’ 800 kw

20 | P a g e
Jan Feb Mar Apr May Jun Jul Aug Sep Oct Nov Dec
6.41 6.48 5.66 3.54 1.5 0.96 0.64 0.68 0.6 0.56 0.38 3.63
0
1
2
3
4
5
6
7D
ebit
s (m
3/s)
Figure 12 : Luku Mareha / Kalada river monthly average volume flow
1.3.6 Lukat Waterfall
Figure 13: Topographical map and picture of waterfall Lukat
The volume flow of the river was measured about 40 meters downstream of the Lukat waterfall Lukat as can de deduced from the topographical as shown in figure 13.

21 | P a g e
1 2 3 4 5 6 7 8 9 10 11 12 13 14 15 16 17 18 19 20
0.1 0.1
0.2 0.2
0.3 0.3
0.4 0.4
0.5 0.5
0.6 0.6
0.7 0.7
0.8 0.8
0.9 0.9
1 1
0.30
0.40
0.40
0.50
0.50
0.50
0.50
0.40
0.40
0.50
0.50
0.50
0.50
0.40
0.50
0.50
0.50
0.40
0.30
0.30
Note: Gray area represents a cross-section contour of the Lukat River
RiversideWidth River (m)
RiversideDe
pth
Rive
r (m
)
Dept
h Ri
ver (
m)
Area (m2) 8.80
Table 4 : Lukat river cross section
1.3.7 Kambaniru River
Figure 14 : Kambaniru dam

22 | P a g e
Jan Feb Mar Apr May Jun Jul Aug Sep Oct Nov Dec
75.8 85.7 60.6 37.8 26.8 24.3 21.6 19.8 19 18.4 13.6 63.6
0
10
20
30
40
50
60
70
80
90
Deb
its (
m3/
s)
Figure 15: Kambaniru river monthly average volume flow in M
3/s
1.3.8 Predicted Power
Figure 16 shows a typical construction of a hydro power plant. A Micro hydro is considered to function as a ‘run-of-river’ system, meaning that the water passing through the generator is directed back into the stream with relatively little impact on the surrounding ecology. Differently from ‘dam type’ hydro power plants, these run-of-river type plants use little, if any, stored water to provide water flow through the turbines. Although some plants store a day or week's worth of water, weather changes—especially seasonal changes—cause run-of-river plants to experience significant fluctuations in power output.
Figure 16 : Typical construction of micro hydro power plant

23 | P a g e
Assuming that only fifty (50) % of the water volume is utilized to generate electricity, then the potential electrical power can be calculated by using the following formula:
HQP me ....2
8.9
where: ηm = Efficiency Mechanical ηe = Efficiency Electrical Q = Debit H = Head The results are shown in table 5 below
Site Name Debit * Head Predicted Power
(m3/s) (m) (KiloWatt)
Luku Waiwuang/Wanokaka River Waterfall Lapopu
1.12 – 20.6 70 1,107
average 5.38
Luku Mareha/Kalada River Waterfall Lokomboro
0.38 – 6.48 43.5 330
average 2.59
Waterfall Lukat 3.83 25 282
Waterfall Lowa 1.82 10 54
Luku Panggulamba River Waterfall Mamboro
12.84 25 944
Kambaniru River/Dam 13.6 – 85.7
5.4 618 Avg. 38.9
Table 5: Hydro energy potential sites; estimated predicted power *) Dinas PU Data 1994 and measurement
1.4 Wind Resource Assessment (Wind potential on Sumba)
1.4.1 Introduction
From 1995-1996, a number meteorological measurement towers were commissioned on the Island of Sumba by LAPAN (Indonesian Government Space Agency), Winrock and BPPT (Agency for the Assessment and Application Technology) in order to obtain accurate windspeed data at a number of locations that showed good wind potential. By combining ‘MESO scale’ and on site wind measurements, NREL (National Renewable Energy Laboratory) developed the first ‘wind resource potential maps’ of East Nusa Tenggara. In this assessment this particular wind map is ‘revisited’ to determine Sumba’s wind energy potential. The wind map created by NREL was redrawn by means of Geographic Information System (GIS) software in order to be able to determine the surface area in KM2 as per NREL identified wind energy potential. It is important to note that these maps only serve to indicate areas of potential wind resources; on-site validation is always needed as standard errors are estimated by NREL to be in the range of 5 to 7% and from comparative empirical data Winrock it was learned that errors up to 3 times the standard error from the indicated average are not an exception. Before calculating the theoretical wind energy potential on the island of Sumba, the following chapters briefly describe three (3) sites that were visited during the site survey.

24 | P a g e
Figure 17: Wind potential map of Sumba

25 | P a g e
1.4.2 Potential Wind Sites
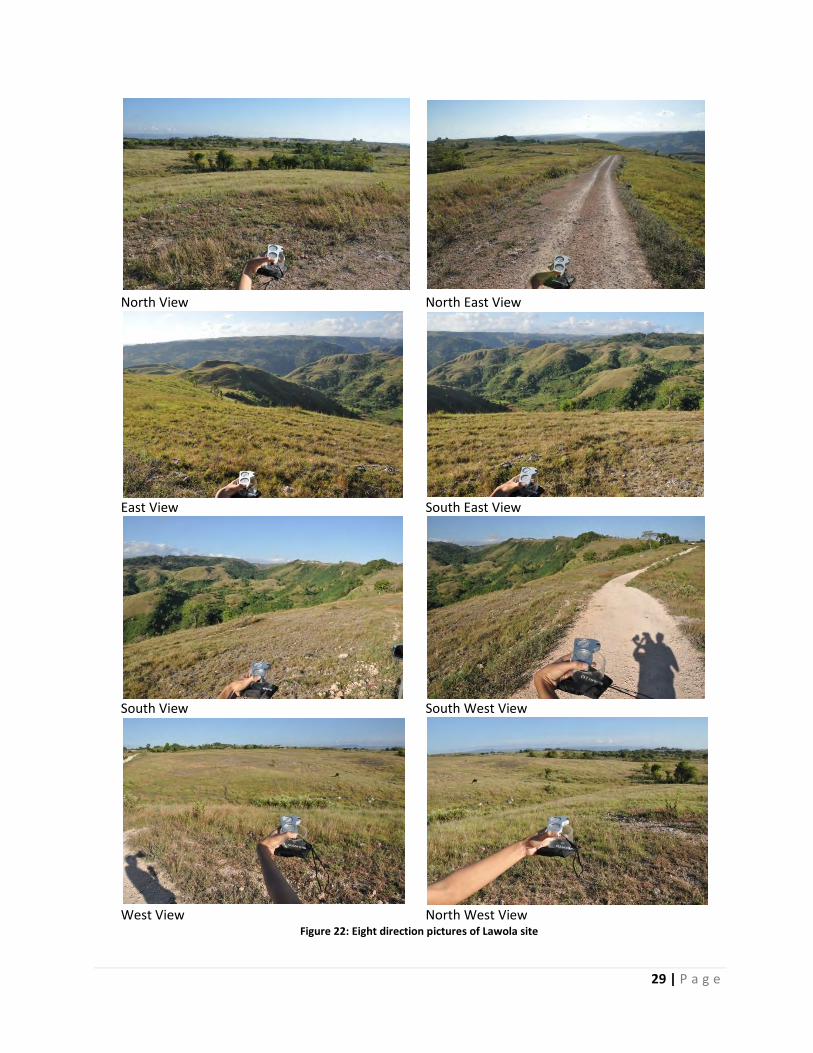
While the wind sites that were visited not necessarily show the very best theoretical wind energy potential (according to the NREL maps), at the two sites Hambapraing and Tanjung Mondu, on-site wind measurements support the availability of good wind potential. Moreover these sites are located close to PLN medium voltage grids (20 kV) and logistically not challenging (mostly straight tarmac roads from the harbor of Waingapu). The third site, Lawola, is expected to have even better wind resources although the local grid is relatively far from this site. Nevertheless this site was included here as it is close to the Lukat waterfall (about 2.5 km apart) which poses some interesting options to combine hydro and wind resources in one system. On the Island of Sumba, hybrid systems are appealing for several reasons; similarly to other tropical areas South of the Equator wind resources are notably more constant and stellar during the dry months (as a result of strong Easterly ‘trade winds’), while in the rainy season winds are less predictable from day to day and on average wind speeds are lower during this season which stretches from November to April. Excess energy available in the dry season could be utilized to pump water for either irrigation (of bio energy crops for instance) and/or ‘store’ energy by pumping water to a reservoir and support generation of electricity through the hydro electric power plant which is more suitable to support the base load of the electric grid. In short, hybrid systems could further reduce the need for expensive diesel generated power thanks to its ability to store power and manage fluctuations of the grids power demands. Just these three (3) sites have a potential in the rounded range of 129 MW to 181 MW, compared to the total installed diesel generator capacity that is a little more than 5 MW. It is fair to conclude that the wind energy could play a very significant role in electrification of Sumba. In order to pin point the very best locations ‘micro siting’ analyses based on at least 1 year of high quality wind data is required. Modern wind turbines churn out very ‘decent’ Capacity Factors (i.e. “the ratio of the actual energy produced in a given period”) in excess of 30% at sites with wind speeds in the range of 6.5 – 7.0 m/s. In line with the industry practice pictures were taken at sites in all main 8 wind directions. Moreover a topographical map of the area is shown as well (the pink transparent area denotes the area of interest).
Site Name Windspeed Available Area Predicted Power
(m3/s) (m2) (MegaWatt)
Hambapreing /Tanjung Mondu 5.0 – 5.5 6,362,737 15.11 – 20.11
33.0 – 47.0 5.5 – 6.3 5,663,640 17.90 – 26.90
Palakahembi/ Laepori 5.0 – 5.5 9,850,657 23.40 – 31.13 23.40 – 31.13
Lawola
5.5 – 6.3 10,012,499 31.64 – 47.56
72.29 – 103.13 6.3 – 7.0 1,123,763 5.34 – 7.32
8.2 – 9.1 3,371,290 35.31 – 48.26
Table 6: Potential wind energy sites and estimated potential in MW installed capacity

26 | P a g e
North View North East View
East View South East View
South View South West View
West View North West View
Figure 18: Eight direction pictures of Hambapraing

27 | P a g e
Figure 19: Topographical map of Hambapraing
Figure 20: Topographical map of Palakahembi site

28 | P a g e
North View North East View
Easth View South East View
South View South West View
West View North West View
Figure 21: Eight direction pictures of Palakahembi site
29 | P a g e
North View North East View
East View South East View
South View South West View
West View North West View
Figure 22: Eight direction pictures of Lawola site

30 | P a g e
Figure 23 : Topographical map of Lawola
1.4.3 A Prediction of Theoretical Wind Energy Power potential on the island of Sumba
The power potential per square meter on all sites on Sumba as shown in table 7 can be calculated by using formula:
3
*
23 ...
1205.3.4
....
2
1vc
DD
DvcP pp
Where: Cp = Betz Constant (0.593) = Air Density (1.225 kg/m3) v = Wind Speed (m/s) D = Rotor Diameter (m2) *) Assumption: Using 3D x 5D wind park formation
Wind Speed Power per suare meter Available Area Power Annual Energy
(m/s) (Watt/m2) (km2) (GigaWatt) (TeraWatt.hour)
4.3 – 5.0 1.51 – 2.37 n/a - -
5.0 – 5.5 2.37 – 3.16 924 2,194 – 2,920 19,219 – 25,580
5.5 – 6.3 3.16 – 4.75 1,193 3,770 – 5,667 33,030 – 49,641
6.3 – 7.0 4.75 – 6.52 364 1,727 – 2,369 15,130 – 20,754
7.0 – 8.2 6.52 – 10.47 170 1,107 – 1,779 9,695 – 15,585
8.2 – 9.1 10.47 – 14.31 178 1,863 – 2,546 16,319 – 22,304 Table 7: Prediction of wind energy potential

31 | P a g e
1.5. Solar PV Resource Assessment (Solar PV potential on Sumba)
1.5.1 Introduction
Figure 24 : Solar insolation in Indonesia
Being a tropical country, most of locations in Indonesia have a good solar radiation or ‘insolation’. The average daily solar insolation map above shows that Sumba has 5kWh/m2/day, which means that sun shines 5 hours a day with a solar radiation 1000 Watt/m2. The energy per square meter generated by solar energy in certain area may be calculated by using formula, as follow: Solar Energy = Solar Radiation x Daily Sun Hour x Available Area = Solar Insolation x Available Area If Sumba island has an area of 11,153km2, therefore the solar energy potential on the island is about 55,765 GigaWatt.
1.5.2 Potential Sites
On practically all locations in Sumba it is technically feasible to install either a stand alone PV systems, such as solar home systems or grid connected PV systems, as all locations have good solar insolation. According to data from ESDM, up to 25 thousands PV modules have been installed in Sumba altogether. According to the Kupang Post of 19 December 2009, the local government is planning to install a 3MW Photovoltaic System on a 10Ha plot at kelurahan Kambajawa, Kecamatan Kanatang. Refering to the solar insolation data from Nasa, the average insolation is about 5,543 kWh/m2/day, as shown in figure 25.

32 | P a g e
Figure 25 : Solar insolation at kelurahan Kambajawa, kecamatan Kanatang (Nasa)
1.5.3 Predicted Power
By using Homer software, the 3MW solar photovoltaic is expected to contribute 4,910,258 kWh of energy year to the PLN grid as shown in figure 26 below.
Figure 26: The monthly average production (Homer)

33 | P a g e
1.6. Biogas Resource Assessment (SMALL biogas potential on Sumba)
1.6.1 Introduction
Domesticated animals are an integral part of Sumba’s society which becomes apparent to anyone that travels through the island; in villages a diversity of pigs, horses, goats, cows and buffaloes roam around either freely, or are held in open stables and even under the traditional Sumbanese houses that are build on a raised platform; the animals stay here during the night. Herds of cows and horses roam freely in Savanna alike grasslands in which a large part of the island and is covered. Owning the cattle contributes a social status, more cattle means higher status. Sumba is also famous for its yearly returning Pasola which is an ancient war ritual by selected man that ride their colorfully decorated horses while slinging spears.
1.6.2 Desk research
The publically available data on Sumba’s biogas potential and current utilization is few and far between. One article in the Kupang post refers to a biogas installation at the village of Matawai Manringu, in district Kahaungu Eti that uses biogas for electricity6. This was confirmed by the local government’s Livestock office (Dinas Peternakan) that conveyed that the installation is still being maintained by the office, however its biogas production is now used for cooking purposes only; its gas engine that produces electricity had recently broken. In addition Kehati foundation reports that in 2007 the first biogas installation was built in the sub-district Karera where the organization has been actively involved with the local farmer community socializing the concept of intensification of cattle farming7. Kehati estimates the potential for biogas to be 2,715 M3 based on the assumptions that the sub district Karera has population 4,526 buffalos and cows that each produces and average of 15kg of manure per day, equivalent to 40 liters of gas. The estimation leans on the assumption that the villagers can be convinced to keep their cattle in barns, sheds or stables. *If one would apply SNV’s rule of thumb 1 M3 per day per 3 heads of cows the same would result is a considerable lower number i.e. 1,508 M3 of biogas]8. Finally Mr. Budi Dharma Utama of the University of Udayana shows that ESDM (Ministry of Energy and Mineral Resources) has build one biogas unit in West Sumba9.
6 http://www.pos-kupang.com/read/artikel/33818/sitemap.html 7 http://www.kehati.or.id/partners/reaktor-gasbio-pertama-di-sumba.html 8 Brochure BIRU biogas rumah “Turn Waste into Benefit” 9 http://www.ceem.unsw.edu.au/content/userDocs/P1UNDANABudiDharmaUtamaKebijakanREdiNTT.pdf
Figure 27: Traditional Sumbanese house

34 | P a g e
Figure 28: Cattle on Sumba
In order to estimate the biogas potential in the different regencies in Sumba 2008 data was obtained from the statistical agency BPS on live stock. As expected, it was found that cattle density per capita on the island of Sumba is high particularly in Central Sumba (1.41 cattle per capita), followed by West Sumba (1.06 per capita) and East Sumba (0.95 cattle per capita) which is still amongst the highest in East Nusa Tenggara area (by comparison Rote Ndao with a 1.33 cattle per capita). Rote was described in the ‘Iconic Island’ preliminary scoping report a as an island with a thriving cattle industry with 20,512 hectares, or around 16% of total land, used for grazing [and] it is known as a significant ‘exporter’ of livestock to other islands. Similarly to Sumba however, a significant portion of cattle are kept ‘free range’, grazing on natural pastures which may inhibit biogas development.

35 | P a g e
No Regency Cow Buffalo Horse Pig Goat Sheep Total Inhabitants Cattle/capita
1 West Sumba 2,585 16,611 5,526 81,003 4,116 57 109,898 103,481 1.06
2 Southwest Sumba 3,572 19,204 7,213 114,483 7,039 94 151,605 263,666 0.57
3 Central Sumba 5,336 10,145 5,650 57,265 6,516 8 84,920 60,151 1.41
4 East Sumba 35,872 29,687 28,804 72,452 37,470 4,613 208,898 220,559 0.95
Total 2008 47,365 75,647 47,193 325,203 55,141 4,772 555,321 647,857 0.86
Table 8: Large livestock population by kind and regency 2008; source: BPS, 2009. NTT in figures
Surely with almost 4 times more live stock than Rote Island, Sumba’s theoretical biogas gas potential is likely to be formidable. The table below shows the theoretical biogas potential on Sumba. The table excludes goats and sheep as collection of its manure would be problematic.
1.6.3 Stakeholder consultation
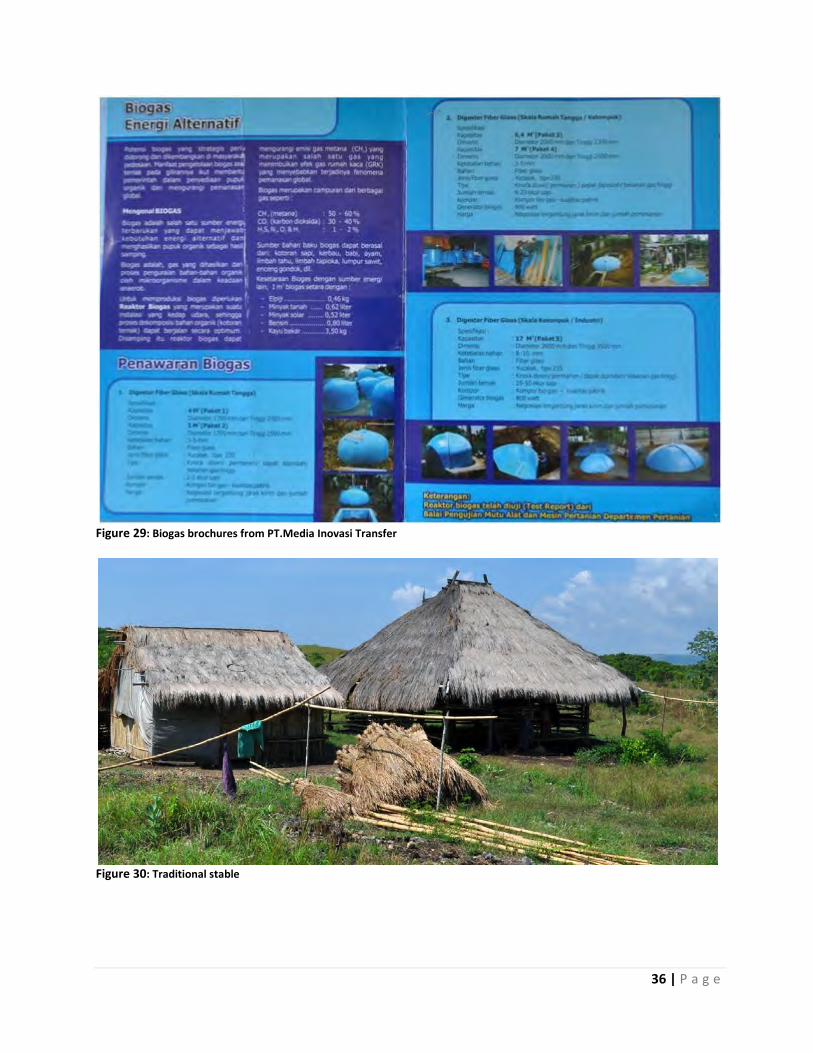
During the site survey to Sumba Island the Dinas Peternakan was visited with the objective to find out the level of understanding of biogas potential and gain knowledge of biogas projects that had been or were planned to be implemented in the regency. The head of the livestock office (Kepala Dinas Peternakan) explained that during his administration the construction of a biogas plant for cooking purposes had been programmed in 2008 and 2009 but plans had not been realized. The main problem that the office had been facing was the complete lack of knowledge on how to construct a biogas plant. Only recently a company from Bogor had offered a complete biogas installation with a carbon fiber dome structure which was viewed by the staff to be a good alternative to construct a biogas unit from bricks and cement as they lacked the knowledge to construct one. A picture of the brochure is shown below and the unit is likely to be procured this year. Having said this, the staff of the livestock office was found to be very open to alternatives if they would be given the opportunity to learn directly from biogas experts. If indeed HIVOS would be implementing biogas program in this Regency support and readiness of the local government can be expected. The predominant means of cattle breeding and keeping were described as ‘extensive traditional’. Cattle is released to the pastures during the day and watched over by a Shepherd either on foot on horse. Late afternoon the flock returns to the semi-open sheds as on the picture below or even in the stable under the traditional houses as mentioned earlier. More traditional means of breeding, where the cattle roam freely for many months are also still common, while on the other end; in villages increasing cattle is tied on fixed places grazing on nearby pastures or paddy field. Cow fattening in stables is hardly practiced on the island yet. The head of the livestock office highly recommended that any biogas programs should be targeted at ‘extensive traditional’ farmer he felt certain that large quantities would be available in these stable. It is not an exception that up to 15 cows are held in these sheds.
36 | P a g e
Figure 29: Biogas brochures from PT.Media Inovasi Transfer
Figure 30: Traditional stable

37 | P a g e
In a first attempt to quantify the potential for small biogas on the Island of Sumba two problems were encountered. Firstly there is no statistical data available on households and cattle ownership, secondly although water resources were found to be abundant in many places (especially in central highlands in West Sumba) other areas were found to be arid and water was hard to come by, which further complicates estimating biogas potential without further field research. Based on our discussions with the head and staff of the Livestock Office estimates were made on the percentage of households or families that owned in excess of three (3) cattle, i.e. buffaloes or cow. These household were also assumed to own at least 3 pigs and 1 horse. Poor households on Sumba Island, which amounts to 77 percent (!) were plausibly assumed to own less than three cattle, while the same number was assumed to be the minimum ‘resource requirement’ for a biogas installation. From the remainder, i.e. 23% household that were classified as ‘not poor’, the head of the Livestock Office estimated that 50% would have cattle in excess of three animals. As mentioned before it seems sensible to ‘target’ extensive traditional farmers for domestic biogas programs hence an additional plausible assumption was made that only 50% of the cattle’s manure is collectable (as the animal spend half the day, at night, in stables). Looking at the table below it becomes apparent that around 16,000 households could be potentially enjoying the energy benefits of small biogas plants including cooking, and possibly lightning, refrigeration and electricity generation (in addition to the implicit health benefits). Only about 29% of all livestock on the island (111,451/383,957) would be included in such a program. It is important to note this scenario that does not consider water requirement criteria hence further reduction of the actual and implementable potential can be expected. Detailed scoping would be required to get a better understanding of the realistic and implementable biogas potential on the Island.
Estimated potential for biogas assuming individual biogas plants per single household on the Island of Sumba
No Assumptions Value Remarks
1 Total no. of households 138,448 Data from 2008, BPS NTT
2 Percentage of poor households 77% Data from 2008, BPS NTT
3 Own an in excess of three (3) cows or buffaloes 50% Estimation of head of Livestock Office (Kades perternakan)
4 Gas production of manure per Kg. see below AVG figures based on range estimation by SNV
5 Percentage (%) Methane in biogas 50% http://www1.agric.gov.ab.ca/$department/deptdocs.nsf/all/afi11109
6 Estimated mitigated CO2 per biogas plant (Ton/Eq.) 5 http://www.hedon.info/ScalingUpBiogasInNepal
7 Collectable animal manure 50% As per information from 'Kades Peternakan': animals are caged at night and roam freely during the day hence half is collectible
No Cow Buffalo Horse Pig Human Total
1 Quantity as per statistical data 47,365 75,647 47,193 325,203 323,360
2 Number in one (1) household 1.50 1.50 1.00 3.00 4.68
3 Estimated manure kg/d/head 10.00 20.00 10.00 8.50 0.40
4 Collectable manure kg/d/head 5.00 10.00 5.00 4.25 0.40
5 M3 Biogas production / kg 0.032 0.032 0.032 0.050 0.024
6 M3 Biogas prod. /kg/d/head (Total=M3 per household)
0.236 0.473 0.158 0.631 0.045 1.54
7 Eq. households potentially adopting for biogas plants 15,922
8 No. of animals of which manure is collectable 23,882 23,882 15,922 47,765 111,451
9 No. of animals of which manure is not collectable 23,483 51,765 31,271 277,438 383,957
10 M3 potential Sumba per year 1,372,933 2,745,865 915,288 3,667,691 261,093 8,962,870
11 CER potential in tons of CO2/year 79,608
Table 9: Estimated biogas potential Sumba

38 | P a g e
Finally it is important to mention that Research conducted by Winrock has shown that each biogas plant is able to offset up to 5 tons on CO2 on a yearly bases. Assuming a CER value of € 10 additional carbon benefit with a value of approximately € 800,000 can be expected.
1.7. Biofuels Resource Preliminary Assessment Sumba
1.7.1 Introduction
Indonesia’s fossil reserves of oil, gas, and coal are its primary sources of energy, with 48 percent of primary energy originating from oil. Despite Indonesia’s status as a major petroleum producer, it became a net petroleum oil importer in 2004. It was not until after global oil prices soared and the country became a net oil importer that the government of Indonesia focused on the importance of biofuels as an alternative energy source. Oil prices and decline in petroleum reserves and production forced the government to reduce or lift fuel price subsidies and start to look at biofuels as a viable alternative energy source. Indonesia now sees biofuels as one of the key instruments to accelerate economic growth, alleviate poverty, and create employment opportunities, while at the same time mitigating greenhouse gas emissions. Currently, the government’s targets for ethanol and biodiesel are to produce 17.3 billion liters of fuel ethanol and 29 billion liters of biodiesel by 2025. In order to reach these targets, current production must be vastly expanded. Indonesia faces the difficult task of trying to meet its mandates by producing biofuels sustainably and without increasing forest destruction. For the production of biodiesel the GOI is focusing on expansion of Palm Oil plantations by as much four (4) million ha to produce the required amount of CPO (Crude Palm Oil) for biodiesel production. Moreover the GOI targets three (3) million ha of Jatropha to be planted and in production by 2015 to produce 4.5 million kl of CJO (Crude Jatropha Oil) per year as a feedstock for further processing and blending with HSD (High Speed Diesel). Other potential feedstocks that are considered by the GOI are amongst others, Coconut, Sunflowers, Rubber seeds and others. Cassava and Sugarcane are a prioritized feedstock for bioethanol production and a resp. 1.75 million ha and 1.5 million Ha is anticipated to be planted over the coming 5 years. Other feedstock alternatives that are being considered by the GOI are Sweet Sorgum, Sagu (Sago Palm) and Aren (Sugar Palm).
1.7.2 Biofuel Development Sumba
East Nusa Tenggara and including the island of Sumba was planned to be targeted for large scale development of particularly Jatropha in 2007. In particular critical lands were targeted for this development as Jatropha was hyped for its resilience against draught and not competitive with food crops. In a report 2007 report by the Bank Indonesia (Kupang) the potential for Jatropha and the activities on the ground are described and an excerpt is translated here. “Based on data up to 2006 there is about 4.268,58 ha planted area of Jatropha planted throughout the province.
The largest area is found in East and West Sumba [resp. 706.15 and 2,731 Ha, reds.]. With a yearly average precipitation of 1,200 mm (West Sumba) and 1,800 mm (East Sumba) these regencies are suitable to Jatropha cultivation and up until this moment [2007, reds.] development is on-going. The potential area
Figure 31 : Jathropa plantation

39 | P a g e
that can be developed in the West Sumba regency is about 200,000 ha. In 2006 the Plantation Office of West Sumba has developed 400 Ha Jatropha funded by DAU and Year 2007 carried the seeds to PTP12 Surabaya for 120 ha of land. the Plantation Office has a 10 Ha demonstration plot in the Village of Oleate, sub-district Mamboro. In the village a processing plant is available, which was granted by the Ministry of Industry that can process the Jatropha fruit to crude oil. The oil produced by the processing plant is bought by the PLN at a price of Rp. 5,000 per liter”. During the field trip to Sumba, the team attempted to validate claims as mentioned above. The first site that was visited was the village of Mamboro. Here and there on the side of the road remnants of Jatropha were found basically in its original function of hedgerows. Interviews with owners were held that we’re claiming to sell (only) up to 20 kg of dried Jatropha seeds per year. While initially a large area had been planted as instructed by the local Plantation Office, much of the seedlings were destroyed in fires. Villagers had little or no knowledge of Jatropha cultivation and sold the little yield of dried seeds to accidental buyer (that were looking for the seed). The PLN of Mamboro claimed that only one time and only one jerry can of CJO was blended with HSD to test whether or not the diesel engines were suited to the alternative fuel. Finally the location of the processing plant was not identified. On the way from Mamboro to Waikabubak a large plot of land with Jatropha in excellent condition was found. As was learned, later in a meeting with the head of the Agriculture and Plantation Office in the Regency Capital in Waikabubak the following day, this plot belonged to the Office and had been in production for 3 years. The Kepala Dinas, a Mr. Marcius Dabungke, explained that the top down approach that the government has taken towards Jatropha development was a failure. He recalled that six (6) processing plants were ‘dropped’ in West Sumba even before any planting was done. He did not know where these processing plants were located now. Mr. Marcius argued that actually little was known about the varieties of Jatropha in terms of expected yields and on the Office’ demonstration plot large variations in seed yield were from tree to tree. Moreover he argued that the Jatropha yields little fruit in arid area areas and more over that fertilizer was needed to get good results. Farmer were mostly uninterested in planting Jatropha as it is unclear what price can be expected and other (edible) crops such as Maize and Sorgum were highly preferred. He furthermore argued that up to IDR 5,000 per kg was required to entice farmers to plant Jatropha. Finally, he felt that the crop might be less suitable as a crop for small holder development; a more sophisticated plantation like approach would potentially yield better results. Biofuels from other feedstock were shortly discussed. Pak Marcius dismissed the idea to use coconut oil for biodiesel because of its relatively high market value. Both Sweet Sorgum and Cassava were dismissed as well; the poor people of Sumba would barely have enough for their own consumption, let alone for fuel production. He concluded by saying that he hoped that investors would take a cautious approach by planting a relatively small area at first to learn from the experience before investing on a large scale. Interestingly he had not given up on the potential for Jatropha in particular. Although coconut was dismissed by the head of the Agriculture and Plantations agency, it seems to be the most likely candidate for biofuels production on the island of Sumba. Sumba produces about 10,000 tons of coconut on a yearly base and as it is such a common commodity it would be relatively easy to expand. In addition excess shell and peat could, once dried, be used for biomass boilers to generate electricity. A total of 13,007 ha of coconut is already yielding and another 17,118 ha has been planted (BPS figures 2008) which if exclusively used for biofuel could yield 75 million liter of Crude Coconut Oil. The largest producer of coconut is now South West Sumba producing almost 4,000 ton in 2008, a figure that is likely to triple as almost double of the current yielding area is classified as not yielding yet. Coconut oil is suitable for the production of biodiesel and therefore it would potentially serve the demand for fuel for (1) diesel generating sets for power generation (2) diesel trucks and (3) diesel engine

40 | P a g e
power boats. Harvested area for Cassava, a main feedstock for Bioethanol, which could power small generator sets, motorcycles and cars, is currently about 10,736 hectares equivalent a total of 113,458 ton
of cassava. In theory 113,458 tons of cassava could produce 20,422,440 liters per year (based on 180 liters/ton). For both feedstock mentioned above land availability and suitability maps are not available and it is recommended that additional research is implemented to gain better insight in the relative contribution that these two crops could potentially have to meet the demand for biofuels. Careful consideration should be given to fuel versus food issues and mitigating measures that are required. While there is no official statistical data on the harvest area of ‘Lontar palm’ *Borrassus
sundaicus] it produces up to 10 liter of sugar juice a day which converses to an equivalent to 1 - 2 of
liters of bioethanol. The picture shown above was taken in on the Northern coastal road in East Sumba and is representative for the area. Research done on the island of Rote by a company called Agro Energy Indonesia suggests that only 22% of the tree juice is utilized for the production of sugar which suggest that an excess is potentially available for the production of bioethanol. The study claims that on the island of Rote a of the “Total 27,611 hectares plantation, 20,711 hectares are Borassus sundaicus plantation. Total tree population around 1 million trees (± 50 trees/hectare)”. More research is needed to get a better understanding of the planted area of Lontar on the Island of Sumba, on the supply chain of lontar palm juice and the tree’s potential to be scaled up. Technically coconut Palm is a convincing candidate for the production of biofuels on Sumba. On the other hand coconut oil market pricing is currently, even before processed to biodiesel, significantly higher than diesel fuel (> IDR 10,000 vs IDR 660010) which makes a strictly commercial approach to biofuel from coconut oil unlikely. In addition an artificially created demand (i.e. through subsidies) for coconut oil may have inflationary effects on other cooking oil as well which should be avoided as much as possible.
1.7.3 Biofuel Potential Sumba Based on Land Suitability
In order to get a more comprehensive picture of the potential for the crops prioritized by the GOI for the production of biofuels, Winrock has combined land suitability maps that combine research of Winrock and the Balai Besar Penelitian dan Pengembangan Sumber Daya Lahan (Indonesian Center for Agricultural Land Resources Research and Development). These maps provide a base for area calculation and by including average production figures of these crops and conservative conversion factors to biofuels, the theoretical potential for biofuels can be deduced. Here the objective is to point out where these areas are likely to be and to underline that these crops can actually be grown on Sumba. Cassava is not taken up in this map as no data was found available on land suitability for Cassava even though the potential clearly exists because as we have seen earlier, cassava is a common food crop grown on Sumba. From the table below it is clear that opportunities for development of biofuels are significant. The table assumes that forest areas are not included in the area calculation. Moreover areas with an annual precipitation of less than 1,000mm are excluded too (see justification hereunder) even though these
10
Non subsidized HSD (high speed diesel) fuel
Figure 32: Lontar palm plantations
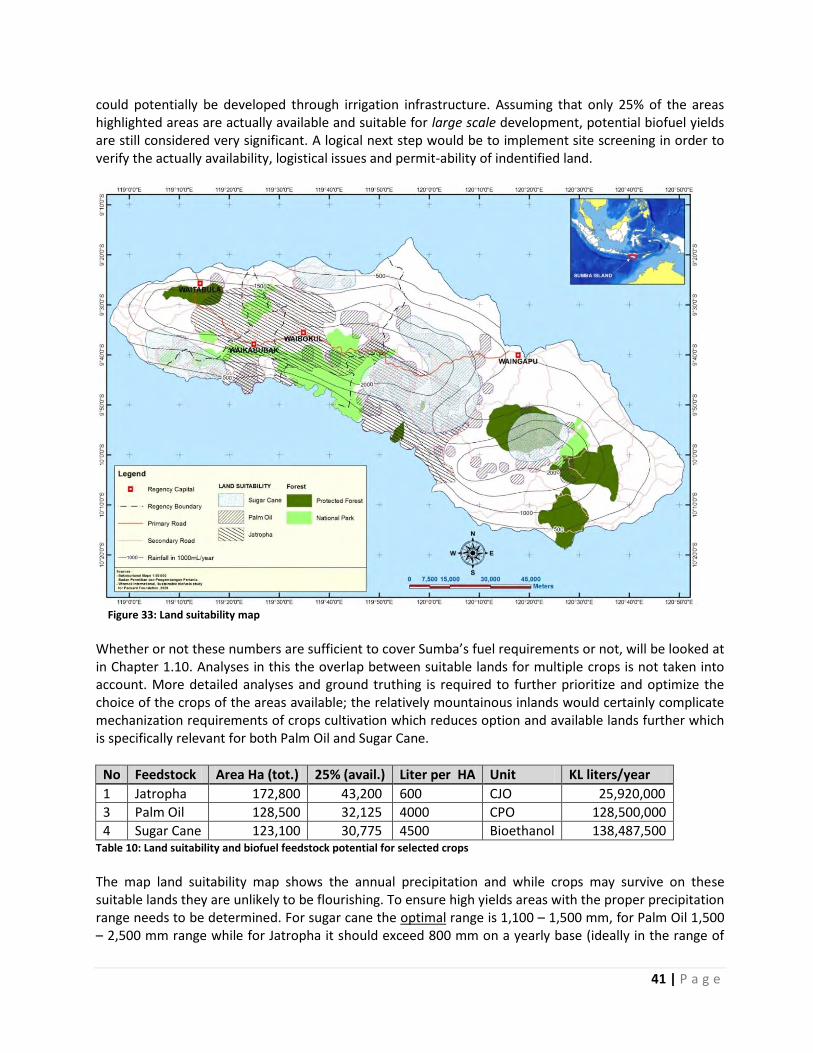
41 | P a g e
could potentially be developed through irrigation infrastructure. Assuming that only 25% of the areas highlighted areas are actually available and suitable for large scale development, potential biofuel yields are still considered very significant. A logical next step would be to implement site screening in order to verify the actually availability, logistical issues and permit-ability of indentified land.
Figure 33: Land suitability map
Whether or not these numbers are sufficient to cover Sumba’s fuel requirements or not, will be looked at in Chapter 1.10. Analyses in this the overlap between suitable lands for multiple crops is not taken into account. More detailed analyses and ground truthing is required to further prioritize and optimize the choice of the crops of the areas available; the relatively mountainous inlands would certainly complicate mechanization requirements of crops cultivation which reduces option and available lands further which is specifically relevant for both Palm Oil and Sugar Cane.
No Feedstock Area Ha (tot.) 25% (avail.) Liter per HA Unit KL liters/year
1 Jatropha 172,800 43,200 600 CJO 25,920,000
3 Palm Oil 128,500 32,125 4000 CPO 128,500,000
4 Sugar Cane 123,100 30,775 4500 Bioethanol 138,487,500 Table 10: Land suitability and biofuel feedstock potential for selected crops
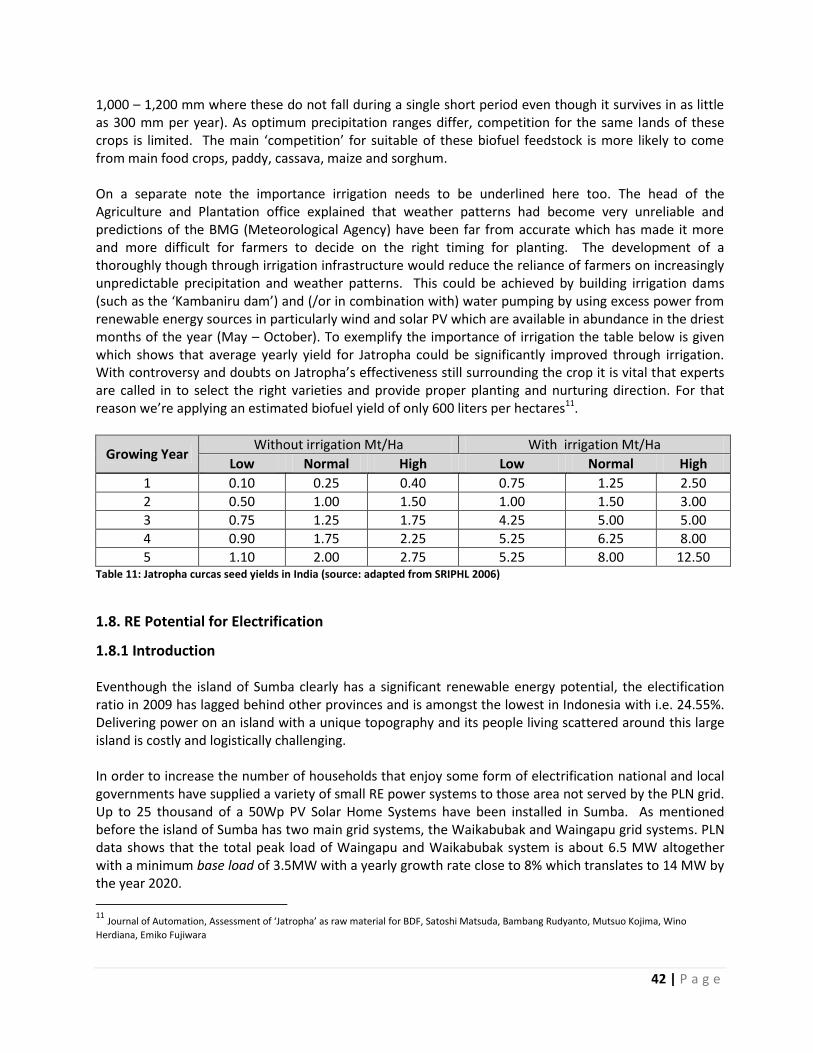
The map land suitability map shows the annual precipitation and while crops may survive on these suitable lands they are unlikely to be flourishing. To ensure high yields areas with the proper precipitation range needs to be determined. For sugar cane the optimal range is 1,100 – 1,500 mm, for Palm Oil 1,500 – 2,500 mm range while for Jatropha it should exceed 800 mm on a yearly base (ideally in the range of
42 | P a g e
1,000 – 1,200 mm where these do not fall during a single short period even though it survives in as little as 300 mm per year). As optimum precipitation ranges differ, competition for the same lands of these crops is limited. The main ‘competition’ for suitable of these biofuel feedstock is more likely to come from main food crops, paddy, cassava, maize and sorghum. On a separate note the importance irrigation needs to be underlined here too. The head of the Agriculture and Plantation office explained that weather patterns had become very unreliable and predictions of the BMG (Meteorological Agency) have been far from accurate which has made it more and more difficult for farmers to decide on the right timing for planting. The development of a thoroughly though through irrigation infrastructure would reduce the reliance of farmers on increasingly unpredictable precipitation and weather patterns. This could be achieved by building irrigation dams (such as the ‘Kambaniru dam’) and (/or in combination with) water pumping by using excess power from renewable energy sources in particularly wind and solar PV which are available in abundance in the driest months of the year (May – October). To exemplify the importance of irrigation the table below is given which shows that average yearly yield for Jatropha could be significantly improved through irrigation. With controversy and doubts on Jatropha’s effectiveness still surrounding the crop it is vital that experts are called in to select the right varieties and provide proper planting and nurturing direction. For that reason we’re applying an estimated biofuel yield of only 600 liters per hectares11.
Growing Year Without irrigation Mt/Ha With irrigation Mt/Ha
Low Normal High Low Normal High
1 0.10 0.25 0.40 0.75 1.25 2.50
2 0.50 1.00 1.50 1.00 1.50 3.00
3 0.75 1.25 1.75 4.25 5.00 5.00
4 0.90 1.75 2.25 5.25 6.25 8.00
5 1.10 2.00 2.75 5.25 8.00 12.50 Table 11: Jatropha curcas seed yields in India (source: adapted from SRIPHL 2006)
1.8. RE Potential for Electrification
1.8.1 Introduction
Eventhough the island of Sumba clearly has a significant renewable energy potential, the electification ratio in 2009 has lagged behind other provinces and is amongst the lowest in Indonesia with i.e. 24.55%. Delivering power on an island with a unique topography and its people living scattered around this large island is costly and logistically challenging. In order to increase the number of households that enjoy some form of electrification national and local governments have supplied a variety of small RE power systems to those area not served by the PLN grid. Up to 25 thousand of a 50Wp PV Solar Home Systems have been installed in Sumba. As mentioned before the island of Sumba has two main grid systems, the Waikabubak and Waingapu grid systems. PLN data shows that the total peak load of Waingapu and Waikabubak system is about 6.5 MW altogether with a minimum base load of 3.5MW with a yearly growth rate close to 8% which translates to 14 MW by the year 2020.
11
Journal of Automation, Assessment of ‘Jatropha’ as raw material for BDF, Satoshi Matsuda, Bambang Rudyanto, Mutsuo Kojima, Wino
Herdiana, Emiko Fujiwara

43 | P a g e
The question here is whether the Island of Sumba has sufficient RE resources to cover the current load and future loads. Possibly a more relevant question even so is whether a combination of RE could cover power demands at potentially lower costs. To answer the last question some analyses is required into the current cost per kWh. Benchmark pricing of 2009 indicates that the production cost of power generation at Medium Voltage (MV) amounts to IDR 2,433 per kWh (equivalent to US$ 0.26), while at Low Voltage (LV) the production cost is even higher i.e. IDR 3,072 per kWh (equivalent to almost US$ 0.32). Noteworthy too is that the selling price of electricity to the public is only IDR 630 per kWh (which is equivalent to only US$ 0.07 per kWh). As a result the PLN incurs a loss of up to US$ 0.25 per kWh it generates in this province. The HSD (High Speed Diesel) fuel component contributes 75% to the cost of power generation at MV (equivalent about US$ 0.20 per kWh). Hence any electricity generated by renewable energy source that could be produced at a cost of less than US$ 0.20 would reduce the overall cost of power generation immediately (and have considerable other social and environmental benefits).
1.8.2 PLN baseline & Planning and growth
Figure 34 shows the existing PLN 20kV medium voltage grids of Waikabubak and Waingapu system. According to a PLN planning officer systems will be interconnected by a 70kV high voltage grid. Again a clear time table is not available. The small to medium scale diesel generators and a 800kW microhydro generator have been installed on Sumba to anticipate the load demand basically close to the main road (the MV grid is located only alongside these main roads). Beside the expansion of the existing power plants, there has also been talk about the installation a coal fired power plant, a 3 MW grid connected photovoltaic system, microhydro power plants and two grid connected wind parks. None of these projects seems to have reached financial closure and there are no clear indications that any of them will on the short run. The total peak load of Waingapu and Waikabubak system is about 6.5 MW with 3MW base load. Energy demand on this island still increase in line with regional economic development and population growth.
Figure 34: Map of an existing PLN grid and power plants in Sumba

44 | P a g e
1.9. Integrated supply demand analyses
1.9.1 Waikabubak System
Based on daily load profile of May 2008 (blue line on figure 35), the base load power on Waikabubak system is only about 1.1MW with peak power of 2.4MW. By including annual load growth of 8%, in 2020 the base load will be about 3MW with peak power of 6.5MW. Currently there is already a 700 kW power deficit in Waikabubak system at peak hours (18.30 – 22.00). Increasing the PLN has had to cope with ‘rolling especially in the dry season when the reduced water flows cause the output capacity of the Hydro power plant to drop. As breakdowns and routine maintenance render generators unavailable for a shorter or longer period PLN’s ability to supply reliable power is further reduced uninterrupted (see also table 12 on generator availability).
Figure 35: Daily load at Waikabubak system
1.9.2 Waingapu System
Based on daily load profile in May 2008 (blue line in figure 36), base load power of the Waingapu system is about 1.5MW with peak power of 2.9MW. By including annual load growth of 8%, in 2009 the base load will be 4 MW with peak power of 7.88 MW. It is important to note that the current growth levels are limited by the availability of power; in other words growth levels would be significantly higher if power availability would be unlimited. Currently there is already a 100 kW power deficit in Waingapu system at peak hours (18.30 – 21.30). (See also table 13 on generator availability). Although less frequent the Waignapu system also copes with blackouts which are mainly due to stoppage of diesel generators either scheduled or not scheduled. There is just simply insufficient power generating capacity to compensate for the ad hoc loss of power from one or more generators. Currently PLN is coping by getting additional diesel generating capacity on line. In July 2009 the PLN promised that from the 1st of July there would not be any ‘rolling black-outs’ anymore 12 and although power failures still occur in the Waingapu system, scheduled blackouts have been suspended.
12
http://www.tempointeraktif.com/hg/nusa_lainnya/2010/07/09/brk,20100709-262140,id.html
0
0.5
1
1.5
2
2.5
3
3.5
0 1 2 3 4 5 6 7 8 9 10 11 12 13 14 15 16 17 18 19 20 21 22 23
MW
hour
Waikabubak System - Daily Load Curve
MTU(6) MAN 2866 MWM(5) BA 6M (3) YANMAR (2) SWD(4)
MAN 2846 KOMATSU Lokomboro YANMAR (1) Load Waikabubak Load + 35%
YANMAR (1) 100YANMAR (2) 200BA 6M (3) 95SWD(4) 220
MWM (5) 195MTU (6) 0
MAN 2866 170
MAN 2846 390
KOMATSU 440
PLTM Lokomboro 800
Total available power 2610
WAIKABUBAK SYSTEM SUPPLY
PLTD TYPE POWER (KW)
Waikabubak
Waitabula
Table 12: Operational diesel generators Waikabubak system (source: PLN NTT)
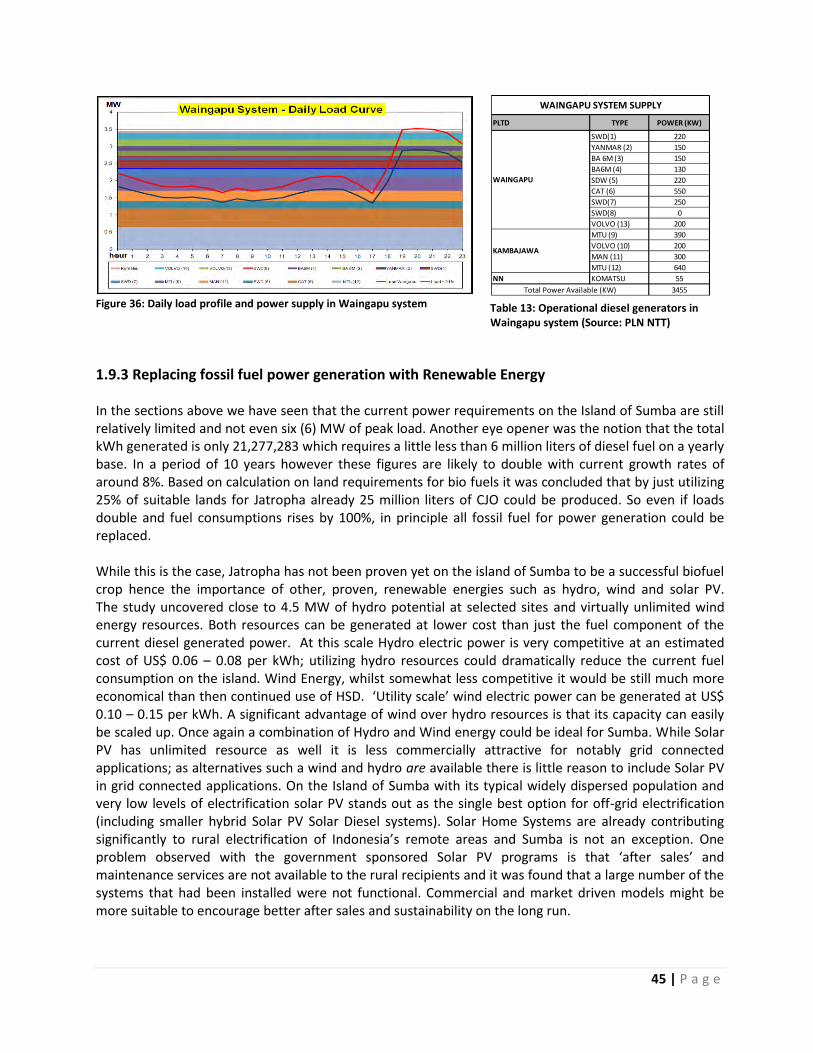
45 | P a g e
Figure 36: Daily load profile and power supply in Waingapu system
1.9.3 Replacing fossil fuel power generation with Renewable Energy
In the sections above we have seen that the current power requirements on the Island of Sumba are still relatively limited and not even six (6) MW of peak load. Another eye opener was the notion that the total kWh generated is only 21,277,283 which requires a little less than 6 million liters of diesel fuel on a yearly base. In a period of 10 years however these figures are likely to double with current growth rates of around 8%. Based on calculation on land requirements for bio fuels it was concluded that by just utilizing 25% of suitable lands for Jatropha already 25 million liters of CJO could be produced. So even if loads double and fuel consumptions rises by 100%, in principle all fossil fuel for power generation could be replaced. While this is the case, Jatropha has not been proven yet on the island of Sumba to be a successful biofuel crop hence the importance of other, proven, renewable energies such as hydro, wind and solar PV. The study uncovered close to 4.5 MW of hydro potential at selected sites and virtually unlimited wind energy resources. Both resources can be generated at lower cost than just the fuel component of the current diesel generated power. At this scale Hydro electric power is very competitive at an estimated cost of US$ 0.06 – 0.08 per kWh; utilizing hydro resources could dramatically reduce the current fuel consumption on the island. Wind Energy, whilst somewhat less competitive it would be still much more economical than then continued use of HSD. ‘Utility scale’ wind electric power can be generated at US$ 0.10 – 0.15 per kWh. A significant advantage of wind over hydro resources is that its capacity can easily be scaled up. Once again a combination of Hydro and Wind energy could be ideal for Sumba. While Solar PV has unlimited resource as well it is less commercially attractive for notably grid connected applications; as alternatives such a wind and hydro are available there is little reason to include Solar PV in grid connected applications. On the Island of Sumba with its typical widely dispersed population and very low levels of electrification solar PV stands out as the single best option for off-grid electrification (including smaller hybrid Solar PV Solar Diesel systems). Solar Home Systems are already contributing significantly to rural electrification of Indonesia’s remote areas and Sumba is not an exception. One problem observed with the government sponsored Solar PV programs is that ‘after sales’ and maintenance services are not available to the rural recipients and it was found that a large number of the systems that had been installed were not functional. Commercial and market driven models might be more suitable to encourage better after sales and sustainability on the long run.
PLTD TYPE POWER (KW)
SWD(1) 220
YANMAR (2) 150
BA 6M (3) 150
BA6M (4) 130
SDW (5) 220
CAT (6) 550
SWD(7) 250
SWD(8) 0
VOLVO (13) 200
MTU (9) 390
VOLVO (10) 200
MAN (11) 300
MTU (12) 640
NN KOMATSU 55
3455
WAINGAPU SYSTEM SUPPLY
WAINGAPU
KAMBAJAWA
Total Power Available (KW)
Table 13: Operational diesel generators in Waingapu system (Source: PLN NTT)

46 | P a g e
1.10. Transport and Fuel consumption Statistics
Available transport data is limited to statistics as can be found in the table below.
Transport Statistics Sumba 1. Fuel Consumption (L) (Pertamina - 2009)
Premium 19,500,000
Diesel 22,530,000
2. Vehicles
Cars 5,401
Motorcycles 25,431
3. Roads (km)
Tarmac 1,826
Rock 1,149
Sand 230 Table 14 : Transport statistic and fuel consumption Sumba
The roads infrastructure is relatively well developed which almost 2000 km of Tarmac roads. Surely for many of these repair is due and visitors need to anticipate a bumpy ride. Looking at the fuel consumption, in theory, all consumption could be covered by biofuels from both Jatropha and sugarcane. Surely the first objective of an island covering RE project would to reduce fuel consumption as much as possible. By introducing grid connected hydro, wind and solar PV it is anticipated that a large share of the current Diesel fuel consumption can be reduced. The main challenge for the island of Sumba will be how to significantly reduce fuel consumption for transport. The total fuel diesel fuel consumption for transport can be deduced by reducing the total amount of fuel consumption for power generation (+/- 6,000,000 liters) from the total consumption which is 22,530,000 liters annually which equal 16,530,000 liters of fuel. Further research is needed what percentage accounts for respectively road transport and sea transport. It is likely that the lion’s share of the current fuel consumption as reported by Pertamina is due to fueling of ships at the Waingapu’s harbor.

47 | P a g e
CHAPTER 2. BURU ISLAND
2.1. Geography Demography & Administration
2.1.1 Introduction
Buru is an island in the eastern part of Indonesia located in between the Banda Sea to the north and Seram Sea to the south. Buru is the third largest island in Maluku province. Both under the Dutch colonial powers and President Suharto's New Order administration, political prisoners were incarcerated on the island. While held at Buru, writer Pramoedya Ananta Toer wrote his Buru Quartet novels13. At 12,655.58 km2 which is equivalent to 15 times the size of Singapore, the island has a population of 145,870 and a density of 11.53 inhabitants / km2, which is far below the average country density of 122.48 inhabitants / km2. About 48% of its inhabitants are Islamic, 41% Christian and 11 % adhere to other religions (Buddhism, Hinduism and others). In 2008, Buru Regency was divided in two Regencies; ‘Buru’ and the ‘Buru South’ district. The capital city of Buru Regency is Namlea while South Buru’s capital city is Namrole. On the map below these regencies are shown. South Buru comprises basically the southern part of Buru Island and includes Ambalau Island to its south14. The recent separation has resulted statistical data gap and has resulted in incomplete data for the South Buru district part. Therefore some of the data used in this assessment refers to data for the whole of Buru Island prior to the separation.
Figure 37: Administrative map Buru
13 Wikipedia Buru Island 14 burukab.go.id
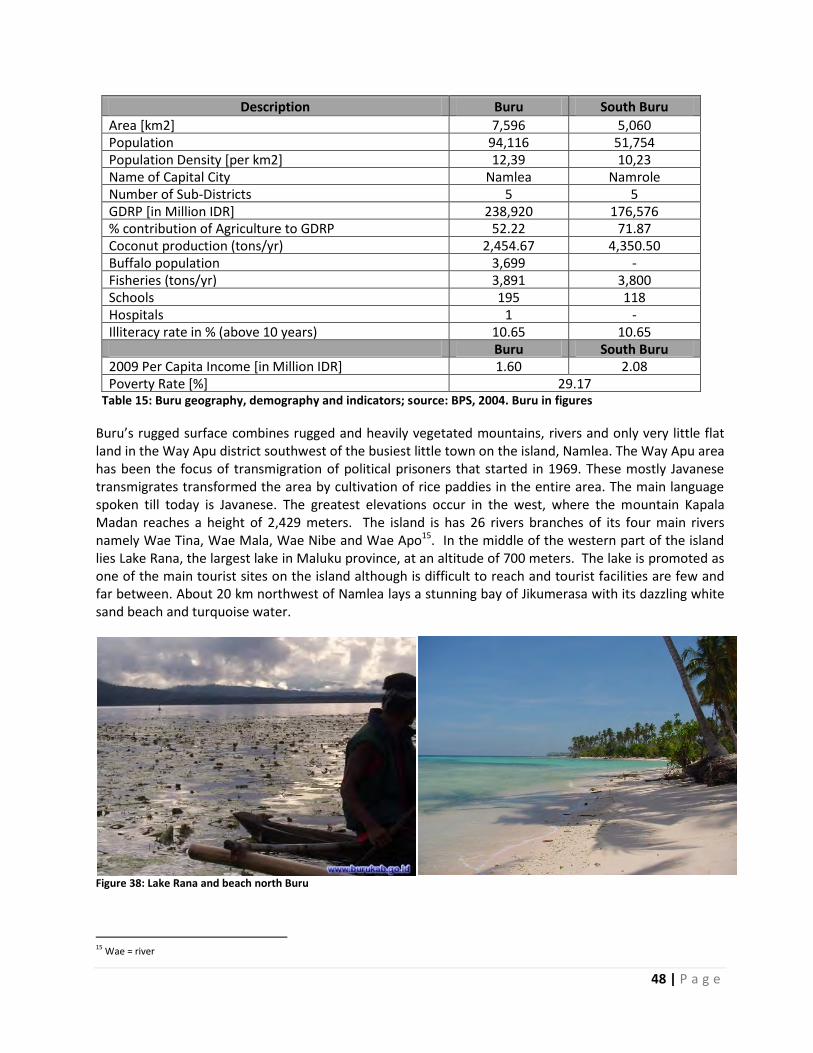
48 | P a g e
Description Buru South Buru
Area [km2] 7,596 5,060 Population 94,116 51,754 Population Density [per km2] 12,39 10,23 Name of Capital City Namlea Namrole Number of Sub-Districts 5 5 GDRP [in Million IDR] 238,920 176,576 % contribution of Agriculture to GDRP 52.22 71.87 Coconut production (tons/yr) 2,454.67 4,350.50 Buffalo population 3,699 - Fisheries (tons/yr) 3,891 3,800 Schools 195 118 Hospitals 1 - Illiteracy rate in % (above 10 years) 10.65 10.65
Buru South Buru 2009 Per Capita Income [in Million IDR] 1.60 2.08 Poverty Rate [%] 29.17
Table 15: Buru geography, demography and indicators; source: BPS, 2004. Buru in figures
Buru’s rugged surface combines rugged and heavily vegetated mountains, rivers and only very little flat land in the Way Apu district southwest of the busiest little town on the island, Namlea. The Way Apu area has been the focus of transmigration of political prisoners that started in 1969. These mostly Javanese transmigrates transformed the area by cultivation of rice paddies in the entire area. The main language spoken till today is Javanese. The greatest elevations occur in the west, where the mountain Kapala Madan reaches a height of 2,429 meters. The island is has 26 rivers branches of its four main rivers namely Wae Tina, Wae Mala, Wae Nibe and Wae Apo15. In the middle of the western part of the island lies Lake Rana, the largest lake in Maluku province, at an altitude of 700 meters. The lake is promoted as one of the main tourist sites on the island although is difficult to reach and tourist facilities are few and far between. About 20 km northwest of Namlea lays a stunning bay of Jikumerasa with its dazzling white sand beach and turquoise water.
Figure 38: Lake Rana and beach north Buru
15 Wae = river

49 | P a g e
Buru islanders recognize a clear distinction between the majority coastal people and the smaller number of mountain-dwellers. The population of the coastal region is generally Islamic, and about one third is considered indigenous, while the rest are immigrants. In the local understanding, however, immigrants are defined broadly, because many have lived on Buru for many generations since moving from other islands in Maluku. The smaller mountain-dwelling population differs from the coastal peoples in that they are not Muslim, and have limited social interactions with the coastal people and outside of the island16. The island has a tropical rainforest climate. The natural vegetation of Buru is tropical evergreen rain forest and the island has been designated as an Eco-region in its own right, and is part of the Wallacea bio-system consisting of a mixture of plants and animals from Asia and Australasia. An Eco-region is defined by the World Wild Fund as a "large area of land or water that contains a geographically distinct assemblage of natural communities". Buru rainforest is house of many endemic and near endemic flora and faunas. Bird faunas consist of 178 including 29 endemic and near-endemic species17 makes the island very popular among bird watchers18. Logging permits have had a significant impact on the islands forests. In June 1989 there were 24 official forest concessions throughout the province, representing 2,593,000 hectares, the average size being 108,000 hectares. Only Kalimantan provinces have more plywood factories and production capacity. Agriculture plays a significant important role in Buru’s economy; it contributes 54.77% to Buru’s gross domestic regional product (GDRP), whereas services account for 14%, trade hotels and restaurants for 17%, Manufacturing for 6 % and the remainder -construction, mining, transportation and finance- each contribute less than 3% to the GDRP. Buru is known in Maluku province as the main barn for rice growing and storage19. Other important agricultural products are corn, sweet potatoes, soya bean, cloves, coconut, cacao, cashew, and bananas. Poverty levels in Buru are high; in 2008 29.17% of the total population lived under poverty line20. The Poverty Gap Index (P1) is 6.15 while Poverty Severity Index (P2) is 1.56. P1 shows gap between average expenditure of the poor and the poverty line; the higher the index the wider the gap. P2 describes inequality among the poor; the higher the index the higher the inequality.
Visitors to Buru Island often purchase bottles of cajeput oil to take home as gifts. Buru Island is renowned for its high quality cajeput oil and is teeming with cajeput forests, especially in the Namlea, Waplau and Waeapo districts. Residents of Buru Island generally sell the medicinal oil, derived from cajeput or Melalueca leucadendron trees, in used and unlabeled bottles. The oil is highly sought after due to its remedial properties. It is believed to cure a number of ailments including rheumatism, ulcers, diarrhea, skin problems, fever and flu.
16 http://en.wikipedia.org/wiki/Buru 17http://www.worldwildlife.org/wildworld/profiles/terrestrial/aa/aa0104_full.html 18 http://www.indonesien.nu/indonesieneng/itinerary1.shtml 19 Buru dalam Angka 2004 20 Data dan Informasi Kemiskinan 2008
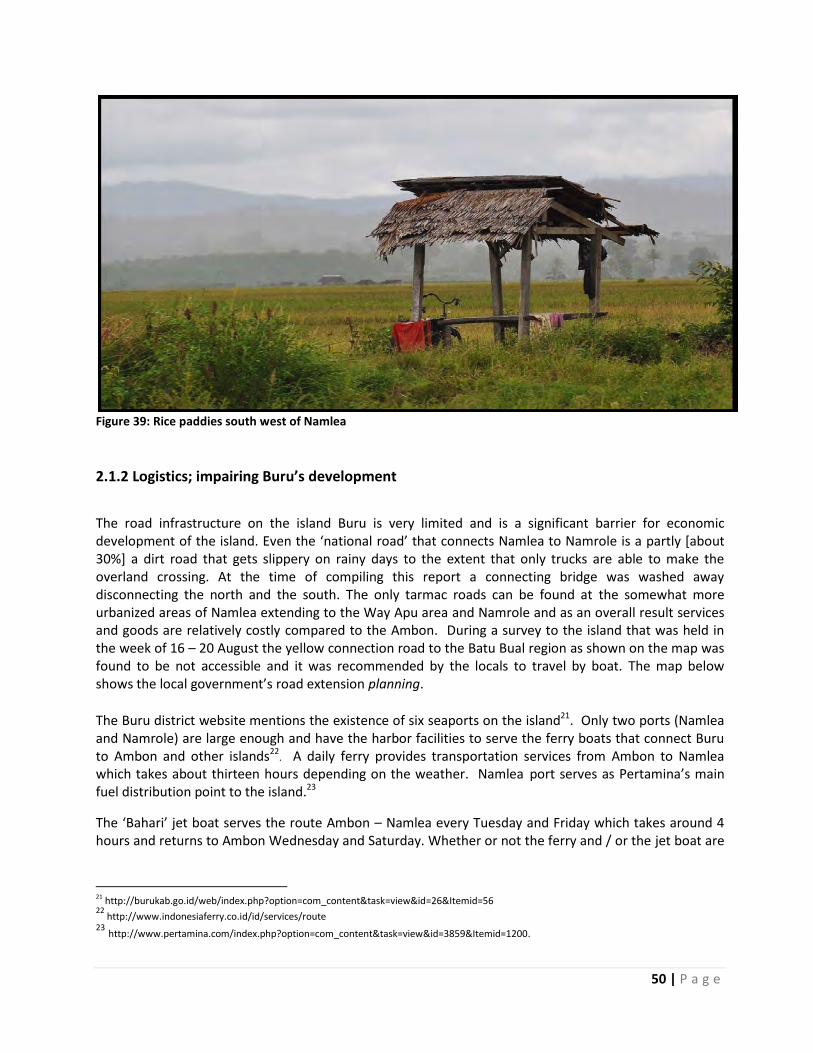
50 | P a g e
Figure 39: Rice paddies south west of Namlea
2.1.2 Logistics; impairing Buru’s development
The road infrastructure on the island Buru is very limited and is a significant barrier for economic development of the island. Even the ‘national road’ that connects Namlea to Namrole is a partly [about 30%] a dirt road that gets slippery on rainy days to the extent that only trucks are able to make the overland crossing. At the time of compiling this report a connecting bridge was washed away disconnecting the north and the south. The only tarmac roads can be found at the somewhat more urbanized areas of Namlea extending to the Way Apu area and Namrole and as an overall result services and goods are relatively costly compared to the Ambon. During a survey to the island that was held in the week of 16 – 20 August the yellow connection road to the Batu Bual region as shown on the map was found to be not accessible and it was recommended by the locals to travel by boat. The map below shows the local government’s road extension planning.
The Buru district website mentions the existence of six seaports on the island21. Only two ports (Namlea and Namrole) are large enough and have the harbor facilities to serve the ferry boats that connect Buru to Ambon and other islands22
. A daily ferry provides transportation services from Ambon to Namlea which takes about thirteen hours depending on the weather. Namlea port serves as Pertamina’s main fuel distribution point to the island.23
The ‘Bahari’ jet boat serves the route Ambon – Namlea every Tuesday and Friday which takes around 4 hours and returns to Ambon Wednesday and Saturday. Whether or not the ferry and / or the jet boat are
21 http://burukab.go.id/web/index.php?option=com_content&task=view&id=26&Itemid=56 22
http://www.indonesiaferry.co.id/id/services/route 23 http://www.pertamina.com/index.php?option=com_content&task=view&id=3859&Itemid=1200.

51 | P a g e
indeed following these scheduled routes is very dependent on the weather and wave height. At the time this report was compiled all trips had been cancelled by the harbor master already for 2 weeks in a row. NBA (Penerbangan Nusantara Buana Air) commercial flights serve the route Ambon – Namrole – Namlea – Ambon on Thursdays and Ambon – Namlea – Ambon on Fridays
Figure 40: Transportation
Cancellations of these flights are somewhat less likely to happen although getting a confirmed seat proved difficult. Airport facilities are almost nonexistent and limited to a short landing strip and a small administration office. Interestingly the airport tax is amongst the highest for domestic flights in Indonesia at IDR 50,000, IDR 30,000 more than Ambon’s central airport which charges only IDR 20,000.

52 | P a g e
Figure 41: Landing strip & airport Namlea
2.2. Renewable Energy Resource Assessment
2.2.1 Introduction
Desk research and field validation has uncovered that Buru has a significant renewable energy resource potential. Hydro, Solar and moderate wind and even geothermal energy resources have been indentified on the island. These resources are only exploited to a very limited extent as the installed capacity of RE systems is still low and only serves isolated off-grid areas. Through interviews at the Government Agency of Mining and Energy (Dinas Pertambangan dan Energi), the survey team learned that three types of systems had been installed on Buru. Firstly ‘Solar Home Systems’ with a capacity of only 50 Watt Peak that were handed out to villagers in three sub-districts, Wae Apo, Kepala Madan and Batabual. Secondly 5 kW Peak Centralized Photovoltaic systems have been installed at the Way Apu district. Thirdly, two (2) village-based Micro Hydro system have been installed in Air Buaya, Waeruba Village and Kapala Madan district. Little information was found on the system in Kapala Madan other than that it was suspected to be broken and not operational currently. The allocation of funding for these systems and implementation on site is the responsibility of DGEEU (Directorate General Electricity and Energy Utilization). Below some pictures of these systems are shown.

53 | P a g e
Figure 42: Renewable energy potential in Buru
Diesel fueled power generation is the primary source of electric power and as a result the Cost of Energy (‘COE’) reaches almost IDR 3,000 per kWh which is equivalent to US$0.33. The head of PLN Planning in Ambon confirmed that these figures are correct. Especially in the months that the Western wind blows strongly (December and January) a shortage of diesel fuel supplied to the islands cause lengthy power outages. During the team’s visit to Buru villagers has staged a protest at the PLN office to voice their discontent with the unreliability of the electricity supply. Although Renewable energy is not yet utilized to support the PLN grid in the area, there is one Jakarta based a private development company, PT Binatek Reka Energi, that is seeking investors to invest in hydro projects on the island (without success so far). Private sector developers have had little incentive to invest in Renewable Energy projects as Power Purchase Agreements have been associated with unattractive rates of return in view of the perceived risks which is even more so the case on remote islands like Buru. The map below shows Renewable Energy resource sites and includes those that were validated during site survey trip that took place in August 2010 from 14 to 17 September. In the chapters that follow the resource potential of these sites has been estimated applying standard assessment methodologies. In addition desk research was done in order to arrive at a more complete picture of the RE sources that can be found on Buru.

54 | P a g e
Figure 43: Micro hydro (25 kW) and 50 W Solar home system Buru
Figure 44: 5 kW Photo voltaic system and solar PV pump system
The table below gives an overview of the current status of Renewable Energy utilization on Buru.
No Renewable Power Plant Installed Planning (2010-2014)
1 Micro Hydro 25 kW by DJLPE - ESDM -
2 5 kW Centralized PV 1 unit 7 units
3 50 Wp Solar Home System 67 units by DJLPE - ESDM -
Total Capacity ± 35 kW 350 kW
Table 16: The utilization of renewable energy in Buru island
2.3. Hydro Resource Assessment (Hydro potential on Buru)
2.3.1 Introduction
Hydro energy resource potential can be found in most parts of Buru Island. Its relatively high annual precipitation in especially the mountainous in-lands has given way to existence a great many smaller and larger streams. The Government Agency for Mining and Energy confirmed this and pointed out that indeed village based hydro systems could be a significant contributor to rural electrification. Recollecting an the event of a system that broke swiftly after installation and never got repaired, a staff member of

55 | P a g e
the agency however underlined the importance of a solid institutional set up at village level in order for these projects to be long lived and sustainable. Rivers Way Nibe, Way Geren and Way Tina have been identified to hold a significant hydro electric potential. Feasibility studies performed by Department for General Works (Department PU) have shown a significant potential although the flow/debit has exhibits large fluctuations from season to season. Both Way Geren and Way Nibe have been extensively studied in 1994. Obviously this data would need to be verified as forest degradation may have significantly reduced the capacity of its watershed catchment area. The ‘Google Earth’ satellite pictures show heavily deforested catchment area of the river Nibe and the existence of a large logging operation in the same are supports that assertion. A planning manager at PLN district confirmed this and conveyed similar information that he had learned from his discussions with hydro development company PT Binatek. In the following chapters we have excluded therefore the river Nibe’s assumed potential as it is unrealistic that these hydro sources are being developed.
Figure 45: Satellite picture of deforestation and logging operation
The Way Geren is the biggest river and has a monthly average debit of 8.58 m3 / second. The river is located on the Eastern part of Buru island, close to the main road and medium voltage grid. Meanwhile Way Nibe is located on the center of the island. Way Nibe was found to have a monthly average debit of 8.55 m3/second (in 1994) which is similar to Way Geren river’s debit. As heavy deforestation inevitably has taken its toll on Way Nibe’s catchment area, it is excluded from further analyses. Way Geren was visited on the 19th of September and to the team’s surprise an irrigation dam was it its final stages of construction. Irrigation canals on the East side of the river were already in operation while the irrigation canal on the West side of the dam was scheduled to be finished in Q3 2010.
Figure 46: Way Geren Dam and monthly average debit fluctuations

56 | P a g e
The project site project is located at about 20 km from Namrole which is the capital of Kabupaten Buru Selatan of Maluku Province. The Sungai Tina (Tina River) is one of the largest rivers in the southern part watershed of BuruIsland. The site is located in Kecamatan Namrole approximately at 3° 44’ South Lattitude and 126° 44’ East Longitude. Sungai Tina’s upper reach is at Tefdula, Taglasmiten, Fatianpun and Ngefuha Mountains and has watershed around 250 km². Average annual rainfall in the area is 2,500 mm per year. Sungai Tina runs to the south direction and empties on the southern area of Buru Island. Most of Sungai Tina watershed is forest with mountains and bushes.
2.3.2 Predicted Power
A Micro hydro system is designed to function as a ‘run-of-river’ system, which means that the water passing through the generator is directed back into the stream with relatively little impact on the surrounding ecology. Differently from dam type of hydro power plants these plants use little, if any, stored water to provide water flow through the turbines. Although some plants store a day or week's worth of water, weather changes—especially seasonal changes—cause run-of-river plants to experience significant fluctuations in power output. Assuming that only fifty (50) % of the water volume is utilized to generate electricity, then the electrical power can be calculated by using the same formula as used in Sumba assessment and the results are shown in table below. It is important to underline once more that power fluctuations from season to season could vary up to 75% and in the driest season only about 1 MW of ‘firm’ power is likely to be available. Fortunately the dry season in this part of the world coincides with strongly southeasterly winds that could compensate for reduced power output in those months.
River Debit (m3/s) Head (m) Predicted Power (kW)
Way Tina 14 65 ± 2,675
Way Geren 8.58 50* ± 1,250
Table 17: Predicted power from hydro energy potential sites (public work department) *) Assumption
2.4. Wind Resource Assessment (Wind potential on Buru)
2.4.1 Introduction
There are two basic types of wind application technologies, i.e. those that are designed for remote and off grid locations and those that support and are interconnected to the national grid (or even isolated grids). In a standard configuration the off grid type is (usually) used along with small diesel or back-up battery to electrify the remote villages with small loads. Meanwhile the on grid type is conected to an existing medium voltage grid with the chief objective to reduce fuel consumption. For this type ideally sites are chosen that are close to the MV grid and logistically not over-demanding in order to keeps cost in score. With its many small and isolated fishing villages along its coastline it is worthwhile to consider these standalone applications as an appropriate electrification option. Differently from East Nusa Tenggara a detailed wind resource map is not publically available for Maluku province. There is however a number sources of publically available data that does provide us with clues on wind resources in this area. These are; (1) airport wind data, (2) NASA data, (3) third party wind data.

57 | P a g e
(1) Airport wind data Airport wind data was obtained from the year 200224. The data is very course as wind data is summarized as daily average wind speed data. The lowest average wind speed was recorded in January (2.6 m/s @ 10 meters height) while the highest average wind speed was reached in September of that year (6.5 m/s @ 10 meters height). An annualized average wind speed at the airport of Namlea in the year 2002 is estimated at 4.4 m/s. This would be considered to be a moderate wind speed. In addition the survey team obtained monthly wind speed data that confirmed the resource to be moderate between 6 and 10 knots which is equivalent to 3.08 and 5.14 m/s
Figure 47: Weather station at Namlea airport and wind speed data (2003, 2005, 2006, 2007 and 2008)
It is well known that wind speeds increase with increasing height which explains the industry trend towards larger and higher turbines. However the extent to which wind velocity increases depends much on surface roughness. Surface roughness refers to all generally all obstacles in the area where the wind measurement is taken and includes vegetation (form and height) and buildings and dwellings. Increased ‘roughness’ results in a higher ‘shear exponent’, a mathematical constant that is applied in a logarithmic formula to calculate expected wind speeds at different heights. For any location the shear exponent is deduced from (long-term) measurements at two different heights. On a location such as Namlea airport which is open and nearby to the sea, a low shear exponent is expected. However as we have only one measurement at one single height the ‘shear exponent cannot be deduced. Instead we apply a roughness ‘class’ here; where ‘0’ refers to zero roughness (‘sea surface’) and ‘4’ high roughness (‘densely forested area, high trees and or buildings’). The table below helps us to estimate wind speeds at greater heights. We are particularly interested to know what wind speeds can be expected at the ‘hub height’ of modern wind turbines that could be connected to the local MV grid of Namlea. Assuming a low wind roughness (Class 1) the table below predicts a wind speed of 5.62 m/s at 50 meters height which would translate to an average power output of 20 – 25% of the nominal capacity of a modern turbine. In other words, if one would install for instance a 1,000 kW (= 1 MW or Mega Watt) wind turbine with a height of 50 meter at the (airport) of Namlea, it would produce on average 200 – 250 kW. Assuming that generating 1 kWh requires 0.28 liters of diesel fuel, a fuel consumption reduction on a yearly basis of 598,080 liters (=250 x 24 x 365 x 0.28 ) is realistically achievable with the introduction of 1,000 kW of installed wind power.
24
www.wunderground.com

58 | P a g e
Wind Roughness Class Factor ranging from 0 - 4
0 1 2 3 4
100 meter 5.33 6.15 6.60 7.55 9.93
90 meter 5.29 6.07 6.15 7.40 9.68
80 meter 5.24 5.97 6.39 7.25 9.40
70 meter 5.19 5.87 6.25 7.06 9.08
60 meter 5.13 5.76 6.11 6.85 8.70
50 meter 5.05 5.62 5.94 6.60 8.26
40 meter 4.96 5.45 5.72 6.29 7.73
30 meter 4.84 5.24 5.45 5.90 7.04
20 meter 4.68 4.93 5.06 5.35 6.07
10 meter 4.40 4.40 4.40 4.40 4.40
Table 18: Wind Roughness Class reference table
(2) NASA Wind Data NASA Wind and other meteorological data are downloadable from the following Website [http://eosweb.larc.nasa.gov/sse/]. The data only shows monthly averages but it includes wind direction. A simple wind map that was drawn up for the Province Maluku is shown here below which confirm the wind speeds as measured at the airport of Namlea. The wind speeds shown on the represent expected wind speeds at 50 meters height. The data furthermore suggest that the prevailing wind blows, as expected, from the East (‘Easterly trade winds’)
Table 19: Nasa Wind Data
4.37 4.48 4.58 4.54 4.51 4.43 4.32 4.21 4.11
3.0 - 3.5 m/s
4.42 4.51 4.6 4.52 4.45 4.35 4.22 4.10 4
3.5 - 4.0 m/s
4.45 4.57 4.68 4.55 4.43 4.29 4.13 3.98 3.89
4.0 - 4.5 m/s
4.53 4.67 4.81 4.64 4.48 4.27 4.03 3.79 3.72
4.5 - 5.0 m/s
4.64 4.81 4.99 4.79 4.59 4.3 3.92 3.54 3.47
5.0 - 5.5 m/s
4.78 4.96 5.15 4.97 4.80 4.51 4.11 3.72 3.51
5.5 - 6.0 m/s
4.93 5.11 5.30 5.20 5.11 4.91 4.61 4.31 3.83
> 6.0 m/s
5.10 5.26 5.43 5.41 5.38 5.28 5.08 4.88 4.38
5.27 5.41 5.06 5.59 5.63 5.61 5.53 5.45 5.16

59 | P a g e
(3) Third party wind data A number of world renowned wind energy consultants offer sophisticated and high resolution (and high cost) wind maps that do not require on site measurement. Two well-known US companies that have these capabilities are ‘AWS Truepower’ and ‘3TIER’. The second company cooperates with a manufacturer of small wind turbines ‘Southwest Windpower’ that provides a special service to its clients; using a web based interface potential buyers are encouraged to check out the estimated wind speeds and suitability (for small wind power applications) of any site in the world. A screen shot of a location just 1 km east of the landing strip at Namlea shows ‘excellent’ potential and claims the following; “It appears that your location has excellent wind speeds and will support the use of a wind turbine, depending on specific conditions at your site. Note: 45 ft (14 m) height assumed”. In a similar fashion other sites were sampled for a reading of estimated wind speeds and two sites were visited for a closer look. While this web based tool is very helpful for a ‘first look’, risks associated with relying on interpolated wind data for utility scale wind applications is too high and it is highly recommended to do on-site wind measurements for a period of at least 1 year.
Figure 48: - Wind speed estimation with Web based tool
Three sites that were indentified with the use of this web based tool were visited and picture in all wind directions were taken. These sites are shown in the following paragraphs and shortly discussed.
(4) Potential Wind Sites Batu Bual district, Village of Seith The first site that was visited is located in the easten part of Buru island on the hilly coast line. It takes about half an hour to reach to the site by a speed boat from the harbor of Namlea. Standard (‘non four-wheel drive’) cars do not have access to this site overland. Unfortunately the survey team concluded that although wind resources might be very good at this particular site access and remoteness would render it very costly to develop utility scale / grid connected wind power. Some small fishing villages can be found along this coast. Small scale wind and Solar PV energy systems would therefore be a more appropriated technology to bring electricity to these villages.
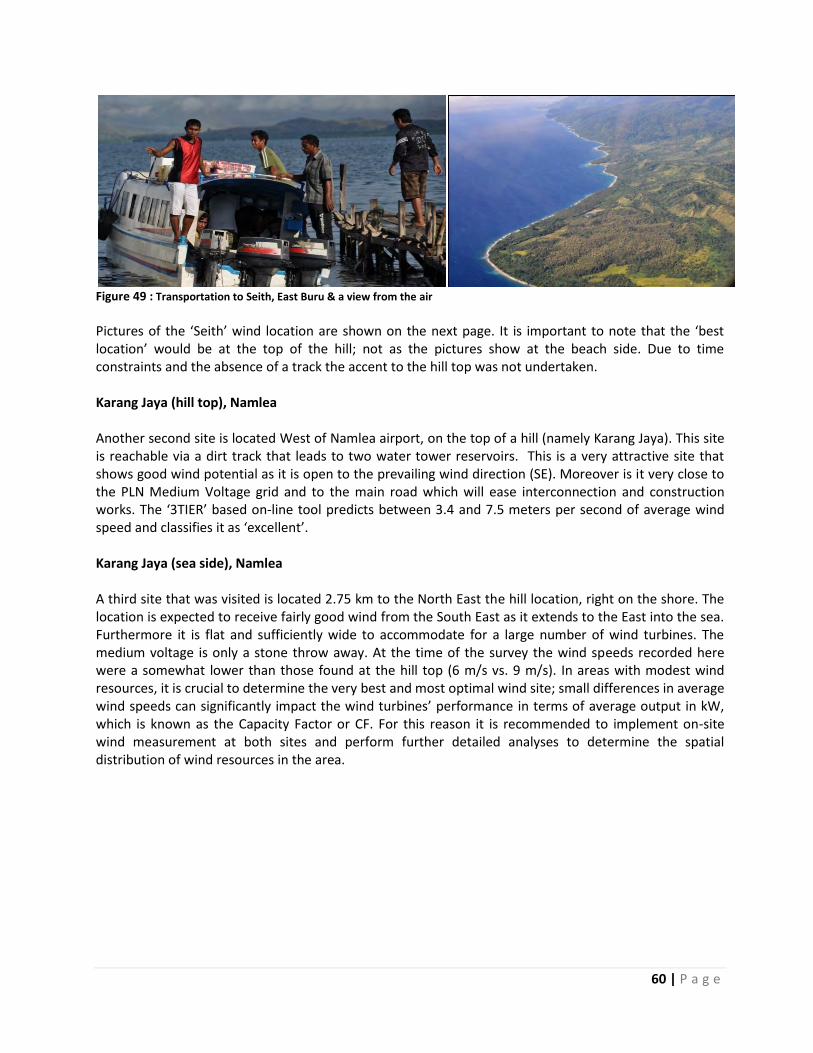
60 | P a g e
Figure 49 : Transportation to Seith, East Buru & a view from the air
Pictures of the ‘Seith’ wind location are shown on the next page. It is important to note that the ‘best location’ would be at the top of the hill; not as the pictures show at the beach side. Due to time constraints and the absence of a track the accent to the hill top was not undertaken. Karang Jaya (hill top), Namlea Another second site is located West of Namlea airport, on the top of a hill (namely Karang Jaya). This site is reachable via a dirt track that leads to two water tower reservoirs. This is a very attractive site that shows good wind potential as it is open to the prevailing wind direction (SE). Moreover is it very close to the PLN Medium Voltage grid and to the main road which will ease interconnection and construction works. The ‘3TIER’ based on-line tool predicts between 3.4 and 7.5 meters per second of average wind speed and classifies it as ‘excellent’. Karang Jaya (sea side), Namlea A third site that was visited is located 2.75 km to the North East the hill location, right on the shore. The location is expected to receive fairly good wind from the South East as it extends to the East into the sea. Furthermore it is flat and sufficiently wide to accommodate for a large number of wind turbines. The medium voltage is only a stone throw away. At the time of the survey the wind speeds recorded here were a somewhat lower than those found at the hill top (6 m/s vs. 9 m/s). In areas with modest wind resources, it is crucial to determine the very best and most optimal wind site; small differences in average wind speeds can significantly impact the wind turbines’ performance in terms of average output in kW, which is known as the Capacity Factor or CF. For this reason it is recommended to implement on-site wind measurement at both sites and perform further detailed analyses to determine the spatial distribution of wind resources in the area.
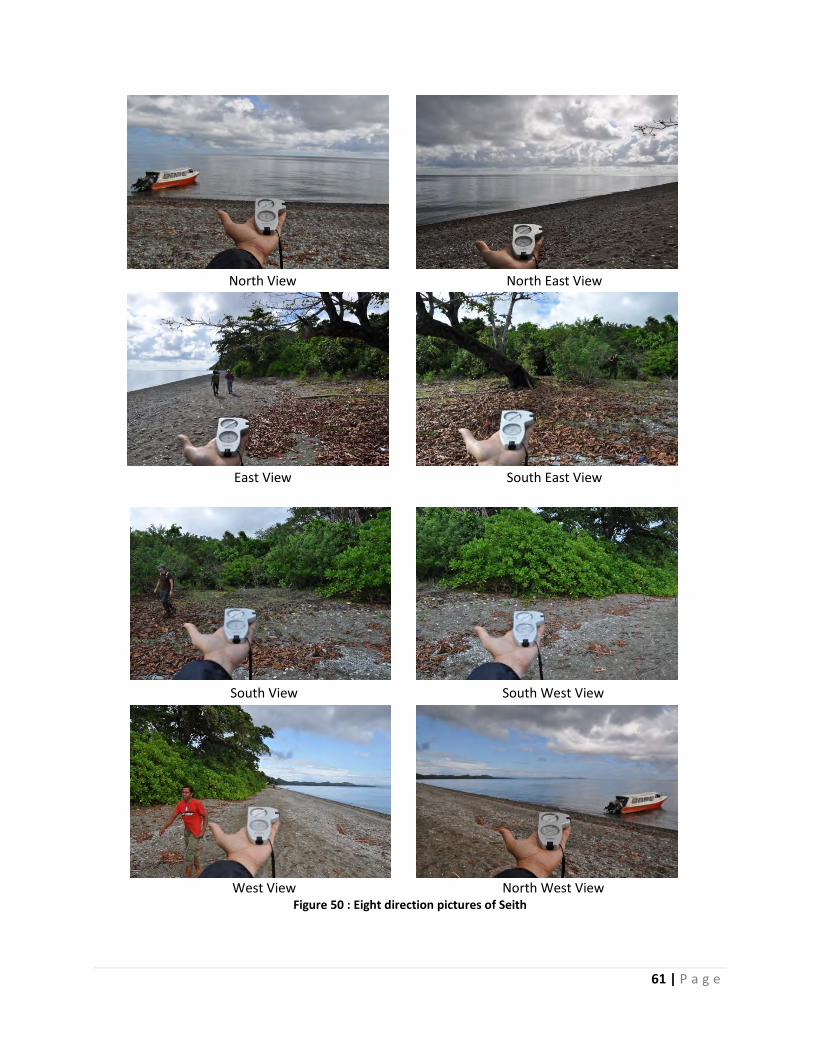
61 | P a g e
North View North East View
East View South East View
South View South West View
West View North West View
Figure 50 : Eight direction pictures of Seith

62 | P a g e
Figure 51: Eight direction pictures of Karang Jaya
North View North East View
East View South East View
South View South West View
West View North West View
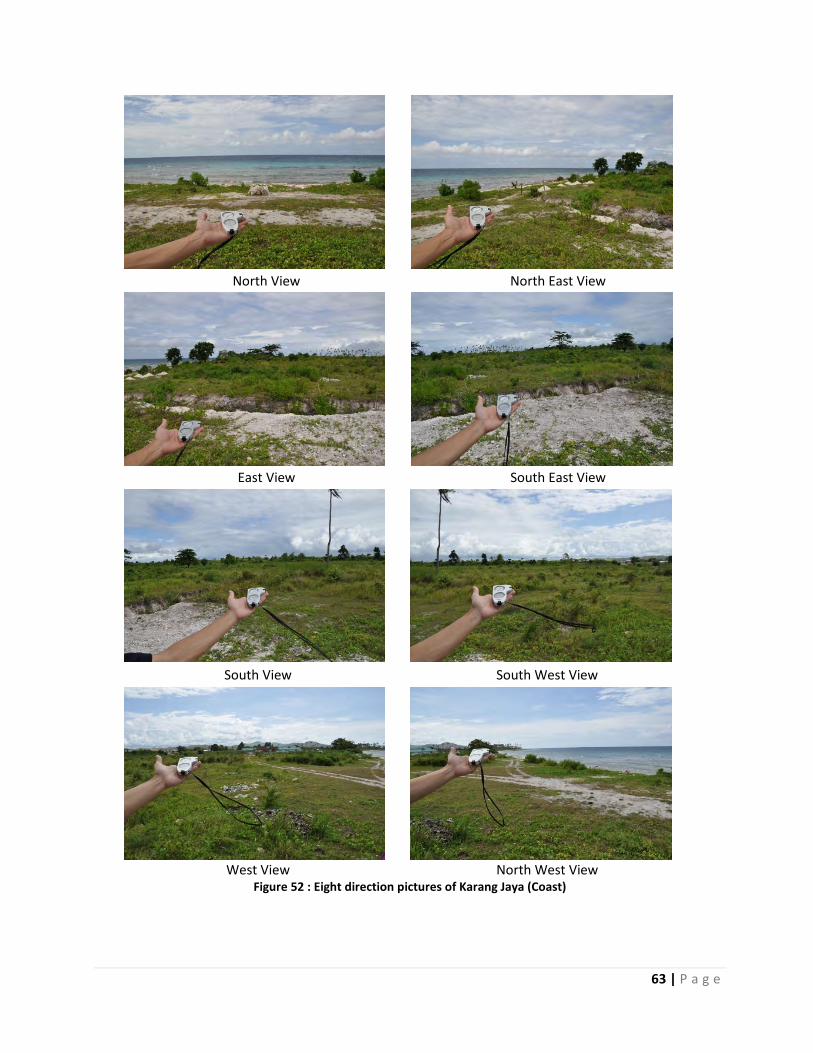
63 | P a g e
North View North East View
East View South East View
South View South West View
West View North West View
Figure 52 : Eight direction pictures of Karang Jaya (Coast)

64 | P a g e
2.4.3 A Prediction of Theoretical Wind Energy Power potential on the island of Buru
By using the same formula as used in Sumba island, the power generated per square meter on potential sites in Buru island is shown in table 20.
Site Name Wind Speed (m/s) Available Area (m2) Predicted Power (MW)
Seith
6.5 – 7.0 40,000
5.9 – 7.2 7.0 – 7.5 520,000
7.5 – 8.0 240,000
8.0 – 8.5 40,000
Karang Jaya (Hilltop)
6.0 – 6.5 1,200,000 4.9 – 6.3
Karang Jaya (Coastal)
6.0 – 6.5 120,000 2.6 – 3.2
6.5 – 7.0 400,000 Table 20: The estimatation of Wind energy potential on potential sites
The wind energy potential from these three sites only is significant and likely to be able to significantly contribute to the power requirements of Buru. As wind resources were found to be very site specific on Buru, grid connected wind power seems to be a better and more appropriate technology that standalone applications unless wind resources are found close to potential load centers (i.e. villages). The advantage of grid connected wind power becomes apparent when one considers that large amounts over power can be transported from the most optimal wind site over existing grids to load centers. Overlaying wind resource maps on distribution grid layout maps is a common approach to analyze and determine those sites.
Figure 53: Wind sites Namlea

65 | P a g e
2.5. Solar PV Resource Assessment
2.5.1 Solar PV potential on Buru
The average daily solar radiation map below shows that Buru holds about 200 to 250 Watt per m2/day which is equivalent to an average solar energy radiation of 4.8 to 6 kWh/m2/day [which means that the sun shines almost 5 hours a day with a solar radiation 1,000 Watt/m2]. If Buru island has an area of 11,117 km2, therefore the solar energy potential on the island is about 55,765 GigaWatt. The darker areas on the map below indicate even a higher insolation in close range of 300 Watt per m2/day.
Figure 54: The average daily solar radiation on Buru island
On practically all locations in Buru it is technically feasible to install either a stand alone PV systems. These can be either very small solar home systems or large scale grid connected PV systems, as all locations have good solar insolation (although tree shading should always be observed and considered). Refering to the solar insolation data from Nasa, the average insolation is about 4.782 kWh/m2/day, as shown in figure below (average value x 24).
Figure 55: Solar insolation at site (Nasa)

66 | P a g e
2.5.2 Predicted Power
The objective in this chapter is to estimate the output of a PV Solar Array and as the Directorate General for Electricity and Energy Utilization is planning to install 5 kWp (‘Kilowatt Peak’) centralized systems we have rendered its estimated output. By using Homer software, the 5 kW centralized photovoltaic is expected to produce 18.6 kWh/day of energy on average throughout the year which is equivalent to a capacity factor of 15.5%. Just by comparison; a similar system if installed in the Netherlands would only produce 10.7 kWh /day (which is equivalent to a CF of 8.91%).
Figure 56: The monthly average electric production of a 5kW centralized PV (homer)
2.6. Biogas Resource Assessment (SMALL biogas potential on Buru)
2.6.1 Introduction
Somewhat similar to Sumba but on a less extensive scale cattle is seen to roam just about anywhere. At the same time and similar to Sumba, cows are caged at night and roam freely during the day. Buffaloes are not commonly caged. The head of the Government Agency for Livestock estimated that about 50% of the cows are caged at night. Most farmers on Buru especially those of Javanese decent combine and integrate rice farming and small scale cattle breeding. Compared to Sumba, Buru seems to be ahead on small scale biogas development and a total of 13 systems have been installed between 2003 and 2009. Four (4) additional units were planned to be installed in 2010. Finally the head of the agency added that one (1) unit was financed by non-public funding sources.
2.6.2 Desk research
The publically available data on Buru’s biogas utilization and potential is virtually non-existent. The only data that is available is shown in the table below. It is clear that the ‘cattle per capita’ numbers look very similar to Sumba. Looking at the data the number of cattle per capita in Buru appears to be somewhat lower which is likely so the case as the area it includes the more urbanized area of Namlea.

67 | P a g e
Figure 57: Cattle on Buru
No Regency Cow Buffalo Horse Pig Goat Total Inhabitants Cattle/capita
1 Buru 39,437 3,699 491 1,310 27,200 72,137 94,116 0.77
2 South Buru 7,563 - - 8,414 42,055 58,032 51,754 1.12
Total 2009 47,000 3,699 491 9,724 69,255 130,169 145,870 0.89 Table 21: Large livestock population by kind and regency 2009; source: BPS, 2009. Buru in figures
From the survey’s team’s observation and from discussions with the head of the Government Agency for livestock Buru indeed seems to hold a large potential for biogas. This is more so the case as village communities (transmigrates) tend to live relatively close to one another as can be seen on the satellite image below which would certainly enhance the institutional support set up of a community based household level biogas program.
Figure 58: Transmigrate farmer villages west of Namlea
In order to get some idea about the potential for a biogas program on the Island of Buru the following table was compiled. It assumes that Buffaloes are not caged. Moreover it does not include the small population of horses. It focuses solely of collectable manure from cows and pigs, which is estimated at

68 | P a g e
only 50% as these cattle are expected to roam freely during the day. The potential for biogas development appears to be considerable and deserves additional in-depth field research.
Estimated potential for biogas assuming individual biogas plants per single household on the Island of Buru
No Assumptions Value Remarks
1 Total no. of households 21,881 Data from 2009, BPS Buru
2 Percentage of poor households 29% Data from 2009, BPS Buru
3 Own an in excess of three (3) cows or buffaloes 75% Estimation of head of Livestock Office (Kades perternakan)
4 Gas production of manure per Kg. see below AVG figures based on range estimation by SNV
5 Percentage (%) Methane in biogas 50% http://www1.agric.gov.ab.ca/$department/deptdocs.nsf/all/afi11109
6 Estimated mitigated CO2 per biogas plant (Ton/Eq.) 5 http://www.hedon.info/ScalingUpBiogasInNepal
7 Collectable animal manure 50% As per information from 'Kades Peternakan': animals are caged at night and roam freely during the day hence half is collectible
No Cow Buffalo Horse Pig Human Total
1 Quantity as per statistical data 47,000 3,699 491 9,724 109,405
2 Number in one (1) household 5,00 - - 1,00 5,00
3 Estimated manure kg/d/head 10,00 20,00 10,00 8,50 0,40
4 Collectable manure kg/d/head 5,00 10,00 5,00 4,25 0,40
5 M3 Biogas production / kg 0,032 0,032 0,032 0,050 0,024
6 M3 Biogas prod /kg/d/head (Total=M3 per household) 0,788 - - 0,210 0,048 1,05
7 Eq. households potentially adopting for biogas plants 7,749
8 No. of animals of which manure is collectable 38,746 - - 8 7,788
9 No. of animals of which manure is not collectable 8,254 4 491 9,716 6,173
10 M3 potential Sumba per year 2,227,398 - - 595 136 730,799
11 CER potential in tons of CO2/year 38,746
Table 22 : Estimated biogas potential Buru
2.7. Biofuels Resource Preliminary Assessment Buru
2.7.1 Introduction
The supply of fossil fuel to remote islands of Buru has experienced frequent interruptions and shortages for both transport and power generation needs are not uncommon. This is even more so the case in the isolated grids of Wamsisi and Leksula in the South Buru regency that the Pertamina (the national fuel company) does not serve. The head of the diesel power station in Namlea explained that the PLN takes care of transport of fuel for its isolated grids. Especially the last few months the weather has not been conducive and boats were not allowed to sail by the harbor master. Evidently fuel shortages have resulted in blackouts even for a number of days in a row. In this context it seems not only logical but even necessary to look for alternatives. As biofuels have not taken off yet on a commercial scale in Indonesia for a number of reasons it remains to seen whether they can play a significant role on the short term to reduce the dependency of isolated islands on ‘imported fuels’. While the Buru has almost the same size as Sumba, it is (even) more sparsely populated because those areas that are inhabitable and show good agricultural potential cover only a relatively small part of the island.

69 | P a g e
2.7.2 Biofuel Development Buru
Similarly to the island of Sumba the province Maluku was mentioned frequently in the media as a target
area for large scale development of particularly Jatropha Curcas. In particular critical lands were targeted
for this development as Jatropha was hyped for its resilience against draught and not competitive with
food crops. On the website of the Indonesian Center for Agricultural Socio Economic and Policy Studies
an abstract of a research paper this issue is underlined once more: “The development of the biofuel (BBN) is urgently
needed to help reduce the public burden within the ever increasing of oil price. This idea is supported by the availability of the various raw
materials in Maluku such as cassava, sweet potatoes, coconut, sago, and maize which grow in the dry up to marginal land area. However, the
need for the BBN is still in competition with that of for human food, land is largely used in Maluku for staple food. Jathropha curcas is
alternately suitable for BBN alternative, because it can grow on the dry land as well as on marginal land, and it is relatively easy to be grown.
The total area of Jatropha curcas development in Maluku could be divided into: the most suitable land (662,672 ha/S1); suitable (1,327,550
ha/S2); less suitable (64,149 ha/S3) and inappropriate (2,515,879 ha/N). Both cultivation and post-harvest technology of Jathropha curcas
are available at the Agency for Agriculture Research and Development (Badan Litbang Pertanian). The strategy of castor oil production can
be adjusted to the various patterns on target group and its utilization importance. The regional authority should be convinced about the
highly support of Jathropha plant not only to produce biofuel but also as a source regional income”. [Unedited, Reds.] From our discussions with the Government Agency for Agriculture in Ambon it was learned that there have been no been initiatives to develop this or other any other biofuel crops although a significant area of the islands was deemed ‘most suitable’ for specifically Jatropha.
2.7.3 Biofuel Potential Buru Based on Land Suitability
Once again Winrock has combined land suitability maps that merge research of Winrock and the Balai Besar Penelitian dan Pengembangan Sumber Daya Lahan (Indonesian Center for Agricultural Land Resources Research and Development). The maps provide a base for area calculation and by including average production figures of these crops and conversion factors to biofuels the theoretical potential for biofuels can be deduced. Here the objective is to point out where these areas could be and to underline that these crops can grow on Buru. The inherent weakness of the analyses is that it ‘estimates’ land availability at 25% whilst in reality this figure could be either higher or lower. Especially in the low land areas of Way Apu land availability could be even less than the estimated 25% as lands are farmed already with food crops such as rice and maize. In this context it is important to notice that although Palm Oil could be grown on Buru, it could only grow in those areas that appear to be lowlands with high precipitation and would compete with farmland for food crops. Sugar cane is shown as well as a crop that could grow both in the vicinity of Namlea and Leksula. Especially the areas North of Leksula is particularly mountainous which would inhibit mechanization of the process; again large flat areas are much preferred to this end. As such both Palm Oil and Sugar Cane seems to be unlikely candidates for future biofuel production. Even though Jatropha success stories are few and far between it seems to be a fairly realistic candidate for biofuels production in remote areas. Small scale pilot projects using CJO for lighting and stoves are currently being implemented elsewhere (in Indonesia in Flores, Legu) and worth considering in other remote locations too. Large scale production of Jatropha Curcas has not been proven to be economically feasible in Indonesia just for numerous reasons the remote island of Buru does not seems like to best location to develop large scale pilot projects.

70 | P a g e
Figure 59: Buru land suitability map
No Feedstock Area Ha (tot.) 25% (avail.) Liter per HA Unit Liters/year
1 Jatropha 84,000 21,000 600 CJO 12,600,000
3 Palm Oil 10,000 2,500 4,000 CPO 10,000,000
4 Sugar Cane 137,000 34,250 4,500 Bio-ethanol 154,125,000 Table 23 : Land suitability and biofuel feedstock potential for selected crops
Two potential biofuel feedstock sources were found in abundance on the Island of Buru; coconut and Sago Palm. Coconut Plantations of up to 5,000 hectares were identified on the north side of Buru. While coconut oil could be transformed to biodiesel through the process of transesterification, it is not economically feasible to do so as the price for pure coconut oil exceeds IDR 10,000 per liter and would reach almost IDR 15,000 per liter once processed to biodiesel. A serious contender for biofuel production on the Island of Buru would be Sago Palm. Large areas of wild growing Sago Palm were identified West to the city of Namlea (see picture below). The Sago Palm is a known to be resilient and immune to floods, drought, fire and strong winds. The plant reaches commercial maturity at 9–12 years of age, when the fruit starts to develop, and starch accumulation in the trunk reaches a maximum. While in other areas of East Indonesia Sago is a staple food, on the island of Buru it was neither farmed nor processed. The wild Sago Palms indentified would have a somewhat limited potential for biofuel production as starch levels are highest just before the onset of the palm flowering (the Sago found had already reached the stage of flowering). Further research would be
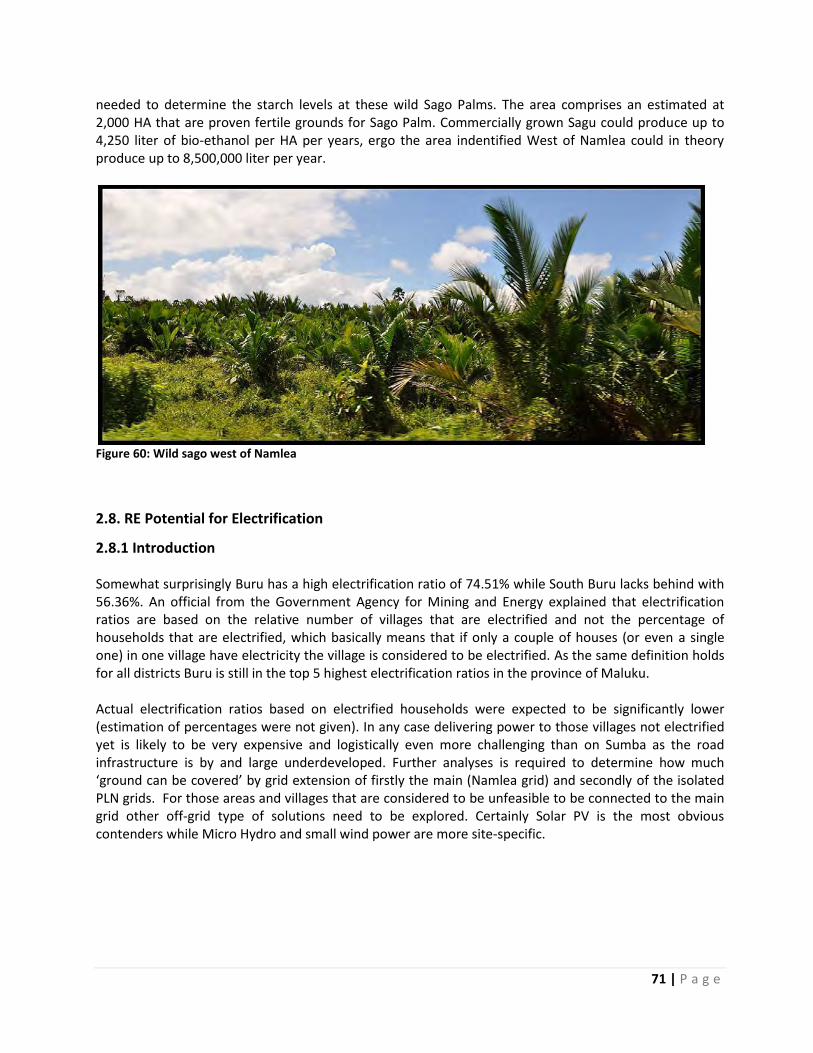
71 | P a g e
needed to determine the starch levels at these wild Sago Palms. The area comprises an estimated at 2,000 HA that are proven fertile grounds for Sago Palm. Commercially grown Sagu could produce up to 4,250 liter of bio-ethanol per HA per years, ergo the area indentified West of Namlea could in theory produce up to 8,500,000 liter per year.
Figure 60: Wild sago west of Namlea
2.8. RE Potential for Electrification
2.8.1 Introduction
Somewhat surprisingly Buru has a high electrification ratio of 74.51% while South Buru lacks behind with 56.36%. An official from the Government Agency for Mining and Energy explained that electrification ratios are based on the relative number of villages that are electrified and not the percentage of households that are electrified, which basically means that if only a couple of houses (or even a single one) in one village have electricity the village is considered to be electrified. As the same definition holds for all districts Buru is still in the top 5 highest electrification ratios in the province of Maluku. Actual electrification ratios based on electrified households were expected to be significantly lower (estimation of percentages were not given). In any case delivering power to those villages not electrified yet is likely to be very expensive and logistically even more challenging than on Sumba as the road infrastructure is by and large underdeveloped. Further analyses is required to determine how much ‘ground can be covered’ by grid extension of firstly the main (Namlea grid) and secondly of the isolated PLN grids. For those areas and villages that are considered to be unfeasible to be connected to the main grid other off-grid type of solutions need to be explored. Certainly Solar PV is the most obvious contenders while Micro Hydro and small wind power are more site-specific.

72 | P a g e
ELECTRIFICATION RATIO MALUKU PROVINCE
NO DISTRICT / CITY NUMBER OF VILLAGES ELECTRIFIED NOT ELECTRIFIED RATIO (%)
1 Kota Ambon 50 50 - 100.00
2 Maluku Tengah 172 168 4 97.67
3 Seram Bagian barat 89 74 15 83.15
4 Seram Bagian Timur 56 29 27 51.79
5 Buru 51 38 13 74.51
6 Buru Selatan 55 31 24 56.36
7 Kota Tual 29 13 16 44.83
8 Maluku Tenggara 87 29 58 33.33
9 Maluku Tenggara Barat 71 12 59 15.90
10 Maluku Barat Daya 118 25 93 21.19
11 Aru 119 24 95 20.17
Total 897 493 404 54.96
Table 24 : Electrification ratios Maluku province
2.8.2 PLN baseline & Planning and growth
Figure 61 shows the existing PLN 20kV medium voltage distribution grids of Namlea-Mako-Air Buaya, Wamsisi, Leksula and Way Pandan. Small to medium scale diesel generators are deployed on Buru to anticipate load demand fluctuations. The Medium Voltage grid follows the main roads and only extents over small distances to the villages alongside this road [through a low voltage grid]. The Namlea and Mako and Air Buaya systems are physically adjacent and could be electrically interconnected, however PLN keeps the grids separated and disconnected to prevent overload as the electricity supply capacity is smaller than electricity demand. Connecting grids would result in voltage drops and a further deterioration of the electricity supply In case of the Namlea and Air Buaya system, the grid is disconnected at the village of Waepoti, while at the Namlea and Mako system the grid is disconnected at Safana Jaya and Waetenat. Currently only the Namlea system operates 24 hous a day, while the other grids are considered ‘isolated grids’ that operate for only 12 hours a day (6 pm – 6 am). The electricity demand on the island still increases in line with regional economic development and population growth. PLN data shows that the total peak load of Namlea system is about 2,240 kW altogether with a minimum base load of 1,400 kW and a yearly growth rate close to 6.2 % which translates to 5.5 MW by the year 2019.

73 | P a g e
Figure 61: Map of an existing PLN grid and power plants in Buru
Currently the total peak load of the main grids (Namlea, Mako, Air Buaya, Wamsisi, Leksila and Way Pandan) is about 4.66 MW altogether; meanwhile the peak load of Namlea-Mako-Air Buaya is about 3.99 MW with the annual average growth of 10.1%. The highest average load growth is found in the Mako system at 14.4% annually while lowest average load growth of 6.2% annually is found in the Namlea system. The total installed capacity (‘kapasitas terpasang’) of all power plants amounts to 8.86 MW with an ‘actual’ capacity (‘Daya Mampu’) of about 5.71 MW. This month PLN has planned to rent a 2 MW mobile diesel powerplant to reduce black-out and system failure during peak hours and furthermore to anticipate system interconnection among Namlea, Mako and Air Buaya system. As mentioned before the PLN has signed an MOU with a private sector developer for a 2x1.6MW hydro power plant at Way Nibe (although with the current rate of deforestation these capacities might be overoptimistic). The PLN also is studying the feasibility of a 2x3MW coal fired power plant at Namlea. In order to get a better understanding of the load changes throughout the day the load profile of the Namlea grid system is shown below. The peak is about 60% higher than the base load that occurs during the night and till about 1800 hrs during the day.
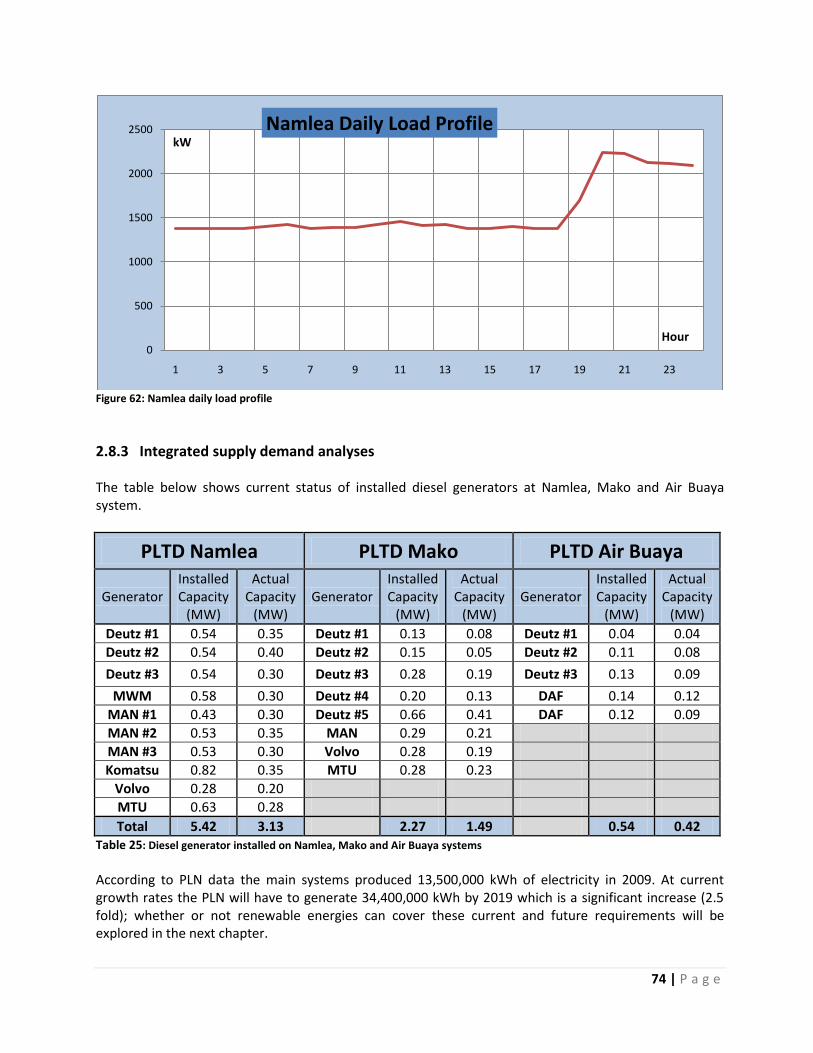
74 | P a g e
Figure 62: Namlea daily load profile
2.8.3 Integrated supply demand analyses
The table below shows current status of installed diesel generators at Namlea, Mako and Air Buaya system.
PLTD Namlea PLTD Mako PLTD Air Buaya
Generator Installed Capacity
(MW)
Actual Capacity
(MW) Generator
Installed Capacity
(MW)
Actual Capacity
(MW) Generator
Installed Capacity
(MW)
Actual Capacity
(MW)
Deutz #1 0.54 0.35 Deutz #1 0.13 0.08 Deutz #1 0.04 0.04
Deutz #2 0.54 0.40 Deutz #2 0.15 0.05 Deutz #2 0.11 0.08
Deutz #3 0.54 0.30 Deutz #3 0.28 0.19 Deutz #3 0.13 0.09
MWM 0.58 0.30 Deutz #4 0.20 0.13 DAF 0.14 0.12
MAN #1 0.43 0.30 Deutz #5 0.66 0.41 DAF 0.12 0.09
MAN #2 0.53 0.35 MAN 0.29 0.21
MAN #3 0.53 0.30 Volvo 0.28 0.19
Komatsu 0.82 0.35 MTU 0.28 0.23
Volvo 0.28 0.20
MTU 0.63 0.28
Total 5.42 3.13 2.27 1.49 0.54 0.42 Table 25: Diesel generator installed on Namlea, Mako and Air Buaya systems
According to PLN data the main systems produced 13,500,000 kWh of electricity in 2009. At current growth rates the PLN will have to generate 34,400,000 kWh by 2019 which is a significant increase (2.5 fold); whether or not renewable energies can cover these current and future requirements will be explored in the next chapter.
0
500
1000
1500
2000
2500
1 3 5 7 9 11 13 15 17 19 21 23
kW
Hour
Namlea Daily Load Profile

75 | P a g e
2.8.4 Replacing fossil fuel power generation with Renewable Energy
We have seen that the current power requirements on the Island of Buru are still small and not even reach 5 MW altogether and at current growth rates the total power requirement will double over a period of 10 years. It is estimated that the current kWh production with is solely produced by diesel power plants requires about 3,780,000 liters of HSD fuel on a yearly base. Based on calculation on land requirements for bio fuels it was concluded that by just utilizing 25% of suitable lands for Jatropha already 12.6 million liters of CJO could be produced. So even if fuel consumption would triple in principle all fossil fuel for power generation could be replaced. Even less than on the island of Sumba Jatropha has not even been piloted on the island of Buru. It would therefore be risky and not prudent to base any electricity planning on the development of large scale Jatropha cultivation. In addition Sago was mentioned as a potential biofuel although its final product, bioethanol seems more suited for transport fuel requirements than power generation as there are still not an abundant amount of ethanol generators available (although not impossible but it is questionable if this state of the art technology is suitable in remote Buru25. Other, proven, renewable energies such as hydro, wind and solar PV are likely to be more apt in for Buru Island. The study uncovered close to 4 MW of hydro potential at just two river locations while there are numerous smaller and larger streams which have not even been ‘touched’ in terms of feasibility assessment. The four (4) MW hydro potential by is self is not sufficient to cover all power needs especially because discharge flows from these river fluctuates significantly from season to season. Certainly convenient is the fact that the Easterly trade winds blow strongly during these low debit months albeit not with the same intensity as found on the Island of Sumba. Certainly these two resources wind and hydro go ‘hand in hand’ and can potentially cover most if not all electric power requirement on the island for the coming years. Solar PV has a good potential for those remote areas that neither hold hydro nor wind resources and are not economically or technically feasible to have electrified through grid extension. One stumbling block that needs careful consideration is the need for ‘after sales service and maintenance’. Currently these services are not available and it was learned that many cases villagers sold off the non functional PV systems. The main culprit causing PV systems to breakdown are its batteries either through misuse or just because of its short life time (note that simple car batteries are used in these ‘Solar Home Systems’). The centralized systems coped with other, mostly non-technical problems. As these systems are supposed to be operated and maintained by the community, a solid ‘institutional set up’ is required. It cannot be sufficiently stressed that donors give equal attention to both technical and institutional issues. Possibly more commercial and market driven models might be more suitable to encourage better after sales and sustainability on the long run. As shown on the Renewable Energy Potential resource map, Buru was found to hold ‘speculative’ geothermal resources of 120 MW of power. Detailed survey has been done at Wapsalit Waeapo which is conveniently located close to the main road (and transmission). Certainly Geothermal resources could cover a significant portion of the Buru’s power requirements. It is important to note though that
25
See also http://www.power-technology.com/projects/ethanol-power-plant/)

76 | P a g e
geothermal power plants commonly only supply base load hence other load following generators would still be required to cope with load fluctuations. Moreover development costs can run into the millions of USD as deep reservoir drilling is required. In summary, it is safe to say that renewable energy sources can significantly contribute to the electrification of Buru. Managing the grid load fluctuation still requires load following generators, hence biofuel feedstock options should be revisited. If one wants avoid diesel power generators, more complicated control systems with storage capacity are required.
2.8.5 Transport and Fuel consumption Statistics
Transport Statistic Buru & South Buru
1. Fuel Consumption (L) (Pertamina - 2009)
Premium 8,400,000
Solar 9,000,000
2. Vehicles
Cars 528
Motorcycles 4,500
3. Roads (km)
Tarmac 259.74
Rock 235.82
Sand 205.16 Table 26 : Transport statistics and fuel consumption Buru and South Buru
Very limited data is available on fuel consumption for different user categories. Premium fuel is by and large used by cars and motorcycles. Only small generator sets (usually below 5 kW) run on this petrol fuel as well. The total diesel fuel consumption for vehicles and sea transportation can be deduced by deducting PLN’s estimated annual fuel consumption, 3,780,000 liters from the total fuel consumption which is equivalent to 5,620,000. This amount of diesel fuel could in theory be replaced by Jatropha based fuel.

77 | P a g e
Chapter 3. A comparison of Candidates Islands Buru and Sumba
3.1 Introduction
In this final chapter we attempt to summarize and rate the two islands on different criteria that are deemed important to the implementation of the ‘Iconic Island’ concept. A low score on certain criteria indicates that the island is deemed less suitable or compatible to implement the ‘iconic island’ concept based on that particular measure. This chapter serves as a first attempt to compile an ‘apple to apple’ comparison. It does not pretend to be comprehensive neither should one be inclined to interpret its outcomes in a rigid fashion. With little effort additional criteria (and ‘way factors’) could be introduced to arrive at a more comprehensive and less course assessment of Buru and Sumba (and possibly other islands). The final decision on which island is deemed most suitable [to implement the concept] is likely to be a compromise of ‘ideal circumstances’ versus ‘development priorities’ of the Indonesian Government and the implementing agency.
3.2 Sumba and Buru; a summarized comparison
Table 27 shows how the islands Sumba and Buru compare on relatively simple and straightforward screening criteria. In order to understand the context it is important to go through the chapters 1 and 2 firstly as not all information is captured in this matrix. For instance the quantitative approach or better ‘first attempt’ to determine the potential for biogas is not taken up in this matrix as its figures lean on assumptions based on conversations with the respective ‘heads of the agency of agriculture, plantation and life stock’. Further quantitative research and field sampling is needed to support its main assumptions. The matrix below shows that Sumba is the more likely candidate for the ‘Iconic Island’ concept. Not only does it have outstanding renewable energy resources, it also is easily reachable while at the same time its electrification ratio is amongst the lowest in the country. Moreover the local PLN is highly supportive of Renewable Energy and has successfully operated a MHPP plant for many years. Differently from the PLN on the island of Buru, the PLN in Sumba had a significant amount of detailed information particularly on RE sites that showed good prospects for further development. Buru is attractive as it basically has a wide range of RE resource potential that includes Geothermal which is currently a high priority of the Indonesian government. On the other hand its current infrastructure and accessibility are considered main inhibitors of the island’s development. Traveling to the island is very time consuming (requires 2 days) and once on the island (some) sites are very hard to reach. At the same time decision makers may consider the imperative to implement the ‘iconic island’ concept on the island on the island of Buru as it may put this island in the spotlight and hopefully incubate economic development on an island that is often forgotten or left to its self.If strictly ‘technical criteria’ prevail, Sumba is the obvious choice to develop the ‘iconic island’ concept. Relatively close to the much more famous and developed islands of Lombok and Bali, it does not fail to impress with its awe inspiring natural beauty and its great tourism potential. At the same time Sumba Island is one of the poorest regions in the whole of Indonesia and its growth is greatly inhibited by the lowest electrification ratios.
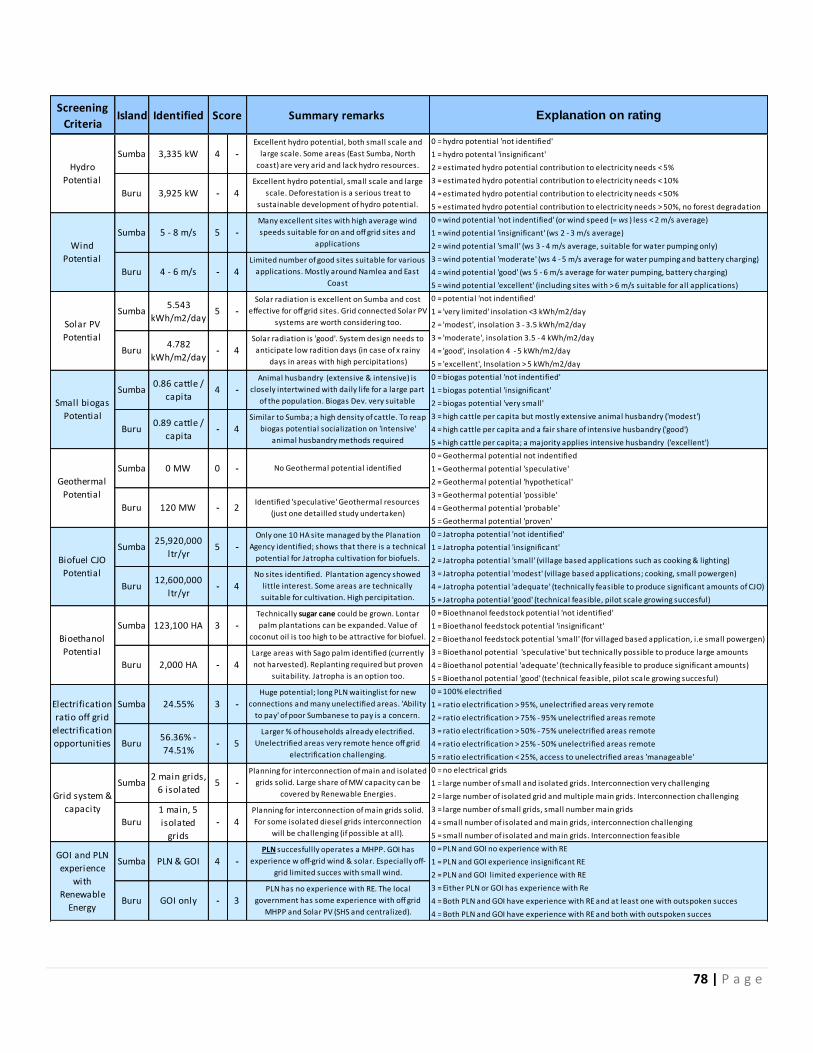
78 | P a g e
Screening
CriteriaIsland Identified Summary remarks Explanation on rating
0 = hydro potential 'not identified'
1 = hydro potental 'insignificant'
2 = estimated hydro potential contribution to electricity needs < 5%
3 = estimated hydro potential contribution to electricity needs < 10%
4 = estimated hydro potential contribution to electricity needs < 50%
5 = estimated hydro potential contribution to electricity needs > 50%, no forest degradation
0 = wind potential 'not indentified' (or wind speed (= ws ) less < 2 m/s average)
1 = wind potential 'insignificant' (ws 2 - 3 m/s average)
2 = wind potential 'small' (ws 3 - 4 m/s average, suitable for water pumping only)
3 = wind potential 'moderate' (ws 4 - 5 m/s average for water pumping and battery charging)
4 = wind potential 'good' (ws 5 - 6 m/s average for water pumping, battery charging)
5 = wind potential 'excellent' (including sites with > 6 m/s suitable for all applications)
0 = potential 'not indentified'
1 = 'very limited' insolation <3 kWh/m2/day
2 = 'modest', insolation 3 - 3.5 kWh/m2/day
3 = 'moderate', insolation 3.5 - 4 kWh/m2/day
4 = 'good', insolation 4 - 5 kWh/m2/day
5 = 'excellent', Insolation > 5 kWh/m2/day
0 = biogas potential 'not indentified'
1 = biogas potential 'insignificant'
2 = biogas potential 'very small'
3 = high cattle per capita but mostly extensive animal husbandry ('modest')
4 = high cattle per capita and a fair share of intensive husbandry ('good')
5 = high cattle per capita; a majority applies intensive husbandry ('excellent')
0 = Geothermal potential not indentified
1 = Geothermal potential 'speculative'
2 = Geothermal potential 'hypothetical'
3 = Geothermal potential 'possible'
4 = Geothermal potential 'probable'
5 = Geothermal potential 'proven'
0 = Jatropha potential 'not identified'
1 = Jatropha potential 'insignificant'
2 = Jatropha potential 'small' (village based applications such as cooking & lighting)
3 = Jatropha potential 'modest' (village based applications; cooking, small powergen)
4 = Jatropha potential 'adequate' (technically feasible to produce significant amounts of CJO)
5 = Jatropha potential 'good' (technical feasible, pilot scale growing succesful)
0 = Bioethnanol feedstock potential 'not identified'
1 = Bioethanol feedstock potential 'insignificant'
2 = Bioethanol feedstock potential 'small' (for villaged based application, i.e small powergen)
3 = Bioethanol potential 'speculative' but technically possible to produce large amounts
4 = Bioethanol potential 'adequate' (technically feasible to produce significant amounts)
5 = Bioethanol potential 'good' (technical feasible, pilot scale growing succesful)
0 = 100% electrified
1 = ratio electrification > 95%, unelectrified areas very remote
2 = ratio electrification > 75% - 95% unelectrified areas remote
3 = ratio electrification > 50% - 75% unelectrified areas remote
4 = ratio electrification > 25% - 50% unelectrified areas remote
5 = ratio electrification < 25%, access to unelectrified areas 'manageable'
0 = no electrical grids
1 = large number of small and isolated grids. Interconnection very challenging
2 = large number of isolated grid and multiple main grids. Interconnection challenging
3 = large number of small grids, small number main grids
4 = small number of isolated and main grids, interconnection challenging
5 = small number of isolated and main grids. Interconnection feasible
0 = PLN and GOI no experience with RE
1 = PLN and GOI experience insignificant RE
2 = PLN and GOI limited experience with RE
3 = Either PLN or GOI has experience with Re
4 = Both PLN and GOI have experience with RE and at least one with outspoken succes
4 = Both PLN and GOI have experience with RE and both with outspoken succes
GOI only - 3PLN has no experience with RE. The local
government has some experience with off grid
MHPP and Solar PV (SHS and centralized).
GOI and PLN
experience
with
Renewable
Energy
Sumba PLN & GOI 4 -PLN succesfullly operates a MHPP. GOI has
experience w off-grid wind & solar. Especially off-
grid limited succes with small wind.
Buru
5 -Planning for interconnection of main and isolated
grids solid. Large share of MW capacity can be
covered by Renewable Energies.
Buru1 main, 5
isolated
grids
- 4Planning for interconnection of main grids solid.
For some isolated diesel grids interconnection
will be challenging (if possible at all).
Sumba 24.55% 3 -Huge potential; long PLN waitinglist for new
connections and many unelectified areas. 'Ability
to pay' of poor Sumbanese to pay is a concern.
Buru56.36% -
74.51%- 5
Larger % of households already electrified.
Unelectrified areas very remote hence off grid
electrification challenging.
Sumba 123,100 HA 3 -Technically sugar cane could be grown. Lontar
palm plantations can be expanded. Value of
coconut oil is too high to be attractive for biofuel.
Buru 2,000 HA - 4Large areas with Sago palm identified (currently
not harvested). Replanting required but proven
suitability. Jatropha is an option too.
Sumba25,920,000
ltr/yr5 -
Only one 10 HA site managed by the Planation
Agency identified; shows that there is a technical
potential for Jatropha cultivation for biofuels.
Buru12,600,000
ltr/yr- 4
No sites identified. Plantation agency showed
little interest. Some areas are technically
suitable for cultivation. High percipitation.
Sumba 0 MW 0 - No Geothermal potential identified
Buru 120 MW - 2Identified 'speculative' Geothermal resources
(just one detailled study undertaken)
Sumba0.86 cattle /
capita4 -
Animal husbandry (extensive & intensive) is
closely intertwined with daily life for a large part
of the population. Biogas Dev. very suitable
Buru0.89 cattle /
capita- 4
Similar to Sumba; a high density of cattle. To reap
biogas potential socialization on 'intensive'
animal husbandry methods required
Solar radiation is excellent on Sumba and cost
effective for off grid sites. Grid connected Solar PV
systems are worth considering too.
Buru4.782
kWh/m2/day- 4
Solar radiation is 'good'. System design needs to
anticipate low radition days (in case of x rainy
days in areas with high percipitations)
Buru 4 - 6 m/s - 4Limited number of good sites suitable for various
applications. Mostly around Namlea and East
Coast
Solar PV
Potential
Sumba5.543
kWh/m2/day5 -
Excellent hydro potential, both small scale and
large scale. Some areas (East Sumba, North
coast) are very arid and lack hydro resources.
Excellent hydro potential, small scale and large
scale. Deforestation is a serious treat to
sustainable development of hydro potential.
Hydro
Potential
Score
Wind
Potential
Sumba 5 - 8 m/s 5 -Many excellent sites with high average wind
speeds suitable for on and off grid sites and
applications
Sumba 3,335 kW 4 -
4Buru 3,925 kW -
Biofuel CJO
Potential
Bioethanol
Potential
Small biogas
Potential
Geothermal
Potential
Electrification
ratio off grid
electrification
opportunities
Grid system &
capacity
Sumba2 main grids,
6 isolated

79 | P a g e
Table 27 : Sumba & Buru summarized comparison
1 = > 2 days travel. General infrastructure could inhibits project development
1 = > 2 days travel. General infrastructure does not inhibit project development
1 = > 1 day travel. General infrastructure could inhibit project development
1 = > 1 day travel. General infrastructure does not inhibit project development
1 = < 1/2 day travel. General infrastructure could inhibit project development
1 = < 1/2 day travel. General infrastructure does not inhibits project development
0 = x million inhabitants
1 = +/- 1,000,000 inhabitants
2 = 750,000 - 1,000,000 inhabitants
3 = 500,000 - 750,000 inhabitants
4 = 250,000 - 500,000 inhabitants
5 = 50,000 - 250,000 inhabitants
0 = No support from either
1 = Insignifcant support from either
2 = Modest support either PLN or Local Government
3 = Modest support from both PLN and Local Government
4 = Strong support from either PLN or Local Government
5 = Strong support from both PLN and Local Government
Overall
Score
Ranking 1 Sumba total score
Buru total score
54
48
Remarks: The objective of ranking islands is to develop a first impression how
well an island would qualify as a candidate for the 'iconic island' concept. It is
not by any means intented final and further qualitative discussion is required
in l ine with the progress of the conceptualization of the 'Iconic Fuel
Independent Island'.
Expected
support from
PLN and Local
Government
Sumba PLN & GOI 5 -Both PLN and local governement officials (Agency
of Agriculture) appeared very supportive to 'The
iconic island concept'
Buru GOI only
Buru has an ideal number of inhabitants for the
'Iconic Island' development project (it is neither
too large nor to small)
- 4Especially the Government Agency for Mining and
Energy expressed support for the 'iconic Island'
concept
Inhabitants
Sumba >600k 3 -Sumba is sparsely populated the total no of
inhabitants is relatively large (for any
development project to cover). Need to prioritize.
Buru >140k - 5
Buru> 12 hours
travel- 0
Travel from Jakarta very time consuming,
Accessibility by plane challenging. Road North
and South often disrupted.
Logistics &
Travel
Sumba< 5 hours
travel 4 -
Accessibility by plane from Jakarta easy. Roads
mostly tarmac (although not all in good
condition). Harbours facilities allow large ships.
Ranking 2

Hivos Regional Office Southeast Asia contact person: Sandra Winarsa, Programme Officer Sustainable EnergyJl. Kemang Selatan XII/no 1 | Jakarta Selatan 12560 | Indonesia t +62 21 78837577 or 7892489 ext 138 E [email protected]
Hivos Head Officecontact person: Eco matser, Climate Change, Energy & Development co-ordinatorRaamweg 16 | 2596 Hl den Haag | the netherlands t + 31(0)70 376 55 00E [email protected]


