Fuel Oil Price Risk Management … and perspectives from the financial side Hartley Connett Executive Director, Marketing Mitsui & Co. Energy Risk Management (U.S.A.), Inc. 2007 Fuel Oil & Energy Buyers’ Conference October 31, 2007
Transcript
Fuel Oil Price Risk Management
… and perspectives from the financial side
Hartley ConnettExecutive Director, Marketing
Mitsui & Co. Energy Risk Management (U.S.A.), Inc.
2007 Fuel Oil & Energy Buyers’ Conference October 31, 2007
2
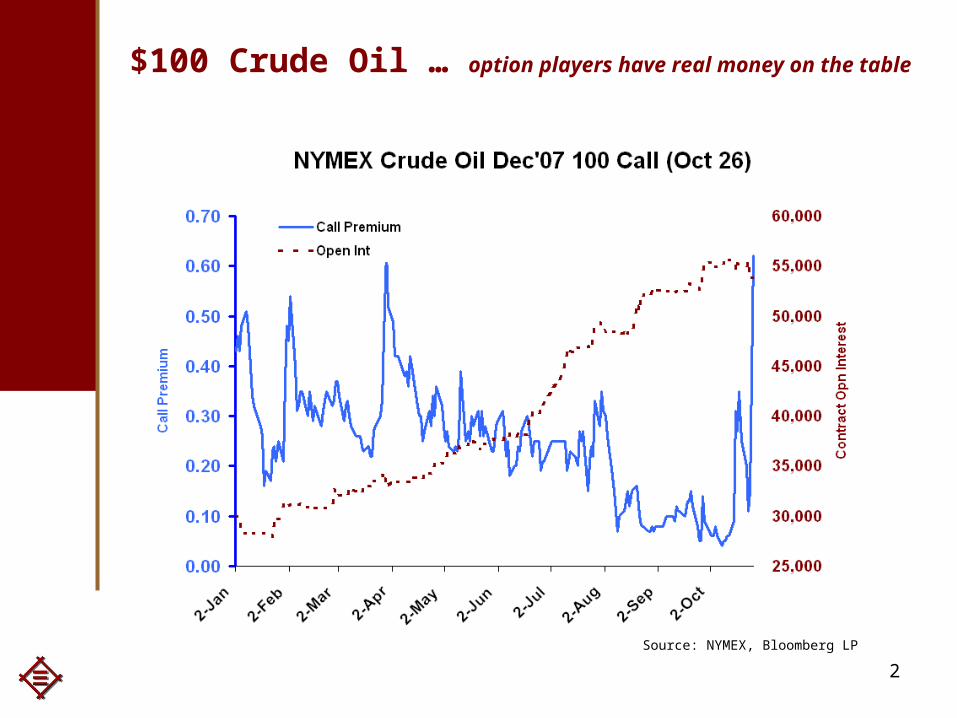
$100 Crude Oil … option players have real money on the table
Source: NYMEX, Bloomberg LP
3
Fundamental Drivers in 2007 Global Security Risk
Iraq and The Middle East
Nigeria
Turkey and PKK (recent)
Global Supply & Demand Balances
Economic Expansion in Asia
OPEC production Cuts
No significant excess capacity outside OPEC
In OPEC, only the Saudis
Weaker US Dollar
US Refining stress
Tokyo Electric Power Co. (more recent)
Asian fuel oil supply constraints develop later in year (more recent)
Lower Russian exports
Iran becomes importer
4
12/29/06 Saddam Hussein Execution
Large short put position on NYMEX
01/23/07 – Proposal to increase SPR to 1.5 billion bbls.
3/20/07 OPEC keeps
level Unchanged
3/22/07 Iran captured 15 British Soldiers
9/01/07 US Inventory
shows much larger than expected
drawdowns
Mid August
Hurricane’s do not materialize in US
5/10/07 Disruptions from
Nigeria
and
Start of US Driving Season
10/28/07 Oil follows Equity Market reaction to Subprime Crisis
7/16/07 TEPCO Outage
2 Q 07 Cushing Stocks Full - Refinery Offline
2007 Timeline: NYMEX Spot WTI
10/15/07Turkey /
PPK
Source: NYMEX, Charts provided by Future Source www.futuresource.com
Recently, New US Sanctions against Iran
5
Consumer Hedging Discussion
3 Simple Themes in a Core Hedging Strategy
Theme 1- Historical Price Distribution… Where are current prices versus historical distribution?
Theme 2- Forward Curve and Best Value
… Where is the best value along the curve?
Theme 3- Product relationship to Crude Oil
… What are the crackspreads doing?
6
Consumer HedgingTheme 1 ... Where are current prices along the historical continuum?
Theme 1
Prices in 2008 (and beyond) are at the highest portion of the historical distribution curve
Accumulate at the averages, add more aggressively below if opportunity presents.
Current prices are far from the ‘best world’ from a Consumer’s standpoint
For Consumer Hedging, the recommendation is to use Defensive Strategies
7
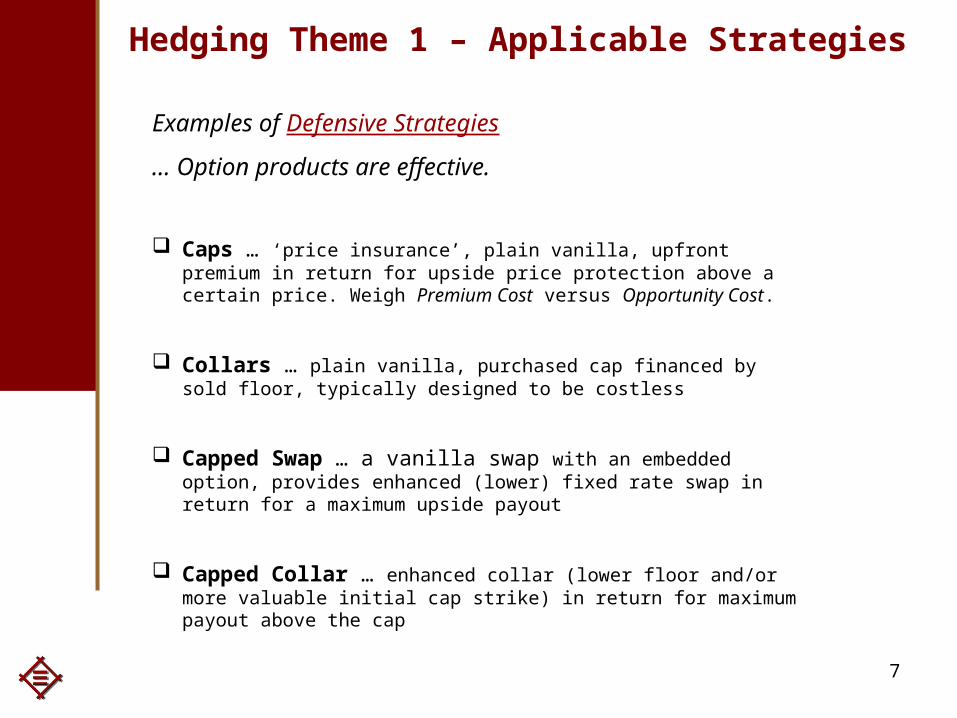
Hedging Theme 1 – Applicable Strategies
Examples of Defensive Strategies
… Option products are effective.
Caps … ‘price insurance’, plain vanilla, upfront premium in return for upside price protection above a certain price. Weigh Premium Cost versus Opportunity Cost.
Collars … plain vanilla, purchased cap financed by sold floor, typically designed to be costless
Capped Swap … a vanilla swap with an embedded option, provides enhanced (lower) fixed rate swap in return for a maximum upside payout
Capped Collar … enhanced collar (lower floor and/or more valuable initial cap strike) in return for maximum payout above the cap
8
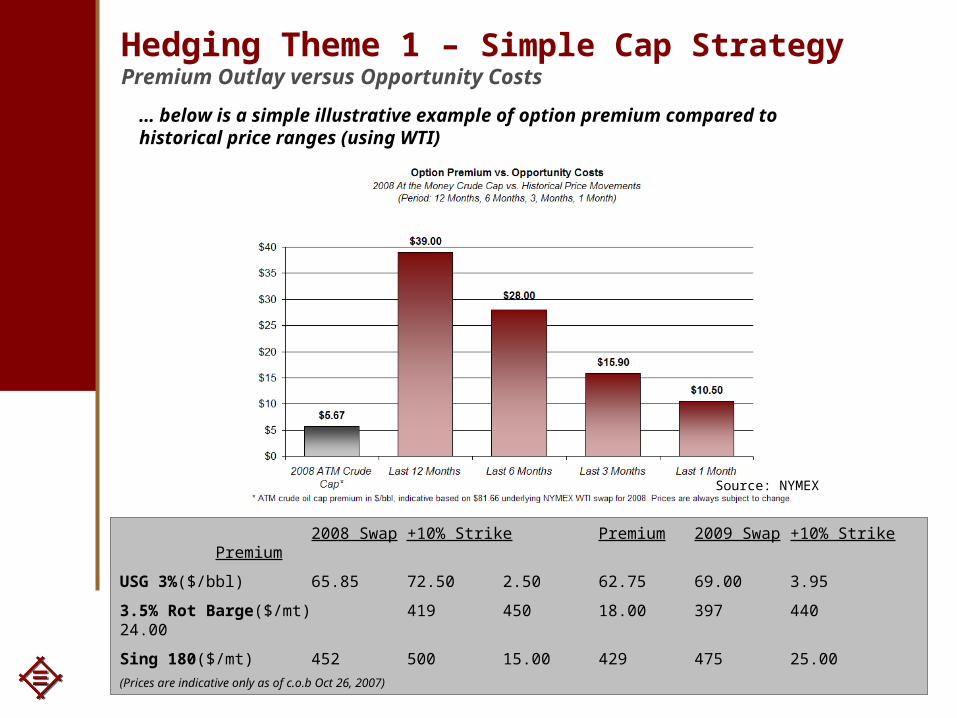
Hedging Theme 1 – Simple Cap Strategy Premium Outlay versus Opportunity Costs
… below is a simple illustrative example of option premium compared to historical price ranges (using WTI)
In backwardated markets, consumers should consider extending tenors to achieve a lower average price ...
Vanilla Swaps
Option products can also be effective …
Hedging with Extendible Structures (option embedded products)
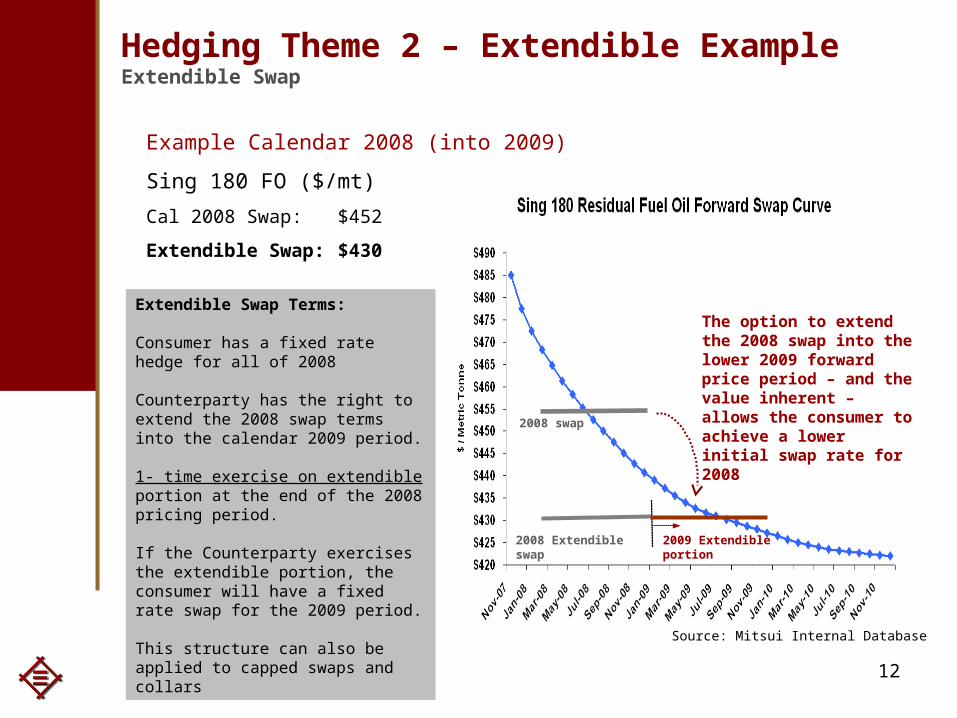
Extendible Swaps
Extendible Capped Swaps
Extendible Collars
Extendible Structures – general explanation
• Consumer obtains an enhanced hedge (fixed swap or collar) for an initial period.
• In return, the consumer grants the counterparty (Mitsui) the right to extend the terms of the initial hedge into a future period (pre-determined at outset).
• The extendible portion can only be exercised 1-time on a pre-determined date, at the preference of the counterparty.
WTI USG 3% ($/bbl) 3.5% Rot Barge($/mt) Sing 180($/mt)
The option to extend the 2008 swap into the lower 2009 forward price period – and the value inherent – allows the consumer to achieve a lower initial swap rate for 2008
Extendible Swap Terms:
Consumer has a fixed rate hedge for all of 2008
Counterparty has the right to extend the 2008 swap terms into the calendar 2009 period.
1- time exercise on extendible portion at the end of the 2008 pricing period.
If the Counterparty exercises the extendible portion, the consumer will have a fixed rate swap for the 2009 period.
This structure can also be applied to capped swaps and collars
Source: Mitsui Internal Database
13
Consumer HedgingTheme 3 ... Watch the fuel oil crackspreads
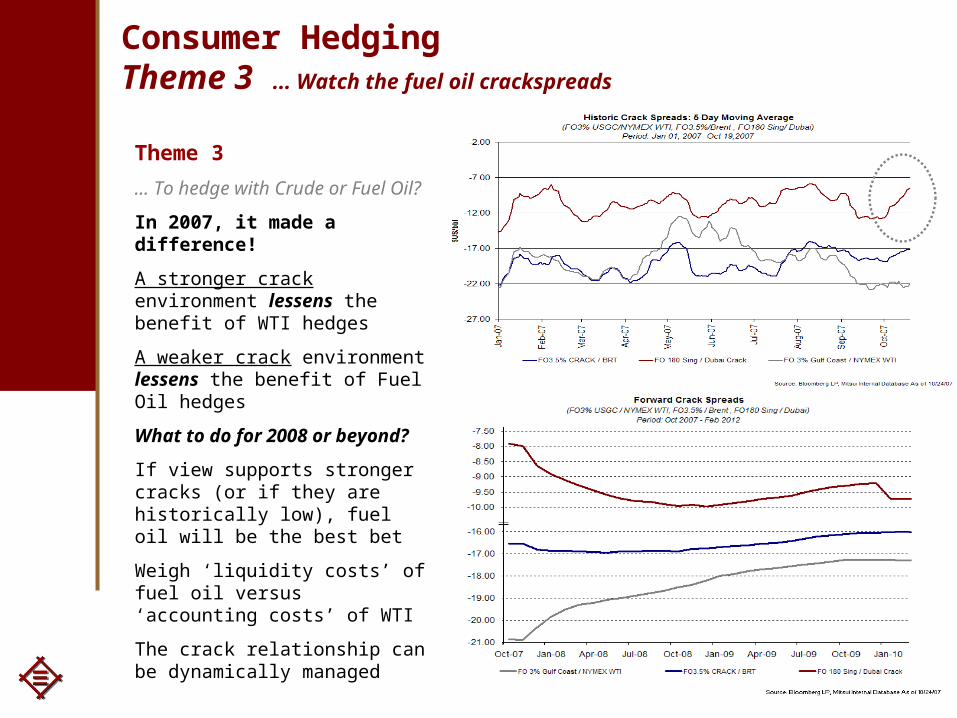
Theme 3
… To hedge with Crude or Fuel Oil?
In 2007, it made a difference!
A stronger crack environment lessens the benefit of WTI hedges
A weaker crack environment lessens the benefit of Fuel Oil hedges
What to do for 2008 or beyond?
If view supports stronger cracks (or if they are historically low), fuel oil will be the best bet
Weigh ‘liquidity costs’ of fuel oil versus ‘accounting costs’ of WTI
The crack relationship can be dynamically managed
14
Take away; The 3 Core Themes
• Theme 1 - Historical price continuum
Use Defensive Strategies at the Highs, use more aggressive strategies at the historical averages or below
Options can help! … look at premium in context to historical ranges and volatility … being ‘wrong’ premium can be [much] less expensive in the long-run
• Theme 2 - Look for best value along the curve
In backwardated markets, extend tenors to achieve lower average hedge price … extendible strategies work well … lower volatility in forward periods
• Theme 3 - Watch the product-to-crude oil relationships
Refiners do! … can help achieve more effective hedge results ... also a Defensive Strategy
15
Days of Supply of OECD Commercial Oil Stocks
Forecast
44
46
48
50
52
54
56
58
Jan 2002 Jan 2003 Jan 2004 Jan 2005 Jan 2006 Jan 2007 Jan 2008
Days ofsupply
NOTE: Colored band represents the 5-year minimum/maximum range for each month.
Short-Term Energy Outlook, October 2007
The Longer Fundamental OutlookSupportive fundamentals remain in place … adding specific factors to the residual sector
Existing fundamental drivers remain in place for the most part
Adding …
•Global Supply & Demand Imbalance
•Q3 global stock draw
•Implied Days Supply
•US Total Petroleum Inventories heading towards lower end of the historical average
Adding for residual sector …
•Projected global fleet size by 2010 (long-term)
•Longer-term impact of upgrades for refinery coking and hydrocracking units on global RFO supply (long-term)
TOTAL US Petroleum Inventories Exlcuding Crude Oil & SPR
600,000
620,000
640,000
660,000
680,000
700,000
720,000
740,000
760,000
780,000
,000
Bbl
s
5-Yr Max/Min Range 5-Yr Avg 2006 2007
Bottom line … the overall picture remains Bullish.
Source: Bloomberg LP, EIA
16
The from Contango to Backwardation
… supports the theory of a fundamentally tight market
Spot NYMEX with 1st Line vs. 12th Line Crude Spread
Singapore prices are leading the way at the moment
Depleted Russian exports into Singapore
Iranian product out of the market
Pull of product into the Arab Gulf
Europe
Poor demand at moment for Utility spec bbls
Healthier demand for Bunkers
Med
Stronger demand for 1% coming from Mediterranean Utilities
Buying Med 1% / Selling NWE 1%
US
Is 1% FO high vs. Natural Gas?
A trade we see interest in Source: NYMEX, Bloomberg LP
19
The SPR(s) and Crude Oil PricesNot the only factor of course, but a ‘wild card’ going forward
Going forward, SPR policy of the US Administration will deserve attention, as will China’s SPR policy
Source: Bloomberg LP , NYMEX
New YorkTelephone: +1 (212) 878 6750
AsiaTelephone: +44 20 7489 6741
LondonTelephone: +44 20 7489 6741
SydneyTelephone: +61 2 9256 9596
Thank You For Listening
LONDON
SYDNEY
NEW YORK
SINGAPORE
Mitsui & Co. Energy Risk Management, Ltd. Worldwide Locations
TOKYO
Hartley ConnettExecutive Director, MarketingMitsui & Co. Energy Risk Management (USA), Inc.As agent for Mitsui & Co. Energy Risk Management Ltd.200 Park Avenue31st FloorNew York, NY 10166Desk- 212.878.6750Cell- 914.907.7508Fax- [email protected]