0 On-Site vs. Off-Site Electric Power Supply in Refineries in the USA: The Use of Cogeneration in Texas and Louisiana Myrna Valera-Salazar, Columbia University Tania Cerda Sauvage, UNAM Gerardo Bazán González, Pemex Alberto Elizalde Baltierra, Pemex 25 th Annual Conference of the USAEE/IAEE Fueling the Future: Prices, Productivity, Policies and Prophecies Presenting: Myrna Varela-Salazar, [email protected]
Transcript
0
On-Site vs. Off-Site Electric Power Supply in Refineries in the USA: The Use of Cogeneration in Texas and LouisianaMyrna Valera-Salazar, Columbia UniversityTania Cerda Sauvage, UNAMGerardo Bazán González, PemexAlberto Elizalde Baltierra, Pemex
25th Annual Conference of the USAEE/IAEE
Fueling the Future: Prices, Productivity, Policies and Prophecies
Cogeneration provides advantages such as:Allowing a more reliable, efficient and cost-effective use of steam and electricity on site;Minimizing refinery’s reliance on outside sources of electricity;Minimizing impacts to the environment due to the increase of energy efficiency in the process.
2
On-Site vs. Off-Site Power Supply
Technical Issues
Regulatory IssuesInstitutional Issues
Laws
RegulationsMarket Design
Prices
Technology
Innovation
3
Research DesignAssumptions:
Competitive electricity markets create incentives for cogeneration beyond the traditional, cost-of-service approach.Under the traditional approach, utilities are inclined to create barriers of entry to cogenerators as well as rate structures that decrease their cost-effectiveness.
Cases:Competitive market
Traditional market
Texas Louisiana
4
The Power Sector in the US
The Institutional Design
5
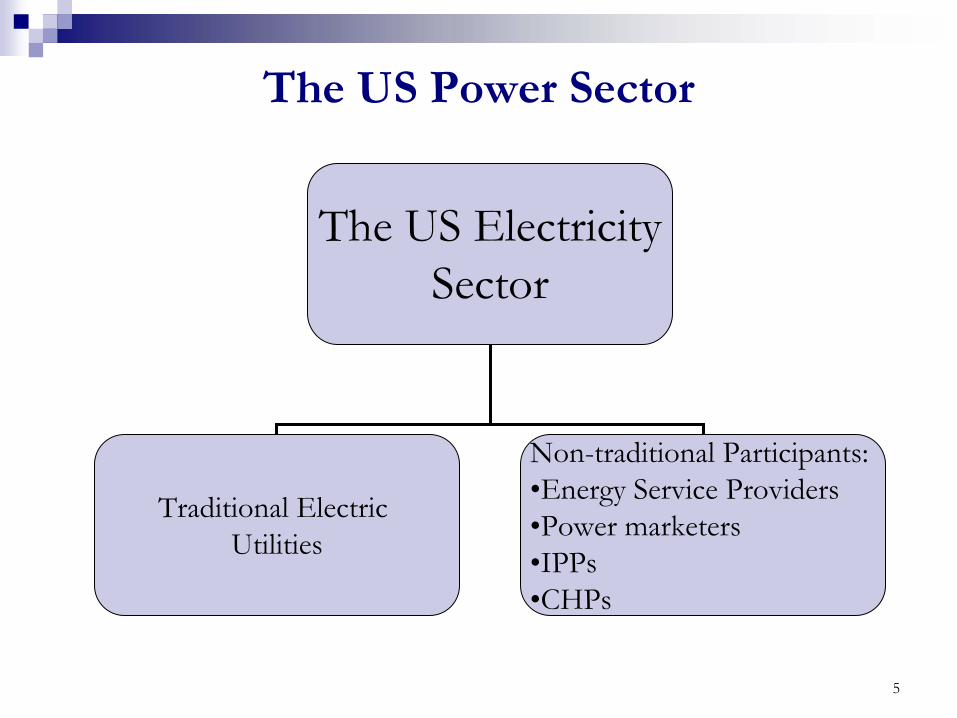
The US Power Sector
The US ElectricitySector
Traditional Electric Utilities
Non-traditional Participants:•Energy Service Providers•Power marketers•IPPs•CHPs
6
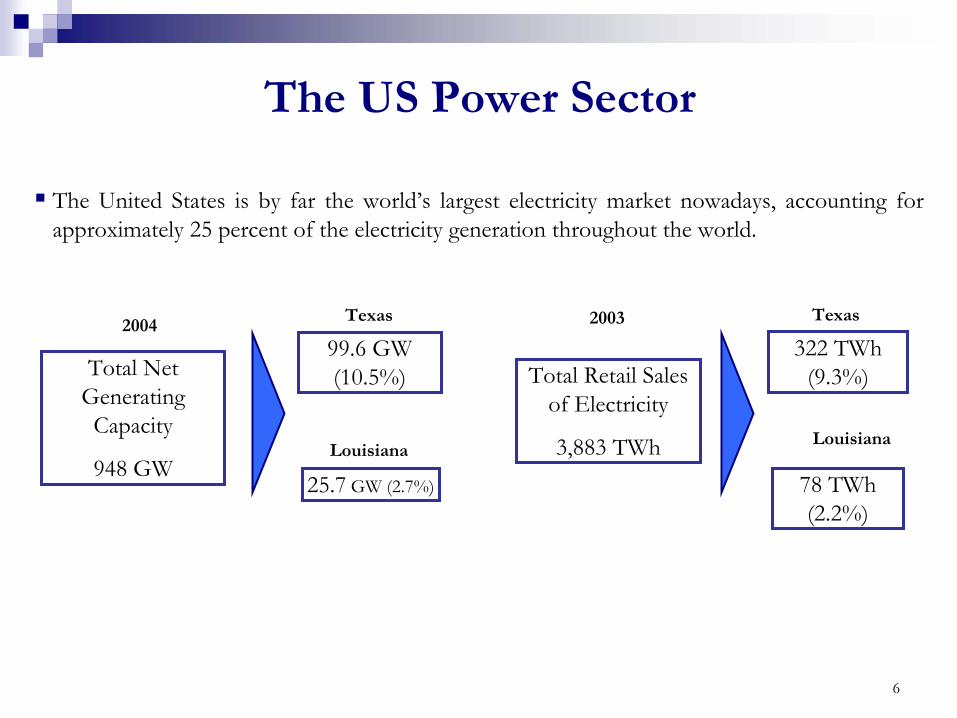
Total Net Generating
Capacity
948 GW
200499.6 GW (10.5%)
Texas
25.7 GW (2.7%)
Louisiana
Total Retail Sales of Electricity
3,883 TWh
2003
322 TWh(9.3%)
Texas
78 TWh(2.2%)
Louisiana
The United States is by far the world’s largest electricity market nowadays, accounting for approximately 25 percent of the electricity generation throughout the world.
The US Power Sector
7
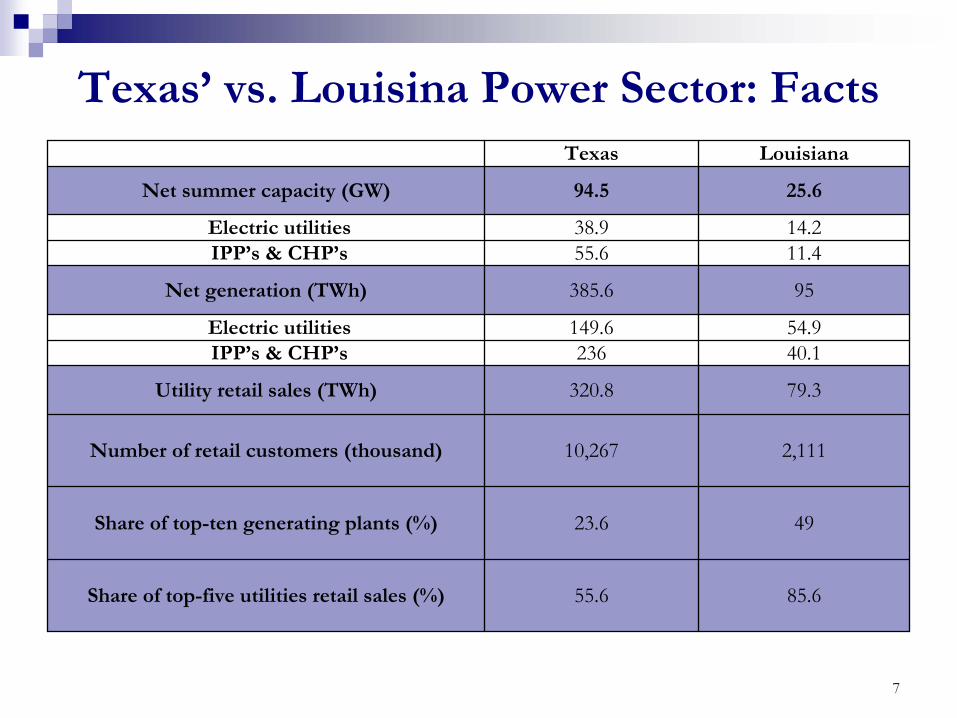
Texas’ vs. Louisina Power Sector: Facts
85.655.6Share of top-five utilities retail sales (%)
4923.6Share of top-ten generating plants (%)
2,11110,267Number of retail customers (thousand)
79.3320.8Utility retail sales (TWh)
40.1236IPP’s & CHP’s54.9149.6Electric utilities
95385.6Net generation (TWh)
11.455.6IPP’s & CHP’s14.238.9Electric utilities
25.694.5Net summer capacity (GW)
Louisiana Texas
8
MAP KEY:ECAR - East Central Area Reliability Coordination AgreementERCOT - Electric Reliability Council of TexasFRCC - Florida Reliability Coordinating CouncilMAAC - Mid-Atlantic Area CouncilMAIN - Mid-America Interconnected NetworkMAPP - Mid-Continent Area Power Pool (U.S., Canada)NPCC - Northeast Power Coordinating Council (Quebec, Ontario, Maritimes, ISO New England, New York)SERC - Southeastern Electric Reliability Council (Tennessee Valley Authority or TVA, Southern, Virginia-Carolinas or VACAR, Entergy)SPP - Southwest Power Pool (Northern and Southern)WSCC - Western Systems Coordinating Council (California, Northwest Power Pool or NWPP, Rocky Mountains Power Authority, Arizona-New Mexico-Southern Nevada or AZNMSNV)Source: North American Electric Reliability Council (NERC)
9
The Power Sector in the US
The Regulatory Design
10
Electric Power Sector: Federal LegislationPUHCA (1935): Gave SEC detailed oversight of the utility capital structures in order to avoid abuses; prevented non-utility companies from entering T&D
PURPA (1978): Created incentives for cogeneration and alternative energy resources; utilities must buy power from IPPs at avoided cost
FDA (1920): created Federal Power Commission as supervisory body of interstate electricity business; federal government has jurisdiction over wholesale power sales, interstate transmission and hydroelectric licensing
EPAct (1992): Increased competition in generation by creating new entities such as the exempt wholesale generators
Orders 888, 889 and 2000 (1996-1998, 2000) issued by FERC: the goal was to make interstate transmission facilities available to a variety of market participants: to promote open access to the interstate transmission grid. Order 2000 aimed to create RTOs.
11
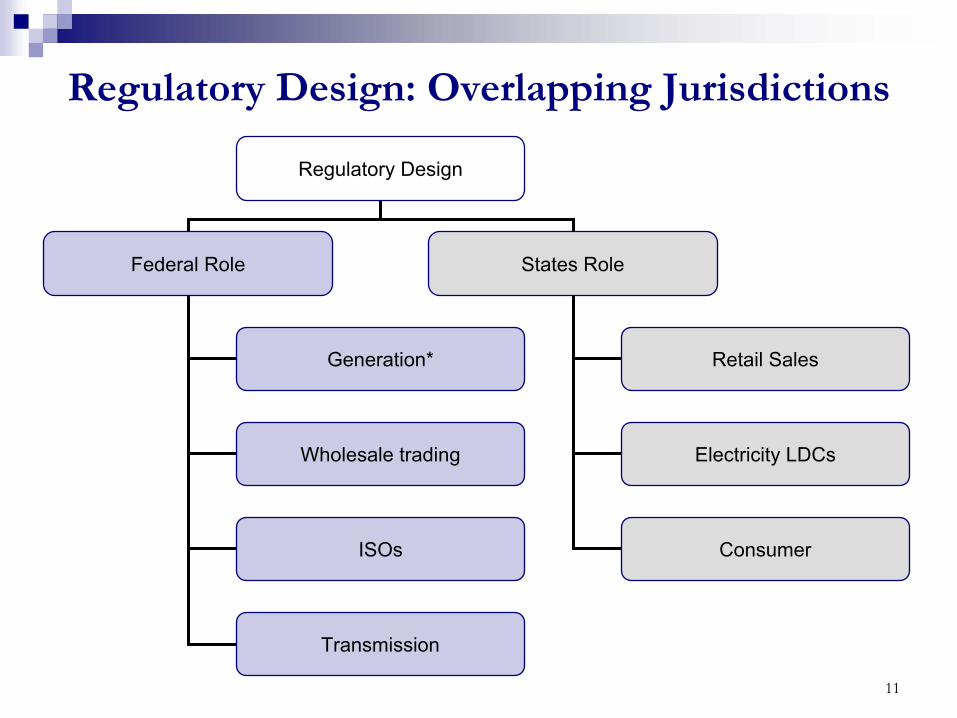
Regulatory Design: Overlapping Jurisdictions
Regulatory Design
Federal Role States Role
Generation*
Wholesale trading
Retail Sales
Electricity LDCs
ISOs
Transmission
Consumer
12
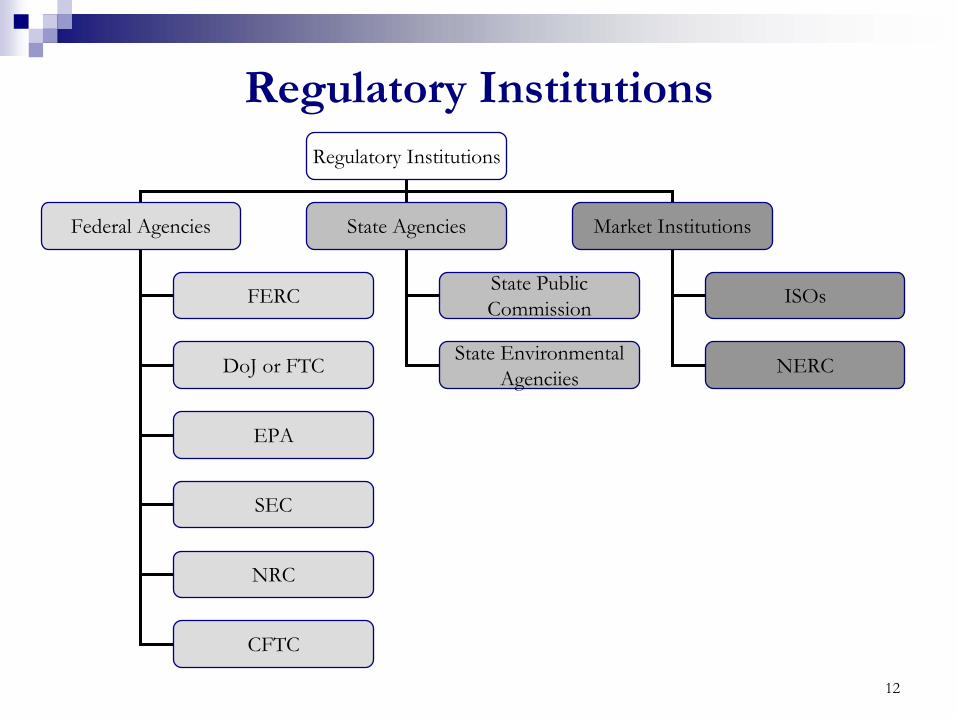
Regulatory InstitutionsRegulatory Institutions
Federal Agencies State Agencies Market Institutions
FERC
DoJ or FTC
EPA
SEC
NRC
CFTC
State Public Commission
State Environmental Agenciies
ISOs
NERC
13
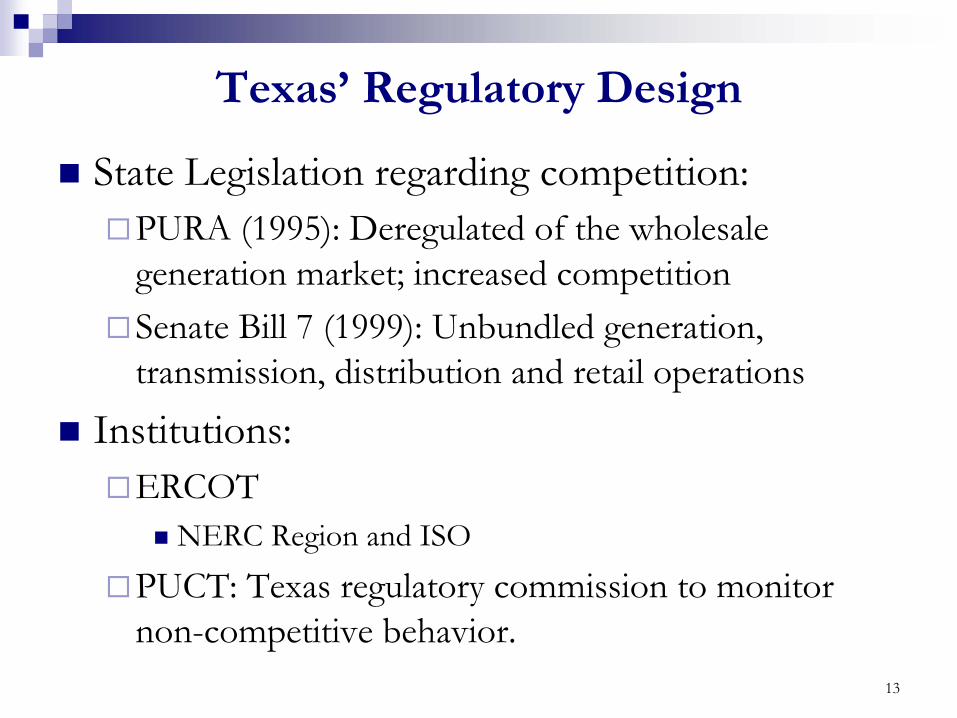
Texas’ Regulatory Design
State Legislation regarding competition:PURA (1995): Deregulated of the wholesale generation market; increased competitionSenate Bill 7 (1999): Unbundled generation, transmission, distribution and retail operations
Institutions:ERCOT
NERC Region and ISO
PUCT: Texas regulatory commission to monitor non-competitive behavior.
14
Texas’ Regulatory Design
GenerationTransmission
and Distribution
No producer can own more than 20% of the capacity in their services areas
IOUs established in generation were forced to sell up to 20% target was reached
Key players: T&D utilities and ERCOT
ERCOT is responsible for market rules
PUCT sets T&D rates on the basis of cost of services plus ROE
Wholesale market operates mainly by bilateral contracts with residual power, 5-10% is traded on the spot energy balance market.
Energy scheduling and bidding must be done by Qualified Scheduling Entities
Local Distribution
Regulated by PUCT
Unbundled from generation and T&D
PUCT establishes a price to beat for market opening and regulates services for integrated utilities
Charges are set by cost-of-services plus ROE
15
Louisiana’s Regulatory Design
State Legislation regarding competition:No actively pursuing restructuringTwo orders in regards of competition
Cogeneration and plant constructionMonitoring restructuring efforts in other states
Institutions:FERCLPSC: regulates utilities within state borders; oversees retail services; administers regulated tariffs for local distribution and entities
16
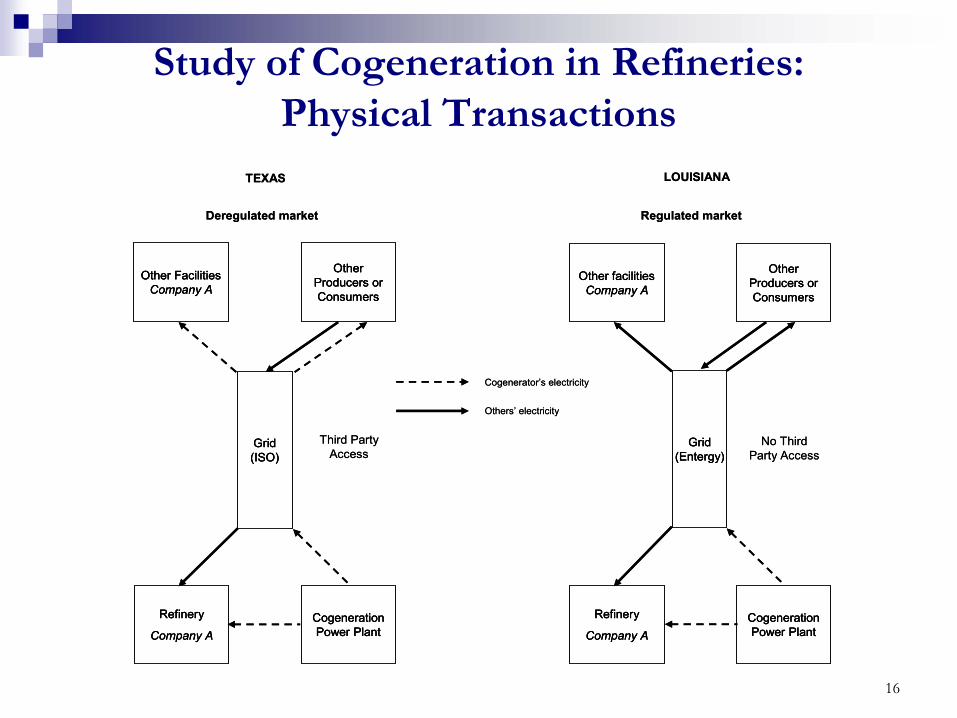
Refinery
Company A
TEXAS
Grid (ISO)
Cogeneration Power Plant
Other Facilities Company A
Other Producers or Consumers
Refinery
Company ACogeneration Power Plant
Other facilities Company A
Other Producers or Consumers
LOUISIANA
Deregulated market Regulated market
Third Party Access
No Third Party Access
Grid (Entergy)
Cogenerator’s electricity
Others’ electricity
Refinery
Company A
Refinery
Company A
TEXAS
Grid (ISO)Grid (ISO)
Cogeneration Power Plant
Cogeneration Power Plant
Other Facilities Company A
Other Facilities Company A
Other Producers or Consumers
Other Producers or Consumers
Refinery
Company A
Refinery
Company ACogeneration Power Plant
Cogeneration Power Plant
Other facilities Company A
Other facilities Company A
Other Producers or Consumers
Other Producers or Consumers
LOUISIANA
Deregulated market Regulated market
Third Party Access
No Third Party Access
Grid (Entergy)
Grid (Entergy)
Cogenerator’s electricity
Others’ electricity
Study of Cogeneration in Refineries: Physical Transactions
17
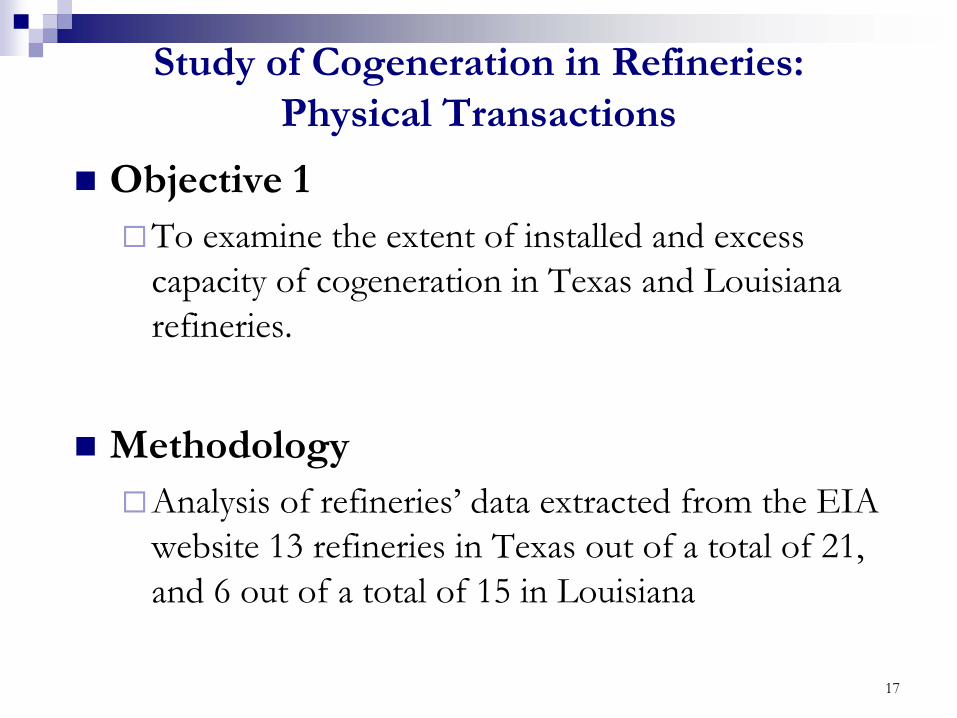
Study of Cogeneration in Refineries: Physical Transactions
Objective 1To examine the extent of installed and excess capacity of cogeneration in Texas and Louisiana refineries.
MethodologyAnalysis of refineries’ data extracted from the EIA website 13 refineries in Texas out of a total of 21, and 6 out of a total of 15 in Louisiana
18
Cogeneration in Refineries: Texas vs. Louisiana
0.31424185401,33062,772.7015Louisiana
0.61092,0012,4043,275134,627.6021Texas
Capacity of Cogeneration/Processing Capacity
(MW/TBD)
Capacity of Cogeneration
(MW)
Installed Capacity of
Power Generation
(MW)
Processing Capacity (TBD)
NumberProcessing Capacity1
(TBD)Number
Refineries Identified with Power Generation Total Refineries
Results:Capacity of cogeneration per unit of crude oil processed:
Texas: 0.61 MW/TBDLouisiana: 0.31 MW/TBDThese figures suggest that cogeneration is more used in Texas
1) Atmospheric Crude Oil Capacity. TBD: Thousand of Barrels per Calendar Day.
191. The selected refineries in Texas are connected to the ERCOT power grid.
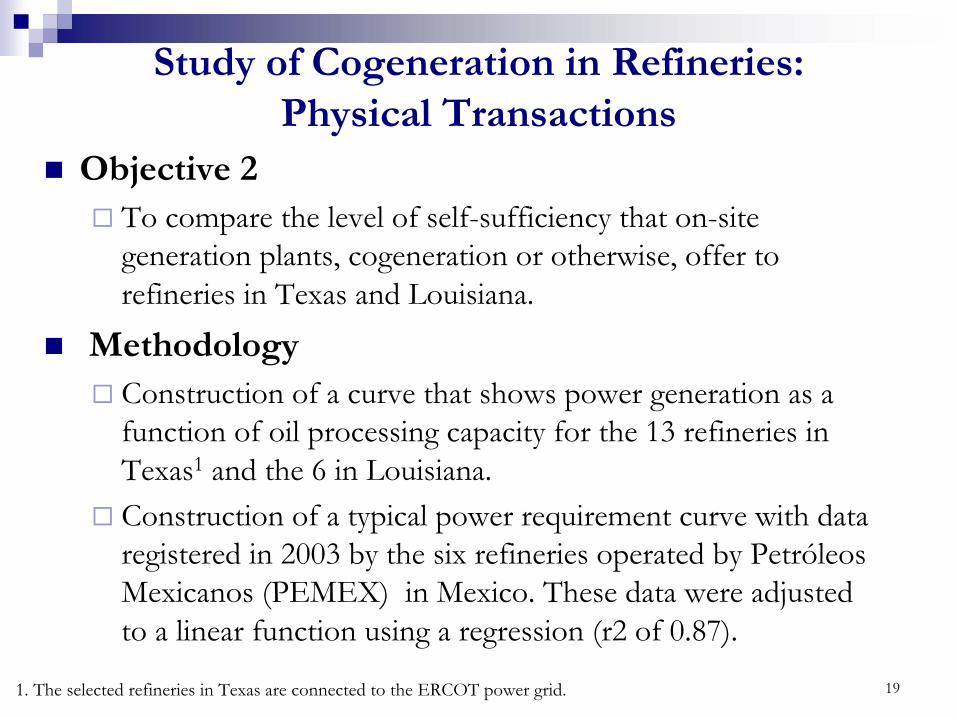
Study of Cogeneration in Refineries: Physical Transactions
Objective 2To compare the level of self-sufficiency that on-site generation plants, cogeneration or otherwise, offer to refineries in Texas and Louisiana.
MethodologyConstruction of a curve that shows power generation as a function of oil processing capacity for the 13 refineries in Texas1 and the 6 in Louisiana. Construction of a typical power requirement curve with data registered in 2003 by the six refineries operated by PetróleosMexicanos (PEMEX) in Mexico. These data were adjusted to a linear function using a regression (r2 of 0.87).
20
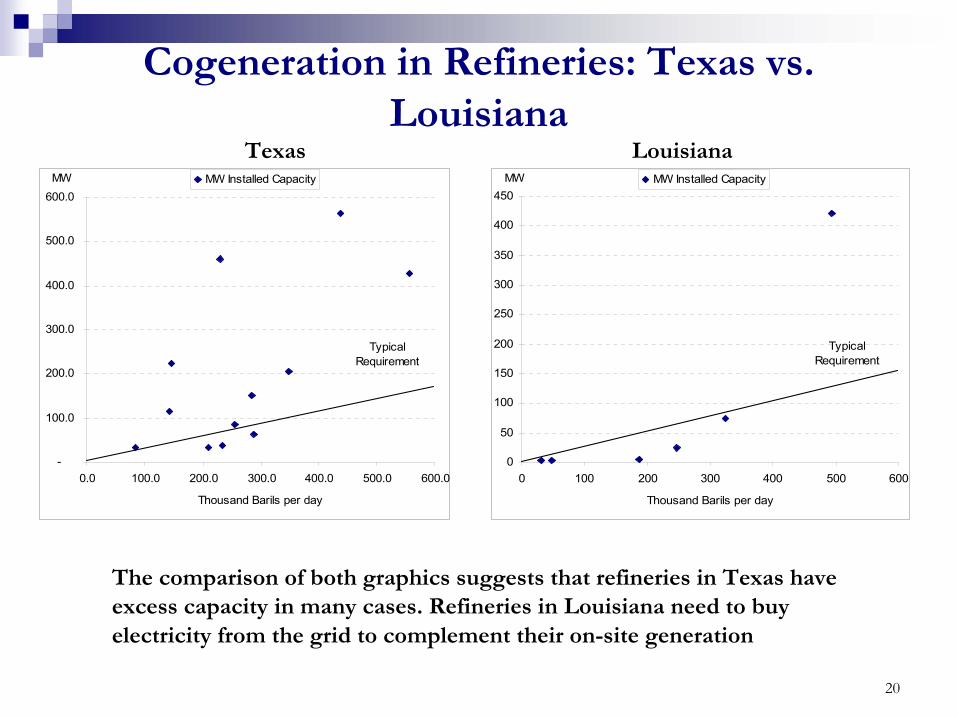
Cogeneration in Refineries: Texas vs. Louisiana
MW
-
100.0
200.0
300.0
400.0
500.0
600.0
0.0 100.0 200.0 300.0 400.0 500.0 600.0
Thousand Barils per day
MW Installed Capacity
Typical Requirement
MW
0
50
100
150
200
250
300
350
400
450
0 100 200 300 400 500 600
Thousand Barils per day
MW Installed Capacity
Typical Requirement
The comparison of both graphics suggests that refineries in Texas have excess capacity in many cases. Refineries in Louisiana need to buy electricity from the grid to complement their on-site generation
Texas Louisiana
21
ConclusionsDeregulation and introduction of competition seems to be fundamental to promote cogeneration since it:
Decentralizes powerReduces barriers of entry to new participants
“Open access” is a key element to ensure competitive generation markets
Coordinated by ISOISO without upstream or downstream affiliation
Open access was granted in PURPA, and EPAct 1992 moved to deregulation.
22
ConclusionsMore questions and answers:
Finding relevant information for most refineries in Texas and LouisianaTrying to separate impacts of PURPA and EPAct 1992 on cogeneration.
Has excess capacity developed mainly in response of PURPA?Can it be linked to evolving competitive market design in Texas?