Full Characterization of Heterogeneous Antibody Samples Under Denaturing and Native Conditions on a Hybrid Quadrupole-Orbitrap Mass Spectrometer Kai Scheffler1, Eugen Damoc2, Jennifer Sutton3, Aaron O. Bailey3, Stephane Houel3, and Jonathan Josephs3, Thermo Fisher Scientific, 1Dreieich, Germany, 2Bremen, Germany, 3San Jose, CA, USA
Po
ster No
te 64
80
5
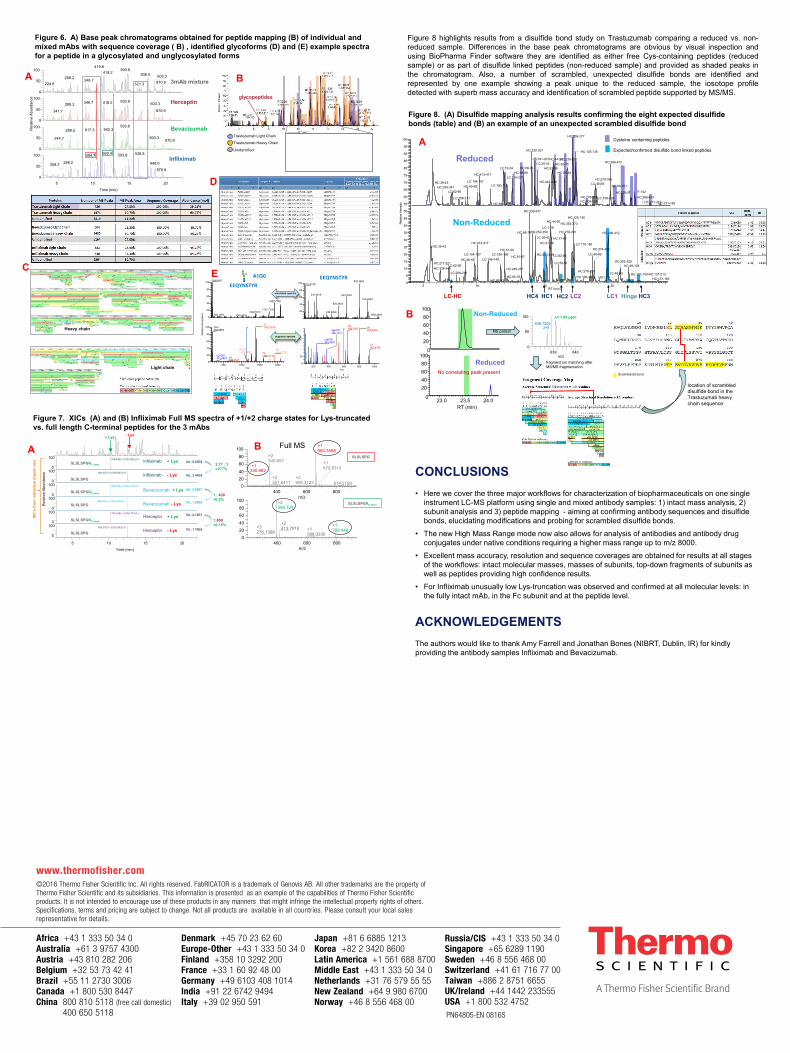
Figure 8. (A) Disulfide mapping analysis results confirming the eight expected disulfidebonds (table) and (B) an example of an unexpected scrambled disulfide bond
Kai Scheffler1, Eugen Damoc2, Jennifer Sutton3, Aaron O. Bailey3, Stephane Houel3, and Jonathan Josephs3, Thermo Fisher Scientific, 1 Dreieich, Germany, 2 Bremen, Germany, 3 San Jose, CA, USA
RESULTS – Intact mAb AnalysisINTRODUCTIONMS analysis of antibodies at the protein and peptide levels is critical during development andproduction of biopharmaceuticals. The compositions of current generation therapeutic proteinsare often complex due to their heterogeneity caused by various modifications which arerelevant for their efficacy. Intact proteins analyzed by ESI-MS are detected in higher chargestates that also provide more complexity in mass spectra. Protein analysis in native or native-like conditions with zero or minimal organic solvent and neutral or weakly acidic pH decreasescharge state value resulting in mAb detection at higher m/z ranges with more spatialresolution.Here we have analyzed the profiles of three monoclonal antibodies under denaturing andnative conditions by direct infusion with offline desalting and with on-line desalting via sizeexclusion and reversed phase type columns. The samples were analyzed with three differentworkflows (Figure 1): 1) the analysis on the intact level under native and denaturing conditions;2) the analysis of subunits following IdeS digestion and or reduction; and 3) peptide mappingfollowing sample preparation applying the Thermo Scientific™ SMART Digest™ kit.The mass spectrometer used for all experiments was a commercially available hybridquadrupole-Orbitrap mass spectrometer with modified instrument control software to allow forimproved high mass transmission and mass detection up to 8000 m/z. This modification isnecessary for the analysis of antibody samples on the intact level under native conditionsrequiring the detection of masses beyond the standard mass range of up to 6000 m/z.
MATERIALS AND METHODS The three commercially available monoclonal antibodies Trastuzumab, Trastuzumab-Emtansine, Infliximab and Bevacizumab obtained in manufacturer’s formulation buffer wereused for all experiments.Sample Preparation:For native intact mass analysis using SEC-LC/MS, the antibodies were injected without anyfurther dilution. For direct infusion analysis under denaturing conditions, samples weredesalted via Bio-Rad P6 desalting columns and diluted to achieve 50% ACN/0.1% formic acidin the solvent. For subunit analysis samples were either reduced in 4M GdHCl/50mM TCEP orfirst digested with FabRICATOR® (Genovis) enzyme according to the manufacturer’s protocoland then reduced. For peptide analysis antibodies were proteolytically digested using theSMART Digest kit following reduction with 10mM DTT. For disulfide bridge analysis, part of thesample was analyzed non-reduced.Chromatography:For intact mass analysis under native conditions proteins were online desalted using sizeexclusion chromatography (SEC) and isocratic elution with 50mM or 100mM ammoniumacetate. For reversed phase chromatography of proteins, subunits and peptides underdenaturing conditions a gradient of solvent A consisting of water 0.1% formic acid and solventB consisting of acetonitrile/0.1% formic acid was used.Mass Spectrometry:The mass spectrometers used for all experiments were commercially available Thermo Scientific™ Q Exactive™ Plus and Q Exactive™ HF mass spectrometers with modifiedinstrument control software to allow for improved high mass transmission and mass detection up to 8000 m/z.Data Analysis:Intact protein, IdeS digest and peptide mapping raw data files were analyzed with Thermo Scientific™ BioPharma Finder™1.0 SP1 software. Data for the disulfide bridge mapping wasperformed with BioPharma Finder 2.0 beta-software. For top-down analysis data ProSight Litewas used after Xtract spectral deconvolution.
CONCLUSIONS• Here we cover the three major workflows for characterization of biopharmaceuticals on one single
instrument LC-MS platform using single and mixed antibody samples: 1) intact mass analysis, 2)subunit analysis and 3) peptide mapping - aiming at confirming antibody sequences and disulfide bonds, elucidating modifications and probing for scrambled disulfide bonds.
• The new High Mass Range mode now also allows for analysis of antibodies and antibody drugconjugates under native conditions requiring a higher mass range up to m/z 8000.
• Excellent mass accuracy, resolution and sequence coverages are obtained for results at all stagesof the workflows: intact molecular masses, masses of subunits, top-down fragments of subunits aswell as peptides providing high confidence results.
• For Infliximab unusually low Lys-truncation was observed and confirmed at all molecular levels: in the fully intact mAb, in the Fc subunit and at the peptide level.
ACKNOWLEDGEMENTSThe authors would like to thank Amy Farrell and Jonathan Bones (NIBRT, Dublin, IR) for kindlyproviding the antibody samples Infliximab and Bevacizumab.
The three antibodies Trastuzumab, Infliximab and Bevacizumab wereanalyzed under native and denaturing conditions as single samples aswell as in a mixture (Figure 2A,C). The mixed sample provided the mostcomplex pattern (also due to Lys-heterogeneity of Infliximab, Figure 2E)which can be well resolved in both conditions (Figure 2 B,D) s. However,under native conditions a higher spatial resolution is obtained due to thedetection at higher m/z. The benefit of analyzing samples under nativeconditions becomes even more apparent for the antibody drug conjugateTrastuzumab-Emtansine (Figure 3 A,B) resulting in higher spatialresolution and improved, baseline resolved peaks even of overlappingpeak patterns.
The three antibodies Trastuzumab, Infliximab and Bevacizumab wereanalyzed after reduction and after FabRICATOR digest followed byreduction. Figure 3 shows Trastuzumab as a representative for LCseparation of light and heavy, Full scan acquisition at high (LC) and low(HC) resolution settings to achieve intact molecular weight followed bytop down analysis to obtain sequence confirmation. Figure 4 shows theLC chromatograms obtained for the 3 individual antibodies confirmingheterogeneity of the FC region of Infliximab due to a low degree of Lys-truncation. Very accurate intact masses for the Fc, LC and Fd’ subunitsare obtained and top town analysis thereof provides very good sequencecoverage.
The three antibodies Trastuzumab, Infliximab and Bevacizumab wereanalyzed after performing a SMART digest resulting in peptide mixtures.Obtained Base Peak Chromatograms are very similar but show distinctdifferences. All antibodies can be identified with 100% sequencecoverage when analyzed separately as well as in a mixture.Glycopeptides are confidently identified in many variations based onMS/MS spectra as shown in one example.Figure 7 highlights as well on the peptide level the low degree of Lys-truncation of Infliximab compared to Trastuzumab and Bevacizumab,confirming the results obtained on the intact and subunit levels.
Figure 1. Workflow overview covered in this poster
Figure 2. Intact mAb analysis under native and denaturing conditions
Figure 4. Intact (A) and (B) Top Down Subunit Analysis after FabRICATOR digest and reduction
020
60
1005695.4
mixture
Bevacizumab
Herceptin
Infliximab
020
60
1005722.7
5680 5720 5760m/z
020
60
1005739.3
0
20
60
1005695.5
5739.3
5500 6000 6500m/z
0
50
100
0
50
100
0
50
100
Rel
ativ
e Ab
unda
nce
0
50
1005923.2
5695.5
6169.95484.5
6487.6
5923.15695.5
6169.95484.5
6438.1
5722.7 5951.65501.4
6199.65314.0
6458-0
5968.85739.0 6217.5
5526.8 6487.8
zoom
mixture
Bevacizumab
Trastuzumab
Infliximab
2500 3000 3500 4000 4500m/z
0
50
100
0
50
100
0
50
100
Rel
ativ
e A
bund
ance
0
50
100
020
60
1003291.2
3294.7 3306.9
3320.1
0
20
60
100
Rel
ativ
e A
bund
ance
3291.1
3294.7
3298.4
020
60
1003306.9
3301.2 3310.5
3314.23296.8
3280 3300 3320m/z
020
60
1003316.5
3320.13312.0
5680 5720 5760m/z
0
20
60
100 5695.5
5739.3
Native, R=35k
3260 3280 3300 3320 3340m/z
0
20
60
1003291.2
3294.73306.9
3320.13288.0
80 Da
zoom
A
C
D
B
E
Figure 3. Trastuzumab-Emtansine ADC under native (A) and denaturing conditions (B)
B zoom
5500 6000 6500m/z
0
50
100
Rel
ativ
e A
bund
ance
6044.6R=4763
5900 6000 6100 6200m/z
0
50
100
Rel
ativ
e A
bund
ance
6044.6R=4763
5950 6000 6050m/z
0
50
100
Rel
ativ
e A
bund
ance 6006.4
R=4801
2500 3000 3500m/z
0
50
100
Rel
ativ
e A
bund
ance
3042.0R=3967
2900 3000 3100 3200m/z
0
50
100
Rel
ativ
e A
bund
ance
3042.00R=3967
2960 2980 3000m/z
0
50
100
Rel
ativ
e A
bund
ance
2982.3R=3696
Azoom zoom
zoom
Figure 8 highlights results from a disulfide bond study on Trastuzumab comparing a reduced vs. non-reduced sample. Differences in the base peak chromatograms are obvious by visual inspection andusing BioPharma Finder software they are identified as either free Cys-containing peptides (reducedsample) or as part of disulfide linked peptides (non-reduced sample) and provided as shaded peaks inthe chromatogram. Also, a number of scrambled, unexpected disulfide bonds are identified andrepresented by one example showing a peak unique to the reduced sample, the iosotope profiledetected with superb mass accuracy and identification of scrambled peptide supported by MS/MS.
B
4 6 8Time (min)
0
50
1000
50
100
Rel
ativ
e A
bund
ance
0
50
100
Trastuzumab
Bevacizumab
Infliximab
Fc-Lys
Fc-Lys
Fc Fc-Lys
LC Fd‘
LC Fd‘
LC Fd‘
A
C
Figure 7. XICs (A) and (B) Infliximab Full MS spectra of +1/+2 charge states for Lys-truncated vs. full length C-terminal peptides for the 3 mAbs
Figure 6. A) Base peak chromatograms obtained for peptide mapping (B) of individual and mixed mAbs with sequence coverage ( B) , identified glycoforms (D) and (E) example spectra for a peptide in a glycosylated and unglycosylated forms
A B
D
E
Light chain
Heavy chain
LC, 43% residue cleavages
Figure 3: Intact (A) and (B) top down subunit analysis of reduced Trastuzumab
Figure 8. (A) Disulfide mapping analysis results confirming the eight expected disulfidebonds (table) and (B) an example of an unexpected scrambled disulfide bond
Kai Scheffler1, Eugen Damoc2, Jennifer Sutton3, Aaron O. Bailey3, Stephane Houel3, and Jonathan Josephs3, Thermo Fisher Scientific, 1 Dreieich, Germany, 2 Bremen, Germany, 3 San Jose, CA, USA
RESULTS – Intact mAb AnalysisINTRODUCTIONMS analysis of antibodies at the protein and peptide levels is critical during development andproduction of biopharmaceuticals. The compositions of current generation therapeutic proteinsare often complex due to their heterogeneity caused by various modifications which arerelevant for their efficacy. Intact proteins analyzed by ESI-MS are detected in higher chargestates that also provide more complexity in mass spectra. Protein analysis in native or native-like conditions with zero or minimal organic solvent and neutral or weakly acidic pH decreasescharge state value resulting in mAb detection at higher m/z ranges with more spatialresolution.Here we have analyzed the profiles of three monoclonal antibodies under denaturing andnative conditions by direct infusion with offline desalting and with on-line desalting via sizeexclusion and reversed phase type columns. The samples were analyzed with three differentworkflows (Figure 1): 1) the analysis on the intact level under native and denaturing conditions;2) the analysis of subunits following IdeS digestion and or reduction; and 3) peptide mappingfollowing sample preparation applying the Thermo Scientific™ SMART Digest™ kit.The mass spectrometer used for all experiments was a commercially available hybridquadrupole-Orbitrap mass spectrometer with modified instrument control software to allow forimproved high mass transmission and mass detection up to 8000 m/z. This modification isnecessary for the analysis of antibody samples on the intact level under native conditionsrequiring the detection of masses beyond the standard mass range of up to 6000 m/z.
MATERIALS AND METHODS The three commercially available monoclonal antibodies Trastuzumab, Trastuzumab-Emtansine, Infliximab and Bevacizumab obtained in manufacturer’s formulation buffer wereused for all experiments.Sample Preparation:For native intact mass analysis using SEC-LC/MS, the antibodies were injected without anyfurther dilution. For direct infusion analysis under denaturing conditions, samples weredesalted via Bio-Rad P6 desalting columns and diluted to achieve 50% ACN/0.1% formic acidin the solvent. For subunit analysis samples were either reduced in 4M GdHCl/50mM TCEP orfirst digested with FabRICATOR® (Genovis) enzyme according to the manufacturer’s protocoland then reduced. For peptide analysis antibodies were proteolytically digested using theSMART Digest kit following reduction with 10mM DTT. For disulfide bridge analysis, part of thesample was analyzed non-reduced.Chromatography:For intact mass analysis under native conditions proteins were online desalted using sizeexclusion chromatography (SEC) and isocratic elution with 50mM or 100mM ammoniumacetate. For reversed phase chromatography of proteins, subunits and peptides underdenaturing conditions a gradient of solvent A consisting of water 0.1% formic acid and solventB consisting of acetonitrile/0.1% formic acid was used.Mass Spectrometry:The mass spectrometers used for all experiments were commercially available Thermo Scientific™ Q Exactive™ Plus and Q Exactive™ HF mass spectrometers with modified instrument control software to allow for improved high mass transmission and mass detection up to 8000 m/z.Data Analysis:Intact protein, IdeS digest and peptide mapping raw data files were analyzed with Thermo Scientific™ BioPharma Finder™1.0 SP1 software. Data for the disulfide bridge mapping was performed with BioPharma Finder 2.0 beta-software. For top-down analysis data ProSight Litewas used after Xtract spectral deconvolution.
CONCLUSIONS• Here we cover the three major workflows for characterization of biopharmaceuticals on one single
instrument LC-MS platform using single and mixed antibody samples: 1) intact mass analysis, 2)subunit analysis and 3) peptide mapping - aiming at confirming antibody sequences and disulfide bonds, elucidating modifications and probing for scrambled disulfide bonds.
• The new High Mass Range mode now also allows for analysis of antibodies and antibody drugconjugates under native conditions requiring a higher mass range up to m/z 8000.
• Excellent mass accuracy, resolution and sequence coverages are obtained for results at all stagesof the workflows: intact molecular masses, masses of subunits, top-down fragments of subunits aswell as peptides providing high confidence results.
• For Infliximab unusually low Lys-truncation was observed and confirmed at all molecular levels: in the fully intact mAb, in the Fc subunit and at the peptide level.
ACKNOWLEDGEMENTSThe authors would like to thank Amy Farrell and Jonathan Bones (NIBRT, Dublin, IR) for kindlyproviding the antibody samples Infliximab and Bevacizumab.
The three antibodies Trastuzumab, Infliximab and Bevacizumab wereanalyzed under native and denaturing conditions as single samples aswell as in a mixture (Figure 2A,C). The mixed sample provided the mostcomplex pattern (also due to Lys-heterogeneity of Infliximab, Figure 2E)which can be well resolved in both conditions (Figure 2 B,D) s. However,under native conditions a higher spatial resolution is obtained due to thedetection at higher m/z. The benefit of analyzing samples under nativeconditions becomes even more apparent for the antibody drug conjugateTrastuzumab-Emtansine (Figure 3 A,B) resulting in higher spatialresolution and improved, baseline resolved peaks even of overlappingpeak patterns.
The three antibodies Trastuzumab, Infliximab and Bevacizumab wereanalyzed after reduction and after FabRICATOR digest followed byreduction. Figure 3 shows Trastuzumab as a representative for LCseparation of light and heavy, Full scan acquisition at high (LC) and low(HC) resolution settings to achieve intact molecular weight followed bytop down analysis to obtain sequence confirmation. Figure 4 shows theLC chromatograms obtained for the 3 individual antibodies confirmingheterogeneity of the FC region of Infliximab due to a low degree of Lys-truncation. Very accurate intact masses for the Fc, LC and Fd’ subunitsare obtained and top town analysis thereof provides very good sequencecoverage.
The three antibodies Trastuzumab, Infliximab and Bevacizumab wereanalyzed after performing a SMART digest resulting in peptide mixtures.Obtained Base Peak Chromatograms are very similar but show distinctdifferences. All antibodies can be identified with 100% sequencecoverage when analyzed separately as well as in a mixture.Glycopeptides are confidently identified in many variations based onMS/MS spectra as shown in one example.Figure 7 highlights as well on the peptide level the low degree of Lys-truncation of Infliximab compared to Trastuzumab and Bevacizumab,confirming the results obtained on the intact and subunit levels.
Figure 1. Workflow overview covered in this poster
Figure 2. Intact mAb analysis under native and denaturing conditions
Figure 4. Intact (A) and (B) Top Down Subunit Analysis after FabRICATOR digest and reduction
020
60
1005695.4
mixture
Bevacizumab
Herceptin
Infliximab
020
60
1005722.7
5680 5720 5760m/z
020
60
1005739.3
0
20
60
1005695.5
5739.3
5500 6000 6500m/z
0
50
100
0
50
100
0
50
100
Rel
ativ
e Ab
unda
nce
0
50
1005923.2
5695.5
6169.95484.5
6487.6
5923.15695.5
6169.95484.5
6438.1
5722.7 5951.65501.4
6199.65314.0
6458-0
5968.85739.0 6217.5
5526.8 6487.8
zoom
mixture
Bevacizumab
Trastuzumab
Infliximab
2500 3000 3500 4000 4500m/z
0
50
100
0
50
100
0
50
100
Rel
ativ
e A
bund
ance
0
50
100
020
60
1003291.2
3294.7 3306.9
3320.1
0
20
60
100
Rel
ativ
e A
bund
ance
3291.1
3294.7
3298.4
020
60
1003306.9
3301.2 3310.5
3314.23296.8
3280 3300 3320m/z
020
60
1003316.5
3320.13312.0
5680 5720 5760m/z
0
20
60
100 5695.5
5739.3
Native, R=35k
3260 3280 3300 3320 3340m/z
0
20
60
1003291.2
3294.73306.9
3320.13288.0
80 Da
zoom
A
C
D
B
E
Figure 3. Trastuzumab-Emtansine ADC under native (A) and denaturing conditions (B)
B zoom
5500 6000 6500m/z
0
50
100
Rel
ativ
e A
bund
ance
6044.6R=4763
5900 6000 6100 6200m/z
0
50
100
Rel
ativ
e A
bund
ance
6044.6R=4763
5950 6000 6050m/z
0
50
100
Rel
ativ
e A
bund
ance 6006.4
R=4801
2500 3000 3500m/z
0
50
100
Rel
ativ
e A
bund
ance
3042.0R=3967
2900 3000 3100 3200m/z
0
50
100
Rel
ativ
e A
bund
ance
3042.00R=3967
2960 2980 3000m/z
0
50
100
Rel
ativ
e A
bund
ance
2982.3R=3696
Azoom zoom
zoom
Figure 8 highlights results from a disulfide bond study on Trastuzumab comparing a reduced vs. non-reduced sample. Differences in the base peak chromatograms are obvious by visual inspection andusing BioPharma Finder software they are identified as either free Cys-containing peptides (reducedsample) or as part of disulfide linked peptides (non-reduced sample) and provided as shaded peaks inthe chromatogram. Also, a number of scrambled, unexpected disulfide bonds are identified andrepresented by one example showing a peak unique to the reduced sample, the iosotope profiledetected with superb mass accuracy and identification of scrambled peptide supported by MS/MS.
B
4 6 8Time (min)
0
50
1000
50
100
Rel
ativ
e A
bund
ance
0
50
100
Trastuzumab
Bevacizumab
Infliximab
Fc-Lys
Fc-Lys
Fc Fc-Lys
LC Fd‘
LC Fd‘
LC Fd‘
A
C
Figure 7. XICs (A) and (B) Infliximab Full MS spectra of +1/+2 charge states for Lys-truncated vs. full length C-terminal peptides for the 3 mAbs
Figure 6. A) Base peak chromatograms obtained for peptide mapping (B) of individual and mixed mAbs with sequence coverage ( B) , identified glycoforms (D) and (E) example spectra for a peptide in a glycosylated and unglycosylated forms
A B
D
E
Light chain
Heavy chain
LC, 43% residue cleavages
Figure 3: Intact (A) and (B) top down subunit analysis of reduced Trastuzumab
Figure 8. (A) Disulfide mapping analysis results confirming the eight expected disulfidebonds (table) and (B) an example of an unexpected scrambled disulfide bond
Kai Scheffler1, Eugen Damoc2, Jennifer Sutton3, Aaron O. Bailey3, Stephane Houel3, and Jonathan Josephs3, Thermo Fisher Scientific, 1 Dreieich, Germany, 2 Bremen, Germany, 3 San Jose, CA, USA
RESULTS – Intact mAb AnalysisINTRODUCTIONMS analysis of antibodies at the protein and peptide levels is critical during development andproduction of biopharmaceuticals. The compositions of current generation therapeutic proteinsare often complex due to their heterogeneity caused by various modifications which arerelevant for their efficacy. Intact proteins analyzed by ESI-MS are detected in higher chargestates that also provide more complexity in mass spectra. Protein analysis in native or native-like conditions with zero or minimal organic solvent and neutral or weakly acidic pH decreasescharge state value resulting in mAb detection at higher m/z ranges with more spatialresolution.Here we have analyzed the profiles of three monoclonal antibodies under denaturing andnative conditions by direct infusion with offline desalting and with on-line desalting via sizeexclusion and reversed phase type columns. The samples were analyzed with three differentworkflows (Figure 1): 1) the analysis on the intact level under native and denaturing conditions;2) the analysis of subunits following IdeS digestion and or reduction; and 3) peptide mappingfollowing sample preparation applying the Thermo Scientific™ SMART Digest™ kit.The mass spectrometer used for all experiments was a commercially available hybridquadrupole-Orbitrap mass spectrometer with modified instrument control software to allow forimproved high mass transmission and mass detection up to 8000 m/z. This modification isnecessary for the analysis of antibody samples on the intact level under native conditionsrequiring the detection of masses beyond the standard mass range of up to 6000 m/z.
MATERIALS AND METHODS The three commercially available monoclonal antibodies Trastuzumab, Trastuzumab-Emtansine, Infliximab and Bevacizumab obtained in manufacturer’s formulation buffer wereused for all experiments.Sample Preparation:For native intact mass analysis using SEC-LC/MS, the antibodies were injected without anyfurther dilution. For direct infusion analysis under denaturing conditions, samples weredesalted via Bio-Rad P6 desalting columns and diluted to achieve 50% ACN/0.1% formic acidin the solvent. For subunit analysis samples were either reduced in 4M GdHCl/50mM TCEP orfirst digested with FabRICATOR® (Genovis) enzyme according to the manufacturer’s protocoland then reduced. For peptide analysis antibodies were proteolytically digested using theSMART Digest kit following reduction with 10mM DTT. For disulfide bridge analysis, part of thesample was analyzed non-reduced.Chromatography:For intact mass analysis under native conditions proteins were online desalted using sizeexclusion chromatography (SEC) and isocratic elution with 50mM or 100mM ammoniumacetate. For reversed phase chromatography of proteins, subunits and peptides underdenaturing conditions a gradient of solvent A consisting of water 0.1% formic acid and solventB consisting of acetonitrile/0.1% formic acid was used.Mass Spectrometry:The mass spectrometers used for all experiments were commercially available Thermo Scientific™ Q Exactive™ Plus and Q Exactive™ HF mass spectrometers with modifiedinstrument control software to allow for improved high mass transmission and mass detection up to 8000 m/z.Data Analysis:Intact protein, IdeS digest and peptide mapping raw data files were analyzed with Thermo Scientific™ BioPharma Finder™1.0 SP1 software. Data for the disulfide bridge mapping wasperformed with BioPharma Finder 2.0 beta-software. For top-down analysis data ProSight Litewas used after Xtract spectral deconvolution.
CONCLUSIONS• Here we cover the three major workflows for characterization of biopharmaceuticals on one single
instrument LC-MS platform using single and mixed antibody samples: 1) intact mass analysis, 2)subunit analysis and 3) peptide mapping - aiming at confirming antibody sequences and disulfide bonds, elucidating modifications and probing for scrambled disulfide bonds.
• The new High Mass Range mode now also allows for analysis of antibodies and antibody drugconjugates under native conditions requiring a higher mass range up to m/z 8000.
• Excellent mass accuracy, resolution and sequence coverages are obtained for results at all stagesof the workflows: intact molecular masses, masses of subunits, top-down fragments of subunits aswell as peptides providing high confidence results.
• For Infliximab unusually low Lys-truncation was observed and confirmed at all molecular levels: in the fully intact mAb, in the Fc subunit and at the peptide level.
ACKNOWLEDGEMENTSThe authors would like to thank Amy Farrell and Jonathan Bones (NIBRT, Dublin, IR) for kindlyproviding the antibody samples Infliximab and Bevacizumab.
The three antibodies Trastuzumab, Infliximab and Bevacizumab wereanalyzed under native and denaturing conditions as single samples aswell as in a mixture (Figure 2A,C). The mixed sample provided the mostcomplex pattern (also due to Lys-heterogeneity of Infliximab, Figure 2E)which can be well resolved in both conditions (Figure 2 B,D) s. However,under native conditions a higher spatial resolution is obtained due to thedetection at higher m/z. The benefit of analyzing samples under nativeconditions becomes even more apparent for the antibody drug conjugateTrastuzumab-Emtansine (Figure 3 A,B) resulting in higher spatialresolution and improved, baseline resolved peaks even of overlappingpeak patterns.
The three antibodies Trastuzumab, Infliximab and Bevacizumab wereanalyzed after reduction and after FabRICATOR digest followed byreduction. Figure 3 shows Trastuzumab as a representative for LCseparation of light and heavy, Full scan acquisition at high (LC) and low(HC) resolution settings to achieve intact molecular weight followed bytop down analysis to obtain sequence confirmation. Figure 4 shows theLC chromatograms obtained for the 3 individual antibodies confirmingheterogeneity of the FC region of Infliximab due to a low degree of Lys-truncation. Very accurate intact masses for the Fc, LC and Fd’ subunitsare obtained and top town analysis thereof provides very good sequencecoverage.
The three antibodies Trastuzumab, Infliximab and Bevacizumab wereanalyzed after performing a SMART digest resulting in peptide mixtures.Obtained Base Peak Chromatograms are very similar but show distinctdifferences. All antibodies can be identified with 100% sequencecoverage when analyzed separately as well as in a mixture.Glycopeptides are confidently identified in many variations based onMS/MS spectra as shown in one example.Figure 7 highlights as well on the peptide level the low degree of Lys-truncation of Infliximab compared to Trastuzumab and Bevacizumab,confirming the results obtained on the intact and subunit levels.
Figure 1. Workflow overview covered in this poster
Figure 2. Intact mAb analysis under native and denaturing conditions
Figure 4. Intact (A) and (B) Top Down Subunit Analysis after FabRICATOR digest and reduction
020
60
1005695.4
mixture
Bevacizumab
Herceptin
Infliximab
020
60
1005722.7
5680 5720 5760m/z
020
60
1005739.3
0
20
60
1005695.5
5739.3
5500 6000 6500m/z
0
50
100
0
50
100
0
50
100
Rel
ativ
e Ab
unda
nce
0
50
1005923.2
5695.5
6169.95484.5
6487.6
5923.15695.5
6169.95484.5
6438.1
5722.7 5951.65501.4
6199.65314.0
6458-0
5968.85739.0 6217.5
5526.8 6487.8
zoom
mixture
Bevacizumab
Trastuzumab
Infliximab
2500 3000 3500 4000 4500m/z
0
50
100
0
50
100
0
50
100
Rel
ativ
e A
bund
ance
0
50
100
020
60
1003291.2
3294.7 3306.9
3320.1
0
20
60
100
Rel
ativ
e A
bund
ance
3291.1
3294.7
3298.4
020
60
1003306.9
3301.2 3310.5
3314.23296.8
3280 3300 3320m/z
020
60
1003316.5
3320.13312.0
5680 5720 5760m/z
0
20
60
100 5695.5
5739.3
Native, R=35k
3260 3280 3300 3320 3340m/z
0
20
60
1003291.2
3294.73306.9
3320.13288.0
80 Da
zoom
A
C
D
B
E
Figure 3. Trastuzumab-Emtansine ADC under native (A) and denaturing conditions (B)
B zoom
5500 6000 6500m/z
0
50
100
Rel
ativ
e A
bund
ance
6044.6R=4763
5900 6000 6100 6200m/z
0
50
100
Rel
ativ
e A
bund
ance
6044.6R=4763
5950 6000 6050m/z
0
50
100
Rel
ativ
e A
bund
ance 6006.4
R=4801
2500 3000 3500m/z
0
50
100
Rel
ativ
e A
bund
ance
3042.0R=3967
2900 3000 3100 3200m/z
0
50
100
Rel
ativ
e A
bund
ance
3042.00R=3967
2960 2980 3000m/z
0
50
100
Rel
ativ
e A
bund
ance
2982.3R=3696
Azoom zoom
zoom
Figure 8 highlights results from a disulfide bond study on Trastuzumab comparing a reduced vs. non-reduced sample. Differences in the base peak chromatograms are obvious by visual inspection andusing BioPharma Finder software they are identified as either free Cys-containing peptides (reducedsample) or as part of disulfide linked peptides (non-reduced sample) and provided as shaded peaks inthe chromatogram. Also, a number of scrambled, unexpected disulfide bonds are identified andrepresented by one example showing a peak unique to the reduced sample, the iosotope profiledetected with superb mass accuracy and identification of scrambled peptide supported by MS/MS.
B
4 6 8Time (min)
0
50
1000
50
100
Rel
ativ
e A
bund
ance
0
50
100
Trastuzumab
Bevacizumab
Infliximab
Fc-Lys
Fc-Lys
Fc Fc-Lys
LC Fd‘
LC Fd‘
LC Fd‘
A
C
Figure 7. XICs (A) and (B) Infliximab Full MS spectra of +1/+2 charge states for Lys-truncated vs. full length C-terminal peptides for the 3 mAbs
Figure 6. A) Base peak chromatograms obtained for peptide mapping (B) of individual and mixed mAbs with sequence coverage ( B) , identified glycoforms (D) and (E) example spectra for a peptide in a glycosylated and unglycosylated forms
A B
D
E
Light chain
Heavy chain
LC, 43% residue cleavages
Figure 3: Intact (A) and (B) top down subunit analysis of reduced Trastuzumab
2 Full Characterization of Heterogeneous Antibody Samples Under Denaturing and Native Conditions on a Hybrid Quadrupole-Orbitrap Mass Spectrometer
Figure 8. (A) Disulfide mapping analysis results confirming the eight expected disulfide bonds (table) and (B) an example of an unexpected scrambled disulfide bond
Kai Scheffler1, Eugen Damoc2, Jennifer Sutton3, Aaron O. Bailey3, Stephane Houel3, and Jonathan Josephs3, Thermo Fisher Scientific, 1 Dreieich, Germany, 2 Bremen, Germany, 3 San Jose, CA, USA
RESULTS – Intact mAb AnalysisINTRODUCTIONMS analysis of antibodies at the protein and peptide levels is critical during development andproduction of biopharmaceuticals. The compositions of current generation therapeutic proteinsare often complex due to their heterogeneity caused by various modifications which arerelevant for their efficacy. Intact proteins analyzed by ESI-MS are detected in higher chargestates that also provide more complexity in mass spectra. Protein analysis in native or native-like conditions with zero or minimal organic solvent and neutral or weakly acidic pH decreasescharge state value resulting in mAb detection at higher m/z ranges with more spatialresolution.Here we have analyzed the profiles of three monoclonal antibodies under denaturing andnative conditions by direct infusion with offline desalting and with on-line desalting via sizeexclusion and reversed phase type columns. The samples were analyzed with three differentworkflows (Figure 1): 1) the analysis on the intact level under native and denaturing conditions;2) the analysis of subunits following IdeS digestion and or reduction; and 3) peptide mappingfollowing sample preparation applying the Thermo Scientific™ SMART Digest™ kit.The mass spectrometer used for all experiments was a commercially available hybridquadrupole-Orbitrap mass spectrometer with modified instrument control software to allow forimproved high mass transmission and mass detection up to 8000 m/z. This modification isnecessary for the analysis of antibody samples on the intact level under native conditionsrequiring the detection of masses beyond the standard mass range of up to 6000 m/z.
MATERIALS AND METHODS The three commercially available monoclonal antibodies Trastuzumab, Trastuzumab-Emtansine, Infliximab and Bevacizumab obtained in manufacturer’s formulation buffer wereused for all experiments.Sample Preparation:For native intact mass analysis using SEC-LC/MS, the antibodies were injected without anyfurther dilution. For direct infusion analysis under denaturing conditions, samples weredesalted via Bio-Rad P6 desalting columns and diluted to achieve 50% ACN/0.1% formic acidin the solvent. For subunit analysis samples were either reduced in 4M GdHCl/50mM TCEP orfirst digested with FabRICATOR® (Genovis) enzyme according to the manufacturer’s protocoland then reduced. For peptide analysis antibodies were proteolytically digested using theSMART Digest kit following reduction with 10mM DTT. For disulfide bridge analysis, part of thesample was analyzed non-reduced.Chromatography:For intact mass analysis under native conditions proteins were online desalted using sizeexclusion chromatography (SEC) and isocratic elution with 50mM or 100mM ammoniumacetate. For reversed phase chromatography of proteins, subunits and peptides underdenaturing conditions a gradient of solvent A consisting of water 0.1% formic acid and solventB consisting of acetonitrile/0.1% formic acid was used.Mass Spectrometry:The mass spectrometers used for all experiments were commercially available Thermo Scientific™ Q Exactive™ Plus and Q Exactive™ HF mass spectrometers with modified instrument control software to allow for improved high mass transmission and mass detection up to 8000 m/z.Data Analysis:Intact protein, IdeS digest and peptide mapping raw data files were analyzed with Thermo Scientific™ BioPharma Finder™1.0 SP1 software. Data for the disulfide bridge mapping was performed with BioPharma Finder 2.0 beta-software. For top-down analysis data ProSight Litewas used after Xtract spectral deconvolution.
CONCLUSIONS• Here we cover the three major workflows for characterization of biopharmaceuticals on one single
instrument LC-MS platform using single and mixed antibody samples: 1) intact mass analysis, 2) subunit analysis and 3) peptide mapping - aiming at confirming antibody sequences and disulfide bonds, elucidating modifications and probing for scrambled disulfide bonds.
• The new High Mass Range mode now also allows for analysis of antibodies and antibody drug conjugates under native conditions requiring a higher mass range up to m/z 8000.
• Excellent mass accuracy, resolution and sequence coverages are obtained for results at all stages of the workflows: intact molecular masses, masses of subunits, top-down fragments of subunits as well as peptides providing high confidence results.
• For Infliximab unusually low Lys-truncation was observed and confirmed at all molecular levels: in the fully intact mAb, in the Fc subunit and at the peptide level.
ACKNOWLEDGEMENTSThe authors would like to thank Amy Farrell and Jonathan Bones (NIBRT, Dublin, IR) for kindly providing the antibody samples Infliximab and Bevacizumab.
The three antibodies Trastuzumab, Infliximab and Bevacizumab wereanalyzed under native and denaturing conditions as single samples aswell as in a mixture (Figure 2A,C). The mixed sample provided the mostcomplex pattern (also due to Lys-heterogeneity of Infliximab, Figure 2E)which can be well resolved in both conditions (Figure 2 B,D) s. However,under native conditions a higher spatial resolution is obtained due to thedetection at higher m/z. The benefit of analyzing samples under nativeconditions becomes even more apparent for the antibody drug conjugateTrastuzumab-Emtansine (Figure 3 A,B) resulting in higher spatialresolution and improved, baseline resolved peaks even of overlappingpeak patterns.
The three antibodies Trastuzumab, Infliximab and Bevacizumab wereanalyzed after reduction and after FabRICATOR digest followed byreduction. Figure 3 shows Trastuzumab as a representative for LCseparation of light and heavy, Full scan acquisition at high (LC) and low(HC) resolution settings to achieve intact molecular weight followed bytop down analysis to obtain sequence confirmation. Figure 4 shows theLC chromatograms obtained for the 3 individual antibodies confirmingheterogeneity of the FC region of Infliximab due to a low degree of Lys-truncation. Very accurate intact masses for the Fc, LC and Fd’ subunitsare obtained and top town analysis thereof provides very good sequencecoverage.
The three antibodies Trastuzumab, Infliximab and Bevacizumab wereanalyzed after performing a SMART digest resulting in peptide mixtures.Obtained Base Peak Chromatograms are very similar but show distinctdifferences. All antibodies can be identified with 100% sequencecoverage when analyzed separately as well as in a mixture.Glycopeptides are confidently identified in many variations based onMS/MS spectra as shown in one example.Figure 7 highlights as well on the peptide level the low degree of Lys-truncation of Infliximab compared to Trastuzumab and Bevacizumab,confirming the results obtained on the intact and subunit levels.
Figure 1. Workflow overview covered in this poster
Figure 2. Intact mAb analysis under native and denaturing conditions
Figure 4. Intact (A) and (B) Top Down Subunit Analysis after FabRICATOR digest and reduction
020
60
1005695.4
mixture
Bevacizumab
Herceptin
Infliximab
020
60
1005722.7
5680 5720 5760m/z
020
60
1005739.3
0
20
60
1005695.5
5739.3
5500 6000 6500m/z
0
50
100
0
50
100
0
50
100
Rel
ativ
e Ab
unda
nce
0
50
1005923.2
5695.5
6169.95484.5
6487.6
5923.15695.5
6169.95484.5
6438.1
5722.7 5951.65501.4
6199.65314.0
6458-0
5968.85739.0 6217.5
5526.8 6487.8
zoom
mixture
Bevacizumab
Trastuzumab
Infliximab
2500 3000 3500 4000 4500m/z
0
50
100
0
50
100
0
50
100
Rel
ativ
e A
bund
ance
0
50
100
020
60
1003291.2
3294.7 3306.9
3320.1
0
20
60
100
Rel
ativ
e A
bund
ance
3291.1
3294.7
3298.4
020
60
1003306.9
3301.2 3310.5
3314.23296.8
3280 3300 3320m/z
020
60
1003316.5
3320.13312.0
5680 5720 5760m/z
0
20
60
100 5695.5
5739.3
Native, R=35k
3260 3280 3300 3320 3340m/z
0
20
60
1003291.2
3294.73306.9
3320.13288.0
80 Da
zoom
A
C
D
B
E
Figure 3. Trastuzumab-Emtansine ADC under native (A) and denaturing conditions (B)
B zoom
5500 6000 6500m/z
0
50
100
Rel
ativ
e A
bund
ance
6044.6R=4763
5900 6000 6100 6200m/z
0
50
100
Rel
ativ
e A
bund
ance
6044.6R=4763
5950 6000 6050m/z
0
50
100
Rel
ativ
e A
bund
ance 6006.4
R=4801
2500 3000 3500m/z
0
50
100
Rel
ativ
e A
bund
ance
3042.0R=3967
2900 3000 3100 3200m/z
0
50
100
Rel
ativ
e A
bund
ance
3042.00R=3967
2960 2980 3000m/z
0
50
100
Rel
ativ
e A
bund
ance
2982.3R=3696
Azoom zoom
zoom
Figure 8 highlights results from a disulfide bond study on Trastuzumab comparing a reduced vs. non-reduced sample. Differences in the base peak chromatograms are obvious by visual inspection andusing BioPharma Finder software they are identified as either free Cys-containing peptides (reducedsample) or as part of disulfide linked peptides (non-reduced sample) and provided as shaded peaks inthe chromatogram. Also, a number of scrambled, unexpected disulfide bonds are identified andrepresented by one example showing a peak unique to the reduced sample, the iosotope profiledetected with superb mass accuracy and identification of scrambled peptide supported by MS/MS.
B
4 6 8Time (min)
0
50
1000
50
100
Rel
ativ
e A
bund
ance
0
50
100
Trastuzumab
Bevacizumab
Infliximab
Fc-Lys
Fc-Lys
Fc Fc-Lys
LC Fd‘
LC Fd‘
LC Fd‘
A
C
Figure 7. XICs (A) and (B) Infliximab Full MS spectra of +1/+2 charge states for Lys-truncated vs. full length C-terminal peptides for the 3 mAbs
Figure 6. A) Base peak chromatograms obtained for peptide mapping (B) of individual and mixed mAbs with sequence coverage ( B) , identified glycoforms (D) and (E) example spectra for a peptide in a glycosylated and unglycosylated forms
A B
D
E
Light chain
Heavy chain
LC, 43% residue cleavages
Figure 3: Intact (A) and (B) top down subunit analysis of reduced Trastuzumab
Figure 8. (A) Disulfide mapping analysis results confirming the eight expected disulfidebonds (table) and (B) an example of an unexpected scrambled disulfide bond
Kai Scheffler1, Eugen Damoc2, Jennifer Sutton3, Aaron O. Bailey3, Stephane Houel3, and Jonathan Josephs3, Thermo Fisher Scientific, 1 Dreieich, Germany, 2 Bremen, Germany, 3 San Jose, CA, USA
RESULTS – Intact mAb AnalysisINTRODUCTIONMS analysis of antibodies at the protein and peptide levels is critical during development andproduction of biopharmaceuticals. The compositions of current generation therapeutic proteinsare often complex due to their heterogeneity caused by various modifications which arerelevant for their efficacy. Intact proteins analyzed by ESI-MS are detected in higher chargestates that also provide more complexity in mass spectra. Protein analysis in native or native-like conditions with zero or minimal organic solvent and neutral or weakly acidic pH decreasescharge state value resulting in mAb detection at higher m/z ranges with more spatialresolution.Here we have analyzed the profiles of three monoclonal antibodies under denaturing andnative conditions by direct infusion with offline desalting and with on-line desalting via sizeexclusion and reversed phase type columns. The samples were analyzed with three differentworkflows (Figure 1): 1) the analysis on the intact level under native and denaturing conditions;2) the analysis of subunits following IdeS digestion and or reduction; and 3) peptide mappingfollowing sample preparation applying the Thermo Scientific™ SMART Digest™ kit.The mass spectrometer used for all experiments was a commercially available hybridquadrupole-Orbitrap mass spectrometer with modified instrument control software to allow forimproved high mass transmission and mass detection up to 8000 m/z. This modification isnecessary for the analysis of antibody samples on the intact level under native conditionsrequiring the detection of masses beyond the standard mass range of up to 6000 m/z.
MATERIALS AND METHODS The three commercially available monoclonal antibodies Trastuzumab, Trastuzumab-Emtansine, Infliximab and Bevacizumab obtained in manufacturer’s formulation buffer wereused for all experiments.Sample Preparation:For native intact mass analysis using SEC-LC/MS, the antibodies were injected without anyfurther dilution. For direct infusion analysis under denaturing conditions, samples weredesalted via Bio-Rad P6 desalting columns and diluted to achieve 50% ACN/0.1% formic acidin the solvent. For subunit analysis samples were either reduced in 4M GdHCl/50mM TCEP orfirst digested with FabRICATOR® (Genovis) enzyme according to the manufacturer’s protocoland then reduced. For peptide analysis antibodies were proteolytically digested using theSMART Digest kit following reduction with 10mM DTT. For disulfide bridge analysis, part of thesample was analyzed non-reduced.Chromatography:For intact mass analysis under native conditions proteins were online desalted using sizeexclusion chromatography (SEC) and isocratic elution with 50mM or 100mM ammoniumacetate. For reversed phase chromatography of proteins, subunits and peptides underdenaturing conditions a gradient of solvent A consisting of water 0.1% formic acid and solventB consisting of acetonitrile/0.1% formic acid was used.Mass Spectrometry:The mass spectrometers used for all experiments were commercially available Thermo Scientific™ Q Exactive™ Plus and Q Exactive™ HF mass spectrometers with modifiedinstrument control software to allow for improved high mass transmission and mass detection up to 8000 m/z.Data Analysis:Intact protein, IdeS digest and peptide mapping raw data files were analyzed with Thermo Scientific™ BioPharma Finder™1.0 SP1 software. Data for the disulfide bridge mapping wasperformed with BioPharma Finder 2.0 beta-software. For top-down analysis data ProSight Litewas used after Xtract spectral deconvolution.
CONCLUSIONS• Here we cover the three major workflows for characterization of biopharmaceuticals on one single
instrument LC-MS platform using single and mixed antibody samples: 1) intact mass analysis, 2)subunit analysis and 3) peptide mapping - aiming at confirming antibody sequences and disulfide bonds, elucidating modifications and probing for scrambled disulfide bonds.
• The new High Mass Range mode now also allows for analysis of antibodies and antibody drugconjugates under native conditions requiring a higher mass range up to m/z 8000.
• Excellent mass accuracy, resolution and sequence coverages are obtained for results at all stagesof the workflows: intact molecular masses, masses of subunits, top-down fragments of subunits aswell as peptides providing high confidence results.
• For Infliximab unusually low Lys-truncation was observed and confirmed at all molecular levels: in the fully intact mAb, in the Fc subunit and at the peptide level.
ACKNOWLEDGEMENTSThe authors would like to thank Amy Farrell and Jonathan Bones (NIBRT, Dublin, IR) for kindlyproviding the antibody samples Infliximab and Bevacizumab.
The three antibodies Trastuzumab, Infliximab and Bevacizumab wereanalyzed under native and denaturing conditions as single samples aswell as in a mixture (Figure 2A,C). The mixed sample provided the mostcomplex pattern (also due to Lys-heterogeneity of Infliximab, Figure 2E)which can be well resolved in both conditions (Figure 2 B,D) s. However,under native conditions a higher spatial resolution is obtained due to thedetection at higher m/z. The benefit of analyzing samples under nativeconditions becomes even more apparent for the antibody drug conjugateTrastuzumab-Emtansine (Figure 3 A,B) resulting in higher spatialresolution and improved, baseline resolved peaks even of overlappingpeak patterns.
The three antibodies Trastuzumab, Infliximab and Bevacizumab wereanalyzed after reduction and after FabRICATOR digest followed byreduction. Figure 3 shows Trastuzumab as a representative for LCseparation of light and heavy, Full scan acquisition at high (LC) and low(HC) resolution settings to achieve intact molecular weight followed bytop down analysis to obtain sequence confirmation. Figure 4 shows theLC chromatograms obtained for the 3 individual antibodies confirmingheterogeneity of the FC region of Infliximab due to a low degree of Lys-truncation. Very accurate intact masses for the Fc, LC and Fd’ subunitsare obtained and top town analysis thereof provides very good sequencecoverage.
The three antibodies Trastuzumab, Infliximab and Bevacizumab wereanalyzed after performing a SMART digest resulting in peptide mixtures.Obtained Base Peak Chromatograms are very similar but show distinctdifferences. All antibodies can be identified with 100% sequencecoverage when analyzed separately as well as in a mixture.Glycopeptides are confidently identified in many variations based onMS/MS spectra as shown in one example.Figure 7 highlights as well on the peptide level the low degree of Lys-truncation of Infliximab compared to Trastuzumab and Bevacizumab,confirming the results obtained on the intact and subunit levels.
Figure 1. Workflow overview covered in this poster
Figure 2. Intact mAb analysis under native and denaturing conditions
Figure 4. Intact (A) and (B) Top Down Subunit Analysis after FabRICATOR digest and reduction
020
60
1005695.4
mixture
Bevacizumab
Herceptin
Infliximab
020
60
1005722.7
5680 5720 5760m/z
020
60
1005739.3
0
20
60
1005695.5
5739.3
5500 6000 6500m/z
0
50
100
0
50
100
0
50
100
Rel
ativ
e Ab
unda
nce
0
50
1005923.2
5695.5
6169.95484.5
6487.6
5923.15695.5
6169.95484.5
6438.1
5722.7 5951.65501.4
6199.65314.0
6458-0
5968.85739.0 6217.5
5526.8 6487.8
zoom
mixture
Bevacizumab
Trastuzumab
Infliximab
2500 3000 3500 4000 4500m/z
0
50
100
0
50
100
0
50
100
Rel
ativ
e A
bund
ance
0
50
100
020
60
1003291.2
3294.7 3306.9
3320.1
0
20
60
100
Rel
ativ
e A
bund
ance
3291.1
3294.7
3298.4
020
60
1003306.9
3301.2 3310.5
3314.23296.8
3280 3300 3320m/z
020
60
1003316.5
3320.13312.0
5680 5720 5760m/z
0
20
60
100 5695.5
5739.3
Native, R=35k
3260 3280 3300 3320 3340m/z
0
20
60
1003291.2
3294.73306.9
3320.13288.0
80 Da
zoom
A
C
D
B
E
Figure 3. Trastuzumab-Emtansine ADC under native (A) and denaturing conditions (B)
B zoom
5500 6000 6500m/z
0
50
100
Rel
ativ
e A
bund
ance
6044.6R=4763
5900 6000 6100 6200m/z
0
50
100
Rel
ativ
e A
bund
ance
6044.6R=4763
5950 6000 6050m/z
0
50
100
Rel
ativ
e A
bund
ance 6006.4
R=4801
2500 3000 3500m/z
0
50
100
Rel
ativ
e A
bund
ance
3042.0R=3967
2900 3000 3100 3200m/z
0
50
100
Rel
ativ
e A
bund
ance
3042.00R=3967
2960 2980 3000m/z
0
50
100
Rel
ativ
e A
bund
ance
2982.3R=3696
Azoom zoom
zoom
Figure 8 highlights results from a disulfide bond study on Trastuzumab comparing a reduced vs. non-reduced sample. Differences in the base peak chromatograms are obvious by visual inspection andusing BioPharma Finder software they are identified as either free Cys-containing peptides (reducedsample) or as part of disulfide linked peptides (non-reduced sample) and provided as shaded peaks inthe chromatogram. Also, a number of scrambled, unexpected disulfide bonds are identified andrepresented by one example showing a peak unique to the reduced sample, the iosotope profiledetected with superb mass accuracy and identification of scrambled peptide supported by MS/MS.
B
4 6 8Time (min)
0
50
1000
50
100
Rel
ativ
e A
bund
ance
0
50
100
Trastuzumab
Bevacizumab
Infliximab
Fc-Lys
Fc-Lys
Fc Fc-Lys
LC Fd‘
LC Fd‘
LC Fd‘
A
C
Figure 7. XICs (A) and (B) Infliximab Full MS spectra of +1/+2 charge states for Lys-truncated vs. full length C-terminal peptides for the 3 mAbs
Figure 6. A) Base peak chromatograms obtained for peptide mapping (B) of individual and mixed mAbs with sequence coverage ( B) , identified glycoforms (D) and (E) example spectra for a peptide in a glycosylated and unglycosylated forms
A B
D
E
Light chain
Heavy chain
LC, 43% residue cleavages
Figure 3: Intact (A) and (B) top down subunit analysis of reduced Trastuzumab
Figure 8. (A) Disulfide mapping analysis results confirming the eight expected disulfide bonds (table) and (B) an example of an unexpected scrambled disulfide bond
Kai Scheffler1, Eugen Damoc2, Jennifer Sutton3, Aaron O. Bailey3, Stephane Houel3, and Jonathan Josephs3, Thermo Fisher Scientific, 1 Dreieich, Germany, 2 Bremen, Germany, 3 San Jose, CA, USA
RESULTS – Intact mAb AnalysisINTRODUCTIONMS analysis of antibodies at the protein and peptide levels is critical during development andproduction of biopharmaceuticals. The compositions of current generation therapeutic proteinsare often complex due to their heterogeneity caused by various modifications which arerelevant for their efficacy. Intact proteins analyzed by ESI-MS are detected in higher chargestates that also provide more complexity in mass spectra. Protein analysis in native or native-like conditions with zero or minimal organic solvent and neutral or weakly acidic pH decreasescharge state value resulting in mAb detection at higher m/z ranges with more spatialresolution.Here we have analyzed the profiles of three monoclonal antibodies under denaturing andnative conditions by direct infusion with offline desalting and with on-line desalting via sizeexclusion and reversed phase type columns. The samples were analyzed with three differentworkflows (Figure 1): 1) the analysis on the intact level under native and denaturing conditions;2) the analysis of subunits following IdeS digestion and or reduction; and 3) peptide mappingfollowing sample preparation applying the Thermo Scientific™ SMART Digest™ kit.The mass spectrometer used for all experiments was a commercially available hybridquadrupole-Orbitrap mass spectrometer with modified instrument control software to allow forimproved high mass transmission and mass detection up to 8000 m/z. This modification isnecessary for the analysis of antibody samples on the intact level under native conditionsrequiring the detection of masses beyond the standard mass range of up to 6000 m/z.
MATERIALS AND METHODS The three commercially available monoclonal antibodies Trastuzumab, Trastuzumab-Emtansine, Infliximab and Bevacizumab obtained in manufacturer’s formulation buffer wereused for all experiments.Sample Preparation:For native intact mass analysis using SEC-LC/MS, the antibodies were injected without anyfurther dilution. For direct infusion analysis under denaturing conditions, samples weredesalted via Bio-Rad P6 desalting columns and diluted to achieve 50% ACN/0.1% formic acidin the solvent. For subunit analysis samples were either reduced in 4M GdHCl/50mM TCEP orfirst digested with FabRICATOR® (Genovis) enzyme according to the manufacturer’s protocoland then reduced. For peptide analysis antibodies were proteolytically digested using theSMART Digest kit following reduction with 10mM DTT. For disulfide bridge analysis, part of thesample was analyzed non-reduced.Chromatography:For intact mass analysis under native conditions proteins were online desalted using sizeexclusion chromatography (SEC) and isocratic elution with 50mM or 100mM ammoniumacetate. For reversed phase chromatography of proteins, subunits and peptides underdenaturing conditions a gradient of solvent A consisting of water 0.1% formic acid and solventB consisting of acetonitrile/0.1% formic acid was used.Mass Spectrometry:The mass spectrometers used for all experiments were commercially available Thermo Scientific™ Q Exactive™ Plus and Q Exactive™ HF mass spectrometers with modifiedinstrument control software to allow for improved high mass transmission and mass detection up to 8000 m/z.Data Analysis:Intact protein, IdeS digest and peptide mapping raw data files were analyzed with Thermo Scientific™ BioPharma Finder™1.0 SP1 software. Data for the disulfide bridge mapping wasperformed with BioPharma Finder 2.0 beta-software. For top-down analysis data ProSight Litewas used after Xtract spectral deconvolution.
CONCLUSIONS• Here we cover the three major workflows for characterization of biopharmaceuticals on one single
instrument LC-MS platform using single and mixed antibody samples: 1) intact mass analysis, 2) subunit analysis and 3) peptide mapping - aiming at confirming antibody sequences and disulfide bonds, elucidating modifications and probing for scrambled disulfide bonds.
• The new High Mass Range mode now also allows for analysis of antibodies and antibody drug conjugates under native conditions requiring a higher mass range up to m/z 8000.
• Excellent mass accuracy, resolution and sequence coverages are obtained for results at all stages of the workflows: intact molecular masses, masses of subunits, top-down fragments of subunits as well as peptides providing high confidence results.
• For Infliximab unusually low Lys-truncation was observed and confirmed at all molecular levels: in the fully intact mAb, in the Fc subunit and at the peptide level.
ACKNOWLEDGEMENTSThe authors would like to thank Amy Farrell and Jonathan Bones (NIBRT, Dublin, IR) for kindly providing the antibody samples Infliximab and Bevacizumab.
The three antibodies Trastuzumab, Infliximab and Bevacizumab wereanalyzed under native and denaturing conditions as single samples aswell as in a mixture (Figure 2A,C). The mixed sample provided the mostcomplex pattern (also due to Lys-heterogeneity of Infliximab, Figure 2E)which can be well resolved in both conditions (Figure 2 B,D) s. However,under native conditions a higher spatial resolution is obtained due to thedetection at higher m/z. The benefit of analyzing samples under nativeconditions becomes even more apparent for the antibody drug conjugateTrastuzumab-Emtansine (Figure 3 A,B) resulting in higher spatialresolution and improved, baseline resolved peaks even of overlappingpeak patterns.
The three antibodies Trastuzumab, Infliximab and Bevacizumab wereanalyzed after reduction and after FabRICATOR digest followed byreduction. Figure 3 shows Trastuzumab as a representative for LCseparation of light and heavy, Full scan acquisition at high (LC) and low(HC) resolution settings to achieve intact molecular weight followed bytop down analysis to obtain sequence confirmation. Figure 4 shows theLC chromatograms obtained for the 3 individual antibodies confirmingheterogeneity of the FC region of Infliximab due to a low degree of Lys-truncation. Very accurate intact masses for the Fc, LC and Fd’ subunitsare obtained and top town analysis thereof provides very good sequencecoverage.
The three antibodies Trastuzumab, Infliximab and Bevacizumab wereanalyzed after performing a SMART digest resulting in peptide mixtures.Obtained Base Peak Chromatograms are very similar but show distinctdifferences. All antibodies can be identified with 100% sequencecoverage when analyzed separately as well as in a mixture.Glycopeptides are confidently identified in many variations based onMS/MS spectra as shown in one example.Figure 7 highlights as well on the peptide level the low degree of Lys-truncation of Infliximab compared to Trastuzumab and Bevacizumab,confirming the results obtained on the intact and subunit levels.
Figure 1. Workflow overview covered in this poster
Figure 2. Intact mAb analysis under native and denaturing conditions
Figure 4. Intact (A) and (B) Top Down Subunit Analysis after FabRICATOR digest and reduction
020
60
1005695.4
mixture
Bevacizumab
Herceptin
Infliximab
020
60
1005722.7
5680 5720 5760m/z
020
60
1005739.3
0
20
60
1005695.5
5739.3
5500 6000 6500m/z
0
50
100
0
50
100
0
50
100
Rel
ativ
e Ab
unda
nce
0
50
1005923.2
5695.5
6169.95484.5
6487.6
5923.15695.5
6169.95484.5
6438.1
5722.7 5951.65501.4
6199.65314.0
6458-0
5968.85739.0 6217.5
5526.8 6487.8
zoom
mixture
Bevacizumab
Trastuzumab
Infliximab
2500 3000 3500 4000 4500m/z
0
50
100
0
50
100
0
50
100
Rel
ativ
e A
bund
ance
0
50
100
020
60
1003291.2
3294.7 3306.9
3320.1
0
20
60
100
Rel
ativ
e A
bund
ance
3291.1
3294.7
3298.4
020
60
1003306.9
3301.2 3310.5
3314.23296.8
3280 3300 3320m/z
020
60
1003316.5
3320.13312.0
5680 5720 5760m/z
0
20
60
100 5695.5
5739.3
Native, R=35k
3260 3280 3300 3320 3340m/z
0
20
60
1003291.2
3294.73306.9
3320.13288.0
80 Da
zoom
A
C
D
B
E
Figure 3. Trastuzumab-Emtansine ADC under native (A) and denaturing conditions (B)
B zoom
5500 6000 6500m/z
0
50
100
Rel
ativ
e A
bund
ance
6044.6R=4763
5900 6000 6100 6200m/z
0
50
100
Rel
ativ
e A
bund
ance
6044.6R=4763
5950 6000 6050m/z
0
50
100
Rel
ativ
e A
bund
ance 6006.4
R=4801
2500 3000 3500m/z
0
50
100
Rel
ativ
e A
bund
ance
3042.0R=3967
2900 3000 3100 3200m/z
0
50
100
Rel
ativ
e A
bund
ance
3042.00R=3967
2960 2980 3000m/z
0
50
100
Rel
ativ
e A
bund
ance
2982.3R=3696
Azoom zoom
zoom
Figure 8 highlights results from a disulfide bond study on Trastuzumab comparing a reduced vs. non-reduced sample. Differences in the base peak chromatograms are obvious by visual inspection andusing BioPharma Finder software they are identified as either free Cys-containing peptides (reducedsample) or as part of disulfide linked peptides (non-reduced sample) and provided as shaded peaks inthe chromatogram. Also, a number of scrambled, unexpected disulfide bonds are identified andrepresented by one example showing a peak unique to the reduced sample, the iosotope profiledetected with superb mass accuracy and identification of scrambled peptide supported by MS/MS.
B
4 6 8Time (min)
0
50
1000
50
100
Rel
ativ
e A
bund
ance
0
50
100
Trastuzumab
Bevacizumab
Infliximab
Fc-Lys
Fc-Lys
Fc Fc-Lys
LC Fd‘
LC Fd‘
LC Fd‘
A
C
Figure 7. XICs (A) and (B) Infliximab Full MS spectra of +1/+2 charge states for Lys-truncated vs. full length C-terminal peptides for the 3 mAbs
Figure 6. A) Base peak chromatograms obtained for peptide mapping (B) of individual and mixed mAbs with sequence coverage ( B) , identified glycoforms (D) and (E) example spectra for a peptide in a glycosylated and unglycosylated forms
A B
D
E
Light chain
Heavy chain
LC, 43% residue cleavages
Figure 3: Intact (A) and (B) top down subunit analysis of reduced Trastuzumab