Full Energy-Momentum Resolved Spectral Function of an interating 2D Electronic System Joonho Jang 1 , Heun Mo Yoo 1 , Loren Pfeiffer 2 , Ken West 2 , K.W. Baldwin 2 , and Raymond Ashoori 1 1 Department of Physics, Massachusetts Institute of Technology, Cambridge, MA 02139, USA 2 Department of Electrical Engineering, Princeton University, Princeton, NJ 08544, USA The single-particle spectral function measures the density of electronic states (DOS) in a material as a function of both momentum and energy, providing central insights into phenomena such as superconductivity and Mott insulators. While scanning tunneling microscopy (STM) and other tunneling methods have provided partial spectral information, until now only angle-resolved photoemission spectroscopy (ARPES) has permitted a comprehensive determination of the spectral function of materials in both momentum and energy. However, ARPES operates only on electronic systems at the material surface and cannot work in the presence of applied magnetic fields. Here, we demonstrate a new method for determining the full momentum and energy resolved electronic spectral function of a two-dimensional (2D) electronic system embedded in a semiconductor. In contrast with ARPES, the technique remains operational in the presence of large externally applied magnetic fields and functions for electronic systems with zero electrical conductivity or with zero electron density. It provides a direct high-resolution and high-fidelity probe of the dispersion and dynamics of the interacting 2D electron system. By ensuring the system of interest remains under equilibrium conditions, we uncover delicate signatures of many-body effects involving electron-phonon interactions, plasmons, polarons, and a novel phonon analog of the vacuum Rabi splitting in atomic systems. Inside of semiconductors and metals, negatively-charged electrons interact with each other and with positively-charged ions and impurities, creating complex many-particle systems (1 ). Remarkably, despite the strong electron-electron Coulomb repulsions inside of solids, Landau-Fermi liquid theory predicts that in a degenerate Fermi system, electrons near Fermi level E F behave as weakly interacting quasiparticles (1 , 2 ). These quasiparticles have a modified energy and mass compared with non-interacting electrons and have finite lifetimes for losing their identities as a well-defined particles. The success of the theory stems from the fact that the degenerate electrons below the Fermi level screen the Coulomb potential between particles and restrict the phase space available for excited electrons to scatter. In cases for which the interactions of electrons become dominant, such as for systems of low electron density and/or under strong magnetic fields, the description in terms of weakly interacting 1
Transcript
Full Energy-Momentum Resolved Spectral Function of an interating 2D Electronic System
Joonho Jang1, Heun Mo Yoo1, Loren Pfeiffer2, Ken West2, K.W. Baldwin2, and Raymond Ashoori1
1Department of Physics, Massachusetts Institute of Technology, Cambridge, MA 02139, USA 2Department of Electrical Engineering, Princeton University, Princeton, NJ 08544, USA
The single-particle spectral function measures the density of electronic states (DOS) in a material as a function of both momentum and energy, providing central insights into phenomena such as superconductivity and Mott insulators. While scanning tunneling microscopy (STM) and other tunneling methods have provided partial spectral information, until now only angle-resolved photoemission spectroscopy (ARPES) has permitted a comprehensive determination of the spectral function of materials in both momentum and energy. However, ARPES operates only on electronic systems at the material surface and cannot work in the presence of applied magnetic fields. Here, we demonstrate a new method for determining the full momentum and energy resolved electronic spectral function of a two-dimensional (2D) electronic system embedded in a semiconductor. In contrast with ARPES, the technique remains operational in the presence of large externally applied magnetic fields and functions for electronic systems with zero electrical conductivity or with zero electron density. It provides a direct high-resolution and high-fidelity probe of the dispersion and dynamics of the interacting 2D electron system. By ensuring the system of interest remains under equilibrium conditions, we uncover delicate signatures of many-body effects involving electron-phonon interactions, plasmons, polarons, and a novel phonon analog of the vacuum Rabi splitting in atomic systems.
Inside of semiconductors and metals, negatively-charged electrons interact with each other and with positively-charged ions and impurities, creating complex many-particle systems (1 ). Remarkably,
despite the strong electron-electron Coulomb repulsions inside of solids, Landau-Fermi liquid theory
predicts that in a degenerate Fermi system, electrons near Fermi level EF behave as weakly interacting
quasiparticles (1 , 2 ). These quasiparticles have a modified energy and mass compared with
non-interacting electrons and have finite lifetimes for losing their identities as a well-defined particles.
The success of the theory stems from the fact that the degenerate electrons below the Fermi level screen
the Coulomb potential between particles and restrict the phase space available for excited electrons to
scatter. In cases for which the interactions of electrons become dominant, such as for systems of low
electron density and/or under strong magnetic fields, the description in terms of weakly interacting
Figure 1 | Schematics of tunneling device and principles of energy-momentum selection process. (A) The vertical tunneling device used in the experiment. Two GaAs QWs (width of 20 nm each) are separated by a Al0.8Ga0.2As potential barrier (6 nm). Electrons in the top (probe) QW with nearly zero planar momentum probe electronic states in the bottom (target) QW. (B) The injection of an electron packet probes only empty available states in the target layer. (C) Diagram for explaining the momentum selection mechanism. The in-plane field generates a momentum boost in the tunneling process to displace the zero planar momentum into
in the bottom QW. (D) E-k dispersions in the presence of the in-plane field. In (B-D), the occupiedB d / kf inal = e || t h states are shown in blue and red colors for probe and target layers, respectively. (E) Measured spectra with B || along the crystallographic axis of [100] and [010] of GaAs. Multiple unoccupied QW subbands are visible.
In MERTS, we controllably generate a collimated packet of electrons with precisely-defined
energy and momentum from an adjacent probe layer (a 2D QW) and, by means of tunneling, inject the
electrons into the unoccupied quantum states of the target 2D system to measure the target 2D system’s
spectral function. Electrons from this collimated beam can tunnel into the target 2D electron system only
when unoccupied states are available with the same energy and momentum, resulting in E-k selectivity of
the tunneling process (see Fig. 1). The tunneling probability therefore represents the spectral function for
adding a particle into the 2D system (1, 2). For high E-k resolution, we prepare electrons with a very
Figure 2 | Measured MERTS Spectra at various densities and extraction of self-energy. (A-C) n Tunneling spectra measured at 1.5 K for various target QW densities (see Fig. S7 for a full data set). In (A) three subbands are visible due to finite width of the target well. Frame (C) shows data for a gate voltage at which the target well first fully depletes. (D) A tunneling spectrum simulation with a self-energy term that accounts for impurity broadening and electron-phonon interactions. The red arrows are placed a LO phonon energy (36 meV) above the Fermi energy in (A), (B) and (D), and 36 meV above the bottom of the 1st subband in (C). The blue arrows in each figure are 36 meV above the 2nd subband. (E) A measured E-k spectrum at . .3 0 cmn = 2 × 1 11 −2 The blue curves displays the bare band dispersion expected from detailed band structure calculations εk − EF (14). We extract the self-energy by measuring the peak locations and half-widths of MDCs (curves cut kpeak kΔ along the momentum axis at energy ). The red bars are centered at and have widths of . We extract the E kpeak kΔ self-energy using and (15–17), where the subtraction of 0.0032 e Σ (k ) R = E − ε peak Im Σ| Δk .0032 A )| ≈ ( − 0 −1 × vh g0 is to take account of the finite size of FS of the probe QW, and is the bare group-velocity (see section 5 of vg0 Supplementary Materials). The yellow box marks an area of the spectrum considered in Fig. 4. (F) Extracted m Σ Is at various densities. The solid curves are for data from the 1st subband, and the dashed curves are for 2nd subband. The red and blue dashed (nearly vertical) lines are guides-to-the-eyes for the abrupt increases of Im Σ| | due to e-phonon interactions. These are the same with energy locations pointed by the red and blue arrows in (A), (D) and (E), respectively. Curves are offset for clarity, and the thin horizontal dotted line indicates zero for each curve.
insulating regime is possible only with the capability of MERTS to measure unoccupied states in
insulating systems.
Figure 3 | Evolution of E-k spectra under perpendicular magnetic fields. (A) Spectra of the 2D electron system at a density of for various perpendicularly applied magnetic fields. With .5 0 cmn ~ 2 × 1 10 −2 increasing field, Landau quantizations with the cyclotron energy spacing become clearly apparent. At ωh c E − EF ~ 40 meV, the spectrum displays a level splitting in the 5, 8, and 10T data. Tunneling into Landau levels produces features resembling line segments. The features resulting from tunneling into Landau index greater than zero appear as line segments at nonzero k that are slanted away from horizontal in the 5, 8, and 10T data. The slants arise from the non-zero width of our square well QWs (to be published). (B) A simple model that explains the level splitting. When the LO phonon energy matches the energy difference of 1st (blue lines) and 2nd subband (orange line), a resonance occurs (purple lines) to produce the strongly-coupled limit of an electron and a phonon, i.e. a polaron. The splitting arises because a long-lived composite state of the zeroth LL in the lowest (1st) subband together with a LO phonon (i.e. ) forms and resonantly interacts with the zeroth LL of the 2nd subband ( g,| 1 >
). (C) The splitting energies (blue circles) and errorbars (vertical orange lines) are plotted as a function ofe,| 0 > magnetic field. The dashed line is a curve-fit of the data points at non-zero (from 2 T to 10 T) to B
with fixed (see main text). (D) The splitting diminishes greatly for a spectrum gc = a × √B − B0 .52 T B0 = 0 measured at higher density at 8T. Color scales in images in (A) and (D) are calibrated so that .3 0 cmn ~ 1 × 1 11 −2 the same currents give rise to the same colors and intensities (see also Fig. S9).
To further investigate the effect of confinements that could lead many-particle interactions into
the non-perturbative limit, we generated another means of confinement of electrons by applying
8
perpendicular magnetic fields. As the magnetic field strength increases, the Landau quantization strongly
modifies the dispersion into discrete Landau levels (LL) (Fig. 3A). Because electrons are confined in a
length scale of the magnetic length , the dispersion spreads over a finite extent in the momentum lb
direction whose magnitude is proportional to ./l 1 b
At , all the electrons in the target QW fall into the lowest Landau level ( . .52T B⊥ > 0 ) ν < 2
Near 36 meV ( ) above the bottom of the unoccupied bands, the spectrum shows a surprisingly ω ~ h LO
clear level splitting (see yellow arrow). We explain this as the polaronic effect dramatically enhanced to
the point where the LL of the 2nd subband resonantly interacts with the LL of the 1st subband via a LO
phonon. This is the signature behavior of the vacuum Rabi splitting - in this case, a “strong coupling”
state between the zero-phonon and one-phonon states (24, 25) (see Fig. 3B) - and cannot be explained by
any inelastic process involving simple phonon scatterings. Upon increasing the density of the 2D system
so that only few empty states remain available in the ground LL, the splitting disappears (Fig. 3D; see
also Fig. S9), consistent with the Rabi splitting picture. We realize an interesting analogy between the role
of the electron density in polariton-cyclotron resonance experiments (25, 26) and that of the density of
empty states in the lowest LL in our measurement. This claim is quantitatively supported by the N empty
observation (Fig. 3C) of the splitting magnitude . Here, gc ∝ √N empty ∝ √B − B0 .52 T B0 = 0
corresponds to the field value at which electrons fully occupy the lowest LL, and roughly consistent with
the density determined by capacitance measurements. In this picture, the massive .5 0 cm n ~ 2 × 1 10 −2
degeneracy created by the flattening of the electron energy dispersion and the spatial confinement due to a
perpendicular magnetic field contribute to the formation of the strong coupling state. We find it
remarkable that, as we tune perpendicular magnetic fields, the electronic spectral function shows the
transition from the weak limit (the self-energy treatment at ) to the strong limit of e-ph interaction. B = 0
This observation constitutes the first direct measurement of the alteration of the electron energy spectrum
in an equilibrium state due to the presence of ions in strong coupling. Such a measurement has been
impossible in ARPES due to the requirement of application of high magnetic field. We anticipate even
stronger polaronic effects in other semiconductor systems, such as hole-doped GaAs, CdTe, and SrTiO3
that have stronger electron-phonon interactions.
Theory predicts that e-e interactions lead to changes in thermodynamic quantities (1, 27), but
these effects are subtle and the measurements are difficult to interpret (28). MERTS provides a direct
means for observing these interactions in high resolution spectra at near the Fermi energy, where LO
phonons have small impact and the dominant modifications to the spectra arise from e-e interactions. In
Fig. 4, we examine closely the spectra near the Fermi level. In Fig. 4B, at all densities, the measured
Figure 4 | Electron-electron interaction and plasmon scattering. (A) A zoom-in of the MERTS spectrum of the yellow rectangle of Fig.2E measured at 3K. The yellow curve shows the expected bare band dispersion, and red dots are measured peaks from fits to the data. There is a subtle, but statistically significant, kink in the red data points indicated by the arrow. (B-C) and from the spectra at various densities. In m Σ I e Σ R (C) the red curve represents a slowly varying background signal obtained by curve-fitting the data away from the kink structure to a 3rd order polynomial, and the blue curve is a curve-fit to the data with additional Lorentzian term in the curve-fit. The arrows in (C) point to the center of this Lorentzian. The same arrow locations are produced in (B), denoting a corresponding broad step feature in . (D) Electron-plasmon interaction. The orange curves m Σ I represent electron dispersion, and dash dotted curves visualize final electron states in event of emitting a plasmon. There exists a threshold energy above which an injected electron (blue dots) can lose energy by scattering a Ep plasmon, and decay to lower energy states that exist above (red stars). (E) The locations of the features in EF (B-C) and how they change as a function of density. The red circles and error bars indicate peaks and widths of the Lorentzian function used to fit the data in (C). Also, plotted are theoretically expected curves following ref. (29). The blue dashed curve is from a semiclassical calculation, the red dot-dashed curve is from a random-phase-approximation (RPA), and the black solid curve is for a RPA that accounts for the non-zero well-width.
Acknowledgements The work at MIT was funded by the BES Program of the Office of Science of the US DOE, contract no.
FG02-08ER46514, and the Gordon and Betty Moore Foundation, through grant GBMF2931. The work at
Princeton University was funded by the Gordon and Betty Moore Foundation through the EPiQS
initiative Grant GBMF4420, and by the National Science Foundation MRSEC Grant DMR-1420541.
12
Supplementary Materials 1. Materials and Methods
Figure S1 | Experimental details. (A) The wafer growth sheet. (B) A schematic of the experimental setup (36). (C) A numerical simulation of the electron density and electric field distribution of a 2D-2D QW structure based on a self-consistent solution of the Poisson-Schrodinger equation under external DC voltage.
We use photolithography and etching to define our sample a mesa (~ diameter) froma wafer of an 50 μm 1 MBE grown GaAs/AlGaAs heterostructure with profile shown in Fig. S1A. The top and bottom thick layers (>500 nm) form 3D electrodes and are doped with Si with the density of approximately
. We perform numerical simulations of the electron density distribution along z-axis (the0 cm 2 × 1 18 −3 growth direction) of the structure by self-consistently solving the 1D Poisson-Schrodinger equation, leading to results such as those shown in Fig. S1C. The thickness of the GaAs spacer layer sets the density of the probe QW. In the present measurements, the thickness of the spacer is 10 nm, and the electron density induced into the probe QW is . The simulation shows that, in applying 0 cmn ~ 3 × 1 10 −2 a DC bias voltage across the electrodes the density of the target QW changes, but the density of the V b probe QW effectively remains same until the target QW nearly fully depletes. We determine the density of target QW vs. bias voltage by integrating the measured compressibility (i.e. capacitance) of the QW (Fig. S2A).
We perform cryogenic broadband time-resolved measurements with a sample mounted in a rotational stage at the mixing chamber of a 3He-4He dilution refrigerator, and apply magnetic fields using a 16T superconducting magnet. To thermally protect the sample from the warm outside environment and preserve the low electron temperature, we use a combination of stainless steel, copper and NbTi superconducting coaxes with in-line attenuators (see Fig. S1B). For measurements of tunneling spectra, we apply repetitive square pulses to induce the tunneling voltage between two QWs. An initial voltage pulse whose amplitude is defines the actual energy of tunneling electrons. The energy is determined V p by accounting for the geometric lever-arm of the heterostructure - well-to-well distance divided by the distance between electrodes - e.g. . The initial pulse has a short V 26 nm/113 nm) Et = e t ~ ( × eV p duration of to ensure that the tunneling current is measured before the QW densities 00 nsec ~ 1 significantly change. The initial pulse is followed by a voltage pulse with an opposite polarity, which retrieves the tunneled electrons back to the probe QW. After these pulses, we wait for ~ to 00 μsec 3 further ensure that the whole system is back to equilibrium. As shown in Fig. S1B, we use HEMT amplifiers to detect the tunneling charges capacitively. The signal from the HEMTs is amplified by a SiGe cryogenic low-noise amplifier (Weinreb amplifier) at the 1K pot, and finally recorded by a high speed signal averaging oscilloscope (SignalRecovery FastFlight2). We average an order of ~10,000 pulse sequences to obtain individual pixels in a 2D E-k spectrum. We scan the energy axis of the spectrum by sweeping the pulse amplitudes using a DC voltage source multiplexed with a digital timing generator (Tektronix DTG-5274). The scan along the momentum axis is controlled by stepping the predetermined combination of magnetic fields and a rotation angle of the sample stage. A complete spectrum of a single bias, such as shown in the main text, usually takes ~15 hours to acquire with a computer automated system.
14
Figure S2 | Density determination using capacitance measurement. The red arrows point to the bias voltage value ( ) below which the electron system transitions to the incompressible state, .11 V V b ~ − 0 signaling particle localization. (A) The density of target QW vs. bias voltage estimated by integrating the measured compressibility (i.e. capacitance) of the QW, with calibration determined through measurements showing Landau levels in magnetic field. The density designated by the red arrow corresponds to ~
. (B) A representative total capacitance plot (blue circles) of two QW structure measured for.5 0 cm 2 × 1 10 −2 density calibration. The black line is the estimated capacitance of the target QW, based on the total capacitance data. The difference between the blue and black lines is due to the screening effect of the probe QW in the capacitance measurement.
2. Tunneling conductance and momentum conservation When two electronic systems are separated by a planar tunneling junction, the tunneling current is given by the following form,
(V ) |T | E E A (E, ) A (E , ) I t t = Σkk′ kk′2 ∫
∞
−∞d ∫
∞
−∞d ′ L k R ′ k′ ×
, (S1)f (E, T ){1 (E , T )} {1 (E, T )}f (E , T )] δ(E V ) [ L kB − f R ′ kB − − f L kB R ′ kB − E′ − e t where and are the spectral functions of left and right systems, respectively, with the following AL AR formula
(E, ) .A k = 1π
|Im Σ|(E−ε −Re Σ) +(Im Σ)k
2 2 (S2)
And is the Fermi distribution functions of the left (right) system, is the bare electron band energy, f L(R) εk and is the electronic self-energy. The represents planar momentum in the 2D plane perpendicular to Σ k the tunneling direction. With translational symmetry in the plane, the planar momenta are conserved in the tunneling process.
Under in-plane magnetic fields, the planar momenta are still conserved but with an offset given by , as shown in Fig. S3. The measured tunneling spectrum resembles very closely the k B d / Δ x,y = e || t h simulation using this simple picture, demonstrating the energy and momentum conservation in this experiment.
15
Figure S3 | Energy and momentum selective tunneling processes confirmed by comparing measurement with simulation results.
3. Many-particle interactions and self-energy When particles in a system interact with each other, simple product states of individual particles are typically no longer eigenstates of the system. Instead, the interacting many-body system describes the particle-like excitations (quasiparticles) with finite lifetime and modified energy different from those of bare electrons (1, 2). This picture is formally expressed in the spectral function of Eq. (S2), and the self-energy function has the essential information of the inter-particle interactions. Thus, measurements Σ of the spectral function and the self-energy is of prime interest both experimentally and theoretically.
In the quasiparticle approximation (7, 17), the essential information of the spectral function can be represented by two quantities: a quasiparticle lifetime and a modified energy. The lifetime of an electronic quasiparticle can be obtained from the inverse of the energy broadening of the energy EΔ distribution curves (EDC; curves cut at along the energy axis) of the dispersion, approximately an K inverse of the imaginary part of the electronic self-energy. On the other hand, the renormalized energy of
the quasiparticle comes from the locations of the peaks of the quasiparticle distribution. If the Epeak self-energy does not change very rapidly in energy, the self-energy is obtained by solving these equations,
and .Im Σ E − 2 = Δ e Σ Epeak − εK − R = 0 (S3)
4. Numerical simulation of tunneling spectrum
Before starting the procedure of extracting the self-energy, we can compare the measured spectral function to a simple theoretical model for a basic sanity check. With a simple model of the electron-boson coupling with no momentum dependence, an isotropic matrix element, and a small electron-boson coupling constant , the self-energy can be written in the limit of zero temperature as (1, 16, 17, 37, 38)α
(E ) /π E α F (E ) E N (E )/N [ ],Σ t = 1 ∫∞
0d ′ 2 ′ ∫
∞
0d ′′ ′′ 0
θ(E )′′E +E −E +i0t ′ ′′ + + θ(−E )′′
E −E −E +i0 t ′ ′′ + (S4)
where is the Eliashberg function (17), is the electron density of states, and is a the F (E)α2 (E)N N 0 electron density of states of the non-interacting system at the Fermi level. Further assuming a single Einstein bosonic mode at , the self-energy can be easily calculated. The perturbation theory ω h ph arguments leading to Eq. (S4) are generally considered valid when (38) where is the ω /E λ ×h ph F < 1 λ Frölich dimensionless e-ph coupling constant (20). The value of is ~0.07 in GaAs (39), and the above λ condition satisfies when electron density is not too low (i.e. ). Qualitatively speaking, these ~ meV EF > 3 e-ph processes effectively change the electron dispersion to result in a lower group velocity near the Fermi level and thus make the effective mass of electrons heavier by the mass enhancement factor
(1), which, in principle, one can calculate when the is accurately measured.− ∂Re Σ/∂ε ) λ = ( −1 e Σ R
We combine equations S1, S2, and S4 to numerically simulate tunneling spectra as in Fig. S4A-B.
We assume the 2D density of states of electrons with three subbands, and an Eliashberg function of Fα2 LO phonon. To produce a simulation that resembles our data, we take the optic phonon density of states to be centered at and to be a Lorentzian with height and width ω 6 meV h ph = 3 Fα2 .5 meV A = 3
. We, then, calculate from Eq. (S4) using the identity.5 meV W = 2 m Σ I ( ) πδ(E )1E−E +i0′ = P 1
E−E′ − i − E′
, where denotes the principal part. This results in the curve for shown in Fig. S4B. The causality P m Σ I of the self-energy function in Eq. (S4) implies that and are related through the m Σ I e Σ R Kramers-Kronig relationship (KKR), thus we can evaluate from the as also shown in Fig. e Σ R m Σ I S4B.
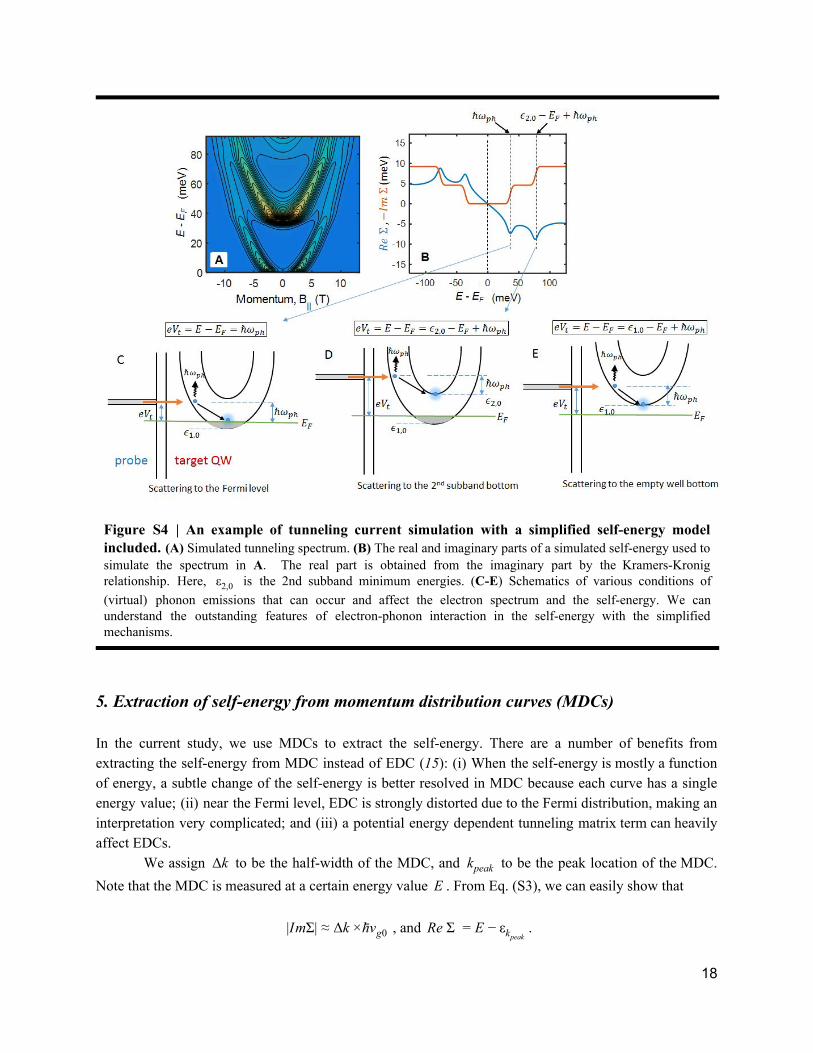
Figure S4 | An example of tunneling current simulation with a simplified self-energy model included. (A) Simulated tunneling spectrum. (B) The real and imaginary parts of a simulated self-energy used to simulate the spectrum in A. The real part is obtained from the imaginary part by the Kramers-Kronig relationship. Here, is the 2nd subband minimum energies. (C-E) Schematics of various conditions of ε2,0 (virtual) phonon emissions that can occur and affect the electron spectrum and the self-energy. We can understand the outstanding features of electron-phonon interaction in the self-energy with the simplified mechanisms.
5. Extraction of self-energy from momentum distribution curves (MDCs) In the current study, we use MDCs to extract the self-energy. There are a number of benefits from extracting the self-energy from MDC instead of EDC (15): (i) When the self-energy is mostly a function of energy, a subtle change of the self-energy is better resolved in MDC because each curve has a single energy value; (ii) near the Fermi level, EDC is strongly distorted due to the Fermi distribution, making an interpretation very complicated; and (iii) a potential energy dependent tunneling matrix term can heavily affect EDCs.
We assign to be the half-width of the MDC, and to be the peak location of the MDC. k Δ kpeak Note that the MDC is measured at a certain energy value . From Eq. (S3), we can easily show thatE
Thus, we can extract the self-energy by determining the peak locations and widths of the kpeak quasiparticle peaks of the MDCs from the measured spectrum.k Δ
In experimentally determining the and , the small FS of the probe layer is the key factor kpeak k Δ that makes the entire procedure simple and transparent. We can find the locations of from measured kpeak MDCs very accurately over the entire range of experimental parameter space. In contrast, obtaining k Δ from the measured MDC widths requires more attention. The small but finite extent of FS of the probe layer still can generate a convolution effect. For example, in the limit where the intrinsic width of the MDC is much smaller than the momentum width of the FS of the probe layer, the convolution effect can be significant, and we need a method for deconvolution for a meaningful quantitative analysis. While the fully deconvolving the Eq. (1) is difficult and mathematically unstable, due to the small size of the FS of the probe QW we can use a good approximation to find a simplified version of the deconvolution, of which we later confirm the validity by checking with the KKR.
We expect the measured MDC width (the value determined by curve-fitting the measured
tunneling spectrum in the horizontal direction in our plots) is always larger that intrinsic MDC width (the value solely given by the spectral function of quasiparticles) due to the finite extent in momentum of the FS of the probe layer. Note that the finite extent of the FS in energy (~0.5 meV) has negligible effect compared to the finite extent in momentum. As such,
.k k δ Δ measured = Δ intrinsic +
By using the simulation described in the earlier section, we confirmed that is nearly constant throughout δ the energy range of the measurement, and the value is determined by the finite extent of the probe QW’s FS. Then, the extraction of from the measured MDC width (HWHM) is a straightforward procedure m Σ I as following
Im Σ| 1/Z Δk ) v | = k × ( measured − δ ×h g
Δk ) v ≈ ( measured − δ ×h g0
, where is the group-velocity of the quasiparticle dispersion, is the group-velocity of the bare vg vg0 electron dispersion, and is the quasiparticle strength (7, 17). Note that the formula has the Zk quasiparticle strength explicitly written as we intend to demonstrate that the use of the bare group Zk velocity is a better approximation in the formal treatment of the quasiparticle picture. We use
estimated from the simulation based on the size of FS of the probe QW. In extracting.0032A δ ≈ 0 −1 , we expect that these approximation procedures to give quantitatively good values within 10~20 %m Σ I
based on the simulation. On the other hand, the extraction of , measured by locating peaks of the e Σ R measured MDCs, is good within a few percent or less given that the bare band dispersion is known.
In extracting the , we used , and non-parabolicity parameter e Σ R .067 m mef f = 0 e − 3.7 A η ~ 4 ˙ 2
with to calculate the expected bare electron dispersion . The tunneling /2m k| (1 |k| )εk = h2 ef f × | 2 + η 2 εk
distance is a source of possible systematic error in this estimation because the is calibrated with . dt k dt The is determined from the 1D Poisson-Schrodinger equation to account for the well-to-well distance dt change when a voltage bias is applied across the top and bottom electrodes. Generally, the changes dt less than 1% when the tunneling energy changes, and less than 5% when density changes upon V Et = e t application of DC voltage bias. It is important to account for this effect when we extract , otherwise e Σ R the effect generates an erroneous background slope in .e Σ R
To confirm the validity of the extraction of self-energy, it is important to check the extracted
and are consistent with each other; the imaginary and real part of the self-energy are mutuallym Σ I e Σ R related via the Kramers-Kronig relationship (KKR), a formal requirement for causality of response functions of a physical system. As shown in Fig. S5C, we plotted converted by the KKR from the e Σ R
of the measured MDC widths (black curves), and colored data points that represent the valuesm Σ I measured by the energy difference of measured peak locations to the bare dispersion, i.e. . EMDCpeak − εk These two curves show a reasonable agreement with each other. Thus, we conclude that values extracted from our tunneling spectrum validly represent the intrinsic self-energy of an interacting electronic system.
Figure S5 | Extraction of the self-energy from momentum distribution curves. (A) MDCs of the measured tunneling spectra (black lines) and curve fits (red lines) for extracting peak locations and widths. (B)
obtained after the simple deconvolution process discussed in the section 5. The curves are offset for clarity.m Σ I Carrier densities are 1.2 (blue), 1.7 (red), and (yellow) from top to bottom curves. (C) A .2 0 cm 2 × 1 11 −2 comparison between the obtained by using the KKR on the data of (B) (colored markers) and the e Σ R e Σ R obtained by directly measuring in the spectrum (gray markers). Black lines are moving averages of the Epeak − εk colored data points. All curves are offsetted for clarity with individual zero values indicated by horizontal dashed lines.
20
6. Neutral excitations of a 2D system upon a sudden injection of an electron Many phenomena inside of a solid originate from the many-particle interactions of electrons, ions and their collective excitations. One of the most intuitive ways to describe the interactions is in terms of a scattering process between two particles that increases the imaginary part of the self-energy (most intuitively as an increase in the inverse quasiparticle lifetime). By enumerating possible scattering processes, we thus can predict basic features of the self-energy to gain insight of the underlying interactions.
Electrons injected into a 2D electronic system at energy decay towards the V e t = Et = E − EF Fermi level, generating various excitations of the subject 2D system by means of scattering events. One example of visualizing the phase space of possible scattering events is shown in Fig. S6. Because in the scattering process the momentum and energy are always conserved, the scattering is only possible when the momentum and energy of excitations (Fig. S6A) match the momentum and energy of energy loss mechanisms (Fig. S6B). The dispersion of the electron system, the injection energy, and the Fermi level define the phase space for possible inter-particle interactions (Fig. S6C).
As the injection energy of an electron increases, in general, more scattering channels open and the quasiparticle lifetime decreases ( increases) assuming that the scattering matrix element roughly |Im Σ| 2 stays constant as a function of energy and momentum. Thus, the imaginary part of the self-energy, inversely proportional to the lifetime, shows jumps and increasing slopes that can be identified with the specific scattering mechanisms (Fig. S6C). Noticeably, electrons strongly scatter plasmon and phonon at characteristic energies (black dash-dot lines), but also generate e-h continuum excitations in a wide range of energy (blue-green shaded regions). In , scatterings with particles with well-defined energy, such m Σ I as plasmons and phonons, show up as steps, and the generations of e-h continuum excitations usually show up as increasing slopes (Fig. S6D).
In a QW, there are multiple subbands exist due to the non-zero width of confinement. This leads to two different kinds of e-h continua (40); intrasubband (blue shaped region) and intersubband (green shaded region) e-h continua. The former affects electrons near the Fermi level, but is known to be suppressed near the Fermi level due to the Pauli blocking that restricts phase space for e-e scatterings. The intersubband e-h continuum excitations, on the other hand, contribute to the electron quasiparticle spectrum above for decays that leave one electron into the second subband. Above eV t ~ ε2,0 − EF another threshold at , the decay of one high energy electron in the first subband can ) eV t ~ 2(ε2,0 − EF place two electrons in the second subband.
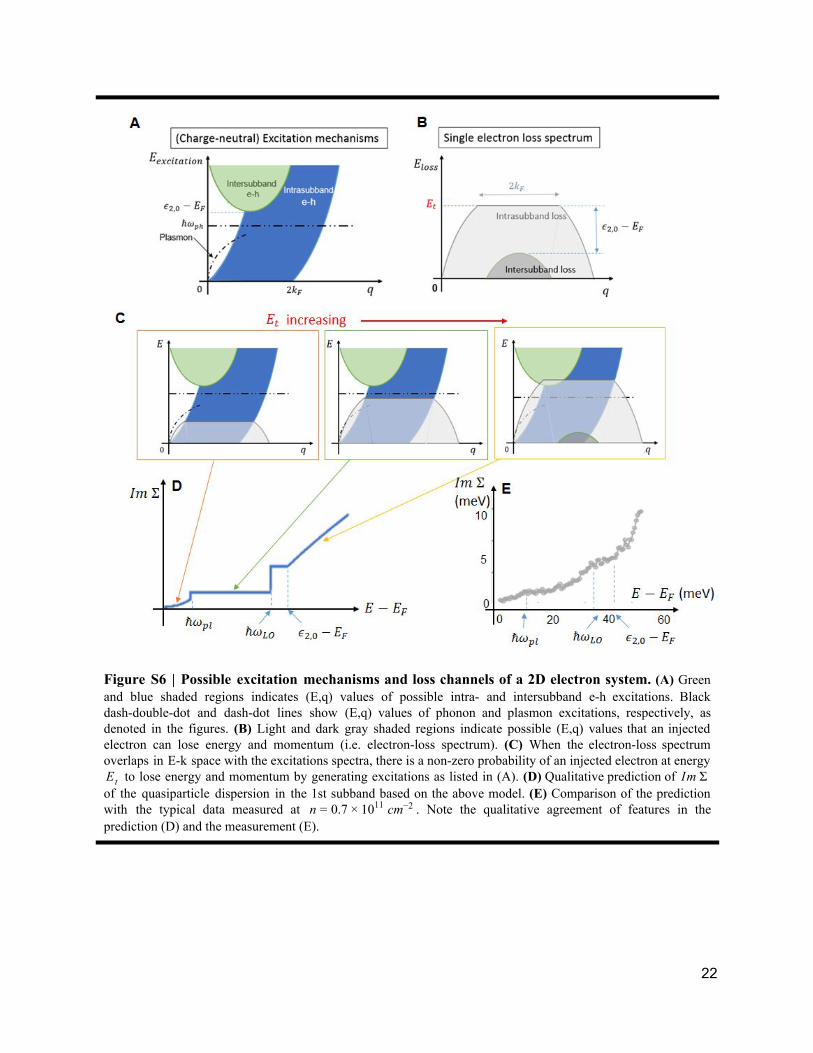
Figure S6 | Possible excitation mechanisms and loss channels of a 2D electron system. (A) Green and blue shaded regions indicates (E,q) values of possible intra- and intersubband e-h excitations. Black dash-double-dot and dash-dot lines show (E,q) values of phonon and plasmon excitations, respectively, as denoted in the figures. (B) Light and dark gray shaded regions indicate possible (E,q) values that an injected electron can lose energy and momentum (i.e. electron-loss spectrum). (C) When the electron-loss spectrum overlaps in E-k space with the excitations spectra, there is a non-zero probability of an injected electron at energy
to lose energy and momentum by generating excitations as listed in (A). (D) Qualitative prediction ofEt m Σ I of the quasiparticle dispersion in the 1st subband based on the above model. (E) Comparison of the prediction with the typical data measured at . Note the qualitative agreement of features in the .7 0 cm n = 0 × 1 11 −2 prediction (D) and the measurement (E).
22
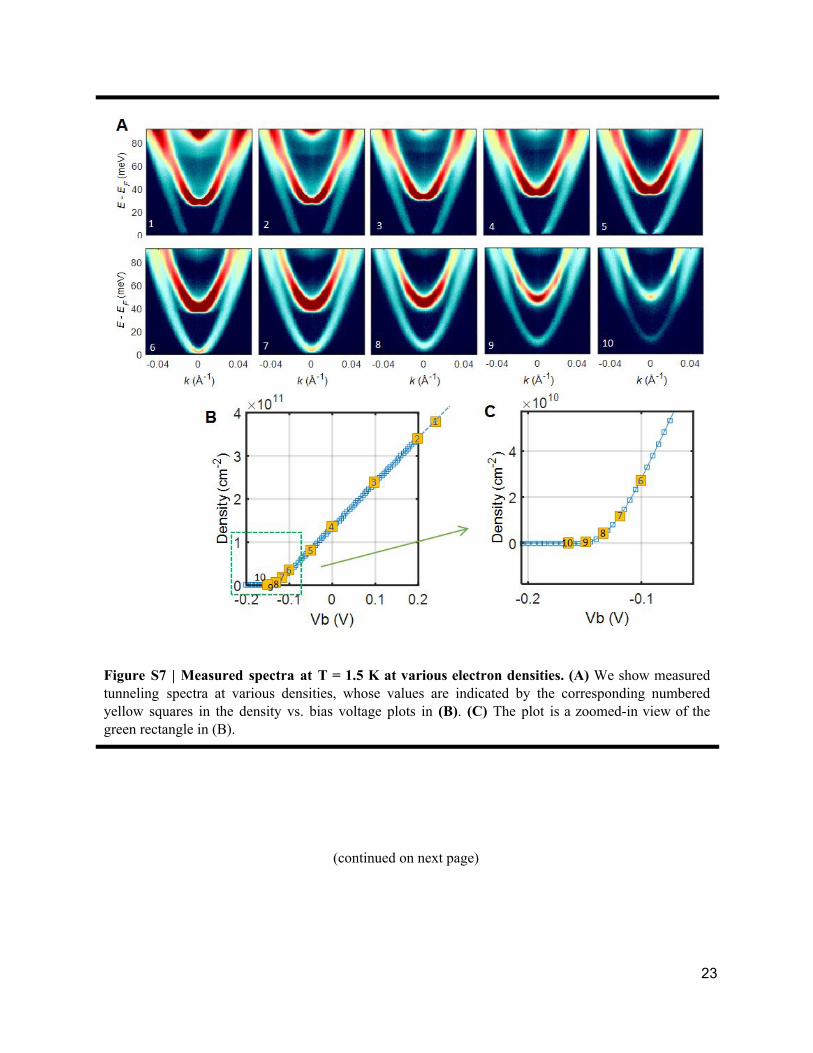
Figure S7 | Measured spectra at T = 1.5 K at various electron densities. (A) We show measured tunneling spectra at various densities, whose values are indicated by the corresponding numbered yellow squares in the density vs. bias voltage plots in (B). (C) The plot is a zoomed-in view of the green rectangle in (B).
(continued on next page)
23
Figure S8 | Temperature dependence of the kink structure. (A) A tunneling spectrum measured at nearly zero density and , and (B) spectra measured at 4, 8, 16 and 24 K with the same density. (C) A .5 K T = 1 spectrum measured at and , and (D) spectra measured at 4, 8, 16 and 24K at the 0 cm n ~ 3 × 1 10 −2 .5 K T = 1 same density. The kink structure (inside the yellow circle) only exists at very low density near the depletion regime and low temperature below 16 K. In (B) and (D), we adjusted color contrast and added constant current contours to ease distinction of the kink features as temperature varies.
(continued on next page)
24
Figure S9 | Line-cuts of the resonant polaron splitting at . (A) (B) T B⊥ = 8 .5 0 cm n = 2 × 1 10 −2 . (C) . Each upper panel shows a vertical line-cut through the yellow.3 0 cm n = 1 × 1 11 −2 .3 0 cm n = 2 × 1 11 −2
dotted lines in each spectrum. The splitting disappears at higher electron densities because the unoccupied electronic states near the Fermi level decrease and eventually no more 1-phonon states are available for the polaron resonance to occur. The sample temperature is 3K. In each 2D spectrum, the contrast is adjusted for maximum visibility.
References
1. G. D. Mahan, Many-Particle Physics (1990).
2. G. Giuliani, G. Vignale, Quantum Theory of the Electron Liquid (Cambridge University Press, 2005).
3. J. Bardeen, L. N. Cooper, J. R. Schrieffer, Theory of Superconductivity. Physical Review. 108, 1175–1204 (1957).
4. D. C. Tsui, H. L. Stormer, A. C. Gossard, Two-Dimensional Magnetotransport in the Extreme Quantum Limit. Phys. Rev. Lett. 48, 1559–1562 (1982).
5. R. Jalabert, Das Sarma S, Quasiparticle properties of a coupled two-dimensional electron-phonon
system. Phys. Rev. B Condens. Matter. 40, 9723–9737 (1989).
6. P. Hawrylak, J. F. Young, P. Brockmann, Dephasing times in modulation-doped quantum wells. Semicond. Sci. Technol. 9, 432–435 (1994).
7. A. Damascelli, D. Andrea, H. Zahid, S. Zhi-Xun, Angle-resolved photoemission studies of the cuprate superconductors. Rev. Mod. Phys. 75, 473–541 (2003).
8. J. E. Hoffman, Imaging Quasiparticle Interference in Bi2Sr2CaCu2O8 delta. Science. 297, 1148–1151 (2002).
9. K. Okazaki et al., Octet-line node structure of superconducting order parameter in KFe2As2. Science. 337, 1314–1317 (2012).
10. J. A. Lebens, R. H. Silsbee, S. L. Wright, Effect of a parallel magnetic field on tunneling in GaAs/AlxGa. Phys. Rev. B Condens. Matter. 37, 10308–10311 (1988).
11. R. K. Hayden et al., Probing the hole dispersion curves of a quantum well using resonant magnetotunneling spectroscopy. Phys. Rev. Lett. 66, 1749–1752 (1991).
12. J. P. Eisenstein, T. J. Gramila, L. N. Pfeiffer, K. W. West, Probing a two-dimensional Fermi surface by tunneling. Phys. Rev. B Condens. Matter. 44, 6511–6514 (1991).
13. O. E. Dial, R. C. Ashoori, L. N. Pfeiffer, K. W. West, High-resolution spectroscopy of two-dimensional electron systems. Nature. 448, 176–179 (2007).
14. R. Winkler, Spin-orbit Coupling Effects in Two-Dimensional Electron and Hole Systems (Springer Science & Business Media, 2003).
15. T. Valla et al., Evidence for quantum critical behavior in the optimally doped cuprate Bi(2)Sr(2)CaCu(2)O(8+delta). Science. 285, 2110–2113 (1999).
16. C.-H. Park, F. Giustino, M. L. Cohen, S. G. Louie, Velocity renormalization and carrier lifetime in graphene from the electron-phonon interaction. Phys. Rev. Lett. 99, 086804 (2007).
17. G. Grimvall, The electron-phonon interaction in metals (North-Holland, 1981).
18. E. L. Wolf, Principles of electron tunneling spectroscopy (Oxford University Press, USA, 1985).
19. J. M. Rowell, W. L. McMillan, W. L. Feldmann, Phonon Emission and Self-Energy Effects in Normal-Metal Tunneling. Phys. Rev. 180, 658–668 (1969).
20. H. Fröhlich, Theory of the Superconducting State. I. The Ground State at the Absolute Zero of Temperature. Physical Review. 79, 845–856 (1950).
21. E. Z. Kuchinskii, I. A. Nekrasov, M. V. Sadovskii, Interplay of electron-phonon interaction and strong correlations: DMFT Σ study. Phys. Rev. B: Condens. Matter Mater. Phys. 80 (2009), doi:10.1103/physrevb.80.115124.
22. S. Adachi, GaAs, AlAs, and AlxGa1−xAs Material parameters for use in research and device applications. J. Appl. Phys. 58, R1 (1985).
23. M. H. Degani, G. A. Farias, Polaron effects in one-dimensional lateral quantum wires and parabolic quantum dots. Phys. Rev. B Condens. Matter. 42, 11950–11952 (1990).
24. T. Inoshita, I. Takeshi, S. Hiroyuki, Density of states and phonon-induced relaxation of electrons in semiconductor quantum dots. Phys. Rev. B: Condens. Matter Mater. Phys. 56, R4355–R4358 (1997).
25. G. Scalari et al., Ultrastrong coupling of the cyclotron transition of a 2D electron gas to a THz metamaterial. Science. 335, 1323–1326 (2012).
26. Q. Zhang et al., Collective non-perturbative coupling of 2D electrons with high-quality-factor terahertz cavity photons. Nat. Phys. (2016), doi:10.1038/nphys3850.
27. R. Asgari et al., Quasiparticle self-energy and many-body effective mass enhancement in a two-dimensional electron liquid. Phys. Rev. B: Condens. Matter Mater. Phys. 71 (2005), doi:10.1103/physrevb.71.045323.
28. Y.-W. Tan et al., Measurements of the Density-Dependent Many-Body Electron Mass in Two Dimensional G a A s / A l G a A s Heterostructures. Phys. Rev. Lett. 94 (2005), doi:10.1103/physrevlett.94.016405.
29. E. H. Hwang, S. Das Sarma, Plasmon dispersion in dilute two-dimensional electron systems: Quantum-classical and Wigner crystal–electron liquid crossover. Phys. Rev. B: Condens. Matter Mater. Phys. 64 (2001), doi:10.1103/physrevb.64.165409.
30. G. F. Giuliani, J. J. Quinn, Lifetime of a quasiparticle in a two-dimensional electron gas. Phys. Rev. B: Condens. Matter Mater. Phys. 26, 4421–4428 (1982).
31. S. Q. Murphy, J. P. Eisenstein, L. N. Pfeiffer, K. W. West, Lifetime of two-dimensional electrons measured by tunneling spectroscopy. Phys. Rev. B Condens. Matter. 52, 14825–14828 (1995).
32. A. Bostwick et al., Quasiparticle dynamics in graphene. Nat. Phys. 3, 36–40 (2006).
33. J. Ruhman, P. A. Lee, Superconductivity at very low density: The case of strontium titanate. Phys. Rev. B: Condens. Matter Mater. Phys. 94 (2016), doi:10.1103/physrevb.94.224515.
34. J. Jang, B. M. Hunt, L. N. Pfeiffer, K. W. West, R. C. Ashoori, Sharp tunnelling resonance from the vibrations of an electronic Wigner crystal. Nat. Phys. (2016), doi:10.1038/nphys3979.
35. A. Singha et al., Two-Dimensional Mott-Hubbard Electrons in an Artificial Honeycomb Lattice. Science. 332, 1176–1179 (2011).
36. J. Jang, B. Hunt, L. N. Pfeiffer, K. W. West, R. C. Ashoori, Tunneling as a Means of Probing Ordered Electronic Structure: Observation of a Sharp Tunneling Resonance from the Vibrations of a Wigner-Crystal. arXiv:1604.06220 [cond-mat.str-el] (2016), (available at http://arxiv.org/abs/1604.06220).
37. E. J. Nicol, J. P. Carbotte, Phonon spectroscopy through the electronic density of states in graphene. Phys. Rev. B Condens. Matter. 80, 081415 (2009).
38. F. Doğan, F. Marsiglio, Self-consistent modification to the electron density of states due to electron-phonon coupling in metals. Phys. Rev. B: Condens. Matter Mater. Phys. 68 (2003),