EMM078-1 CSCE Annual Conference Growing with youth – Croître avec les jeunes Laval (Greater Montreal) June 12 - 15, 2019 Full-Scale Laboratory Pullout Testing of 60 mm Diameter Buried MDPE Pipes Auchib Reza 1, 2 , Ashutosh Sutra Dhar 1 and Abu Hena Muntakim 1 1 Department of Civil Engineering – Memorial University of Newfoundland, St. John’s, NL, Canada 2 [email protected]Abstract: Buried pipelines are extensively used for transporting oil, gas and water in Canada and worldwide, since pipelines are considered as the most convenient and economical means of transporting liquid and gas. The pipelines often cross active landslide areas, which are subjected to additional loads due to ground movements. Assessment of the effects of ground movements on the performance of the pipeline is, therefore, an important consideration for pipeline integrity assessment. The existing pipe design methods for the assessment of the performance of pipelines crossing active landslide area recommend using a simplified method to calculate maximum pullout force due to axial landslide without proper consideration of soil-pipe interaction. Researchers employed analytical and numerical modelling approaches to explain the soil-pipe interaction during relative ground movements. However, the assumptions used in the analytical and numerical models require validation with experimental evidence. In this research, a new full-scale pipe test facility has been developed to investigate the behaviour of flexible medium- density polyethylene (MDPE) pipes subjected to movements relative to the backfill soil. Pullout tests of 60 mm diameter MDPE pipes are performed using the test facility. The study reveals that the pullout behaviour of the pipe significantly depends on the viscoelastic response of the pipe material. Pipe strains developed almost linearly from the leading end to the tailing end when the shear strength is fully mobilized over the entire pipe length. Research findings demonstrate the need for considering the time-dependent effects of pipe materials in describing the soil-pipeline interaction during the axial pullout. 1 INTRODUCTION Pipelines are the most efficient and common means of transporting fluids from one point to another. Pipes of different materials such as cast iron, ductile iron, steel and polymers are used for liquid and gas transportation and distribution systems. Polyethylene (PE) pipes have become popular owing to their corrosion resistant, fatigue resistant, leak-free joints, adaptability and other advantageous properties. Two types of polyethylene pipes, medium-density polyethylene and high-density polyethylene are widely used for new pipeline installation as well as for replacing the existing aged old pipeline systems. Due to the higher flexibility and long-term strength of medium density polyethylene (MDPE) compared to high-density polyethylene (HDPE), more than 60% of pipes used in the natural gas distribution industry are MDPE materials (Stewart et al. 1999). Though polyethylene pipes can accommodate larger displacement than steel pipes, the ground movements have the potential to induce significant strain on the polyethylene piping system. Ground deformation may occur from hazards that include a lateral spread of sloped surfaces, liquefaction, and differential soil movement at the fault lines. Ideally, the routing of a buried pipe is selected to avoid these natural hazards. Where this is not possible, the effects of postulated ground motions are considered
Transcript
EMM078-1
CSCE Annual Conference
Growing with youth – Croître avec les jeunes
Laval (Greater Montreal)
June 12 - 15, 2019
Full-Scale Laboratory Pullout Testing of 60 mm Diameter Buried MDPE Pipes
Auchib Reza 1, 2, Ashutosh Sutra Dhar 1 and Abu Hena Muntakim 1 1 Department of Civil Engineering – Memorial University of Newfoundland, St. John’s, NL, Canada 2 [email protected]
Abstract: Buried pipelines are extensively used for transporting oil, gas and water in Canada and worldwide, since pipelines are considered as the most convenient and economical means of transporting liquid and gas. The pipelines often cross active landslide areas, which are subjected to additional loads due to ground movements. Assessment of the effects of ground movements on the performance of the pipeline is, therefore, an important consideration for pipeline integrity assessment. The existing pipe design methods for the assessment of the performance of pipelines crossing active landslide area recommend using a simplified method to calculate maximum pullout force due to axial landslide without proper consideration of soil-pipe interaction. Researchers employed analytical and numerical modelling approaches to explain the soil-pipe interaction during relative ground movements. However, the assumptions used in the analytical and numerical models require validation with experimental evidence. In this research, a new full-scale pipe test facility has been developed to investigate the behaviour of flexible medium-density polyethylene (MDPE) pipes subjected to movements relative to the backfill soil. Pullout tests of 60 mm diameter MDPE pipes are performed using the test facility. The study reveals that the pullout behaviour of the pipe significantly depends on the viscoelastic response of the pipe material. Pipe strains developed almost linearly from the leading end to the tailing end when the shear strength is fully mobilized over the entire pipe length. Research findings demonstrate the need for considering the time-dependent effects of pipe materials in describing the soil-pipeline interaction during the axial pullout.
1 INTRODUCTION
Pipelines are the most efficient and common means of transporting fluids from one point to another. Pipes of different materials such as cast iron, ductile iron, steel and polymers are used for liquid and gas transportation and distribution systems. Polyethylene (PE) pipes have become popular owing to their corrosion resistant, fatigue resistant, leak-free joints, adaptability and other advantageous properties. Two types of polyethylene pipes, medium-density polyethylene and high-density polyethylene are widely used for new pipeline installation as well as for replacing the existing aged old pipeline systems. Due to the higher flexibility and long-term strength of medium density polyethylene (MDPE) compared to high-density polyethylene (HDPE), more than 60% of pipes used in the natural gas distribution industry are MDPE materials (Stewart et al. 1999). Though polyethylene pipes can accommodate larger displacement than steel pipes, the ground movements have the potential to induce significant strain on the polyethylene piping system. Ground deformation may occur from hazards that include a lateral spread of sloped surfaces, liquefaction, and differential soil movement at the fault lines. Ideally, the routing of a buried pipe is selected to avoid these natural hazards. Where this is not possible, the effects of postulated ground motions are considered
EMM078-2
in the design. However, among the most threats associated with pipeline failure, ground movement/weather-related threat to onshore pipeline operation is reported to be 16% in North America and 15% in Europe (Mohitpour et al. 2010). Over the years, numerous studies have been conducted to understand the soil-pipe interaction mechanisms of the pipes subjected to ground movement (Wijewickreme et al. 2009; Bilgin et al. 2009; Liu et al. 2011; Sheil et al. 2016). Most of the earlier studies focused on understanding the behavior of steel pipe. The design methods developed based on steel pipes are often used in the design of PE pipes. However, the difference between the behaviors of PE and steel pipes subjected to ground loads are now well recognized. PE pipe materials are flexible compared to steel and show nonlinear time-dependent stress-strain responses. As a result, stress or strain developing in the pipe due to ground movement is influenced by the rate of loading and its flexibility. Weerasekara et al. (2008) performed full-scale laboratory axial pullout tests on MDPE pipes buried in dense Fraser River Sand and demonstrated the effects of the time-dependent response of the pipe on the pullout forces. However, the effects of strain rate dependent response of the axial pullout were not extensively investigated in that study. In the current research, pullout tests of 60 mm diameter MDPE pipes are conducted under different rates of loading to investigate the strain rate effect. Tests are conducted in a newly developed laboratory test facility. The test pipes are buried in local sand available in Newfoundland and Labrador.
2 REVIEW OF SOIL RESISTANCE AGAINST AXIAL PIPE MOVEMENT
ASCE (1984) guidelines were the standard reference for pipeline design against seismically induced ground movement, which later was adopted by the ALA (2001). ASCE (1984) and ALA (2001) are the existing guidelines for the assessment of the performance of pipelines subjected to ground movements. These guidelines recommend using a simplified method to calculate the maximum pullout force due to axial landslide without proper consideration of soil-pipe interaction. As the general form of the equations was not varied significantly over the past 20 years, it is a common practice to determine the axial loads for the onshore buried pipeline in cohesionless sand using the following expression as in Eq. 1:
[1] FA = γ΄ × H× (π D L) × (1+𝑘0
2) × tanδ
where D = pipe outside diameter, H = depth to pipe centerline (springline), γ ́= effective unit weight of soil, k0 = effective co-efficient of horizontal earth pressure, δ = interface angle of friction between the pipe and
the surrounding soil. The term ‘γ΄H (1+𝑘0
2)’ is used as the average normal stress, σn, acting on the pipe
surface. The average normal stress is then multiplied by the friction co-efficient ‘tanδ’ to obtain the maximum unit shearing resistance along the soil-pipeline interface. The peak pullout force FA is calculated multiplying the unit shearing resistance by the surface area of the pipe (πDL). Thus, the interface friction, which depends on the normal stress acting on the pipe, is the primary source of axial soil resistance on the pipe. However, the simplified approach of calculating normal stress and hence the maximum pullout force was found to be unsuccessful in predicting the axial resistance measured in the laboratory tests (Paulin et al., 1998, Weerasekara et al. 2008). Moreover, Eq. (1) does not account for the relative stiffness of the pipe with respect to the surrounding soil. Based of FE analysis, Muntakim et al. (2017) revealed that the pullout force also depends on the relative stiffness of the pipe. However, no experimental validation of the FE finding is currently available. To this end, a new full-scale pipe testing facility developed at Memorial University of Newfoundland (Murugathasan et al. 2018) has been used in this study to investigate the behaviour of flexible MDPE pipes subjected to axial ground movement.
3 GROUND MOVEMENT RATES
Polyethylene pipe material shows viscoelastic/ viscoplastic behavior when subjected to load. Thus, the loads on the pipelines due to landslides may depend on the rate of ground movement. Various rates of landslide movement have been reported in the literature ranging from imperceptibly slow (millimeters per year) to extremely rapid (many meters per second). Varnes (1978) and Cruden and Varnes (1996) proposed a landslide velocity scales as shown in Table 1.
EMM078-3
Table 1: Landslide velocity scale (Cruden and Varnes, 1996)
Velocity class Description Velocity (mm/s)
Typical velocity
7 Extremely rapid 5 x 10³
5 x 101
5 x 10⁻¹
5 x 10⁻³
5 x 10⁻⁵
5 x 10⁻⁷
5 m/s
3 m/min
1.8 m/hr
13 m/month
1.6 m/year
16 mm/year
6 Very rapid
5 Rapid
4 Moderate
3 Slow
2 Very Slow
1 Extremely Slow
Even though the movement of many slow landslides appears to be relatively steady, detailed monitoring has shown that movement may be episodic or that movement rates may vary greatly over timescales ranging from hours to years (Keefer et al., 1983; Kalaugher et al. 2000; Coe et al. 2003; Petley 2004; Picarelli et al., 2004). The effects of different rates of landslide on pipeline integrity have not been investigated extensively. In the current research, MDPE pipes are tested under different rates of loading to investigate the effect of landslide rates.
4 EXPERIMENTAL ASPECTS
4.1 Test Equipment, Instrumentation, and Data Collection
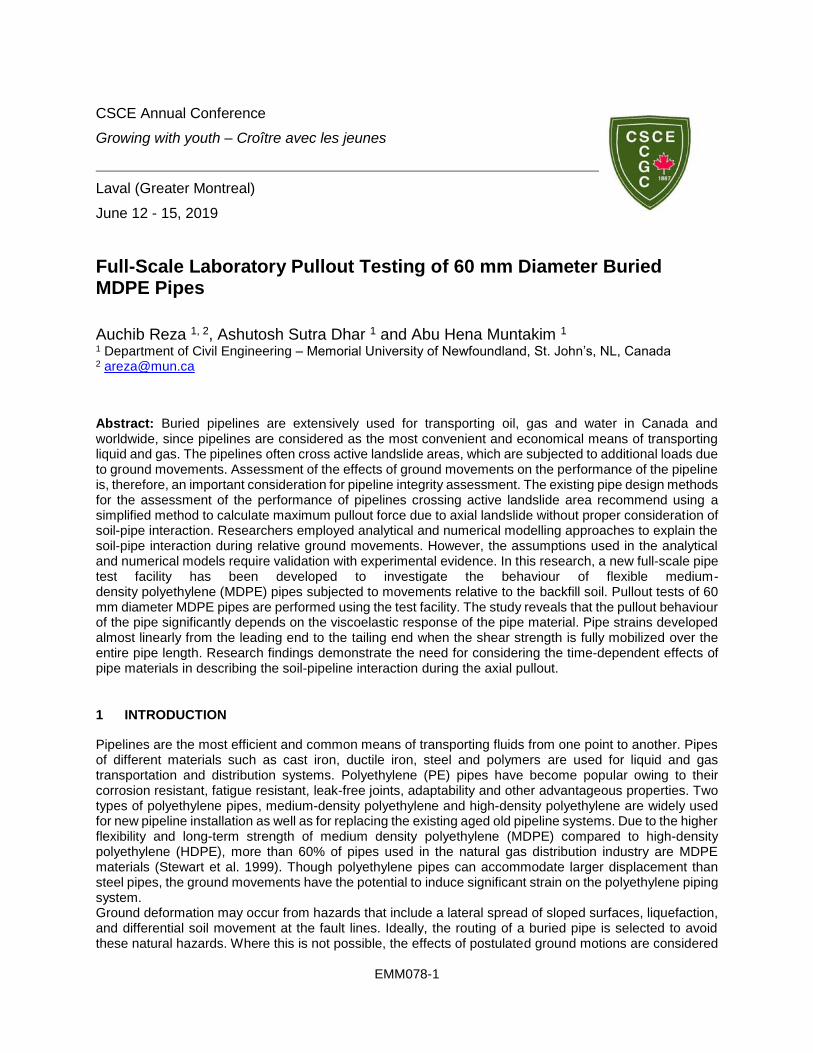
The pipe test facility is a steel box with inside dimensions of 2 m in width, 4 m in length, and 1.5 m in depth. The test pipe is buried in local sand in the box. The pipe is protruded out of the test box from two ends through two circular openings. The circular openings are adjustable to accommodate pipes of different diameters. The openings are somewhat larger than the pipe diameter, which is filled using a rubber gasket with lubrication to minimize friction between the pipe and the cell wall at the openings. One protruded end of the pipe is connected using a specially designed pulling mechanism to a hydraulic actuator for axial pulling. This end of the pipe called herein as the leading end. Movement of the leading end is measured from the movement of the head of the actuator. At the other end of the pipe, called herein as tailing end, a LVDT (linear variable differential transformer) is connected to measure the axial movement. The difference between the leading end movement and tailing end movement is the total elongation of the pipe due to axial pulling. Pipe wall strains are also monitored using electronic strain gauges. Four uniaxial strain gauges are installed: one near the leading end and the others at one-fourth, half and three-fourths of the pipe length within the box. The uniaxial strain gauges are placed at the pipe crown. One biaxial strain gauge is attached at the 1/2th length of pipe within the test box at the springline to monitor longitudinal and circumferential strains. The plan view of the test box along with pipe instrument locations and pulling mechanism is shown in Figure 1. The actuator is fitted with a reaction frame made of steel I-sections. A load cell is connected to the actuator that has 22.5 kN capacity with an accuracy of ±4.45 N. The LVDT has a total travel capacity of 110 mm with an accuracy of about 0.025 mm.
The data from the load cell, LVDT and strain gauges are monitored using a computer-controlled data acquisition system. The pipes are pulled at varying rates such as 0.5mm/min, 1 mm/min and 2mm/min during the tests (termed herein as Test 1, Test 2 and Test 3, respectively).
4.2 Pipe Installation
Three tests are conducted using the MDPE pipes of 60.3 mm nominal diameter at various loading rates. Standard Dimension Ratio (SDR) (ratio of the pipe outside diameter to wall thickness) of the pipes is 11. These pipes are commonly used for the gas distribution system in Canada (Anderson et al. 2005). The pipes are buried at a depth of 0.48 m, which is 8 times the pipe diameter. The soil width on each side of
EMM078-4
pipes in the 2 m wide test cell is about 16 times the pipe diameter, which is sufficiently far to minimize the boundary effects during axial pullout tests.
Figure 1: Plan of the MDPE pullout test setup (top view)
The pipe in the test cell has to be straight and horizontal during the axial pullout tests. Phillips et al. (2004) reported that slight axial misalignment can cause a significant increase in the mobilized axial resistance. During installation in the test box, a large spirit level of 1000 mm basic length is used to ensure straightness of the pipe during backfilling.
4.3 Backfill Sand
A locally available well-graded sand (USCS classification = SW) is used as the backfill material for the pipe. The material contains approximately 1.30% of fines and 98.70% of sand. The maximum dry density is obtained as 18.9 kN/m3 with a corresponding optimum moisture content of 0% from Standard Proctor Compaction tests (ASTM D698 2003) (Saha et al. 2019).
About 8.65 m3 of sand is required to achieve the desired depth of soil cover from the bottom of the tank for each test. The sand is compacted in layers by kneading at every 2 m3 (approximately) of placement. After the completion of axial pullout, density measurements are taken at three different locations inside the testing tank, which yielded an average unit weight of 14.5 ± 0.5 kN/m3 from the top surface to the pipe springline level. Thus, the average relative compaction of the backfill material is roughly 75% of the Standard Proctor Maximum dry density and relative density is 60-65% which confirms the medium dense conditions of the test sand. Moisture content of the soil is also measured and found to be less than 2%.
5 TEST RESULTS
5.1 Load-Displacement Responses
During axial pullout of pipes in the tests, surrounding soil offers resistance to the pipe movements. The resisting force of the soil is equal to the pullout forces applied to the pipe. The flexible MDPE pipe elongates with the application of pullout forces. The pullout forces (soil resistance) and elongation of the pipes obtained during the tests are presented in Figure 2. As seen in Figure 2(a), the soil resistances increase non-linearly with the pulling displacement at the leading end of the pipes. The soil resistances reach peak values and then decrease with further application of leading end displacements. The peak soil resistance is higher for the tests with higher displacement rates that occur at higher leading end displacements. In Test 1, Test 2 and Test 3 performed at a displacement rates of 0.5 mm/min, 1 mm/min and 2 mm/min, the
Reaction frame
Leading end of pipe
Strain gauges
Actuator
Load cell
2m
4m
Tailing end of
the pipe
LVDT
EMM078-5
peak resistances are approximately 1.35 kN, 1.70 kN and 2.36 kN that occurred at the pipe leading end displacements of 5 mm, 8.55 mm and 9 mm, respectively. The peak axial force is also calculated using the current design guidelines (ASCE 1984, ALA 2001) that provided the maximum pullout resistance of 1.55 kN (shown in Figure 2a). In calculating the pullout resistance using the current design guidelines, the coefficient of lateral earth pressures is calculated using Jaky’s formula (i.e., k0 = 1-sinφ) using φ =40 ̊, corresponding to the peak friction angle of the local sand at the test density. The interface friction angle (δ) between the MDPE pipe surface and sand is assumed to be 24 ̊. From the comparison of peak pullout resistances, it reveals that the maximum pullout resistance for the MDPE pipes depends on the pulling rate of the pipes, which is not accounted for in the current design guidelines. As a result, the equation in the design guidelines underpredicted the axial force for pipe subjected to 1 mm/min and 2 mm/min of displacement rates and overpredicted the axial force for the pipe subjected 0.5 mm/min of displacement rate. It is to be noted that the current design guidelines developed for steel pipes are the only resource available for assessing the pipelines subjected to ground movement. However, the test results presented in this study demonstrate that the existing design guidelines are not applicable for calculation of pullout force for MDPE pipes.
(a) (b)
Figure 2: A relationship between (a) pullout resistance (b) pipe elongation-trailing end displacement with leading end displacement of the pipe
Figure 2(b) explains the deformation mechanism of the pipelines during the pullout tests. The figure plots pipe elongations, calculated from the difference between the loading end displacements and tailing end displacements, against the leading end displacements. In the figure, the pipe elongation increases linearly with the leading end displacement up to a peak value, after which the pipe elongation is stabilized or decreases. It also shows that the tailing end starts to move at the leading end displacements of 5 mm, 8.55 mm and 9.0 mm in Tests 1, 2 and 3, respectively. Thus, the leading end displacement is initially due to the elongation of the pipes only. Therefore, the interface shear strength is not mobilized over the entire length of the pipes at these displacements. This is confirmed by the maximum pullout forces (Figure 2a) and the maximum pipe elongations (Figure 2b) at these leading end displacements. The pullout resistance reaches to the maximum value at the point of full mobilization of shear strength over the entire length of the pipe. Beyond the maximum value, the pullout resistance reduces likely due to shear strength degradation.
It is to be noted that the flexible pipe elongates with the application of pullout forces. As a result, the mobilized shear strength is expected to be non-uniform along the length of the pipe. The mobilized shear stress at a point would depend on the relative movement of this point of the pipe with respect to the surrounding soil. However, the current design guidelines employ a simplified equation for calculating the
0
0.5
1
1.5
2
2.5
0 10 20 30 40
Pullo
ut re
sis
tance (
kN
)
Leading end displacement(mm)
Test 1
Test 2
Test 3
ASCE, 1984
0
10
20
30
40
0
2.5
5
7.5
10
0 10 20 30 40
Tra
ilin
g e
nd d
ispla
cem
ent (m
m)
Pip
e e
longatio
n (
mm
)
Leading end displacement (mm)
Pipe elongation_Test 1
Pipe elongation_Test 2
Pipe elongation_Test 3
Trailing end displacement_Test 1
Trailing end displacement_Test 2
Trailing end displacement_Test 3
Tailing end begins to move in Test 1
Tailing end begins to move in Test 3
Tailing end begins to move in Test 2
EMM078-6
maximum pullout force assuming uniform shearing stress over the entire length of the pipe. This assumption may not be applicable for flexible MDPE pipelines.
5.2 Pipe Wall Strains
During the tests, pipe wall strains are measured at four locations along the length of the pipes. Electronics strain gauges are placed near the pulling end and at the distances of a quarter (L/4), half (L/2) and a three-quarter (3L/4) of the pipe length within the test cell measured from the pulling end. The measured pipe wall strains are examined here to understand the progression of the mobilized soil loads along the pipe.
Figure 3 plots the measured axial strains against the leading end displacements in two of the tests (Test 1 and Test 3). Axial strain data at various point is not available from Test 2. As expected, the axial strains are different at different locations along the pipe length (Figure 3). The strain near the leading end starts increasing immediately at the application of the leading end displacement. However, the points within the segment of the pipe buried in the sand experience axial strains at different magnitudes of leading end displacements. For example, in Tests 3, the point at L/4 experiences axial strain almost immediately after application of leading end displacement, while the points at the distances of L/2 and 3L/4 experience axial strains at around 2 mm and 4 mm of leading end displacements, respectively. Thus, for the leading end displacements of up to 2 mm and 4 mm, the axial force is not mobilized beyond the distances of one-half and three-quarter of the pipe length from the leading end of the test cell, respectively. Figure 3 shows that the axial strains increase with the further increase of the leading end displacement and reach the peak values at the point where the interface shear strength is fully mobilized, and the peak pullout resistance is reached. Beyond the leading end displacement of about 9 mm, the pipe elongation as well as the axial strains stabilize. Thus, although the axial strains along the lengths of the pipe are non-uniform (i.e., different at different locations), the shear strength of the soil at the soil-pipe interface appears to be mobilized over the entire pipe length at the maximum pullout force.
(a) Test 1 (b) Test 3
Figure 3: Axial strains at different locations of the pipes
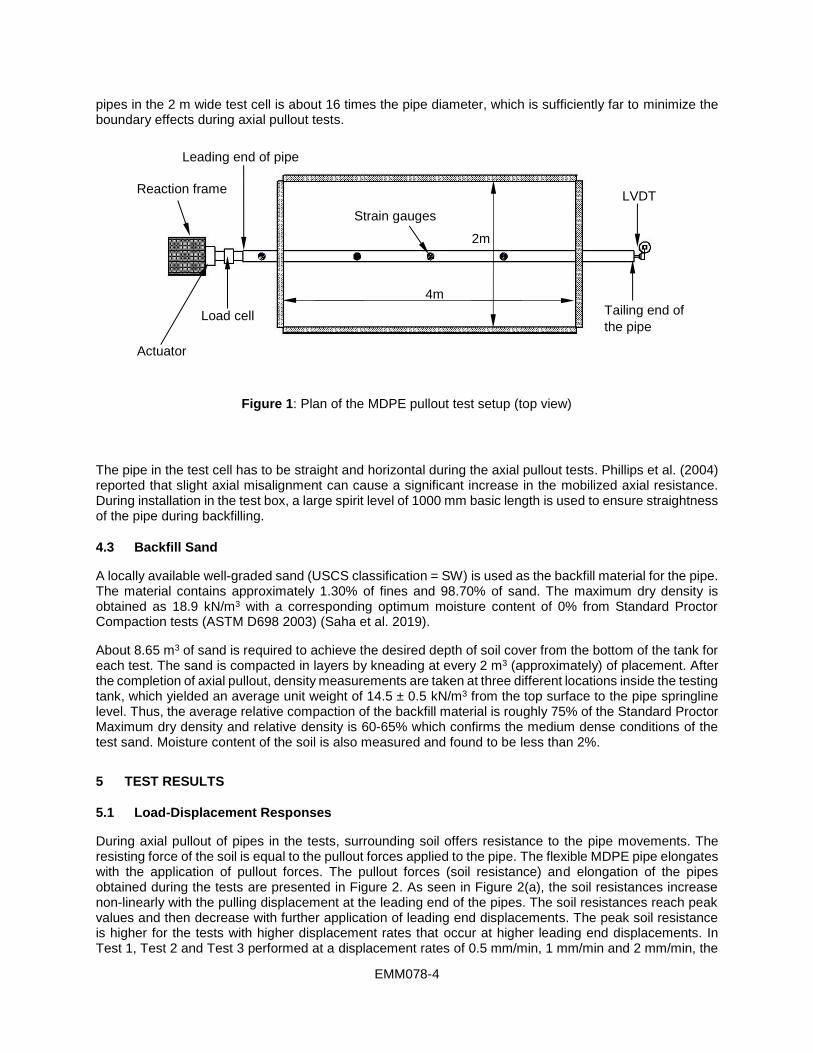
The mobilization of axial force along the length of the pipe can be examined from the axial strains along the
pipe length. The distributions of axial strain along the pipe length at different leading end displacements are
plotted in Figure 4. It shows again that the axial strain is higher toward the leading end and less toward the
tailing end. The tailing end strain is zero at the point where the axial force is not mobilized during the pullout.
As discussed above, the axial force is mobilized over the entire length of the pipe when the pullout force is
the maximum. The distribution of axial strain along the pipe length is almost linear after full mobilization of
the interface shear strength at the peak pullout resistance (or pullout force). Thus, the distribution of the
0
0.0005
0.001
0.0015
0.002
0 10 20 30
Axia
l str
ain
on p
ipe
Leading end displacement (mm)
Near leading end
L/4
L/2
3L/4
0
0.001
0.002
0.003
0.004
0 10 20 30 40
Axia
l str
ain
on p
ipe
Leading end displacement(mm)
Near leading end
L/4
L/2
3L/4
EMM078-7
axial force can be assumed to be linear along the pipe length. This implies that unit shear resistance at the
pipe-soil interface is constant along the pipe length after full mobilization of the shear strength. Therefore,
the maximum pullout resistance can be calculated through prediction of the unit interface shear resistance.
(a) Test 1 (b) Test 3
Figure 4: Distribution of axial strains along the pipe length.
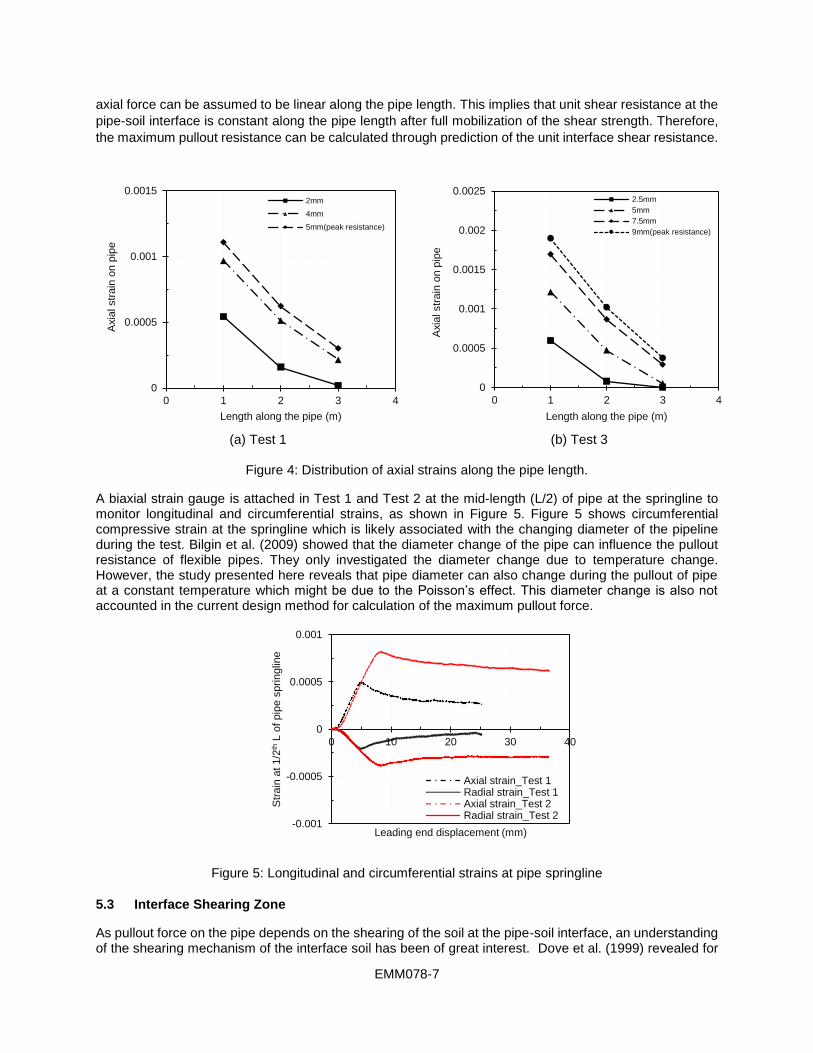
A biaxial strain gauge is attached in Test 1 and Test 2 at the mid-length (L/2) of pipe at the springline to monitor longitudinal and circumferential strains, as shown in Figure 5. Figure 5 shows circumferential compressive strain at the springline which is likely associated with the changing diameter of the pipeline during the test. Bilgin et al. (2009) showed that the diameter change of the pipe can influence the pullout resistance of flexible pipes. They only investigated the diameter change due to temperature change. However, the study presented here reveals that pipe diameter can also change during the pullout of pipe at a constant temperature which might be due to the Poisson’s effect. This diameter change is also not accounted in the current design method for calculation of the maximum pullout force.
Figure 5: Longitudinal and circumferential strains at pipe springline
5.3 Interface Shearing Zone
As pullout force on the pipe depends on the shearing of the soil at the pipe-soil interface, an understanding of the shearing mechanism of the interface soil has been of great interest. Dove et al. (1999) revealed for
geomembrane that sliding and plowing between sand-PE geomembrane are the principal mechanisms at their interfaces, which governs peak interface shear behaviour. During axial displacement, shear-induced volumetric strains are expected to occur within an annular shear zone around the pipe. The interface shearing was reported to occur within a narrow shear zone around the smooth sand-geomembrane interface (DeJong et al. 2005). Dove et al. (2006) monitored the thickness of active shear zone for Fraser River sand using micro-scale particle image velocimetry (PIV) and found the thickness in the order of 1 to 2.3 mm, which is 5-7 times particle diameters of d50. Karimian (2006) observed based on the movement of 15 mm coloured sand strips placed in the vicinity of the steel pipes as well as polyethylene (PE) pipes during axial loading and found that nearly 2 mm thickness of a zone is being shared during the axial pullout.
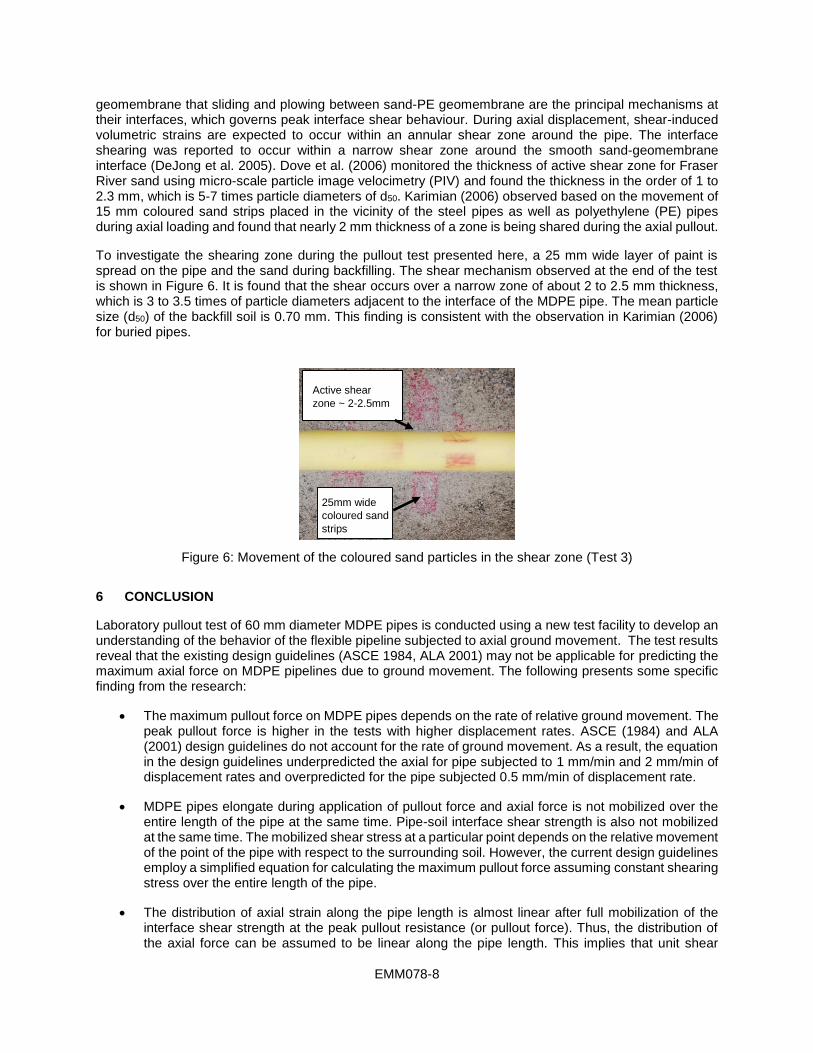
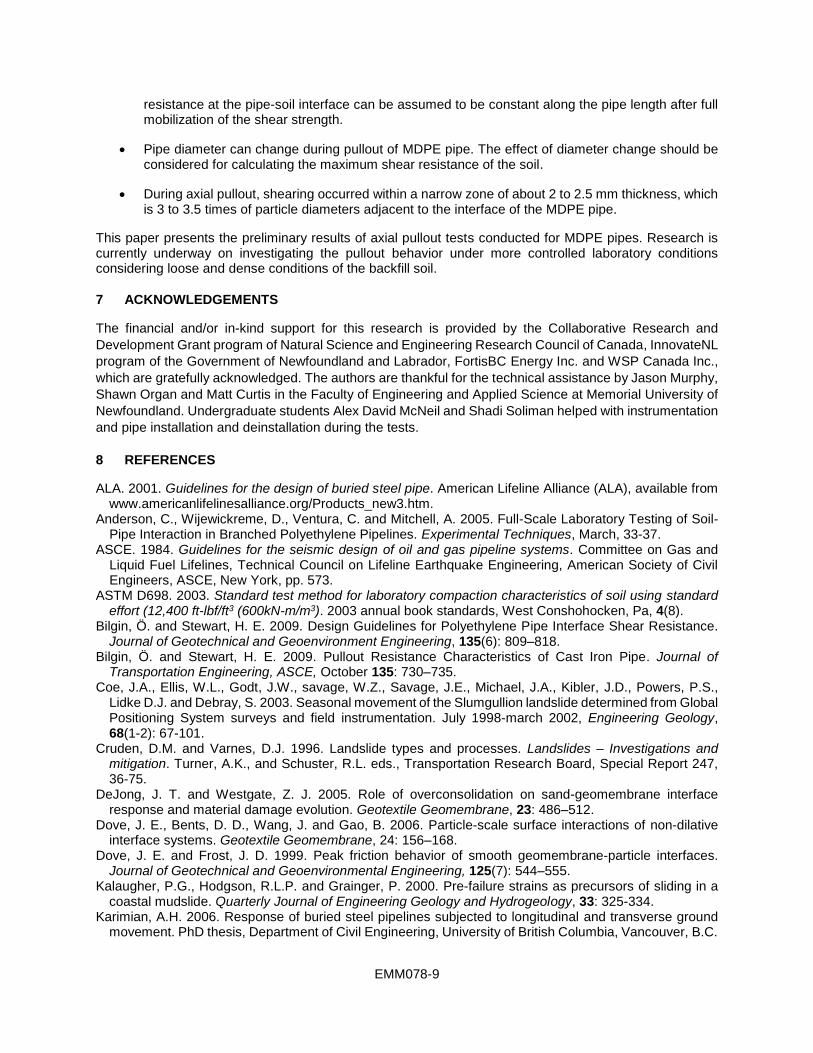
To investigate the shearing zone during the pullout test presented here, a 25 mm wide layer of paint is spread on the pipe and the sand during backfilling. The shear mechanism observed at the end of the test is shown in Figure 6. It is found that the shear occurs over a narrow zone of about 2 to 2.5 mm thickness, which is 3 to 3.5 times of particle diameters adjacent to the interface of the MDPE pipe. The mean particle size (d50) of the backfill soil is 0.70 mm. This finding is consistent with the observation in Karimian (2006) for buried pipes.
Figure 6: Movement of the coloured sand particles in the shear zone (Test 3)
6 CONCLUSION
Laboratory pullout test of 60 mm diameter MDPE pipes is conducted using a new test facility to develop an understanding of the behavior of the flexible pipeline subjected to axial ground movement. The test results reveal that the existing design guidelines (ASCE 1984, ALA 2001) may not be applicable for predicting the maximum axial force on MDPE pipelines due to ground movement. The following presents some specific finding from the research:
• The maximum pullout force on MDPE pipes depends on the rate of relative ground movement. The peak pullout force is higher in the tests with higher displacement rates. ASCE (1984) and ALA (2001) design guidelines do not account for the rate of ground movement. As a result, the equation in the design guidelines underpredicted the axial for pipe subjected to 1 mm/min and 2 mm/min of displacement rates and overpredicted for the pipe subjected 0.5 mm/min of displacement rate.
• MDPE pipes elongate during application of pullout force and axial force is not mobilized over the entire length of the pipe at the same time. Pipe-soil interface shear strength is also not mobilized at the same time. The mobilized shear stress at a particular point depends on the relative movement of the point of the pipe with respect to the surrounding soil. However, the current design guidelines employ a simplified equation for calculating the maximum pullout force assuming constant shearing stress over the entire length of the pipe.
• The distribution of axial strain along the pipe length is almost linear after full mobilization of the interface shear strength at the peak pullout resistance (or pullout force). Thus, the distribution of the axial force can be assumed to be linear along the pipe length. This implies that unit shear
25mm wide
coloured sand
strips
Active shear
zone ~ 2-2.5mm
EMM078-9
resistance at the pipe-soil interface can be assumed to be constant along the pipe length after full mobilization of the shear strength.
• Pipe diameter can change during pullout of MDPE pipe. The effect of diameter change should be considered for calculating the maximum shear resistance of the soil.
• During axial pullout, shearing occurred within a narrow zone of about 2 to 2.5 mm thickness, which is 3 to 3.5 times of particle diameters adjacent to the interface of the MDPE pipe.
This paper presents the preliminary results of axial pullout tests conducted for MDPE pipes. Research is currently underway on investigating the pullout behavior under more controlled laboratory conditions considering loose and dense conditions of the backfill soil.
7 ACKNOWLEDGEMENTS
The financial and/or in-kind support for this research is provided by the Collaborative Research and
Development Grant program of Natural Science and Engineering Research Council of Canada, InnovateNL
program of the Government of Newfoundland and Labrador, FortisBC Energy Inc. and WSP Canada Inc.,
which are gratefully acknowledged. The authors are thankful for the technical assistance by Jason Murphy,
Shawn Organ and Matt Curtis in the Faculty of Engineering and Applied Science at Memorial University of
Newfoundland. Undergraduate students Alex David McNeil and Shadi Soliman helped with instrumentation
and pipe installation and deinstallation during the tests.
8 REFERENCES
ALA. 2001. Guidelines for the design of buried steel pipe. American Lifeline Alliance (ALA), available from www.americanlifelinesalliance.org/Products_new3.htm.
Anderson, C., Wijewickreme, D., Ventura, C. and Mitchell, A. 2005. Full-Scale Laboratory Testing of Soil-Pipe Interaction in Branched Polyethylene Pipelines. Experimental Techniques, March, 33-37.
ASCE. 1984. Guidelines for the seismic design of oil and gas pipeline systems. Committee on Gas and Liquid Fuel Lifelines, Technical Council on Lifeline Earthquake Engineering, American Society of Civil Engineers, ASCE, New York, pp. 573.
ASTM D698. 2003. Standard test method for laboratory compaction characteristics of soil using standard effort (12,400 ft-lbf/ft3 (600kN-m/m3). 2003 annual book standards, West Conshohocken, Pa, 4(8).
Bilgin, Ö. and Stewart, H. E. 2009. Design Guidelines for Polyethylene Pipe Interface Shear Resistance. Journal of Geotechnical and Geoenvironment Engineering, 135(6): 809–818.
Bilgin, Ö. and Stewart, H. E. 2009. Pullout Resistance Characteristics of Cast Iron Pipe. Journal of Transportation Engineering, ASCE, October 135: 730–735.
Coe, J.A., Ellis, W.L., Godt, J.W., savage, W.Z., Savage, J.E., Michael, J.A., Kibler, J.D., Powers, P.S., Lidke D.J. and Debray, S. 2003. Seasonal movement of the Slumgullion landslide determined from Global Positioning System surveys and field instrumentation. July 1998-march 2002, Engineering Geology, 68(1-2): 67-101.
Cruden, D.M. and Varnes, D.J. 1996. Landslide types and processes. Landslides – Investigations and mitigation. Turner, A.K., and Schuster, R.L. eds., Transportation Research Board, Special Report 247, 36-75.
DeJong, J. T. and Westgate, Z. J. 2005. Role of overconsolidation on sand-geomembrane interface response and material damage evolution. Geotextile Geomembrane, 23: 486–512.
Dove, J. E., Bents, D. D., Wang, J. and Gao, B. 2006. Particle-scale surface interactions of non-dilative interface systems. Geotextile Geomembrane, 24: 156–168.
Dove, J. E. and Frost, J. D. 1999. Peak friction behavior of smooth geomembrane-particle interfaces. Journal of Geotechnical and Geoenvironmental Engineering, 125(7): 544–555.
Kalaugher, P.G., Hodgson, R.L.P. and Grainger, P. 2000. Pre-failure strains as precursors of sliding in a coastal mudslide. Quarterly Journal of Engineering Geology and Hydrogeology, 33: 325-334.
Karimian, A.H. 2006. Response of buried steel pipelines subjected to longitudinal and transverse ground movement. PhD thesis, Department of Civil Engineering, University of British Columbia, Vancouver, B.C.
EMM078-10
Keefer, D.K., and Johnson, A.M. 1983. Earth flows-Morphology, mobilization and movement. U.S. Geological Survey Professional Paper, 1264: 56.
Liu, R., Guo, L., Yan, S. and Xu, Y. 2011. Studies on Soil Resistance to Pipelines Buried in Sand, May, doi:org/10.4028.
Mohitpour, M., Murray, A., McManus, M. and Colquhoun, I. 2010. Pipeline Integrity Assurance – A Practical Approach. 2nd ed., ASME Press, Three Park Avenue, New York, NY 10016, USA.
Muntakim, A.H., Dhar, A. S. and Rahman, M. 2017. Pipeline behaviour subjected to large ground movement. 70th Canadian Geotechnical Conference, GEOOTTAWA 2017, Oct. 1-4, Ottawa, ON.
Murugathasan, P., Dhar, A. S. and Hawlader, B. C. 2018. A laboratory facility for studying pullout behaviour
of buried pipelines. 71st Canadian Geotechnical Conference, GeoEdmonton2018, September 23-26,
Edmonton, Alberta.
Paulin, M. J., Phillips, R. and Clark. J. I. 1998. A full-scale investigation into pipeline/soil interaction. International Pipeline Conference, ASME, Volume II.
Petley, D.N. 2004. The evolution of slope failures – Mechanisms of rupture propagation. Natural Hazards and Earth System Sciences, 4: 147-152.
Phillips, P., Nobahar, A. and Zhou, J. 2004. Combined Axial and Lateral Pipe-Soil Interaction Relationship. Proceedings IPC2004, International Pipeline Conference, Alberta, Canada.
Picarelli, L. and Russo, C. 2004. Remarks on the mechanics of slow active landslides and the interaction with man-made works, in Lacerda, W.A. Proceedings of the 9th International Symposium on Landslides, London, A.A. Balkema Publishers, 2: 1141-1176.
Saha, R. C., Dhar, A. S., Muntakim., A. H. and Hawlader, B. C. 2019. Strength and deformation behaviour of a local sand. General Conference, CSCE, June 12-15 , Laval (Greater Montreal), QC, Canada.
Sheil, B. B. Ã., Martin, C. M. Ã., Byrne, B. W. Ã., Plant, M., Williams, K. and Coyne, D. 2016. Full-scale laboratory testing of a buried pipeline in sand subjected to cyclic axial displacements. Geotechnique, https://doi.org/10.1680/jgeot.16.P.275.
Stewart, H. E., Bilgin, O., O’Rourke, T.D. and Keeney, T. M. 1999. Technical reference for improved design and construction to account for thermal loads in plastic gas pipelines. Technical report, Cornell University, Ithaca, NY.
Varnes, D.J. 1978. Slope movement types and processes, Landslides Analysis and Control. Special Report 176, Transportation Research Board, National Academy of Sciences, p. 11-33.
Weerasekara, L. and Wijewickreme, D. 2008. Mobilization of soil loads on buried, polyethylene natural gas pipelines subject to relative axial displacements. Canadian Geotechnical Journal, 45: 1237–1249, doi:org/10.1139/T08-043.
Wijewickreme, D., Karimian, H. and Honegger, D. 2009. Response of buried steel pipelines subjected to relative axial soil movement. Canadian Geotechnical Journal, 46: 735– 752, doi:org/10.1139/T09-019.