COMPDYN 2011 III ECCOMAS Thematic Conference on Computational Methods in Structural Dynamics and Earthquake Engineering M. Papadrakakis, M. Fragiadakis, V. Plevris (eds.) Corfu, Greece, 26–28 May 2011 FULL-SCALE SHAKE TABLE EXPERIMENTS AND VIBRATION TESTS FOR ASSESSING THE EFFECTIVENESS OF TEXTILE MATERIALS FOR RETROFITTING MASONRY BUILDINGS Paul Michelis 1 , Costas Papadimitriou 2 , Grigoris K. Karaiskos 2 , and Dimitra-Christina P. Papadioti 2 1 Institute of Mechanics of Material & Geostructures S.A. 22 Askiton str., Penteli , 152 36, Greece e-mail: [email protected]2 University of Thessaly, Department of Mechanical Engineering Volos 38334, Greece e-mail: {costasp, gkaraiskos, dxpapadioti}@uth.gr Keywords: Masonry structures, FRP reinforcement, Shake table tests, Structural identifica- tion, Damage assessment. Abstract. Full-scale shake table seismic experiments and low amplitude vibration tests on a masonry building are carried out to assess its seismic performance as well as study the effec- tiveness of a new textile material for retrofitting masonry structures against earthquakes. The un-reinforced and the retrofitted with glass fiber reinforced polymer (GFRP) strips masonry buildings were subjected to a series of earthquake excitations of increasing magnitude in or- der to progressively induce various small, moderate and severe levels of damage to the ma- sonry walls. The performance of the original and retrofitted building states is evaluated. Changes in the dynamic characteristics (lowest four modal frequencies and damping ratios) of the building are used to assess and quantify the damage states of the masonry walls. For this, the dynamic modal characteristics of the structure states after each earthquake event were estimated by performing low-amplitude impulse hammer and sine-sweep forced vibra- tion tests. The retrofitting actions restored the stiffness characteristics of the reinforced ma- sonry structure to the levels of the original undamaged un-reinforced structure. The results show that the despite a similar dynamic behavior identified, corresponding to reduction of the modal frequencies, the un-reinforced masonry building was severely damaged, while the rein- forced masonry building was able to withstand, without visual damage, the induced strong seismic excitations. The GFRP textile material, optimally wrapped along the masonry walls following existing guidelines, was proven to be very effective in reinforcing the masonry building to withstand earthquake events significantly larger in magnitude than the ones caused severe damage to the un-reinforced building.
Transcript
COMPDYN 2011 III ECCOMAS Thematic Conference on
Computational Methods in Structural Dynamics and Earthquake Engineering M. Papadrakakis, M. Fragiadakis, V. Plevris (eds.)
Corfu, Greece, 26–28 May 2011
FULL-SCALE SHAKE TABLE EXPERIMENTS AND VIBRATION TESTS FOR ASSESSING THE EFFECTIVENESS OF TEXTILE MATERIALS FOR RETROFITTING MASONRY BUILDINGS
Paul Michelis1, Costas Papadimitriou2, Grigoris K. Karaiskos2, and Dimitra-Christina P. Papadioti2
1Institute of Mechanics of Material & Geostructures S.A. 22 Askiton str., Penteli , 152 36, Greece
Abstract. Full-scale shake table seismic experiments and low amplitude vibration tests on a masonry building are carried out to assess its seismic performance as well as study the effec-tiveness of a new textile material for retrofitting masonry structures against earthquakes. The un-reinforced and the retrofitted with glass fiber reinforced polymer (GFRP) strips masonry buildings were subjected to a series of earthquake excitations of increasing magnitude in or-der to progressively induce various small, moderate and severe levels of damage to the ma-sonry walls. The performance of the original and retrofitted building states is evaluated. Changes in the dynamic characteristics (lowest four modal frequencies and damping ratios) of the building are used to assess and quantify the damage states of the masonry walls. For this, the dynamic modal characteristics of the structure states after each earthquake event were estimated by performing low-amplitude impulse hammer and sine-sweep forced vibra-tion tests. The retrofitting actions restored the stiffness characteristics of the reinforced ma-sonry structure to the levels of the original undamaged un-reinforced structure. The results show that the despite a similar dynamic behavior identified, corresponding to reduction of the modal frequencies, the un-reinforced masonry building was severely damaged, while the rein-forced masonry building was able to withstand, without visual damage, the induced strong seismic excitations. The GFRP textile material, optimally wrapped along the masonry walls following existing guidelines, was proven to be very effective in reinforcing the masonry building to withstand earthquake events significantly larger in magnitude than the ones caused severe damage to the un-reinforced building.
Paul Michelis, Costas Papadimitriou, Grigoris K. Karaiskos and Dimitra-Christina P. Papadioti
1 INTRODUCTION
A large number of masonry structures exist in high seismicity regions throughout the world. Most masonry structures have been designed without following design procedures rec-ommended by modern seismic codes. Such structures are vulnerable to damage and collapse due to moderate and large earthquakes. Un-reinforced brick masonry buildings perform poorly under (lateral) seismic forces, failing in out-of-plane bending, in-plan bending and shear. Although being the most widely used type of construction in the world it is not capable of dissipating energy through inelastic deformation. They are designed to resist primarily gravity and wind loads. Retrofitting techniques provide the means of stiffening and strength-ening these structures to withstand earthquakes. Several retrofitting strategies have been pro-posed in the past. A large number of tests on the components of the masonry structures have been also performed to study the effectiveness of the retrofitting on the component level. Among the retrofitting techniques, repair technologies based on fiber-reinforced polymer (FRP) are effective and practical alternatives for stiffening and strengthening masonry build-ing. Tests on complete masonry structures also have been performed on shake tables and the performance of masonry structures has been evaluated under the action of earthquakes. These tests have provided valuable information on the seismic performance of full scale masonry buildings or the components of the masonry.
A major problem in classical reinforced textile structure is their low working capacity due to missing dissipative plastic deformation capacity. In a large number of recent publications [1-17] on masonry reinforcement by fiber reinforced plastics, it is reported that masonry fails in a brittle manner with the load capacity dropping substantially and suddenly. This is in agreement with the field observations of specialized engineers working in high seismicity re-gions. Premature bonding of FRP occurs due to high concentration of interface shear stresses and normal peeling stress in the vicinity of the reinforcement. The brittle mode of failure is reflected in the low strains at failure and therefore in a minimum energy absorption. In addi-tion, the mode of deformation, including the crack pattern, depends on the wall boundary conditions and reaction zones, which were not real in most of the cases examined in the Labo-ratory. These observations are particularly valid for dynamic (cyclic) loading, in-plane and out-of-plane, developing during earthquakes. At the same time reinforcement by FRP (mainly externally bonded carbon or glass fiber reinforced polymer) increases substantially the ma-sonry load capacity, the static bending capability and the overall stiffness. This could be sepa-rated into two components: the nonlinear one representing the stiffness contribution of the masonry materials and a rather linear part representing the stiffness contribution of the fibre reinforcement.
Experimental and field data should be assessed to improve the masonry wall reinforcement design in order to increase the overall stiffness, strength and ductility (energy absorption ca-pability) under real boundary conditions that prevail on full scale structures. The aim is to op-timize strength and deformability in a synergistic interaction in order the reinforcement to become an integral structural part. The reinforcement design should ensure, through strength-ening and deformability, that highly stressed zones are not developing in the reinforced ma-sonry and also in the surrounding un-reinforced masonry and that the building will resist: out-of-plane bending, in-plane bending, in-plane shear, combined with axial load.
The objective of this study is twofold. The first objective is to experimentally investigate the seismic performance of full-scale, single room, un-reinforced masonry buildings and to validate the effectiveness of glass FRP strips as retrofitting techniques in an effort to improve the masonry wall stiffness, strength and ductility to withstand earthquakes. The second objec-tive is to investigate and monitor the health of the structure through low amplitude dynamic
2
Paul Michelis, Costas Papadimitriou, Grigoris K. Karaiskos and Dimitra-Christina P. Papadioti
testing and correlate the change in the dynamic characteristics of the structure to the intensity of ground shaking, the damages observed and the retrofitting actions carried using repair techniques and strengthening with glass fiber reinforced polymer (GFRP) material bands. The change of the dynamic characteristics, such as modal (resonant) frequencies and modal damp-ing ratios, with damage and strengthening actions on the building are useful damage or strengthening index indicators. These indicators can be used for evaluating the degree of dam-age induced under seismic actions and the level of retrofitting steps required in order to re-store the stiffness of the structure.
A series of shake table tests followed by low amplitude vibration tests were performed on a masonry building at its un-reinforced and reinforced configurations. The masonry building was designed in full scale to resemble typical brick masonry building types, encountered in countryside. The un-reinforced masonry building was subjected to a series of progressively intensified earthquakes until it was severely damaged, evident by the large crack openings in the four walls of the building. Then it was repaired, strengthened with GFRP strips until its original stiffness is recovered and re-tested with a similar second series of progressively in-tensified earthquakes to evaluate the effectiveness of the reinforcement. A new multifunc-tional GFRP textile material, developed under the European research project POLYTECT [18], is considered as retrofitting solution for un-reinforced masonry structures. Appropriate damage indices based on the observed evolution of the modal frequencies are introduced to monitor the health of the masonry structure and evaluate the effectiveness of retrofitting ac-tions. Three different building and reinforcement configurations have been studied. The pre-sent study reports results from the third building and reinforcement configuration which was optimally designed based on existing guidelines and the experience from the tests on the first two masonry structures. The full-scale experimental tests are aimed to improve design retro-fitting guidelines for masonry structures, taking into account realistic boundary conditions at the sides of the masonry walls, wall continuity at the corners and wall openings from win-dows and doors.
This study is organized as follows. Section 2 introduces the masonry building, the geomet-rical characteristics, the material properties identified from component tests, and the finite element model based on simplified assumptions on composite brick-mortal wall behavior. De-tails for the shake table facility and the building instrumentation are provided in Section 3. Section 4 presents the experimental set-up, giving details about the series of seismic experi-ments performed on the un-reinforced and the reinforced building along with the observed damages during the tests. Section 5 concentrates on the post-earthquake low-amplitude vibra-tion tests performed to trace the modal characteristics of the masonry structure under the pro-gressively intensified seismic events and retrofitting actions. It presents and discusses results for the correlation of the identified resonant frequencies and damping ratios with intensity of seismic excitation and stiffness degradations due to damage caused from the applied seismic events or stiffness restoration resulted from strengthening actions. Conclusions are summa-rized in Section 6. 2 DESCRIPTION OF MASONRY BUILDING AND MODELING
2.1 Building description with geometry
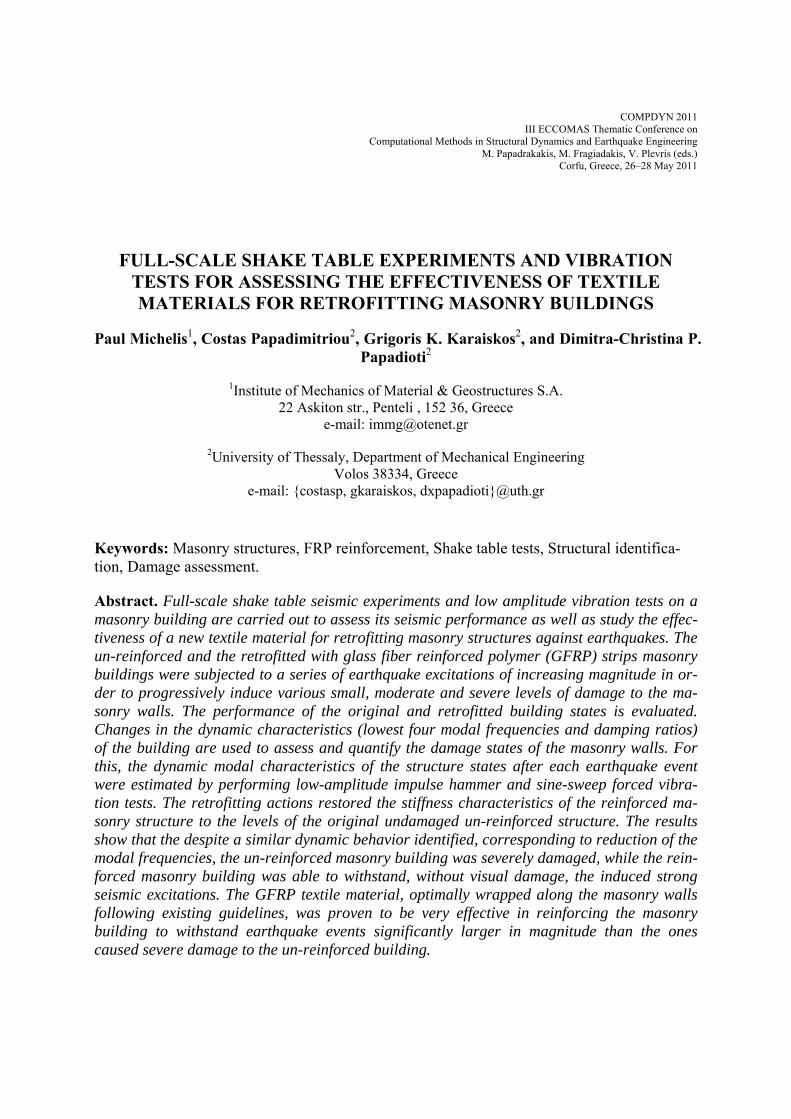
A full-scale single-story (one-room) brick-masonry building is designed and constructed in the laboratory. The un-reinforced brick building is representative of existing masonry buildings in Greece, particularly in the countryside. A picture of the intact building resting on the shake table is shown in Figure 1. The geometry of the masonry structure is shown in Fig-ure 2. The masonry structure consists of four single masonry brick walls with two opposite
3
Paul Michelis, Costas Papadimitriou, Grigoris K. Karaiskos and Dimitra-Christina P. Papadioti
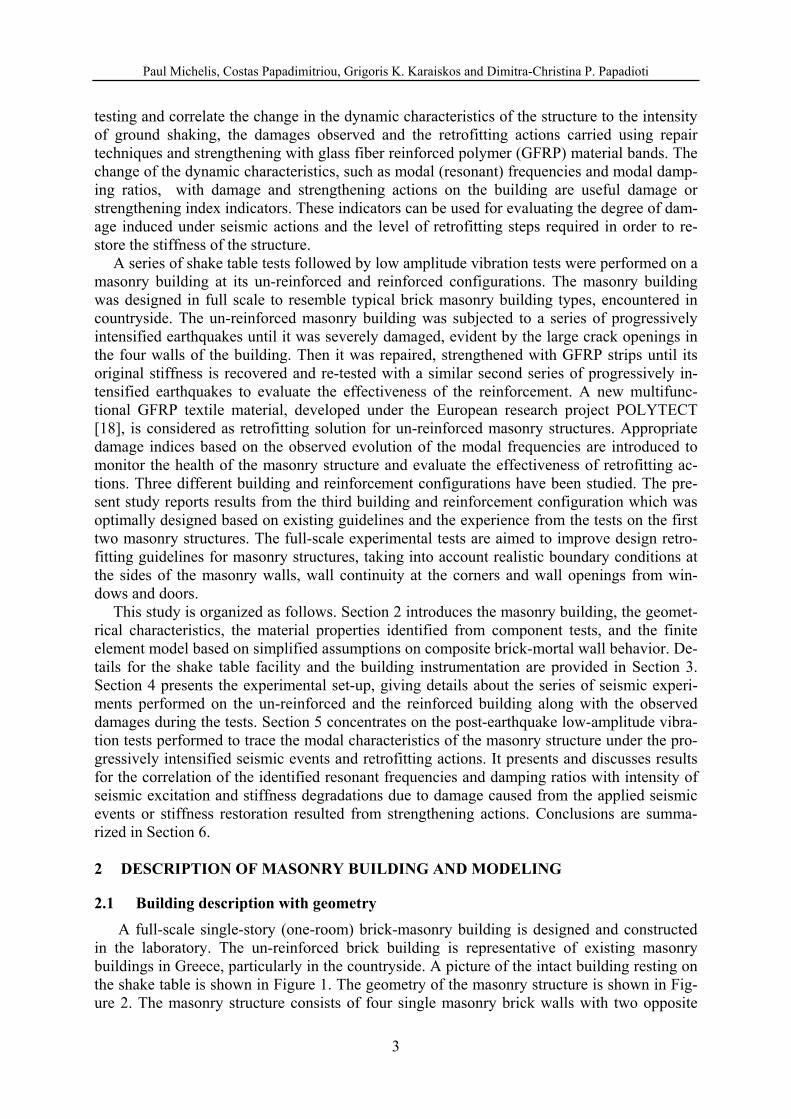
doors and windows, and a reinforced concrete roof. The four walls of the masonry building are anchored on the shake table. The top view dimensions are 3.19m parallel to the X-axis and 2.78m parallel to the Y-axis. The structure height is 2.26m (including 10 cm concrete roof thickness). The door’s width and height is 0.70m and 1.64m, respectively and it is placed on the center of the two opposite wall’s width. The window’s width and height is 0.70m and 0.70m, respectively and it is placed on the center of the two opposite wall’s width. The layout of the door and window openings results in a symmetric building, avoiding eccentricities as much as possible. All the surrounding walls are 8.5 cm thick, determined by the width dimen-sion of the bricks.
Figure 1: A picture of the intact masonry building.
2.2 Building materials and component tests
The construction of the masonry wall panels was based on common practices in Greece. The bricks used were common bricks used for the construction of masonry structures. The building brick is a rectangular, hollow multicored, clay prism of long dimension 187mm (par-allel to the holes), height 112mm (perpendicular to the holes and along the vertical direction) and width 85mm (perpendicular to the holes and along the horizontal direction), weighting about 1.70 Kg.
Components tests were conducted separately on bricks, mortal and brick-mortal assemblies in order to understand their mechanical behavior and obtain their mechanical properties. These tests were performed using the mechanical testing equipment available on the Institute of Mechanics of Materials and Geostructures (IMMG). The tests included compression tests along directions parallel and perpendicular to the brick holes, as well as shear tests. In particu-lar, based on the tests carried out on brick-mortal assemblies, consisted of a small number of building bricks bonded by mortal, the constitutive parameters in compression, tension and shear of the brick-mortar panels were experimentally measured. Compression tests on panels with the loading direction parallel to the brick holes confirmed higher peak strength values (nominal value of 4 MPa at 0.4% strain) but lower stiffness in comparison with loading of bricks normal to the holes where a nominal peak strength value of 3 MPa at 0.17% strain was measured. The mortal joint shear strength was found to be 0.7 to 0.75 MPa. Each compression tests was repeated for several speciment and a significant variation in the stiffness was ob-
4
Paul Michelis, Costas Papadimitriou, Grigoris K. Karaiskos and Dimitra-Christina P. Papadioti
served. For example, the stiffness for the compression test with loading of bricks normal to the holes varied from 2.3 to 3.5 GPa. Similar ranges of variations were observed for the com-pression tests with loading parallel to the brick holes.
Figure 2: Geometric of masonry building.
2.3 Finite element model of the masonry building
A detailed finite element model of the masonry building at its undamaged un-reinforced state was created based on the geometric details and the material properties of the reinforced con-crete roof and the masonry walls. The structure was designed in the COMSOL Multiphysics [19] finite element modelling environment. The finite element model for the structure was created using three-dimensional tetrahedral solid finite elements to model the whole structure. The elements along the basement are fixed in the direction of motion and the same applies for those linking the four walls and the concrete roof. The nominal values of the mechanical properties of the brick-mortal components and the reinforced concrete roof are used to con-struct a nominal linear finite element model of the masonry structure from the behavior of its components. Based on existing mechanical tests and the low strain levels expected to be ex-perienced by the reinforced concrete roof during low-amplitude vibration tests, the roof was assumed to be homogeneous isotropic with material properties as follows: elasticity modulus
30 GPa, Poisson ratio n 0.2 and density 2500 Kg/m3. A homogeneous orthotropic
material was assumed for the masonry walls to roughly account for the periodic structure of the brick-mortal elements. Based on the experimentally obtained stress-strain relationships,
E = = r =
5
Paul Michelis, Costas Papadimitriou, Grigoris K. Karaiskos and Dimitra-Christina P. Papadioti
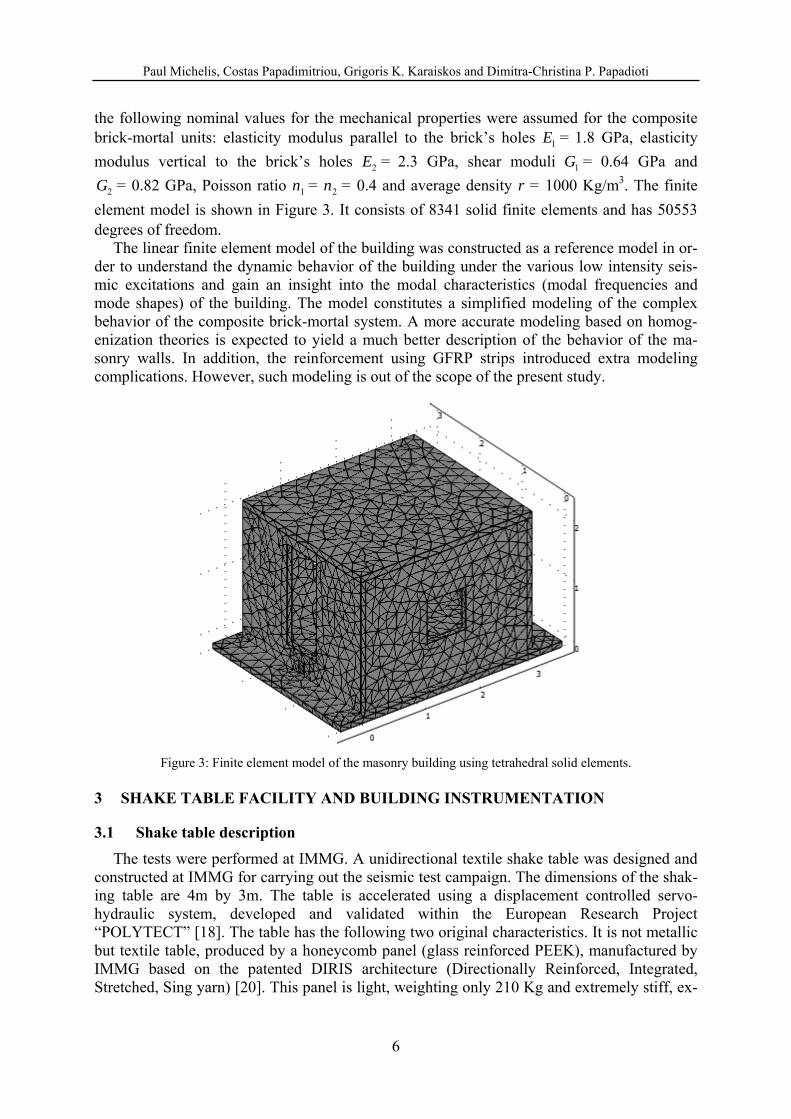
the following nominal values for the mechanical properties were assumed for the composite brick-mortal units: elasticity modulus parallel to the brick’s holes 1.8 GPa, elasticity
modulus vertical to the brick’s holes 2.3 GPa, shear moduli 0.64 GPa and
0.82 GPa, Poisson ratio 0.4 and average density r 1000 Kg/m3. The finite
element model is shown in Figure 3. It consists of 8341 solid finite elements and has 50553 degrees of freedom.
1E =
1G2E = =
2G = 1 2n n= = =
The linear finite element model of the building was constructed as a reference model in or-der to understand the dynamic behavior of the building under the various low intensity seis-mic excitations and gain an insight into the modal characteristics (modal frequencies and mode shapes) of the building. The model constitutes a simplified modeling of the complex behavior of the composite brick-mortal system. A more accurate modeling based on homog-enization theories is expected to yield a much better description of the behavior of the ma-sonry walls. In addition, the reinforcement using GFRP strips introduced extra modeling complications. However, such modeling is out of the scope of the present study.
Figure 3: Finite element model of the masonry building using tetrahedral solid elements. 3 SHAKE TABLE FACILITY AND BUILDING INSTRUMENTATION
3.1 Shake table description
The tests were performed at IMMG. A unidirectional textile shake table was designed and constructed at IMMG for carrying out the seismic test campaign. The dimensions of the shak-ing table are 4m by 3m. The table is accelerated using a displacement controlled servo-hydraulic system, developed and validated within the European Research Project “POLYTECT” [18]. The table has the following two original characteristics. It is not metallic but textile table, produced by a honeycomb panel (glass reinforced PEEK), manufactured by IMMG based on the patented DIRIS architecture (Directionally Reinforced, Integrated, Stretched, Sing yarn) [20]. This panel is light, weighting only 210 Kg and extremely stiff, ex-
6
Paul Michelis, Costas Papadimitriou, Grigoris K. Karaiskos and Dimitra-Christina P. Papadioti
hibiting the highest shear strength in in-plane and out-of-plane loading [21]. The actuation-control mechanism of the servofvalve is piezoelectric, reacting much faster and more pre-cisely than the ones available in the market. Exploiting the previous capabilities, the shaking table possesses the following characteristics. It is capable of sinusoidal, random, shock and arbitrary time history excitation, it has a maximum payload of 10 Ton, maximum displace-ment of ±120 mm, maximum acceleration of 4 g (with 10 Tons payload), and frequency limit of 100 Hz. The reaction-actuating unit of the shake table facility is shown in Figure 4. The previous technical characteristics classify the facility as one of the few operating in Europe but with one distinction: its very low cost of construction (<10% of the equivalent European facilities) and operation.
Figure 4: The reaction-actuating unit of the shake table facility (left) with a masonry structure (right).
3.2 Building instrumentation
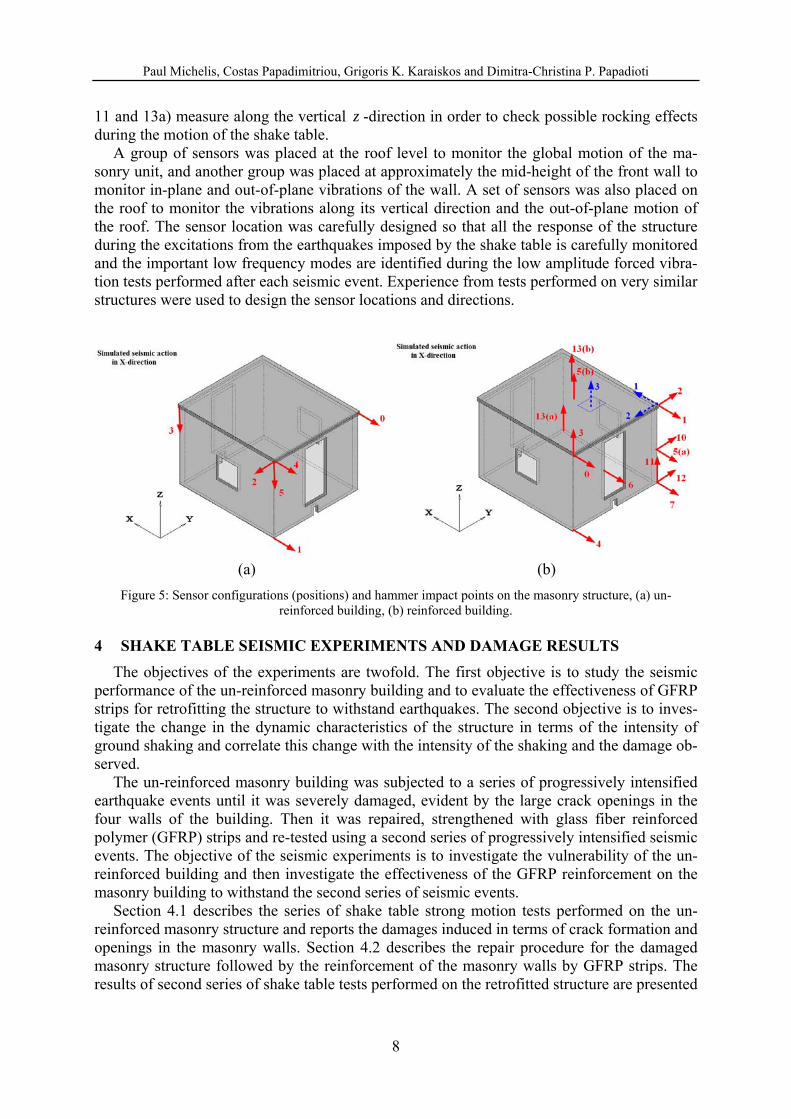
Αs many as twelve (12) uni-axial accelerometers, six (6) piezo beam and six (6) K-beam capacitive accelerometers, were mounted on the shake table and the structure in order to re-cord the severity of the seismic excitation and the vibration levels experienced by the struc-ture along all three directions, as well as to identify the structural modal characteristics from low amplitude vibration tests. The sensor locations along with the monitoring directions are shown in Figure 5. The sensor configurations depend on the series of the two tests conducted on the un-reinforced and reinforced masonry building. Only six (6) sensors were placed on the structure as shown in Figure 5(a) during the series of tests conducted for the un-reinforced masonry structure. Twelve (12) sensors were placed on the structure as shown in Figure 5(b) during the series of tests conducted for the reinforced masonry structure. For the reinforced structure, three different sensor configurations were employed based on the series of tests conducted and the experience gained from previous tests on similar reinforced masonry struc-tures.
In general, up to as many as five sensor locations on the base of the structure were acti-vated during the tests in order to monitor the acceleration of the shake table in all directions. Two of the acceleration positions (sensors 4 and 7) measure the horizontal base acceleration along the x -direction of the motion of the shake table. One sensor (sensor 12) measures along the horizontal y -direction perpendicular to the direction of motion and two sensors (sensors
7
Paul Michelis, Costas Papadimitriou, Grigoris K. Karaiskos and Dimitra-Christina P. Papadioti
11 and 13a) measure along the vertical z -direction in order to check possible rocking effects during the motion of the shake table.
A group of sensors was placed at the roof level to monitor the global motion of the ma-sonry unit, and another group was placed at approximately the mid-height of the front wall to monitor in-plane and out-of-plane vibrations of the wall. A set of sensors was also placed on the roof to monitor the vibrations along its vertical direction and the out-of-plane motion of the roof. The sensor location was carefully designed so that all the response of the structure during the excitations from the earthquakes imposed by the shake table is carefully monitored and the important low frequency modes are identified during the low amplitude forced vibra-tion tests performed after each seismic event. Experience from tests performed on very similar structures were used to design the sensor locations and directions.
(a) (b)
Figure 5: Sensor configurations (positions) and hammer impact points on the masonry structure, (a) un-reinforced building, (b) reinforced building.
4 SHAKE TABLE SEISMIC EXPERIMENTS AND DAMAGE RESULTS
The objectives of the experiments are twofold. The first objective is to study the seismic performance of the un-reinforced masonry building and to evaluate the effectiveness of GFRP strips for retrofitting the structure to withstand earthquakes. The second objective is to inves-tigate the change in the dynamic characteristics of the structure in terms of the intensity of ground shaking and correlate this change with the intensity of the shaking and the damage ob-served.
The un-reinforced masonry building was subjected to a series of progressively intensified earthquake events until it was severely damaged, evident by the large crack openings in the four walls of the building. Then it was repaired, strengthened with glass fiber reinforced polymer (GFRP) strips and re-tested using a second series of progressively intensified seismic events. The objective of the seismic experiments is to investigate the vulnerability of the un-reinforced building and then investigate the effectiveness of the GFRP reinforcement on the masonry building to withstand the second series of seismic events.
Section 4.1 describes the series of shake table strong motion tests performed on the un-reinforced masonry structure and reports the damages induced in terms of crack formation and openings in the masonry walls. Section 4.2 describes the repair procedure for the damaged masonry structure followed by the reinforcement of the masonry walls by GFRP strips. The results of second series of shake table tests performed on the retrofitted structure are presented
8
Paul Michelis, Costas Papadimitriou, Grigoris K. Karaiskos and Dimitra-Christina P. Papadioti
in Section 4.3. The correlation of damage with the dynamic characteristics of the masonry structure during the various excitation phases is presented in Section 5.
4.1 Shake table tests of the un-reinforced masonry building
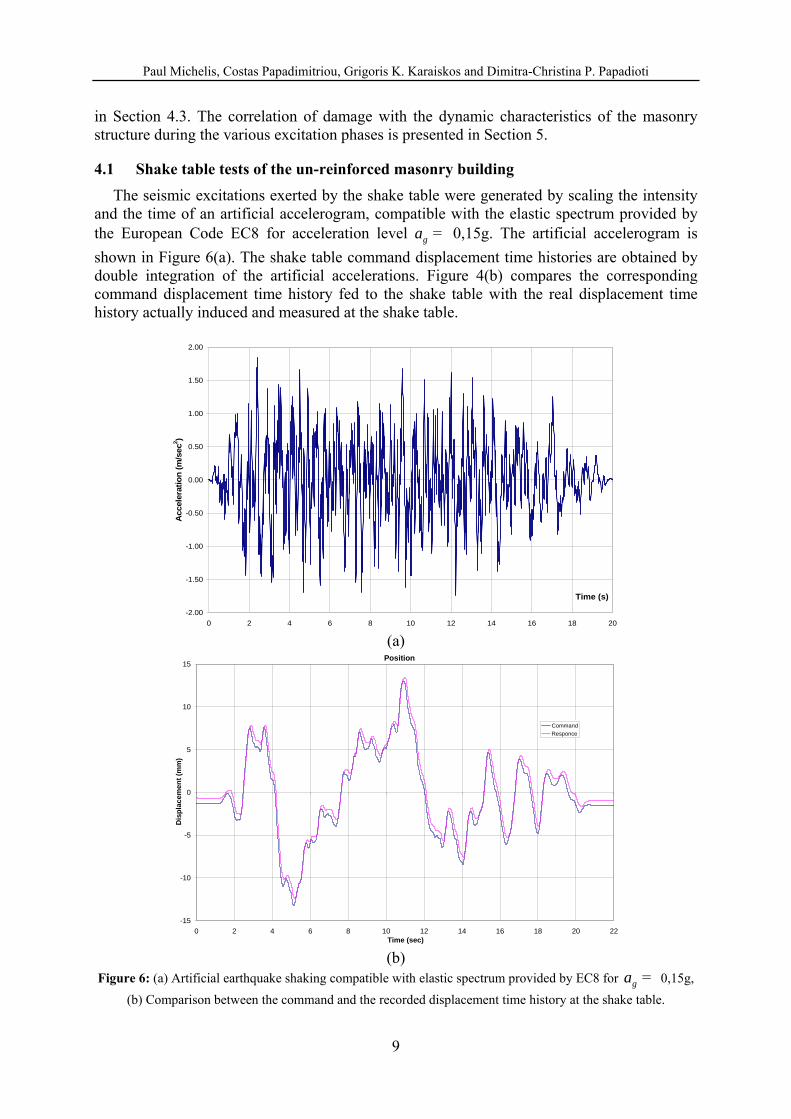
The seismic excitations exerted by the shake table were generated by scaling the intensity and the time of an artificial accelerogram, compatible with the elastic spectrum provided by the European Code EC8 for acceleration level 0,15g. The artificial accelerogram is
shown in Figure 6(a). The shake table command displacement time histories are obtained by double integration of the artificial accelerations. Figure 4(b) compares the corresponding command displacement time history fed to the shake table with the real displacement time history actually induced and measured at the shake table.
ga =
-2.00
-1.50
-1.00
-0.50
0.00
0.50
1.00
1.50
2.00
0 2 4 6 8 10 12 14 16 18 20
Time (s)
Acc
eler
atio
n (
m/s
ec2)
(a)
Position
-15
-10
-5
0
5
10
15
0 2 4 6 8 10 12 14 16 18 20 2Time (sec)
Dis
pla
cem
en
t (m
m)
2
Command
Responce
(b)
Figure 6: (a) Artificial earthquake shaking compatible with elastic spectrum provided by EC8 for 0,15g,
(b) Comparison between the command and the recorded displacement time history at the shake table. ga =
9
Paul Michelis, Costas Papadimitriou, Grigoris K. Karaiskos and Dimitra-Christina P. Papadioti
A series of six (6) seismic excitation events were conducted that correspond to various
peak ground acceleration (PGA) values selected to represent various levels of seismic inten-sity. These intensity levels were accomplished at the shake table by either scaling the intensity of the command displacement in the table, or scaling the time over which the earthquake was applied, or a combination of intensity and time scaling. Table 1 reports the information on the six seismic events, including the corresponding scale in intensity and time, and the actual PGA values recorded by the acceleration sensor placed on the shake table. In addition to the peak ground accelerations (PGA) along the direction of motion, the theoretical PGA values are also reported normalized so that they coincide with the measured PGA values for the un-scaled earthquake excitation. It can be seen that the acceleration at the base has exceeded 2.5g.
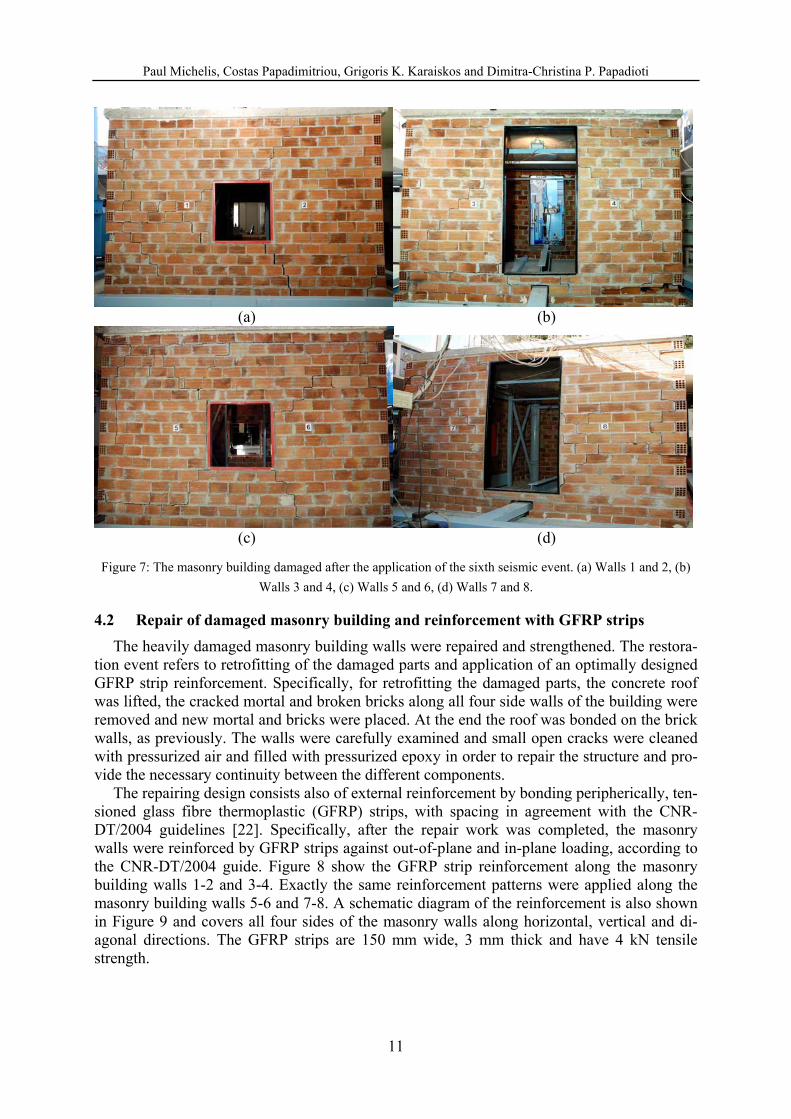
The un-reinforced masonry building sustained the first five seismic events without suffer-ing any serious visible damage. The last seismic event, which was theoretically intensified almost 8 times the original seismic event, heavily damaged the building with large crack openings developed along the walls and propagated mainly through the mortal. The four sides of the masonry building after the application of the sixth seismic event are shown in Figure 7. Based on visual inspection, the sixth seismic event generated shear failure of many bricks and mortar, diagonal cracking on the walls, extensive flexural faults and measurable shear sliding in the walls 1, 2, 5 and 6. Larger crack opening were observed on the two sides of the wall with the window openings that extend along the direction of motion. The other two sides of the building walls, with the door openings that extend along the perpendicular direction of motion, also sustained serious damage. All the walls were damaged but it seems that the in-plane shearing (walls 1-2 and 5-6) produced more damage than the out of plane loading (walls 3-4 and 7-8). Overall, during the action of the sixth seismic event, the masonry building sus-tained serious visual damage, with the walls loosing their structural integrity and posing in-creased threat to occupants due to high risk of collapse to future seismic excitations.
Table 1: Excitation characteristics of the seismic events applied on the un-reinforced building.
10
Paul Michelis, Costas Papadimitriou, Grigoris K. Karaiskos and Dimitra-Christina P. Papadioti
(a) (b)
(c) (d)
Figure 7: The masonry building damaged after the application of the sixth seismic event. (a) Walls 1 and 2, (b)
Walls 3 and 4, (c) Walls 5 and 6, (d) Walls 7 and 8.
4.2 Repair of damaged masonry building and reinforcement with GFRP strips
The heavily damaged masonry building walls were repaired and strengthened. The restora-tion event refers to retrofitting of the damaged parts and application of an optimally designed GFRP strip reinforcement. Specifically, for retrofitting the damaged parts, the concrete roof was lifted, the cracked mortal and broken bricks along all four side walls of the building were removed and new mortal and bricks were placed. At the end the roof was bonded on the brick walls, as previously. The walls were carefully examined and small open cracks were cleaned with pressurized air and filled with pressurized epoxy in order to repair the structure and pro-vide the necessary continuity between the different components.
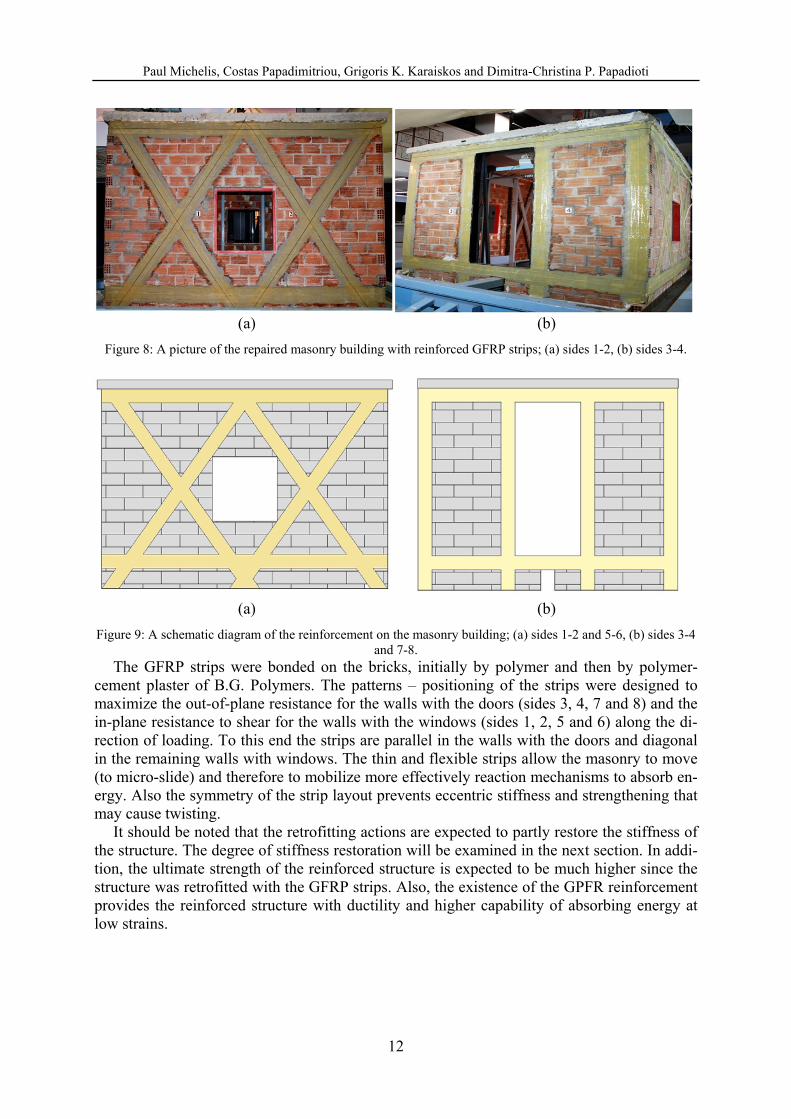
The repairing design consists also of external reinforcement by bonding peripherically, ten-sioned glass fibre thermoplastic (GFRP) strips, with spacing in agreement with the CNR-DT/2004 guidelines [22]. Specifically, after the repair work was completed, the masonry walls were reinforced by GFRP strips against out-of-plane and in-plane loading, according to the CNR-DT/2004 guide. Figure 8 show the GFRP strip reinforcement along the masonry building walls 1-2 and 3-4. Exactly the same reinforcement patterns were applied along the masonry building walls 5-6 and 7-8. A schematic diagram of the reinforcement is also shown in Figure 9 and covers all four sides of the masonry walls along horizontal, vertical and di-agonal directions. The GFRP strips are 150 mm wide, 3 mm thick and have 4 kN tensile strength.
11
Paul Michelis, Costas Papadimitriou, Grigoris K. Karaiskos and Dimitra-Christina P. Papadioti
(a) (b)
Figure 8: A picture of the repaired masonry building with reinforced GFRP strips; (a) sides 1-2, (b) sides 3-4.
(a) (b)
Figure 9: A schematic diagram of the reinforcement on the masonry building; (a) sides 1-2 and 5-6, (b) sides 3-4 and 7-8.
The GFRP strips were bonded on the bricks, initially by polymer and then by polymer-cement plaster of B.G. Polymers. The patterns – positioning of the strips were designed to maximize the out-of-plane resistance for the walls with the doors (sides 3, 4, 7 and 8) and the in-plane resistance to shear for the walls with the windows (sides 1, 2, 5 and 6) along the di-rection of loading. To this end the strips are parallel in the walls with the doors and diagonal in the remaining walls with windows. The thin and flexible strips allow the masonry to move (to micro-slide) and therefore to mobilize more effectively reaction mechanisms to absorb en-ergy. Also the symmetry of the strip layout prevents eccentric stiffness and strengthening that may cause twisting.
It should be noted that the retrofitting actions are expected to partly restore the stiffness of the structure. The degree of stiffness restoration will be examined in the next section. In addi-tion, the ultimate strength of the reinforced structure is expected to be much higher since the structure was retrofitted with the GFRP strips. Also, the existence of the GPFR reinforcement provides the reinforced structure with ductility and higher capability of absorbing energy at low strains.
12
Paul Michelis, Costas Papadimitriou, Grigoris K. Karaiskos and Dimitra-Christina P. Papadioti
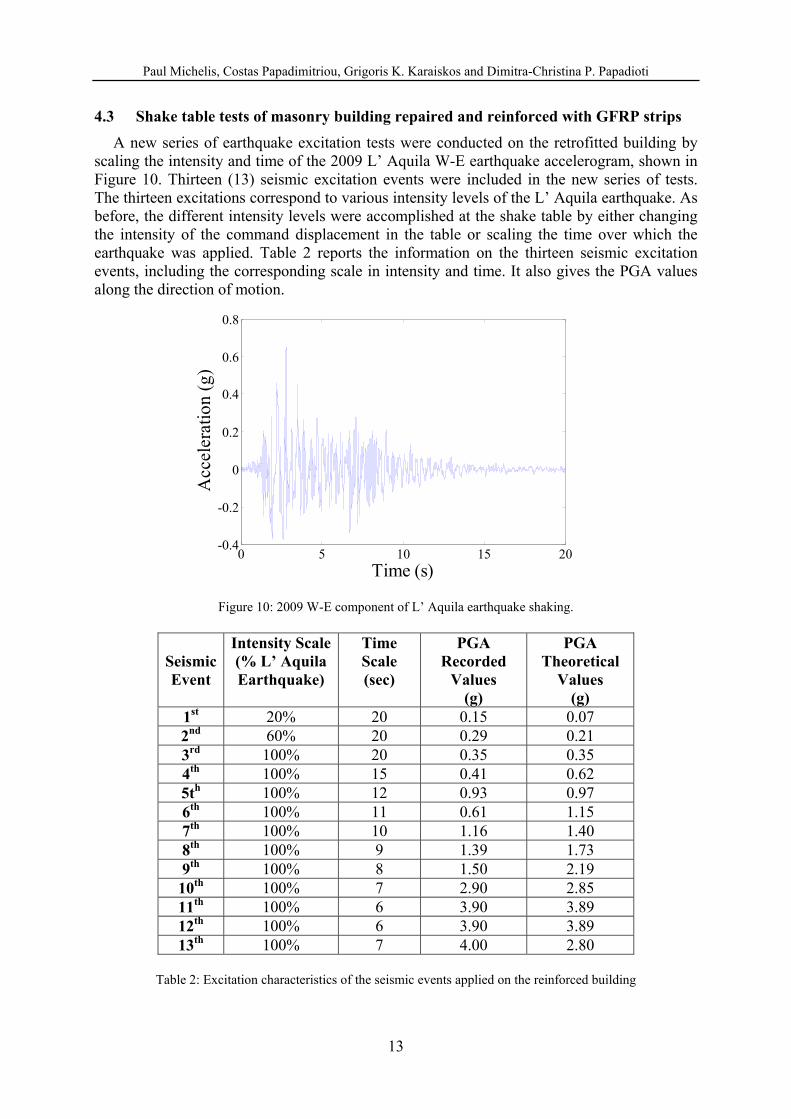
4.3 Shake table tests of masonry building repaired and reinforced with GFRP strips
A new series of earthquake excitation tests were conducted on the retrofitted building by scaling the intensity and time of the 2009 L’ Aquila W-E earthquake accelerogram, shown in Figure 10. Thirteen (13) seismic excitation events were included in the new series of tests. The thirteen excitations correspond to various intensity levels of the L’ Aquila earthquake. As before, the different intensity levels were accomplished at the shake table by either changing the intensity of the command displacement in the table or scaling the time over which the earthquake was applied. Table 2 reports the information on the thirteen seismic excitation events, including the corresponding scale in intensity and time. It also gives the PGA values along the direction of motion.
0 5 10 15 20-0.4
-0.2
0
0.2
0.4
0.6
0.8
Time (s)
Acc
eler
atio
n (g
)
Figure 10: 2009 W-E component of L’ Aquila earthquake shaking.
Table 2: Excitation characteristics of the seismic events applied on the reinforced building
13
Paul Michelis, Costas Papadimitriou, Grigoris K. Karaiskos and Dimitra-Christina P. Papadioti
In contrast to the severe damage observed for the un-reinforced building at the end of the sixth seismic event, no damage was observed in terms of visible cracks on the mortal, the bricks or the interfaces between them. The integrity of the masonry walls, seeing as a unit of bricks and mortal, and the integrity at the interface between the masonry walls and the table or the roof, was preserved. Comparing the characteristics of the two series of shake table seismic tests applied on the un-reinforced and reinforced building in Tables 1 and 2, respectively, it is obvious that in the case of the reinforced building, higher peak ground accelerations are re-corded. Specifically, the last earthquake applied on the reinforced building has a ground shak-ing with PGA almost two times the PGA of the base shaking for the sixth earthquake applied on the un-reinforced building. Despite this stronger shaking of the reinforced building, the reinforced masonry performed very well and withstood the very strong ground shaking with no visible damage. It can be concluded that the reinforcement was sufficient to maintain the structural integrity of the masonry walls. 5 DAMAGE EVALUATION BASED ON DYNAMIC CHARACTERISTICS
The health state of the structure after each shake table test was evaluated by monitoring the modal dynamic characteristics such as modal (resonant) frequencies and modal damping ra-tios. These characteristics were identified by carrying out very low-amplitude forced vibration tests after each seismic event. These low-amplitude vibration tests, described in Section 5.1, are used to measure the modal characteristics and correlate the evolution of these characteris-tics with the stiffness degradation and observed damage caused by the seismic events. The reduction of the lower modal frequencies of the masonry structure after the application of each earthquake event is used as a damage index [23] to provide an overall measure of the damage state of the masonry structure at its un-reinforced and reinforced configurations.
The low amplitude vibration tests were performed with a PCB086D20 impulse hammer equipped with a medium tip head in order to excite the important lower modes of the masonry structure needed for the evaluation of its dynamic characteristics, such as modal frequencies, modal damping ratios and mode shapes. The vibration tests were performed before the shak-ing table tests were initiated and immediately after each earthquake event was inflicted by the shaking table on the structure. The purpose of the impulse hammer tests was to identify the dynamic characteristics of the structure and mainly to trace the change in the modal frequen-cies and the damping ratios as a function of the severity of the seismic excitation and the ob-served damage.
After each earthquake event, a total of 6 impulse hammer tests were contacted. The impact force was inflicted along the two horizontal directions and one vertical direction in order to excite all lower important modes of the structure. The impact points and directions are shown in Figure 5(b) with blue (broken) arrows. Two independent tests per each excitation direction were performed. Each impulse hammer test lasted only a few seconds allowing to speed up considerably the whole procedure of acquiring data from the structure.
During the first four (4) seismic tests (1st, 2nd, 3rd, and 4th) the building was instrumented with 10 sensors (sensors 0, 1, 2, 3, 4, 5, 10, 11, 12 and 13 in Figure 5(b)). During the 5th, 6th and 7th seismic tests the building was instrumented with 12 sensors: sensors were added at positions 6 and 7 in Figure 5(b) and the sensors 5(a) and 13(a) in the set up shown in Figure 5(b) were re-positioned (at locations (5b) and 13(b) in Figure 5(b)) on the roof of the building as shown in Figure 5(c). This sensor relocation was necessary in order to monitor the z -direction and take more accurate measurements of the out-of-plane mode of the concrete roof
14
Paul Michelis, Costas Papadimitriou, Grigoris K. Karaiskos and Dimitra-Christina P. Papadioti
where strong motion was detected. During the final six (6) seismic events (8th to 13th events) the building was again instrumented with 12 sensors. The location of sensor 13(b) in sensor configuration shown in Figure 5(b) was changed to its original location 13(a).
To verify the reliability and accuracy of the dynamic characteristics obtained by analyzing the very low vibration results obtained from the impulse hammer tests, a sine sweep test cam-paign was also independently conducted using a eccentric mass shaker mounted at the top of the concrete roof. The roof shaker was used to excite the structure and compute the modal frequencies from the power spectral densities of the recorded acceleration signals. Complete frequency sweeps from 1 to 50 Hz with increasing step of 0.1 Hz were carried out. The low vibration levels that resulted from these tests were significantly higher than the vibration tests resulted from the impulse hammer tests. In contrast to the impulse hammer series of 6 tests lasting a couple of minutes after each earthquake event, each sine sweep test lasted a period of half an hour. Such experiments were performed only for the initial un-reinforced structure and yielded the same natural frequencies as the impulse hammer tests. Thus, it was not deemed necessary to perform these time-consuming sine sweep experiments for the reinforced ma-sonry structure.
1 2 3 4 5 6 R6
8
10
12
14
16
18
20
22
24
26
Seismic Event
Mod
al F
requ
ency
(H
z)
1st Mode1st Mode2nd Mode2nd Mode3rd Mode3rd Mode
1 2 3 4 5 6 7 8 9 10 11 12 136
8
10
12
14
16
18
20
22
24
26
Seismic Event
Mod
al F
requ
ency
(H
z)
1st Mode2nd Mode2nd Mode3rd Mode3rd Mode
(a) (b)
1 2 3 4 5 6 R26
28
30
32
34
36
38
40
42
44
Seismic Event
Mod
al F
requ
ency
(H
z)
4th Mode4th Mode
1 2 3 4 5 6 7 8 9 10 11 12 1326
28
30
32
34
36
38
40
42
44
Seismic Event
Mod
al F
requ
ency
(H
z)
4th Mode4th Mode
(c) (d)
Figure 11: Evolution of modal frequencies as a function of the seismic events (a,c) un-reinforced building, (b,d) reinforced building.
15
Paul Michelis, Costas Papadimitriou, Grigoris K. Karaiskos and Dimitra-Christina P. Papadioti
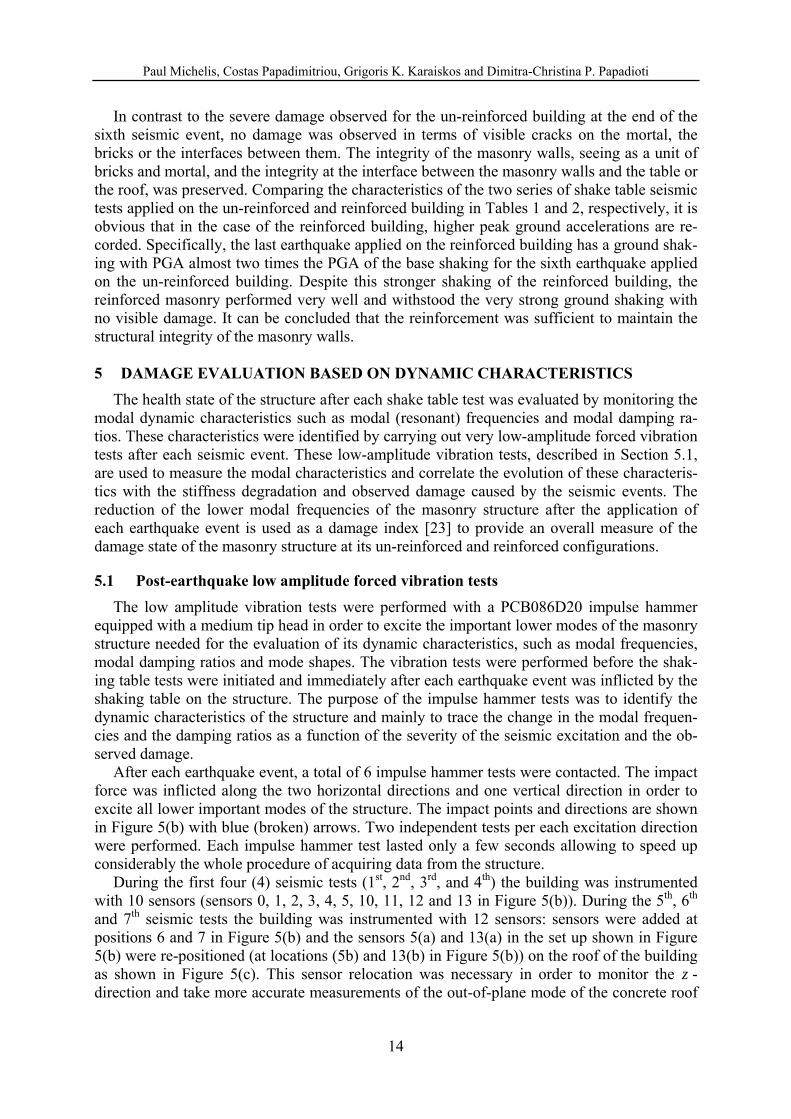
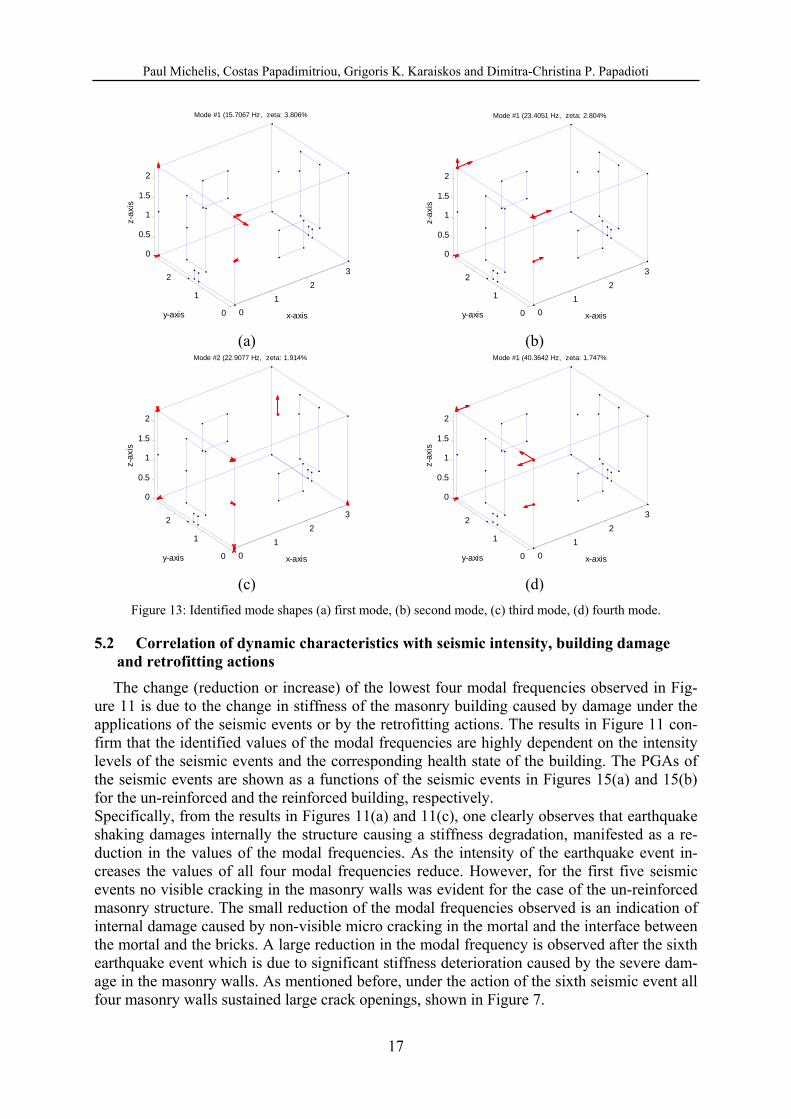
The recorded acceleration time histories and the impulse force for each test were used to obtain the frequency response functions and then the PolyMAX frequency domain method [24] was applied to identify the modal characteristics of the structure. For this, the modal identification, graphical user interface, toolbox MI-Tool developed in SDLab of the Univer-sity of Thessaly [25] was conveniently used to estimate the modes. The identified modal fre-quencies and modal damping ratios for the lowest four modes are reported in Figures 11 and 12 as a function of the seismic event for both the un-reinforced and the reinforced building. For each seismic event, more than one modal frequencies may be shown that results from the analysis of multiple vibration tests available. Representative mode shapes identified by the measurements are shown in Figure 13 and should be compared to the mode shapes in Figure 14 predicted by the nominal finite element model developed in Section 2.3. The length of the arrows in Figure 13 denotes the magnitude of each component of the mode shape along the measured DOF. It is clear that the first lowest mode in Figure 13(a) corresponds to the first shear mode in the horizontal y -direction perpendicular to the direction of the shake table mo-tion, the second lowest mode in Figure 13(b) corresponds to the first shear mode in the hori-zontal x directions which is along the direction of the shake table motion, the third mode in Figure 13(c) is dominated by the first bending mode (out-of-plane mode) of the concrete roof, while the fourth mode in Figure 13(d) corresponds to a torsional mode of the building that arise from the rotation of the roof with respect to the vertical -direction. z
1 2 3 4 5 6 R0
1
2
3
4
5
6
Seismic Event
Dam
ping
Rat
io (
%)
1st Mode1st Mode2nd Mode2nd Mode
1 2 3 4 5 6 7 8 9 10 11 12 130
1
2
3
4
5
6
Seismic Event
Dam
ping
Rat
io (
%)
1st Mode2nd Mode2nd Mode
(a) (b)
1 2 3 4 5 6 R0
1
2
3
4
5
6
Seismic Event
Dam
ping
Rat
io (
%)
3rd Mode3rd Mode4th Mode4th Mode
1 2 3 4 5 6 7 8 9 10 11 12 130
1
2
3
4
5
6
Seismic Event
Dam
ping
Rat
io (
%)
3rd Mode3rd Mode4th Mode4th Mode
(b) (d)
Figure 12: Evolution of modal damping ratios as a function of the seismic events (a,c) un-reinforced building, (b,d) reinforced building.
16
Paul Michelis, Costas Papadimitriou, Grigoris K. Karaiskos and Dimitra-Christina P. Papadioti
0
1
2
3
0
1
2
0
0.5
1
1.5
2
x-axis
Mode #1 (15.7067 Hz, zeta: 3.806%
y-axis
z-a
xis
0
1
2
3
0
1
2
0
0.5
1
1.5
2
x-axis
Mode #1 (23.4051 Hz, zeta: 2.804%
y-axis
z-a
xis
(a) (b)
0
1
2
3
0
1
2
0
0.5
1
1.5
2
x-axis
Mode #2 (22.9077 Hz, zeta: 1.914%
y-axis
z-a
xis
0
1
2
3
0
1
2
0
0.5
1
1.5
2
x-axis
Mode #1 (40.3642 Hz, zeta: 1.747%
y-axis
z-a
xis
(c) (d)
Figure 13: Identified mode shapes (a) first mode, (b) second mode, (c) third mode, (d) fourth mode.
5.2 Correlation of dynamic characteristics with seismic intensity, building damage and retrofitting actions
The change (reduction or increase) of the lowest four modal frequencies observed in Fig-ure 11 is due to the change in stiffness of the masonry building caused by damage under the applications of the seismic events or by the retrofitting actions. The results in Figure 11 con-firm that the identified values of the modal frequencies are highly dependent on the intensity levels of the seismic events and the corresponding health state of the building. The PGAs of the seismic events are shown as a functions of the seismic events in Figures 15(a) and 15(b) for the un-reinforced and the reinforced building, respectively. Specifically, from the results in Figures 11(a) and 11(c), one clearly observes that earthquake shaking damages internally the structure causing a stiffness degradation, manifested as a re-duction in the values of the modal frequencies. As the intensity of the earthquake event in-creases the values of all four modal frequencies reduce. However, for the first five seismic events no visible cracking in the masonry walls was evident for the case of the un-reinforced masonry structure. The small reduction of the modal frequencies observed is an indication of internal damage caused by non-visible micro cracking in the mortal and the interface between the mortal and the bricks. A large reduction in the modal frequency is observed after the sixth earthquake event which is due to significant stiffness deterioration caused by the severe dam-age in the masonry walls. As mentioned before, under the action of the sixth seismic event all four masonry walls sustained large crack openings, shown in Figure 7.
17
Paul Michelis, Costas Papadimitriou, Grigoris K. Karaiskos and Dimitra-Christina P. Papadioti
(a) (b)
(c) (d)
Figure 14: Model predicted mode shapes (a) first mode, (b) second mode, (c) third mode, (d) fourth mode.
1 2 3 4 5 60
0.5
1
1.5
2
2.5
3
3.5
4
Seismic Event
PGA
Ground Sensors
1 2 3 4 5 6 7 8 9 10 11 12 130
0.5
1
1.5
2
2.5
3
3.5
4
Seismic Event
PGA
Ground Sensors
(a) (b)
Figure 15: Evolution of PGA as a function of the seismic events (a) un-reinforced building, (b) reinforced build-ing.
18
Paul Michelis, Costas Papadimitriou, Grigoris K. Karaiskos and Dimitra-Christina P. Papadioti
After the building was repaired and reinforced with the GFRP strips, the identified modal frequencies of the retrofitted structure shown as the reinforcement event “R” in Figures 11(a) and 11(c) have increased substantially to almost the initial values of the modal frequencies of the un-reinforced building at its original un-damaged state. Thus the strengthening resulted in recovering the original stiffness levels of the un-reinforced building.
Based on the results obtained in Figures 11(b) and 11(d) for the re-tested reinforced ma-sonry building, a similar reduction in the modal frequency values is observed as the intensity of the seismic events increases. The first ten seismic events reduced slightly the modal fre-quencies, while the last three strong seismic events reduced the modal frequencies considera-bly. However, no visible cracking in the reinforced masonry walls was evident for all earthquake tests for the case of reinforced masonry structure. The reduction in modal frequen-cies is again due to stiffness degradation and it is an indication of internal damage caused by micro cracking in the mortal and the interface between the mortal and the bricks. Such reduc-tion was also observed for the first five seismic events for the un-reinforced building and it seems to indicate that the same damage mechanism was triggered even for the reinforced structure. This is consistent with similar results observed in [26].
The aforementioned results provide clear evidence that the changes in modal frequency are correlated with (a) stiffness degradation in the structure caused by damage after a seismic event, or (b) stiffness improvement caused by the retrofitting and strengthening actions using GFRP strips. This evolution (reduction or increase) of the modal frequencies can be used as a damage or strengthening index indicator. In addition, the availability of the modal frequency values of the undamaged building is useful for stiffness restoration of the damaged building using repair and strengthening actions. When the modal frequencies of a building are avail-able using vibration measurements before a damaging event, then the restoration steps for a damaged building can be continued up to the level where the modal frequencies of the retro-fitted structure reach (or even exceed) the original values of the undamaged building. This is a safe, validated procedure confirming that the initial stiffness of the structure is restored. How-ever, if the modal frequencies of the undamaged building are not known and the building is damaged after an earthquake, the level of repairing cannot be defined with sufficient precision. Numerically predicted modal frequencies of the undamaged building based only on simplified finite element models for masonry walls, provide only qualitative information and not accu-rate quantitative information about the actual dynamic characteristic of the building. To pro-vide a more accurate quantitative prediction of the building dynamic properties, numerical models should be developed that properly take into account the highly complex composite nature of the masonry walls and the boundary conditions resulting from the presence of win-dow and door openings, the connections of the walls at the corners as well as the connections of the walls with the table and the roof.
Based on the results in Figure 12, the damping ratios of the lowest four modes at low vi-bration levels under which the post-earthquake vibration tests were conducted range from 1% to 6%. The damping ratio values for the lowest three modes of the un-reinforced building tend to increase with the intensity of the seismic event. This indicates that damage causes the damping ratios of the structure to increase in general. The overall increase of damping ratios with damage is consistent with results reported for other structures. However, a certain in-creasing tendency is not clear for the reinforced building. The use of the evolution of the damping ratio values as a damage index indicator is not suitable partly due to the fact that the fluctuation in the estimates of the modal damping ratios from repeated vibration tests using experimental modal analysis techniques is relatively high and this fluctuation may mask the real correlation that may exist between the modal damping ratios and the damage or strength-ening actions on the structure.
19
Paul Michelis, Costas Papadimitriou, Grigoris K. Karaiskos and Dimitra-Christina P. Papadioti
Concluding, progressively increasing the intensity of the seismic event has an effect on the stiffness of the un-reinforced and reinforced structure as it is observed by the reduction in the modal frequencies. The un-reinforced brittle masonry walls sustained/suffered severe damage, losing structural integrity and posing increasing threat to occupants. The GFRP strips, how-ever, maintained the integrity of the structure, causing no visible damage. GFRP strips are considered as one of the promising retrofitting strategies for protections of seismically excited masonry structures. 6 CONCLUSIONS
A series of progressively intensified shake table seismic vibration tests were performed on an un-reinforced and a reinforced and re-tested full-scale masonry structure in order to evalu-ate its seismic vulnerability and to validate the effectiveness of the reinforcement to withstand earthquakes. Low amplitude vibration tests were carried out to monitor the evolution of the dynamic characteristics of the structure after each seismic test. The un-reinforced masonry building was severely damaged with large visible crack openings manifested at all masonry walls. The retrofitted masonry building was obtained from the severely damaged un-reinforced masonry building by fixing the cracked masonry walls and bonding on the ma-sonry walls specially designed GFRP bands. Despite the larger amplitude earthquake events applied on the reinforced building, no visible cracks were observed. The GFRP material, cov-ering 20% of the masonry wall surfaces, was proven to be very effective in reinforcing the masonry building to withstand earthquake events significantly larger in magnitude than the ones caused severe damage to the un-reinforced building.
It was demonstrated that changes in modal frequency are correlated with stiffness degrada-tion caused by minor to severe damage in the masonry walls after a seismic event, as well as correlated with stiffness improvement caused by repair and GFRP strip strengthening actions. The reduction or increase of the modal frequencies identified from low-amplitude vibration tests can be respectively used as damage or strengthening index indicators. Severe damage due to large crack formations along the un-reinforced masonry walls, is associated with sig-nificant stiffness reduction manifested as substantial shift in the lowest four modal frequency values, especially for the mode with the dominant deflections in the direction of shaking. Re-pair and strengthening with GFRP strips can restore and even exceed the stiffness to the original values of the un-damaged un-reinforced structure. The identified modal frequency reductions of the reinforced building under the series of earthquake tests were of similar level as the un-reinforced building. The observed reductions in modal frequencies of the reinforced masonry structure are attributed to the formation of non-visible micro-cracks between the brick and the mortal material which affected the stiffness of the masonry walls and thus the building’s global dynamic characteristics. The damping ratios of the lowest four modes iden-tified from low amplitude vibration tests also show a general increasing tendency with the in-tensity of seismic excitation and the level of damage. However, such tendency may be hidden by the large fluctuations in the identified values of the modal damping ratios.
The shift of identified modal (resonant) frequencies with the intensity of excitation using low-amplitude vibration tests allows the assessment of the stiffness degradation after each loading event or improvement after a strengthening event. This procedure seems sufficient for developing a vibration–based damage or repairing assessment technique.
It was experimentally demonstrated that reinforcement based on the proposed GFRP mate-rial bands significantly stiffness and strengthens the structure. The proposed reinforcement applied before or after a damaging seismic event is useful for reducing the vulnerability and seismic risk of brick masonry structures. Optimally placed GFRP strips are thus considered as
20
Paul Michelis, Costas Papadimitriou, Grigoris K. Karaiskos and Dimitra-Christina P. Papadioti
one of the promising retrofitting strategies for protections of seismically excited masonry structures. ACKNOWLEDGEMENTS
This research is funded by the European research project POLYTECT. This support is gratefully acknowledged.
REFERENCES
[1] G.D. Wight, M.J. Kowalsky, J.M. Ingham, Shake table testing of post-tensioned con-crete masonry walls with openings. Journal of Structural Engineering, 133, 1551-1559, 2007.
[2] G. Marcari, G. Manfredi, A. Prota, M. Pecce, In-plane shear performance of masonry panels strengthened with FRP. Composites Part B: Engineering, 38, 887-901, 2007.
[3] A.S. Mosallam, Out-of-plane flexural behavior of unreinforced red brick walls strength-ened with FRP composites. Composites Part B: Engineering, 38, 559-574, 2007.
[4] C.-H. Huang , Y.-C. Sung, C.-H. Tsai, Experimental study and modeling of masonry-infilled concrete frames with and without CFRP jacketing. Structural Engineering and Mechanics, 22, 449-467, 2006.
[5] J. Liu, M. Liu, Y. Song, Experimental investigation on flexural performance of masonry walls reinforced with GFRP. Journal Wuhan University of Technology, Materials Scince Edition, 22, 82-84, 2007.
[6] M. Turek, C.E. Ventura, S. Kuan, In-plane shake-table testing of GFRP-strengthened concrete masonry walls. Earthquake Spectra, 23, 223-237, 2007.
[7] F. Bastianini, M. Corradi, A. Borri, A.D. Tommaso, Retrofit and monitoring of an his-torical building using ‘smart’ CFRP with embedded fibre optic Brillouin sensors. Con-structions and Building Materials, 19, 525-535, 2005.
[8] A. Gabor, E. Ferrier, E. Jacquelin, P. Hamelin, Analysis of the in-plane shear behaviour of FRP reinforced hollow brick masonry walls. Structural Engineering and Mechanics, 19, 237-260, 2005.
[9] P. Agarwal, S.K. Thakkar, A comparative study of strengthening and retrofitting meas-ures for unreinforced brick masonry model under cyclic testing. Journal of Earthquake Engineering, 8, 839-863, 2004.
[10] J. Paquette, M. Bruneau, S. Brzev, Seismic testing of repaired unreinforced masonry building having flexible diaphragm. Journal of Structural Engineering, 130, 1487-1496, 2004.
[11] A.C. Burr, Recent developments in the use of FRP anchors and masonry wall strength-ening techniques. Structural Engineer, 82, 20-21, 2004.
[12] A. Fam, D. Musiker, M. Kowalsky, S. Rizkalla, In-plane testing of damaged masonry wall repaired with FRP. Advanced Composites Letters, 11, 275-281, 2002.
21
Paul Michelis, Costas Papadimitriou, Grigoris K. Karaiskos and Dimitra-Christina P. Papadioti
22
[13] K.H. Tan, M.K.H. Patoary, C.S.K. Roger, Anchorage systems for masonry walls strengthened with FRP composite laminates. Journal of Reinforced Plastics and Com-posites, 22, 1353-1371, 2003.
[14] R.M. Kiss, L.P. Kollar, J. Jai, H. Krawinkler, Masonry strengthened with FRP subjected to combined bending and compression. Part II: Test Results and Model Predictions. Journal of Composite Materials, 36, 1049-1063, 2002.
[15] R.M. Kiss, L.P. Kollar, J. Jai, H. Krawinkler, FRP strengthened masonry beams. Part I: Model. Journal of Composite Materials, 36, 521-536, 2002.
[16] M.L. Albert, A.E. Elwi, J.J.R. Cheng, Strengthening of unreinforced masonry walls us-ing FRPs. Journal of Composites for Construction, 5, 76-84, 2001.
[17] T.C. Triantafillou, Strengthening of masonry structures using epoxy-bonded FRP lami-nates. Journal of Composites for Construction, 2, 96-104, 1998.
[18] POLYTECT, 6 FP project of the E.C., Contract NMP2-CT-2006-026789.
[20] P. Michelis, European Patent No EP08386002.3.
[21] IMMG, Final Report, ESA Contract No 21102/07/NL/PA, 2008.
[22] CNR-DT 200/2004, Guide for the Design and Construction of Externally Bonded FRP Systems for Strengthening Existing Structures, National Research Council, Rome, July 2004.
[23] S. Casciati, K. Hamdaoui, Experimental and numerical studies toward the implementa-tion of shape memory alloy ties in masonry structures. Smart Structures and Systems, 4, 153-169, 2008.
[24] B. Peeters, H. Van der Auweraer, P. Guillaume, J. Leuridan, The PolyMAX frequency-domain method: A new standard for modal parameter estimation?. Shock and Vibration, 11, 395-409, 2004.
[25] E. Ntotsios, Modal Identification of Structures using Ambient Vibrations: Theory, Soft-ware and Applications. MSc Thesis, University of Thessaly, Department of Mechanical Engineeirng, 2009.
[26] D. Benedetti, P. Carydis, P. Limongelli, Evaluation of the seismic response of masonry buildings based on energy functions. Earthquake Engineering and Structural Dynamics, 30, 1061-1081, 2001.