40
Full Text Literature Mining for Gene Disease Relationships Nils Schimmelmann Advisor: Dr. Predrag Radivojac Indian University, Bloomington, Indiana

Full Text Literature Mining for Gene
Disease Relationships
Nils Schimmelmann
Advisor: Dr. Predrag Radivojac
Indian University, Bloomington, Indiana

Outline
● Introduction to text mining● Introduction to gene disease relationships● Objective● Data and Process● Results● Conclusion● Acknowledgements

What is text mining?
● Finding useful data in “noisy” formats– Human readable
– Not intended for machines
● Example formats– Websites
– Biomedical research journals
● Typically seen in search engines
What are gene disease relationships?
● A correlation between a gene and a disease– Cancer and TP53
● Weak vs. strong relationships– Over-expressed genes
– Causative mutation● Cystic Fibrosis and CFTR● Sicle cell anemia and HBB
– Consequence of disease● Hypertension, cardiac arrest, diabetes
Why use text mining?
● Curated databases are slow to take on new relationships
– OMIM – genotype/phenotype
– SwissProt – protein information
– PharmGKB – drug response
– HGMD – gene mutation

Why use text mining?
● Technology allows for more experiments, resulting in more gene-disease relationships
● Community is increasing in size● Published biomedical literature contains these
gene-disease relationships● Text mining is a way to effectively parse this
data from the ever increasing amounts of published literature
– Database curating assistance
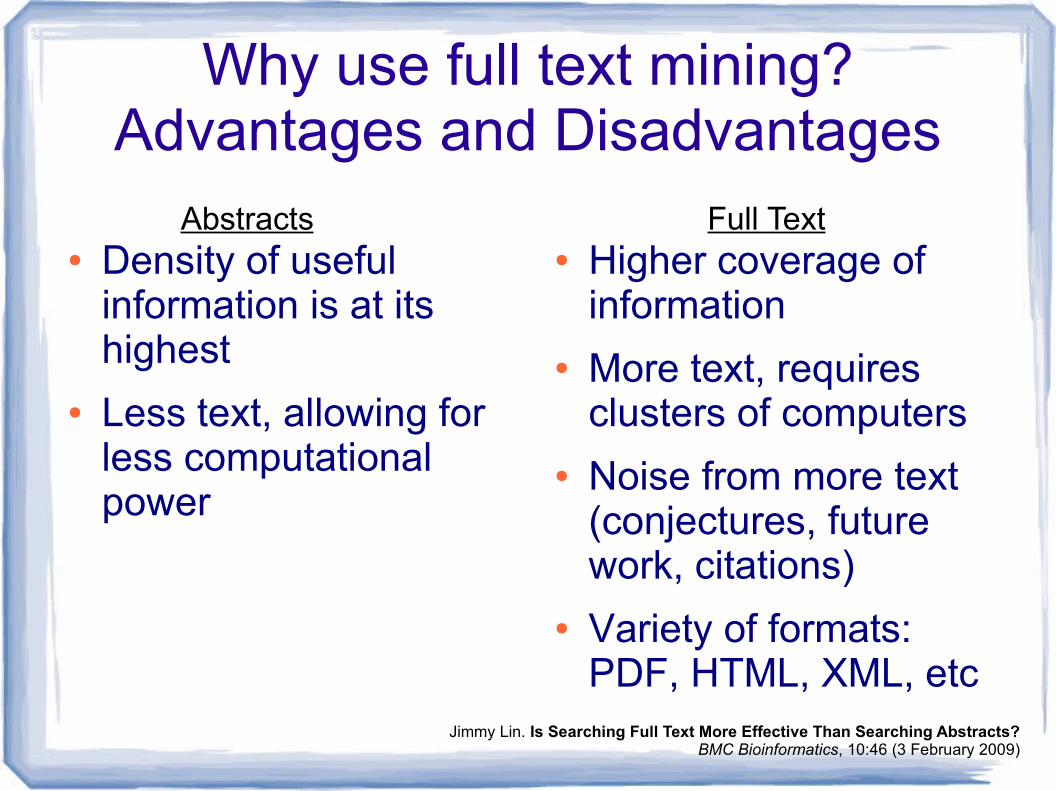
● Density of useful information is at its highest
● Less text, allowing for less computational power
● Higher coverage of information
● More text, requires clusters of computers
● Noise from more text (conjectures, future work, citations)
● Variety of formats: PDF, HTML, XML, etc
Abstracts Full Text
Why use full text mining? Advantages and Disadvantages
Jimmy Lin. Is Searching Full Text More Effective Than Searching Abstracts?BMC Bioinformatics, 10:46 (3 February 2009)
Literature Mining Objectives
● Extracting facts from literature– Verification, data creation
● Automated annotation– Curating, scoring
● Relationship discovery– Hypothesis generation
Journal Crawler
● Journals do not allow users to easily download their articles for text mining
● A custom journal crawler script was written– Hand tailored for each journal website
● Parses link anchors and urls and uses regular expressions to match for articles
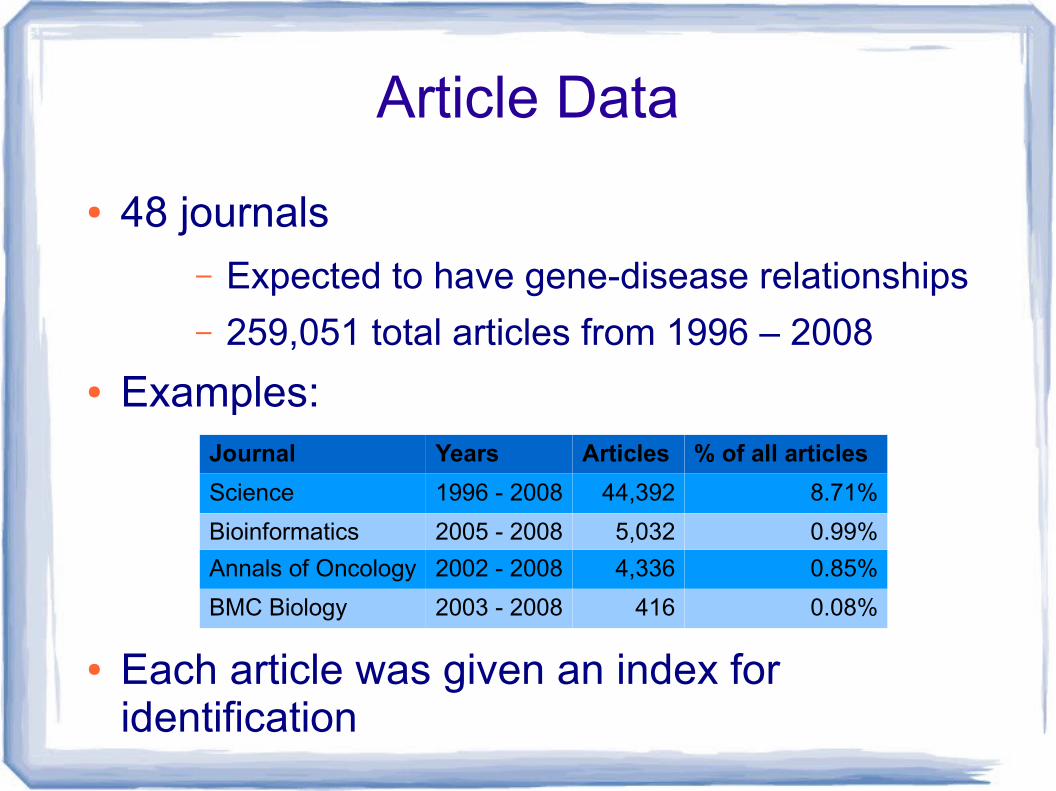
Article Data
● 48 journals– Expected to have gene-disease relationships
– 259,051 total articles from 1996 – 2008
● Examples:
● Each article was given an index for identification
Journal Years Articles % of all articles
Science 1996 - 2008 44,392 8.71%
Bioinformatics 2005 - 2008 5,032 0.99%
Annals of Oncology 2002 - 2008 4,336 0.85%
BMC Biology 2003 - 2008 416 0.08%

Disease Data● 14,464 disease terms from the “Disease
Ontology”– Collaboration between the NuGene project
and the Center for Genetic Medicine
– http://diseaseontology.sourceforge.net
– Version 2.1
– Structure of ontology ignored
● Each disease was indexedaccording to its identifierDOID
Gene Data
● 26,414 genes from the HUGO Gene Nomenclature Committee
– Official gene symbols
– http://www.genenames.org
● Symbols and synonyms extracted– Three characters or more
● Each gene was indexed to its HGNC identifier

Text Retrieval● We need to map the gene and disease
indexes to one another to get relationships● So how do we discover the relationships?
g1
g2
g3
g4
.
.
.
.
Genes Diseasesd
1
d2
d3
d4
.
.
.
.

Text Retrieval● We search the articles for the diseases and
genes
● Gene g1 was found in articles { a
1, a
2, a
3 }
● Disease d1 was found in articles { a
3, a
4, a
5 }
● A potential relationship would bethe intersect of g
1 and d
1: a
3
Articlesa
1 a
2 a
3 . . . . . . a
n
a1 a
2 a
3 a
4 a
5
g1
d1

Text Retrieval
● All articles were indexed and searched using SWISH-E, an open source search engine
● Hits were whether or not a term was found in an article
● 5,206 disease terms found (36% of all terms within the disease ontology)
● 19,395 genes found (73% of all genes)● 5,734,417 gene-diseases joint terms found
(6% of all pairs found in at least one article)
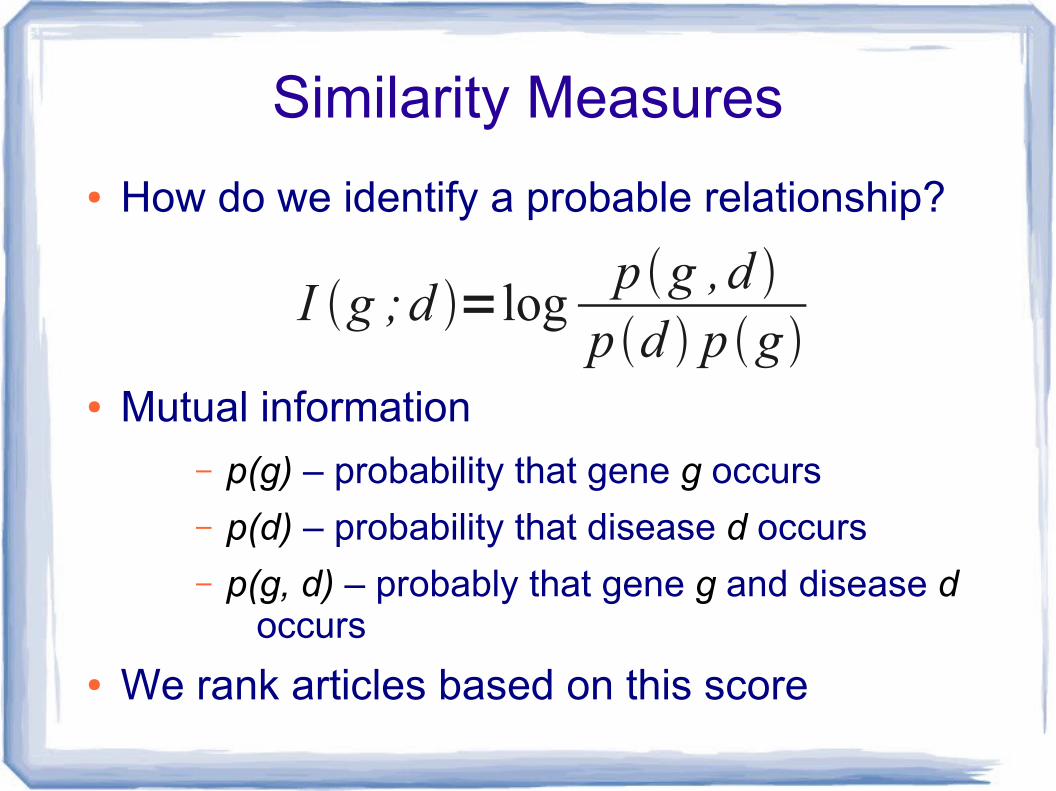
Similarity Measures
● How do we identify a probable relationship?
● Mutual information– p(g) – probability that gene g occurs
– p(d) – probability that disease d occurs
– p(g, d) – probably that gene g and disease d occurs
● We rank articles based on this score
I g ;d =logp g ,d p d p g

Word Proximity Method
● How to improve the simple “term hits” in the baseline method
● Joint terms could mean a gene in the abstract and a disease in the citations
● This noise can be filtered out

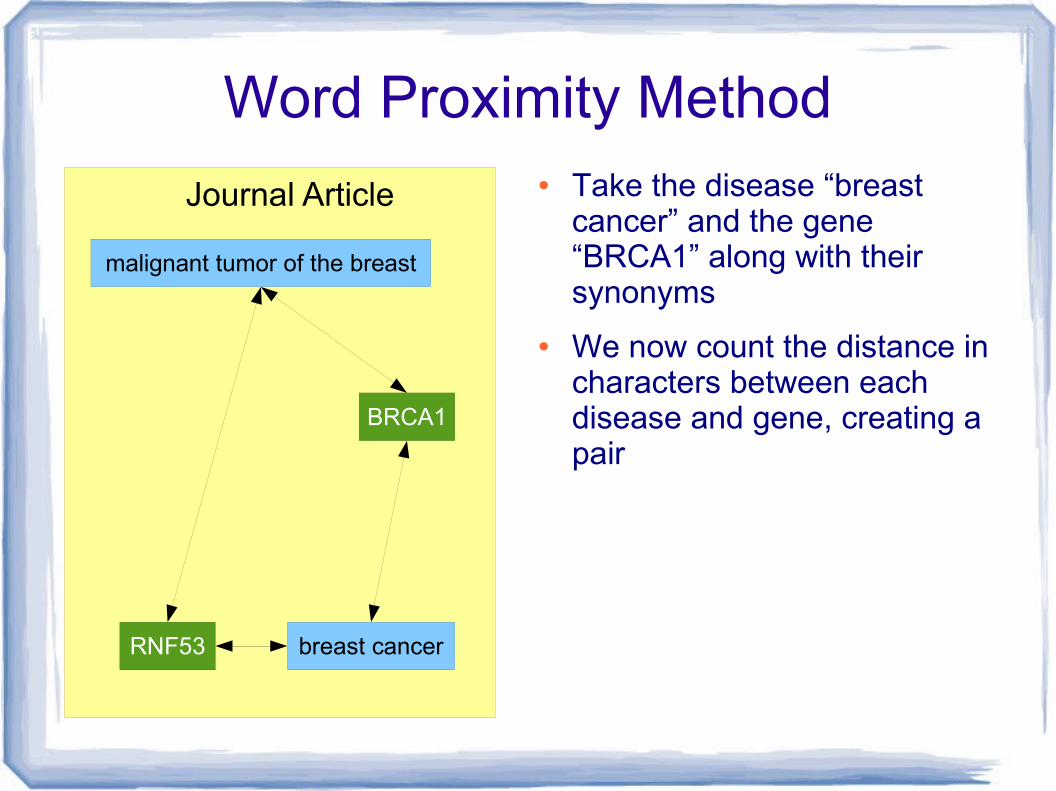
Word Proximity Method
Journal Article
malignant tumor of the breast
breast cancer
BRCA1
RNF53
● Take the disease “breast cancer” and the gene “BRCA1” along with their synonyms
Word Proximity Method
Journal Article
malignant tumor of the breast
breast cancer
BRCA1
RNF53
● Take the disease “breast cancer” and the gene “BRCA1” along with their synonyms
● We now count the distance in characters between each disease and gene, creating a pair

Word Proximity Method
Journal Article
malignant tumor of the breast
breast cancer
BRCA1
RNF53
● Take the disease “breast cancer” and the gene “BRCA1” along with their synonyms
● We now count the distance in characters between each disease and gene, creating a pair
● Given a disease name, we select the gene symbol that is closest
● These terms are most likely to be related and be a possible gene-disease relationship

Word Proximity Method
S=∑i=1n
pair_score d i ,G
pair_score d i ,G = f ∣d i−gk∣k=argmin j=1.. .m∣d i−g j∣
G={g1 , g2 , ... , gm }
D={d1 ,d 2 , ... , dn }
f x =e−d x
● We score each article given a gene-disease pair, consider one article
– we have a set of gene positions
– and a set of all diseases positions
● The summed score isfor the given article
● Where
● and
● The function is used, where d is a positive constant, e is Euler's constant, and x is the distance

Similarity Measures
● How do we turn word proximity into a similarity measure, such as mutual information?
● where is the number of word proximity scores above threshold t over all possible articles
I ' g ;d =logp S g , d ≥t p d p g
p S g ,d ≥t

Word Proximity Method
● Various values used for the threshold t and constant d
● The parameter of t was tested from– 0 through 5x10-230
● The constant d was tested from– 0.0005 to 3
● This was done to find the best results
p S g ,d ≥t f x =e−d x
Measuring Accuracy● True gene-disease relationships were taken
from:– “Disease Ontology”
– PharmGKB
● The gene associations were propagated up the diseases ontology
– Breast Cancer/BRCA1 would imply Cancer/BRCA1

Measuring Accuracy
● True positive rate: fraction of correctly identified true positives (known, correct gene disease relationships)
● False positive rate: fraction of incorrectly identified negatives
● AUC is the area under the receiver operating characteristic: Plot of the two operating characteristics TPR vs FPR
● Mutual information is used to rank the relationships

Similarity Measure AUCs
● Calculated on all gene-disease pairs with some pruning
● The disease had to be within the known set of true gene disease relationships
● The relationships needed at least 10 articles of evidence
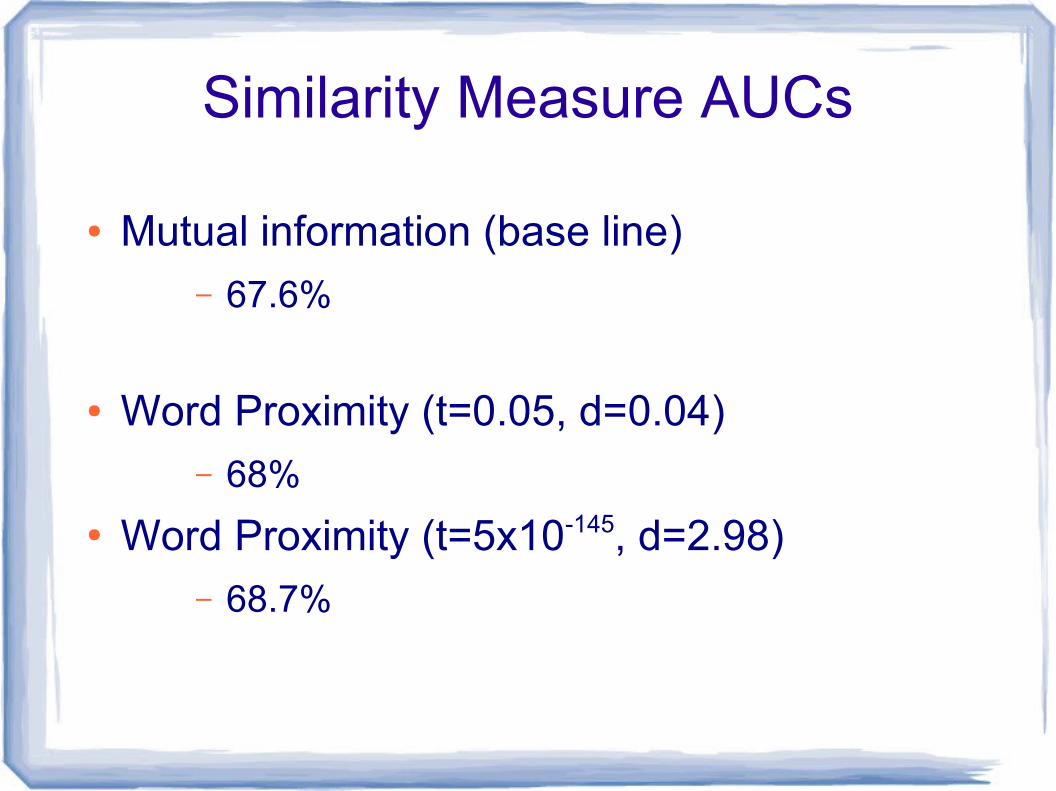
Similarity Measure AUCs
● Mutual information (base line)– 67.6%
● Word Proximity (t=0.05, d=0.04)– 68%
● Word Proximity (t=5x10-145, d=2.98)– 68.7%

Machine Learning
● WEKA 3, a data mining suite– http://www.cs.waikato.ac.nz/ml/weka/
● Algorithms used in a 10 fold cross-validation:– Random Forests
– Neural Network

Machine Learning● 86 attributes and 1 class
– 2 attributes for gene HGNC and disease DOID
– 84 attributes were based the best and some random t and d pairs, with scores being their word proximity mutual information
– 1 class whether it was a true relationship
● Gene and disease attributes included to allow for supervised learning on the interacting genes and diseases
● A total of 184,041 instances
Random Forests
● Consists of decision/regression trees● Uses information gain/variance● Prunes itself using reduced-error pruning (with
backfitting)
● AUC of 86.5%● Precision of 65.4%
● Recall of 12.6%
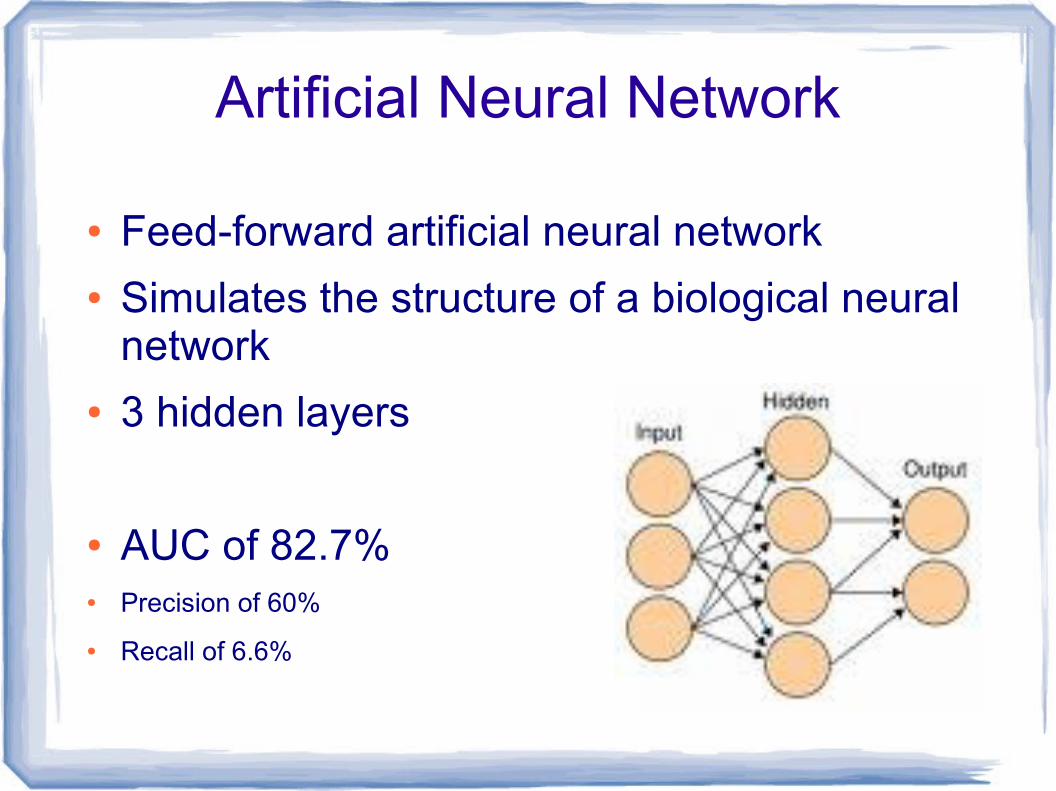
Artificial Neural Network
● Feed-forward artificial neural network● Simulates the structure of a biological neural
network● 3 hidden layers
● AUC of 82.7%● Precision of 60%
● Recall of 6.6%

AUC Results
● Mutual information (base line)
– 67.6%● Word Proximity (t=0.05, d=0.04)
– 68%● Word Proximity (t=5x10-145, d=2.98)
– 68.7%● Random Forests
– 86.5%● Neural Network
– 82.7%

AUC Results
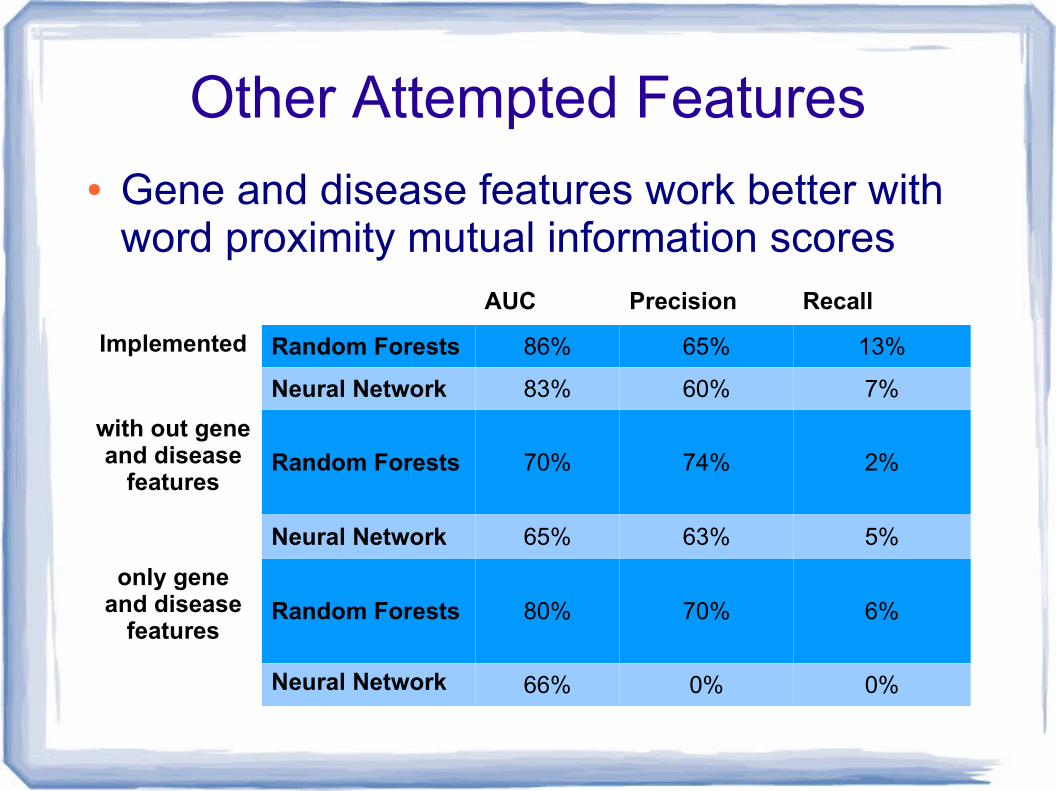
Other Attempted Features
AUC Precision Recall
Implemented Random Forests 86% 65% 13%
Neural Network 83% 60% 7%
with out gene and disease
featuresRandom Forests 70% 74% 2%
Neural Network 65% 63% 5%
only gene and disease
featuresRandom Forests 80% 70% 6%
Neural Network 66% 0% 0%
● Gene and disease features work better with word proximity mutual information scores

Result Analysis● False positives
– Might be true as they can be gene disease relationships that are not in already in the curated databases
– Can be noise, conjectures, etc
● Machine learning provides a huge increase in the highly ranked true positive results!
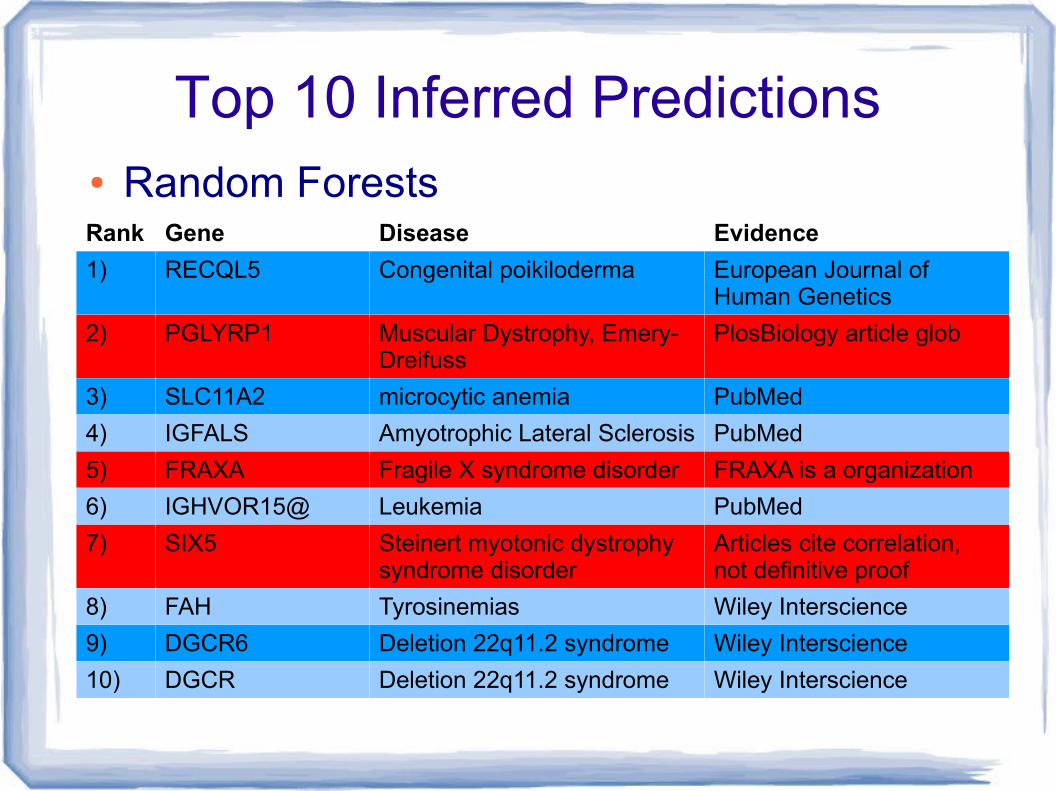
Top 10 Inferred Predictions● Random ForestsRank Gene Disease Evidence
1) RECQL5 Congenital poikiloderma European Journal of Human Genetics
2) PGLYRP1 Muscular Dystrophy, Emery-Dreifuss
PlosBiology article glob
3) SLC11A2 microcytic anemia PubMed
4) IGFALS Amyotrophic Lateral Sclerosis PubMed
5) FRAXA Fragile X syndrome disorder FRAXA is a organization
6) IGHVOR15@ Leukemia PubMed
7) SIX5 Steinert myotonic dystrophy syndrome disorder
Articles cite correlation, not definitive proof
8) FAH Tyrosinemias Wiley Interscience
9) DGCR6 Deletion 22q11.2 syndrome Wiley Interscience
10) DGCR Deletion 22q11.2 syndrome Wiley Interscience

Top 10 Inferred Predictions
● Neural Network
Rank Gene Disease Evidence
1) NPEPPS cancer Molecular Endocrinology
2) KLK3 cancer Carcinogenesis
3) PSAT1 cancer Molecular Cancer
4) EGF cancer Annals of Oncology
5) CD19 lymphoma Wiley Interscience
6) SERPINB3 cancer PubMed
7) ZBED1 cancer Nucleic Acids Research
8) COX8A cancer BMC Cancer
9) DLD cancer PubMed
10) TNFSF10 cancer Nature

Conclusion● Word proximity is a simple method that can
filter a large amount of noise is present within full text journal articles
● Some manual curating is still necessary because some gene-disease relationships are incorrect
– Conjectures
– Common examples (cancer)
– Article inconsistencies (citations, etc)
● The system works very well at filtering large amounts of data

Acknowledgements● Dr. Predrag Radivojac● Lab mates –
● Amrita Mohan
● Wyatt Clark
● Yong Li
● Fuxiao Xin
● Linda Hostetter● Bioinformatics faculty at the School of
Informatics● School of Informatics
● Shuyan Li● Biao Li● Sujun Li● Nathan Nert● Rajeswari Swaminathan● Aaron Buechlein

Questions?


