51
Excellence and Alignment Full Year 2008 Company Results (Audited) & Outlook for 2009 1

Excellence and Alignment
Full Year 2008 Company Results (Audited) & Outlook for 2009
1
Excellence and Alignment
Forward Looking Statement
This presentation has been prepared for informational purposes only by PT Kalbe Farma Tbk. (“Kalbe” or the “Company”).
This presentation has been prepared solely for use in connection with the release of the 31 December 2008 unaudited results of theCompany. The information contained in this presentation has not been independently verified. No representation, warranty or undertaking,express or implied, is made as to, and no reliance should be placed on, the fairness, accuracy, completeness or correctness of the informationor the opinions contained herein. None of the Company or any of their respective affiliates, and their respective commissioners, directorsand employees, advisors or representatives shall have any liability whatsoever (in negligence or otherwise) for any loss howsoever arisingfrom any use of this presentation or its contents or otherwise arising in connection with the presentation. Any decision to purchase orsubscribe for securities of the Company should not be made on the basis of the information contained in this presentation.
The presentation is not an offer of securities for sale in the United States. Securities may not be offered or sold in the United States absentregistration or an exemption from registration.
This presentation and its contents are confidential unless they are or become generally available as public information in accordance with theprevailing laws and regulations other than as a result of a disclosure by you and must not be distributed, published or reproduced (in whole orin part) or disclosed by recipients to any other person. This presentation does not constitute a recommendation regarding the securities ofthe Company.
This presentation, including the information and opinions contained herein, are provided as at the date of this presentation and are subject tochange without notice including as a result of the issuance of the audited 31 December 2008 results of the Company.
This presentation includes "forward-looking statements". These statements contain the words "anticipate", "believe", "intend", estimate","expect" and words of similar meaning. All statements other than statements of historical facts included in this presentation, including,without limitation, those regarding the Company's financial position, business strategy, plans and objectives of management for futureoperations (including development plans, objectives relating to the Company's products and services and anticipated product launches) areforward-looking statements. Such forward-looking statements are based on numerous assumptions regarding the Company's present andfuture business strategies and the environment in which the Company will operate in the future. These forward-looking statements speakonly as at the date of this presentation. The Company expressly disclaims any obligation or reflect any change in the Company's expectationswith regards thereto or any change in events, conditions or circumstances on which any statement is based.
Market data and certain industry forecasts used in this presentation were obtained from market research, publicly available information andindustry publications, which have not been independently verified, and no representation is made as to the accuracy of such information.
2

Excellence and Alignment
Full Year 2008 Highlights
• Double Digit Revenue Growth
• Pressured Margins
• Improved Working Capital Management
• Solid Financial Position
Up 12.5%.
NOC down by 2 days.
Stronger cash generation up by more than Rp 445 Bn.
Cash Balance of Rp 1.3 Tn.11.2% Gearing Ratio.
Gross Profit Margin -2.4%
Operating Profit Margin -1.6%
Net Income Margin -1.1%
3

Excellence and Alignment4
Double Digit Revenue Growth

Excellence and Alignment
Double Digit Revenue Growth
∆ 18.0% ∆ (11.2)% ∆ 20.5% ∆ 24.5% ∆ 12.5%
• Revenue has increased by 12.5% to IDR 7,877 Bn in 2008.
• The growth was primarily driven by Nutritionals Division of 20.5% and Distribution and Packaging Division of 24.5%.
• Sales of Energy Drink has not yet recovered and therefore the sales of Consumer Health Division down by 11.2%.
Note: The figures represents in Billion Rupiah
5
FY 2007 (Audited) FY 2008 (Audited)

Excellence and Alignment
Revenue Contribution per Division
FY Dec 2007 (Audited) FY Dec 2008 (Audited)
• As a result of revenue drop, the revenue contribution of Consumer Health Division has declined from 26% in 2007 to 21% in 2008.
6

Excellence and Alignment
Indonesian Pharmaceutical Market
• YTD December 2008, Kalbe was the market leader with a market share of 14%, well ahead the rest of the players in the total pharmaceutical industry.
Total Market = IDR 30.14 TrillionSource : IMS Health YTD 12 2008
Pharmaceutical Market ShareITMA – YTD Dec 2008
7
Excellence and Alignment
Prescription Pharmaceuticals Division
8
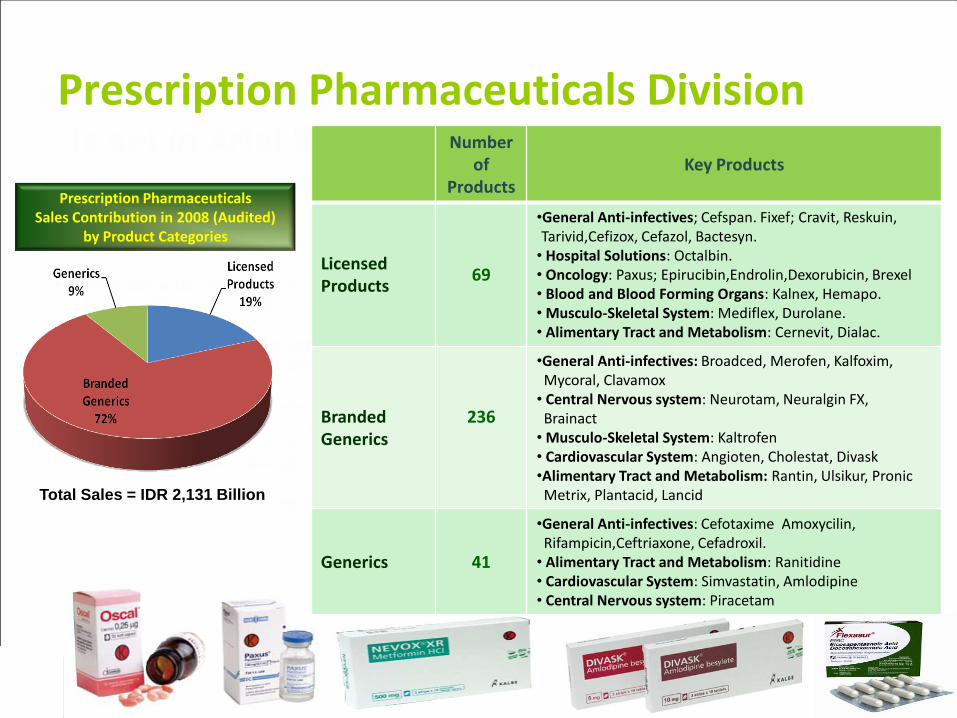
Prescription PharmaceuticalsSales Contribution in 2008 (Audited)
by Product Categories
Number of
ProductsKey Products
Licensed Products
69
•General Anti-infectives; Cefspan. Fixef; Cravit, Reskuin, Tarivid,Cefizox, Cefazol, Bactesyn.
• Hospital Solutions: Octalbin.• Oncology: Paxus; Epirucibin,Endrolin,Dexorubicin, Brexel• Blood and Blood Forming Organs: Kalnex, Hemapo.• Musculo-Skeletal System: Mediflex, Durolane.• Alimentary Tract and Metabolism: Cernevit, Dialac.
Branded Generics
236
•General Anti-infectives: Broadced, Merofen, Kalfoxim, Mycoral, Clavamox
• Central Nervous system: Neurotam, Neuralgin FX,Brainact
• Musculo-Skeletal System: Kaltrofen• Cardiovascular System: Angioten, Cholestat, Divask•Alimentary Tract and Metabolism: Rantin, Ulsikur, PronicMetrix, Plantacid, Lancid
Generics 41
•General Anti-infectives: Cefotaxime Amoxycilin,Rifampicin,Ceftriaxone, Cefadroxil.
• Alimentary Tract and Metabolism: Ranitidine• Cardiovascular System: Simvastatin, Amlodipine• Central Nervous system: Piracetam
Total Sales = IDR 2,131 Billion
Excellence and Alignment
1,457 1,809
2,131
2006 2007 2008
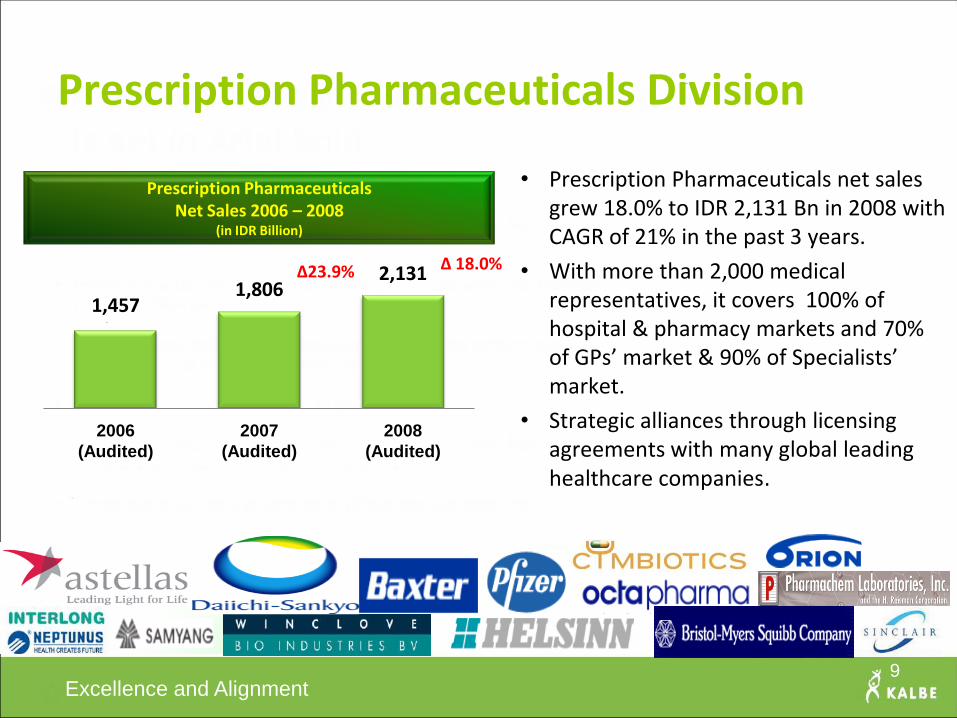
Prescription Pharmaceuticals Division
• Prescription Pharmaceuticals net sales grew 18.0% to IDR 2,131 Bn in 2008 with CAGR of 21% in the past 3 years.
• With more than 2,000 medical representatives, it covers 100% of hospital & pharmacy markets and 70% of GPs’ market & 90% of Specialists’ market.
• Strategic alliances through licensing agreements with many global leading healthcare companies.
∆23.9% ∆ 18.0%
Prescription Pharmaceuticals Net Sales 2006 – 2008
(in IDR Billion)
2006
(Audited)
2007
(Audited)
2008
(Audited)
9
1,8062,131
1,457

Excellence and Alignment
Prescription Pharmaceuticals Division
Market ShareITMA – YTD December 2006
Market ShareITMA – YTD December 2007
Market ShareITMA – YTD December 2008
Total Market = IDR 13.8 Trillion Total Market = IDR 17.1 TrillionTotal Market = IDR 14.9 Trillion
Source: IMS Health for Prescription Pharmaceuticals Corporations
• Rank #1 in the Prescription Pharmaceuticals Total Market in the last consecutive 3 years.• The division has gained significant market share since marketing team reorganization
following the merger of Kalbe and its subsdiary, PT. Dankos Laboraties Tbk in 2006.
10

Excellence and Alignment
Prescription Pharmaceuticals DivisionEnhanced Business Portfolio
• Innogene Kalbiotech Pte Ltd, a subsidiary of Kalbe based in Singapore, spearheads the innovation and globalization for Kalbe with research-based products.
• Currently Innogene holds the licensing and marketing rights for Nimotuzumab in 13 countries in Asia and Africa. Nimotuzumab has been used for various indications such as head and neck cancer, glioma and nasopharyngeal carcinoma. Nimotuzumab is marketed under brand of TheraCIM.
• TheraCIM has been fully commercialized in Indonesia and Philippines in late 2008.
• Starting March 2009, Innogene shall be working with the National Cancer Centre of Singapore (NCCS) in coordinating a trial for an experimental drug for head and neck cancers which shall involves 700 patients from 22 institutions in 12 countries.
11

Excellence and Alignment
1,840 1,856
1,653
2006 2007 2008
Consumer Health Division
• Consumer Health division consists of:
– OTC Pharmaceuticals 11 brands; and
– Energy Drink.
• Consumer Health net sales was down by 11.2% to IDR 1,648 Bn in 2008 and primarily driven by the drop of Extra Joss sales.
• Top 10 brands such as Extra Joss, Promag, Mixagrip, Fatigon, Woods, Komix and others contributed around 70% of total Consumer Health Division’s sales.
Consumer Health Net Sales 2006 – 2008 (in IDR Billion)
Consumer Health Top 10 BrandsSales Contribution
Total Sales IDR 1,648 billion
Others
30%
Top 10
Brands
70%
2006
(Audited)
2007
(Audited)
2008
(Audited)
12
∆ 0.9%∆ (11.2)%
1,648
1,8561,840

Excellence and Alignment
Consumer Health Division
Market Share of Kalbe’s top products as per December 2008
Therapeutic Class Kalbe’s Products
Market Share
(by volume)
December 2008
Antacid Promag Reg, Promag DA, Waisan 82.5%
Anti Diarrhea Neo Entrostop 44.9%
Cough Remedies Komix, Woods, Mextril 45.0%
Cold Remedies Mixagrip Reg, Mixagrip FB, Procold 37.0%
Energy Drink Extra Joss 38.0%
Physical /Brain Blood Cerebrovit, Fatigon 22.1%
13
Source: AC Nielsen

Excellence and Alignment
Total Market in Unit = 1.3 BillionTotal Market in Value = IDR 1.5 Trillion
Source: AC Nielsen for Energy Drink YTD 12 2008
Consumer Health Division • OTC Pharmaceuticals Division holds # 1 position with 15% market share.• Extra Joss continued to become # 1 player in the Energy Drink market with 38% market
share.
Total Market in Value = IDR 13.0 TrillionSource: IMS Health for OTC YTD 12 2008
OTC Pharma Market ShareITMA – YTD December2008
Energy Drink Market ShareYTD December2008 (by volume)
14

Excellence and Alignment
Consumer Health Division Energy Drink
2008 – A Correction Year
1. Distribution– Increase coverage especially in the rural areas.
2. Reorganization– New sales and marketing team.
3. Communication– Improve communication by emphasizing healthy benefits of
Extra Joss ;– Rearrange promotional media portfolio.
4. Redefined brand architecture– Design brand architecture of energy and health drink ;– Rejuvenate an extension product of Extra Joss called JossFit.
15

Excellence and Alignment
Consumer Health Division Energy Drink
• Currently Extra Joss is the market leader in the Philippines with market share of more than 50% (in unit).
16
Excellence and Alignment
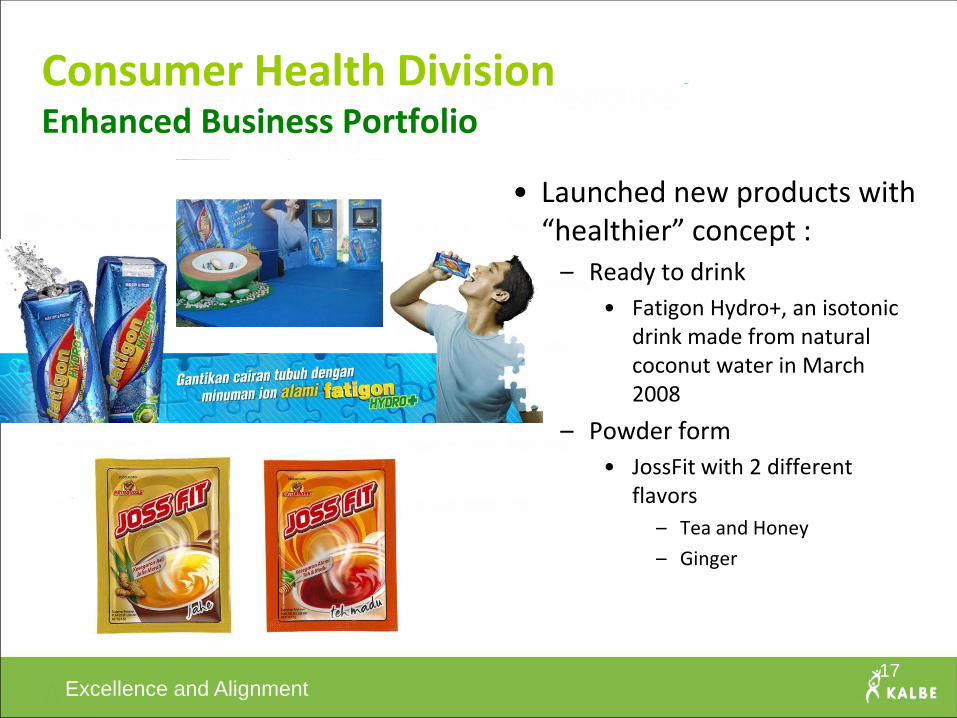
Consumer Health DivisionEnhanced Business Portfolio
• Launched new products with “healthier” concept :
– Ready to drink
• Fatigon Hydro+, an isotonic drink made from natural coconut water in March 2008
– Powder form
• JossFit with 2 different flavors
– Tea and Honey
– Ginger
17

Excellence and Alignment
Nutritionals Division• Complete range of nutritional products, mostly in the form of powder milk,
catered to expecting & lactating mothers, babies, toddlers, children, and adults.
• Currently, there are 8 brands marketed by the Division.
Expecting Lactating Baby Toddler 25+ 35+ Clinical
18

Excellence and Alignment
Nutritionals Division• Nutritionals division is the fastest
growing division in Kalbe and its net sales were up by 20.5% from IDR 1,600 Bn in 2007 to IDR 1,927 Bn in 2008, with CAGR of 21% in the past 3 years.
• Kalbe Nutritionals Division has continued to improve its understanding towards the needs and aspirations of its consumers.
It has established a telemarketing Customer Relationship Management (CRM) Team to call and visit targeted mothers. And recently, it has set up Nutrition For Life (NFL) outlet in Pondok Indah Mall as the point of interest, information, and interaction for consumers.
∆ 20.9% ∆ 20.5%
Nutritionals Net Sales 2006 – 2008
(in IDR Billion)
2006
(Audited)
2007
(Audited)
2008
(Audited)
19
1,9271,600
1,323

Excellence and Alignment
Nutritionals Division
• As per December 2008, Kalbe Nutritionals, spearheaded by PT Sanghiang Perkasa, controlled around 5% of market share in the powder milk market and around 63% of market share in baby biscuit market.
Total Market in Unit = 103.0 MillionTotal Market in Value = IDR 8.7 Trillion
Powder Milk Market ShareYTD December 2008
(by volume)
Baby Biscuit Market ShareYT D December 2008
(by volume)
Total Market in Unit = 1.1 MillionTotal Market in Value = IDR 62.6 Billion
Premium Powder MilkMarket Share
YTD December 2008 (by volume)
Total Market in Unit = 25.9 MillionTotal Market in Value = IDR 3.4 Trillion
Source : AC Nielsen YTD 12 200820

Excellence and Alignment
Nutritionals DivisionEnhanced Business Portfolio
• Launching several new products in 2008.
– Nulife No Calorie Sweetener
– Nulife Oatmeal+ Oatbran
– Nulife Crispy Cereal Bar
– Nutrive Benecol,
• Smoothie with special ingredient to lower cholesterol.
21

Excellence and Alignment
Distribution & Packaging DivisionSales Composition
• Increasing 3rd party contribution to division’s total sales.
22
Distribution & PackagingSales Composition in 2007 (Audited)
Distribution & PackagingSales Composition in 2008 (Audited)
Kalbe77%
3rd Party23%
Kalbe75%
3rd Party25%
Distribution Sales Dec 2008 (Audited)
Distribution Sales Dec 2007 (Audited)
Kalbe44%
3rd Party56%
Packaging SalesDec 2008 (Audited)
Packaging SalesDec 2007 (Audited)
3rd Party
46%
3rd Party
40%
Kalbe
54%
Kalbe
60%

Excellence and Alignment
Distribution & Packaging Division
• Net Sales figures represent the net sales of 3rd party principals.
• Distribution & Packaging division net sales grew 24.5%, the highest among all divisions. Its CAGR for the past 3 years is approximately 22%.
• Packaging division contributed around 15% of total division’s net sales or approximately 4% of consolidated net sales.
∆ 20.0% ∆ 24.5%
Distribution & PackagingNet Sales 2006 – 2008
(in IDR Billion)
Packaging15%
Distribution85%
Distribution & PackagingNet Sales Contribution in 2008 (Audited)
2006
(Audited)
2007
(Audited)
2008
(Audited)
23
1,4521,742
2,170
Total Sales = IDR 2,170 Billion

Excellence and Alignment
Distribution & Packaging Division
• Revenue of Distribution Division, conducted under Enseval PuteraMegatrading (EPMT), grew by 26.3% while revenue of Packaging Division, conducted under KageoIgar (IGAR), grew by 15.1%.
• The growth represents the growth of each division’s 3rd party business.
• Major EPMT’s 3rd party principals are among others Mead Johnson, L’oreal, Kara Santan and Interbat.
Packaging Net Sales 2006 – 2008(in IDR Billion)
Distribution Net Sales 2006 -2008(in IDR Billion)
24
2006
(Audited)
2007
(Audited)
2008
(Audited)
2006
(Audited)
2007
(Audited)
2008
(Audited)
∆ 21.7%∆ 26.3%
∆ 15.1%∆ 11.3%

Excellence and Alignment
Distribution & Packaging DivisionDistribution Division
Ethical25%
OTC11%
Consumer27%
Nutrition25%
RMT7%
MIDI5%
Others0%
Ethical26%
OTC12%
Consumer21%
Nutrition26%
RMT8%
MIDI7%
Others0%
• The charts below show the contribution of the revenue in the Distribution division.
YTD Dec 2008 (Audited) YTD Dec 2007 (Audited)
25

Excellence and Alignment
Distribution & Packaging DivisionPackaging Division
• The charts below show the contribution of the revenue from Packaging Division.
YTD Dec 2008 (Audited) YTD Dec 2007 (Audited)
26
Aluminium
Foil Packaging
84%
Aluminium
Foil Packaging
83%
Paper Folding
Carton
Packaging
17%
Paper Folding
Carton
Packaging
16%

Excellence and Alignment
Distribution & Packaging DivisionEnhanced Business Portfolio
• In 2008, EPMT has set up 2 subsidiaries, wholly owned, namely PT. Enseval MedikaPrima and PT. Global Chemindo Megatrading to accelerate growth of medical diagnostic business and raw material trading.
• The sales growth of these 2 businesses is approximately 50% in 2008.
27

Excellence and Alignment
Distribution & Packaging DivisionEnhanced Business Portfolio
• Opening of Mitrasana Clinics as a one-stop service, includes family doctor, pharmacy, laboratory, and convenience store.
• Currently, there are 4 clinics in Cikarang, +/- 50 km from Jakarta and intends to open about 6 more clinics in 2009 in the Greater Jakarta Area.
• In 2008, EPMT has acquired PT. Renalmed Tiara Utama, a company which provides services to hemodialysisclinics.
28

Excellence and Alignment29
Pressured Margins

Excellence and Alignment
Pressured Margins
• Despite the sharp increase of raw material prices, consolidated gross profit margin has declined by 2.4% driven primarily by drop of margin in the Nutritionals division.
– The price of skim powder milk has increased by more than double since 2006.
• Gross Profit Margin of the remaining divisions were relatively stable with some improvement of margin in the Distribution & Packaging division.
Gross Profit Margin
30

Excellence and Alignment
Operating Efficiencies
• In 2008, the costs of operation costs have been declined by 0.80% due to rationalization of marketing expenses and efficiencies in administration costs.
• Marketing expenses have been able to be controlled at 27.34% to Net Sales, while the general & administrations costs was 5.76% from Net Sales.
• Total operating expenses to net sales ratio reduced from 34.58% in 2007 to 33.78% in 2008.
Operating Expenses to Net Sales Ratios
▼0.91%
▲0.09%
▼0.80%
Operating Expense Contribution 2008 (Audited)
31
▲0.03%

Excellence and Alignment32
Improved Working Capital Management

Excellence and Alignment
Supply Chain Management Implementation
• Starting 2008, Kalbe has implemented End – to – End Supply Chain Management with a major milestone in 2008 of implementing single inventory system for prescription pharmaceutical & over the counter divisions.
• Key deliverables :– Production Plan based on nation
wide inventory level ;
– Balanced inventory level at all branches in Indonesia ; &
– Balanced products deliveries versus warehouse speed and capacity.
33

Excellence and Alignment
Improved Working Capital Management
• With implementation of end – to –end Supply Chain Management (SCM), inventory level has been able to be managed efficiently. As the result, the days of inventory turnover has been reduced by 7 days by year end 2008.
• Despite the liquidity crisis, Kalbe was able to reduce the days of account receivable by 2 day and increase its payables days by 7 days.
• Stronger free cash flows from the operation, increased by approximately Rp. 445 Bn from year end 2007 figure.
FY 2007
(Audited)
FY 2008
(Audited)
∆
Change
Days of Account Receivables 45 days 43 days 2 days
Days of Inventory 149 days 142 days 7 days
Days of Account Payables 34 days 27 days 7 days
Net Operating Cycles 160 days 158 days 2 days
34
Note: Cash Flow figure based on FY 2008 Audited Financial Statements
CASH FLOWS FROM OPERATING ACTIVITIES
Cash received from customers 6,962,234,826,198 7,804,970,069,835 12.10%
Cash paid to suppliers and employees (4,423,686,203,531) (4,505,841,240,394) 1.86%
Cash provided by operations 2,538,548,622,667 3,299,128,829,441 29.96%
Receipts of claims for income tax refund 12,186,681,704 8,049,202,297 -33.95%
Payments of advertising, exhibition, and promotion expenses (970,452,832,884) (1,063,640,714,293) 9.60%
Payments of income taxes (401,616,894,337) (356,142,206,993) -11.32%
Payments for other operating expenses, net (815,767,338,304) (1,079,694,575,108) 32.35%
Net Cash Provided by Operating Activities 362,898,238,846 807,700,535,344 122.57%
FY 2008 (Audited)FY 2007 (Audited) % Change

Excellence and Alignment35
Solid Financial Position

Excellence and Alignment
2004 (Audited) 2005 (Audited) 2006 (Audited) 2007 (Audited) 2008 (Audited)
Strong Cash Generation
• EBITDA has increased with CAGR of 6% since 2004.
1,030
1,235 1,2211,295
1,321
36

Excellence and Alignment
Improved Gearing Ratio
• Debt reduction and gearing ratio improvement.
2004
(Audited)
2005
(Audited)
2006
(Audited)
2007
(Audited)
2008
(Audited)
37

Excellence and Alignment
Increased Net Cash Position
• Since 2006, Kalbe has always been in net cash position.– Net Cash balance as of Dec 31, 2008 was IDR 917 Bn.
2004 2005 2006 2007 20082004
(Audited)
2005
(Audited)
2006
(Audited)
2007
(Audited)
2008
(Audited)
38

Excellence and Alignment
Earning Per Share Growth
* Based on outstanding shares less applicable treasury stocks
• 4 year EPS - CAGR (2004 – 2008) is 13%.
2004
(Audited)
2005
(Audited)
2006
(Audited)
2007
(Audited)
2008
(Audited)
39

Excellence and Alignment
Cash Distribution to Shareholders2007 - 2008
• Total cash distributed to shareholders in year 2007 & 2008 was approximately Rp. 770 Bn.
– Cash Dividend• Rp 10 per share for financial year 2006 and 2007 or approximately
Rp 200 Bn.
– Share Repurchase Program• As of December 31, 2008, Kalbe has repurchased 576,798,500
shares or 5.68% of the outstanding shares or a total of approximately Rp 570 Bn.
40

Excellence and Alignment41
Outlook 2009

Excellence and Alignment
Outlook 2009
Revive Energy Drink business
Aligned SCM Implementation
Partner in new products Regional & international business expansion
Holistic Care & Family DoctorDistribution coverage expansion
especially in remote areas
Collaboration with Global Strategic Players
ProjectedSales Growth 12 -14%Net Income MarginImprovement 0.5% - 1%
42

Excellence and Alignment
Outlook 2009
• Extend the implementation of end – to – end Supply Chain Management to OTC pharmaceutical and Nutritional divisions
• Implementation of Strategy throughout the Group.
– roductivity• Improving both employee productivity and process productivity.
• Implementing Value Stream Mapping, Lean Practices and Lean Supply Chain.
– nnovation• Increase innovation in product and services including business process and administration.
– ashflow • Improving net operating cycle without sacrificing service level.
43

Excellence and Alignment44
Appendix

Excellence and Alignment
Consolidated Statements of Income
45
Note : Financial figures based on Audited Consolidated Financial Statements for Year Ended on December 31, 2008.
NET SALES 7,004,909,851,908 7,877,366,385,633 12.45%
COGS 3,453,278,199,660 4,073,725,872,514 17.97%
% to NS 49.30% 51.71% 2.41%
GROSS PROFIT 3,551,630,652,248 3,803,640,513,119 7.10%
% to NS 50.70% 48.29% -2.41%
OPERATING EXPENSES
Selling 1,979,034,803,322 2,153,298,745,391 8.81%
% to NS 28.25% 27.34% -0.91%
General & Administration 397,314,069,867 453,356,346,569 14.11%
% to NS 5.67% 5.76% 0.09%
Research & Development 45,927,236,573 54,273,018,638 18.17%
% to NS 0.66% 0.69% 0.03%
TOTAL OPERATING EXPENSES 2,422,276,109,762 2,660,928,110,598 9.85%
% to NS 34.58% 33.78% -0.80%
OPERATING PROFIT 1,129,354,542,486 1,142,712,402,521 1.18%
% to NS 16.12% 14.51% -1.61%
NET INCOME 705,694,196,679 706,822,146,190 0.16%
% to NS 10.07% 8.97% -1.10%
FY 2008 (Audited)FY 2007 (Audited) % Change

Excellence and Alignment
Consolidated Balance Sheets
46
Note : Financial figures based on Audited Consolidated Financial Statements for Year Ended on December 31, 2008.
ASSETS
CURRENT ASSETS
Cash and cash eq 1,116,346,134,197 1,321,797,625,299 18.40%
Short term investments 175,833,152,370 124,748,588,599 -29.05%
Trade Receivables 869,572,349,473 935,357,382,409 7.57%
Other Receivables 57,501,290,031 65,803,613,758 14.44%
Inventories 1,427,067,984,707 1,606,123,881,887 12.55%
Other Current Assets 113,686,715,546 114,223,744,576 0.47%
TOTAL CURRENT ASSETS 3,760,007,626,324 4,168,054,836,528 10.85%
TOTAL NON CURRENT ASSETS 1,378,204,880,656 1,535,777,575,370 11.43%
TOTAL ASSETS 5,138,212,506,980 5,703,832,411,898 11.01%
FY 2008 (Audited)FY 2007 (Audited) % Change

Excellence and Alignment
Consolidated Balance Sheets
47
Note : Financial figures based on Audited Consolidated Financial Statements for Year Ended on December 31, 2008.
LIABILITIES
CURENT LIABILITIES
Short-term Loans 43,716,669,680 145,888,622,451 233.71%
Trade Payables 328,290,780,126 305,567,569,948 -6.92%
Taxes Payable 127,041,938,910 177,900,635,770 40.03%
Accrued Expenses 207,403,837,295 269,366,487,438 29.88%
Other Payables 45,740,153,224 92,524,190,230 102.28%
Current Maturities of Long-term Debts
Bonds payable, net - 258,550,034,422
Obligations under capital leases 2,435,734,819 574,290,696 -76.42%
TOTAL CURRENT LIABILITIES 754,629,114,054 1,250,371,830,955 65.69%
TOTAL NON CURRENT LIABILITIES 366,559,019,698 108,618,099,637 -70.37%
MINORITY INTEREST 629,811,540,114 722,136,665,972 14.66%
EQUITY
Capital stock
Issuued and fully paid - 10,156,014,422 shares 507,800,721,100 507,800,721,100 0.00%
Additional paid-in capital 2,640,000,000 2,640,000,000 0.00%
Retained earnings
Appropriated 26,032,253,263 33,089,195,230 27.11%
Unappropriated 3,075,956,684,267 3,684,440,514,806 19.78%
Treasury stock - 576,798,500 shares in 2008
and 170,754,500 shares in 2007 (218,311,325,616) (569,510,784,185) 160.87%
Others (7,256,391,786) (36,060,493,452) 396.95%
SHAREHOLDER'S EQUITY NET 3,386,861,941,228 3,622,399,153,499 6.95%
TOTAL LIABILITIES & SHAREHOLDER'S EQUITY 5,138,212,506,980 5,703,832,411,898 11.01%
FY 2008 (Audited)FY 2007 (Audited) % Change

Excellence and Alignment
Consolidated Statements of Cash Flows
48
Note : Financial figures based on Audited Consolidated Financial Statements for Year Ended on December 31, 2008.
CASH FLOWS FROM OPERATING ACTIVITIES
Cash received from customers 6,962,234,826,198 7,804,970,069,835 12.10%
Cash paid to suppliers and employees (4,423,686,203,531) (4,505,841,240,394) 1.86%
Cash provided by operations 2,538,548,622,667 3,299,128,829,441 29.96%
Receipts of claims for income tax refund 12,186,681,704 8,049,202,297 -33.95%
Payments of advertising, exhibition, and promotion expenses (970,452,832,884) (1,063,640,714,293) 9.60%
Payments of income taxes (401,616,894,337) (356,142,206,993) -11.32%
Payments for other operating expenses, net (815,767,338,304) (1,079,694,575,108) 32.35%
Net Cash Provided by Operating Activities 362,898,238,846 807,700,535,344 122.57%
FY 2008 (Audited)FY 2007 (Audited) % Change

Excellence and Alignment
Consolidated Statements of Cash Flows
49
Note : Financial figures based on Audited Consolidated Financial Statements for Year Ended on December 31, 2008.
FY 2008 (Audited)FY 2007 (Audited) % ChangeCASH FLOWS FROM INVESTING ACTIVITIES
Proceeds from sales of short-term investments
and time deposits 883,224,708,073 460,518,817,622 -47.86%
Interest income received 70,719,155,436 56,492,357,164 -20.12%
Proceeds from sales of property and equipment 24,829,307,166 10,172,535,153 -59.03%
Placements in short-term investments
and time deposits (796,516,017,307) (408,425,696,543) -48.72%
Acquisitions of property, plant and equipment (224,597,075,433) (305,198,137,295) 35.89%
Receipts from other investing activities, net 68,838,853 215,179,709 212.58%
Net Cash Used in Investing Activities (42,271,083,212) (186,224,944,190) 340.55%
CASH FLOWS FROM FINANCING ACTIVITIES
Proceeds from bank loans 101,250,782,299 292,853,342,945 189.24%
Receipts of capital contributions from Subsidiaries minority
shareholders 500,000,000
Buyback of shares (218,311,325,616) (351,199,458,569) 60.87%
Payments of bank loans (145,891,720,137) (190,681,390,174) 30.70%
Payments of cash dividend (126,490,247,078) (123,439,539,404) -2.41%
Payments of interest expense (54,942,128,859) (55,354,893,471) 0.75%
Re-purchase of bonds (21,000,000,000) (9,851,000,000) -53.09%
Payments of obligation under capital leases (8,404,828,300) (2,526,845,665) -69.94%
Net Cash Used in Financing Activities (473,789,467,691) (439,699,784,338) -7.20%
NET INCREASE (DECREASE) IN CASH AND CASH EQUIVALENT (153,162,312,057) 181,775,806,816 -218.68%
CASH AND CASH EQUIVALENTS AT BEGINNING OF YEAR 1,261,454,016,042 1,116,346,134,197 -11.50%
CASH AND CASH EQUIVALENTS AT END OF YEAR 1,116,346,134,197 1,321,797,625,299 18.40%

Excellence and Alignment
Corporate SubsidiariesPharmaceuticals & Consumer Health
Bintang Toedjoe
99.90% ownership
Dankos Farma
99.98% ownership
Hexpharm Jaya Labs
99.60% ownership
Finusolprima Farma
99.988% ownership
Innogene Kalbiotech Pte. Ltd
90.79% ownership
Saka Farma Labs
80.00% ownership
Kalbe International Pte. Ltd
100.00% ownership
Kalbe Vision Pte. Ltd
100.00% ownership
Orange Kalbe Ltd
30.00% ownership
Cordlife Indoneisa
30.00% ownership
Pharma Metric Labs
34.45% ownership
Bifarma Adiluhung
99.20% ownership
Nutritionals
Sanghiang Perkasa
99.99% ownership
Kalbe Morinaga
70.00% ownership
EPMT
58.19% ownership
Milenia Dharma Insani
57.61% ownership
Tri Sapta Jaya
58.18% ownership
Enseval Medika Prima
57.61% ownership
Global Chemindo Megatrading
58.18% ownership
Renalmed Tiara Utama
58.18% ownership
Distribution
Indogravure
24.61% ownership
Avesta Continental Pack
48.25% ownership
Kageo
63.10% ownership
Packaging
Note: Figures represent effective ownership
50

Excellence and Alignment51
For further information, please contact:
Vidjongtius
Corporate Secretary
PT Kalbe Farma Tbk.
Jl. Let. Jend. Suprapto Kav.4
Jakarta 10510
Telp: (021) 428-73888
Fax: (021) 428-73680
Email: [email protected]
Website: www.kalbe.co.id
Thank You


