41
Full year + fourth quarter results 2018 ams Alexander Everke, CEO Michael Wachsler-Markowitsch, CFO Moritz M. Gmeiner, Head of IR February 2019

Full year + fourth quarter results 2018
ams
Alexander Everke, CEO
Michael Wachsler-Markowitsch, CFO
Moritz M. Gmeiner, Head of IR
February 2019

Sensing is life.
ams at a glance
Our business
• Focused on high performance sensor solutions
• Sensor solutions, sensor ICs/sensor interfaces, related algorithms and software
• Small scale, low-power, highest sensitivity, tight integration
• Best-in-class solutions for leading OEMs
Our end markets
• Consumer (C) – FY 2018 76% of revenues
• Automotive, Industrial, Medical (AIM) – FY 2018 24% of revenues
By the numbers
• More than 1,200 engineers
• Around 10,000 employees worldwide
• 21 design centers, 3 manufacturing locations
• More than 35 years of design and manufacturing know-how
• Over 8,000 customers
© ams AG
Page 2

Sensors – an integral part of the digital transformation
Sensing enables life
© ams AG
Page 3
Autonomous
driving
Smart home & building
Infrastructure automationIndustrial IoT
Human/machine interface
Personal health
Augmented reality
Smart consumer devices
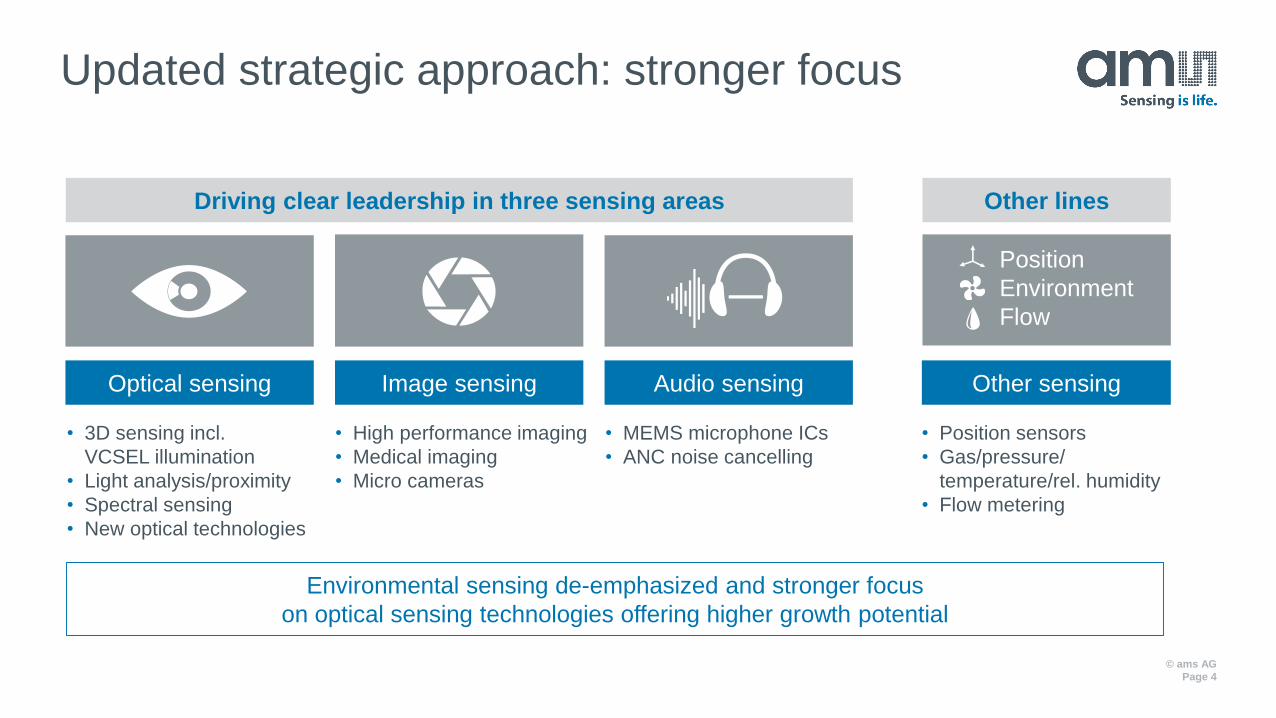
Driving clear leadership in three sensing areas
Updated strategic approach: stronger focus
© ams AG
Page 4
• 3D sensing incl.
VCSEL illumination
• Light analysis/proximity
• Spectral sensing
• New optical technologies
• High performance imaging
• Medical imaging
• Micro cameras
• MEMS microphone ICs
• ANC noise cancelling
Environmental sensing de-emphasized and stronger focus
on optical sensing technologies offering higher growth potential
Optical sensing Image sensing Audio sensing Other sensing
Other lines
Position
Environment
Flow
• Position sensors
• Gas/pressure/
temperature/rel. humidity
• Flow metering

ams strategy
© ams AG
Page 5
Building the global leader in sensor solutions
True leadership in
three sensor areas
• Optical
• Imaging
• Audio
Best-in-class performance per
sensor area and in sensor
system solutions
• Miniaturization and integration
− Sensor modules
− Monolithic integration
• Sensor algorithms and
sensor fusion software
• Application software for
differentiating end-user
experiences
Diversified business with
balanced application and
customer portfolio
• Long-term target mix of
60/40 split C/AIM
• Build broader customer
base in each application
• Establish strong
distribution channel
Financial model enabling
long-term growth
• Focus on profitable growth
• Build strong margin profile
across end markets

2018: strong growth, more volatile end markets
© ams AG
Page 6
Significant revenue growth, again driven by large smartphone ramps in second half
• Record FY 2018 revenues USD 1,627m (34% growth year-on-year), EBIT (adj.) USD 146m
End market volatility increasing through 2018, impact from weaker smartphone demand in H2/Q4
• Consumer market/OEM performance more volatile, H2 smartphone demand below expectations leading to Q4 update
Non-consumer markets showing good performance, macro-economic uncertainties increasing towards year-end
• Automotive/industrial/medical successful, strong traction in imaging, trade dispute/macro trends clouding end markets
More focused strategy around leadership in optical, imaging, audio sensing
• Differentiation drives leadership, clear #1 in optical sensing, high but focused R&D in three sensing areas
Leading position in long-term growth market 3D sensing
• Recognized solution expertise, successful illumination focus drives wins, Android adoption started, automotive visible
Major capex investment cycle for optical manufacturing completed
• Expansion to support customer 3D/optical sensing plans, advances in manufacturing, lower capex needs from 2019E

3D sensing leader: recognized solution expertise
© ams AG
Page 7
Leading player across 3D sensing technologies
• Unmatched portfolio of optical technologies, elements and IP
- Highly differentiated VCSEL/VCSEL array illumination
- System and solution design + architecting
- Leading in WLO capabilities, DOE design, optical path
- Advanced eye safety features
- Algorithm + software layer proprietary IP
• Covering structured light (SL), time-of-flight (ToF),
active stereo vision (ASV) 3D sensing, ongoing coexistence of approaches
Recognized industry-leading solution expertise, successful in all three 3D approaches
• Leadership in end-to-end system know-how, front-facing + world-facing expertise
• Illumination focus drives success in all 3D approaches: high volume deployment presence,
significant ramp in H2 2018, several Android wins and ramps 2019E
• Android ASV and ToF system solutions shown at CES, fast time-to-market and optimized
performance through partnerships with Face++, Qualcomm, others
Major position in 3D sensing market
• Key player in consumer market as adoption momentum for SL, TOF, ASV strengthens
• Strong position for large automotive market, supporting Level 2+, mid-term growth driver
Active
Stereo Vision
Structured
Light
Time-of-
Flight
High volume ramp
H2 2018,
Android wins in
SL, TOF, ASV

3D sensing: winning designs, VCSEL leader
© ams AG
Page 8
Design-win momentum in Android consumer 3D, growing 3D portfolio, automotive traction
• VCSEL-based illumination solutions for SL, TOF, ASV
• Android SL wins at Xiaomi + major Chinese smartphone OEM, launched
• Android TOF wins at different Asian OEMs, launching 2019E
• Android ASV solution incl. ams VCSEL illumination and ASV win, launching 2019E
• Industry’s smallest 1D TOF proximity sensor (with lens) for 3D systems
• Major automotive solid-state LIDAR illumination win for leading OEM, additional opportunities
• First in-cabin 3D sensing development progressing, increasing OEM interest
Superior VCSEL technology: high differentiation drives market success and design wins
• Broad VCSEL portfolio for illumination needs in all 3D technologies:
SL aux. and TOF flood illumination, dot projection, 1D TOF proximity, ASV pattern projection
• Best-in-class high power VCSEL/high count VCSEL arrays for 3D
- Smallest pitch higher resolution, lower system cost
- Leading power efficiency up to >60% (lab) vs. typical 45-50% quantum efficiency
- Best beam quality very narrow beam divergence
- True high power from mW to W to 100+W
• External supply chain covers current needs, upcoming internal VCSEL line adds differentiation
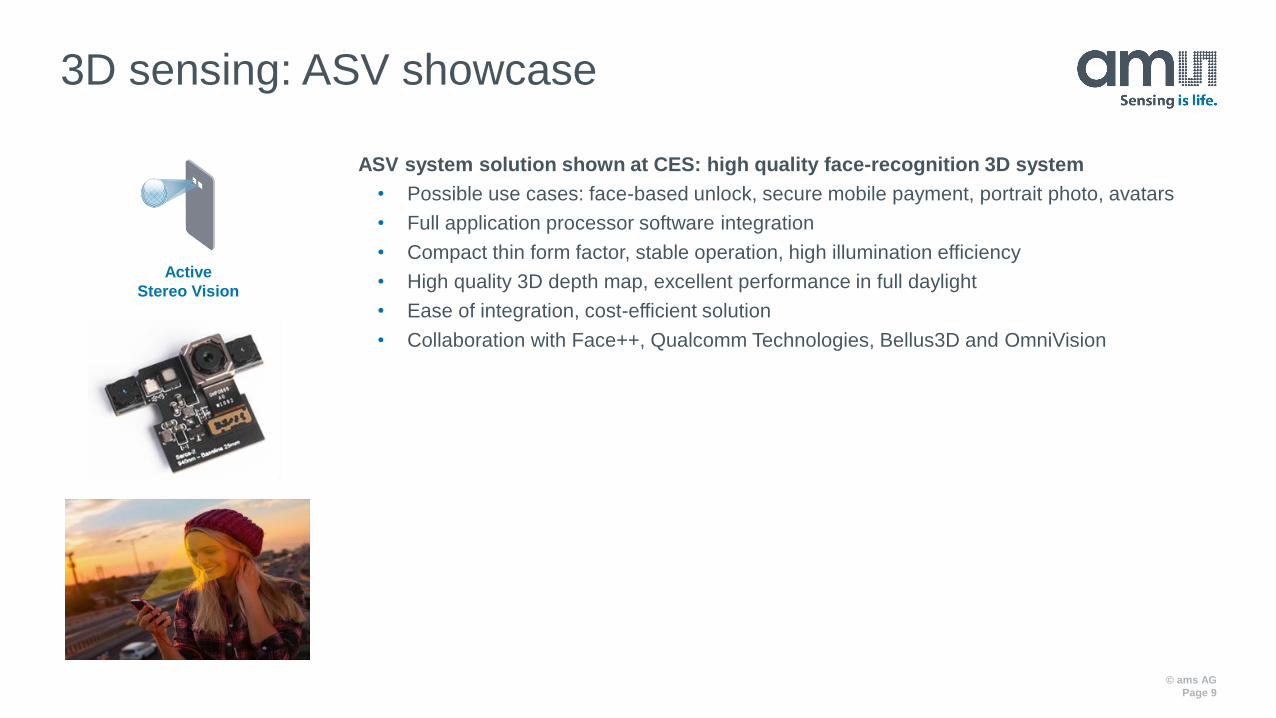
3D sensing: ASV showcase
© ams AG
Page 9
ASV system solution shown at CES: high quality face-recognition 3D system
• Possible use cases: face-based unlock, secure mobile payment, portrait photo, avatars
• Full application processor software integration
• Compact thin form factor, stable operation, high illumination efficiency
• High quality 3D depth map, excellent performance in full daylight
• Ease of integration, cost-efficient solution
• Collaboration with Face++, Qualcomm Technologies, Bellus3D and OmniVision
Active
Stereo Vision

Optical sensing
© ams AG
Page 10
Worldwide leader in light sensing solutions
• Clear #1 in optical sensing
• Leading in sensors, high performance optical systems,
illumination solutions
• High quality optical sensing at Top 15 smartphone OEMs
• Emerging growth markets in automotive + industrial
Broad portfolio: 3D sensing incl. VCSEL, display management, other applications
• 3D sensing expert: recognized for HW, SW and system know-how, attractive partnerships
• High performance 3D/optical sensing VCSELs: consumer wins, automotive mid-term wins
• TrueColor display management: superior user experience
• Innovative behind-OLED light/proximity sensing, color ALS + proximity modules
• Ultra-small proximity sensing for wireless earbuds
New applications emerging, strong growth potential in optical technologies
• Mobile spectral sensing as new content opportunity: high quality color matching (online
shopping, cosmetics), food quality (ripeness), finalizing first consumer solution for 2019
• Optical technologies enable broader growth opportunities across sensing applications
Leadership position,
expanding
optical sensing
applications

Optical sensing: Innovation showcase
© ams AG
Page 11
Behind-OLED light and proximity sensing solution
• Innovation in display management
• Behind-OLED sensing places optical sensor unit
behind the OLED display
• Enables industry trend for maximum screen-to-body ratio
and bezel-less phone designs
• Supports foldable displays and flicker detection for better pictures
• Captures very low levels of light transmitted through OLED, combination of
high sensitivity sensing and high performance algorithms
• First wins in H2 2018, first volume shipments recently started
• Significant OEM interest, new growth opportunity in display management
Innovative solution
for new phone
designs, first
shipments started

Image sensing
© ams AG
Page 12
True leader in advanced image sensing for industrial + medical
• Industrial – Leading provider of global shutter technology
for advanced industrial applications worldwide
• High value global shutter CMOS imaging solutions for
high speed machine vision, inspection, factory automation
• Medical – Global leader in medical imaging sensor solutions
• High performance, cost-optimized systems for computed
tomography (CT) and digital X-ray, growing market position in Asia
• Clearer images at lower radiation dose for better diagnostics in 3D-CT and digital X-ray
• NanEye miniature camera technology for medical endoscopy and industrial
Strong market traction and attractive growth opportunities
• Market success with leading-edge 50MP image sensor for highly advanced industrial cameras
• Very good momentum in NanEye camera solutions
- world’s smallest endoscopy cameras (≤1mm2)
- increasing market traction for disposable medical endoscopes
- new application: eye tracking in glasses
• Imaging roadmap enables innovation for future industrial sensing applications
Attractive growth
trends in high
performance
imaging continue

Audio sensing
© ams AG
Page 13
ANC (active noise cancellation)
• Best-in-class high performance noise reduction (>40dB)
• Clear leader in wired/wireless accessory market
- portfolio of ANC solutions incl. hybrid ANC
- significantly better audio experience
- very low power, very small form factor
• Augmented hearing: higher transparency for speech and music
• Single wire power + communication interface for mobile audio charging POW:COM:
Higher design flexibility for wireless earbud cradles reducing pins from multiple to 2
• Continuing ANC market growth, adding wins in earphones and headphones
MEMS microphone interface ICs
• Market leader in expanding high volume market
• Leading position and broad portfolio, low noise solutions and tight integration
• Ongoing growth in home assistant market continues to drive demand:
expanding range of multi-microphone devices, up to 8 microphones
• Strong customer partnership focused on attractive segments
Robust growth
in MEMS mic ICs
and noise canceling,
market growth
continuing

Hybrid volume manufacturing model
© ams AG
Page 14
Internal: Differentiated manufacturing
Outsourced/external: Standard process manufacturing
Internal front-end wafer manufacturing, Austria
• 8” CMOS/specialty analog to 180nm, 190+k wafers p.a.
• Optical filter production
Internal optical manufacturing and backend + future VCSEL manufacturing, Singapore
• Leader in high-end optical system technologies
• WLO/optical filter production, advanced optical assembly/backend
• Major investment cycle for high volume optical/3D sensing production completed in 2018
• Internal VCSEL capacity investment: 6” 2,000 wspm line for highly differentiated products,
completion in 2019E, expected mass production ramp around year-end 2019
External manufacturing partnerships for scalability and flexibility
• High volume wafer suppliers (TSMC, UMC), standard and semi-custom packaging
• Outsourced VCSEL supply chain: Partnerships for volume manufacturing including
HLJ Technology, supports upcoming VCSEL volume needs
In-house test, Philippines/Austria
Major capex cycle
completed,
very strong capex
decline expected
for 2019
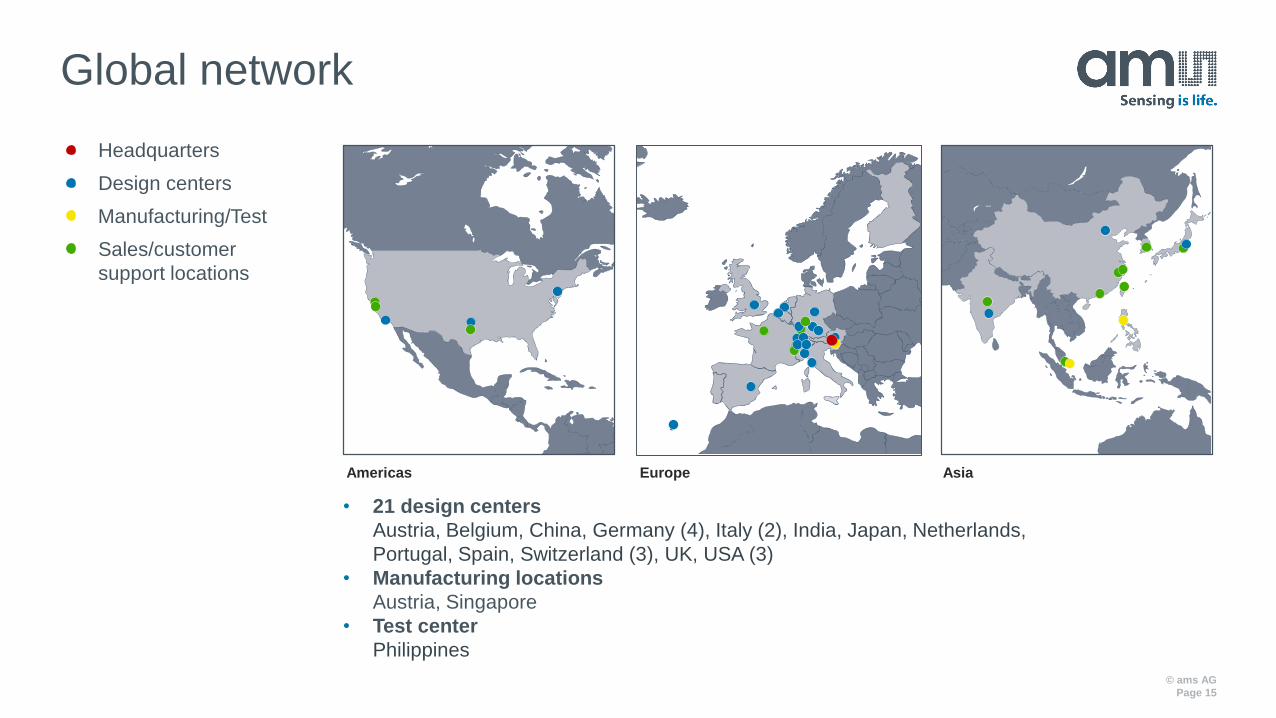
Global network
Americas Europe Asia
• 21 design centers
Austria, Belgium, China, Germany (4), Italy (2), India, Japan, Netherlands,
Portugal, Spain, Switzerland (3), UK, USA (3)
• Manufacturing locations
Austria, Singapore
• Test center
Philippines
Headquarters
Design centers
Manufacturing/Test
Sales/customer
support locations
© ams AG
Page 15

Financial results

USDm
Key figures
2018 2017 Q4 2018 Q4 2017
Total revenues 1,627.4
+34.1%
1,213.8 491.4
-8.4%
536.6
Gross margin (adjusted) 1)
f (IFRS reported)
32%
27%
43%
39%
35%
28%
44%
40%
Result from operations (adjusted) 1)
(EBIT) (IFRS reported)
145.6
14.7
192.5
86.7
61.9
8.9
146.6
114.9
Net result (adjusted) 3)
(IFRS reported)
12.1
106.6
145.5
101.3
1.7
1.4
161.3
117.0
EPS (basic/diluted) (adjusted) 3) CHF2)
USD2)
0.15 / 0.14
0.15 / 0.13
1.74 / 1.63
1.78 / 1.67
0.02 / 0.02
0.02 / 0.02
2.00 / 1.87
1.96 / 1.83
EPS (basic/diluted) (IFRS reported) CHF2)
USD2)
1.34 / 0.72
1.30 / 0.70
1.21 / 1.12
1.24 / 1.15
0.01 / 0.01
0.01 / 0.01
1.45 / 1.34
1.42 / 1.31
1) Excl. acquisition-related, one-time restructuring and share-based compensation costs 2) Earnings per share in CHF were converted using the average currency exchange rate for the respective periods3) Net result and earnings per share excluding valuation effect of the option element of the issued USD convertible bond
© ams AG
Page 17

Financial results
P&L
Balance sheet
Cash flow

Total revenues
© ams AG
Page 19
USDm
1,213.8
1,627.4
0
250
500
750
1,000
1,250
1,500
1,750
2017 2018
+ 34%
• Strong revenue growth for full year 2018 even with Q4 2018 lower than originally expected
• Q4 2018 reflects unfavorable consumer market environment and subdued smartphone demand
536.6
491.4
0
100
200
300
400
500
600
Q4 2017 Q4 2018
-8%
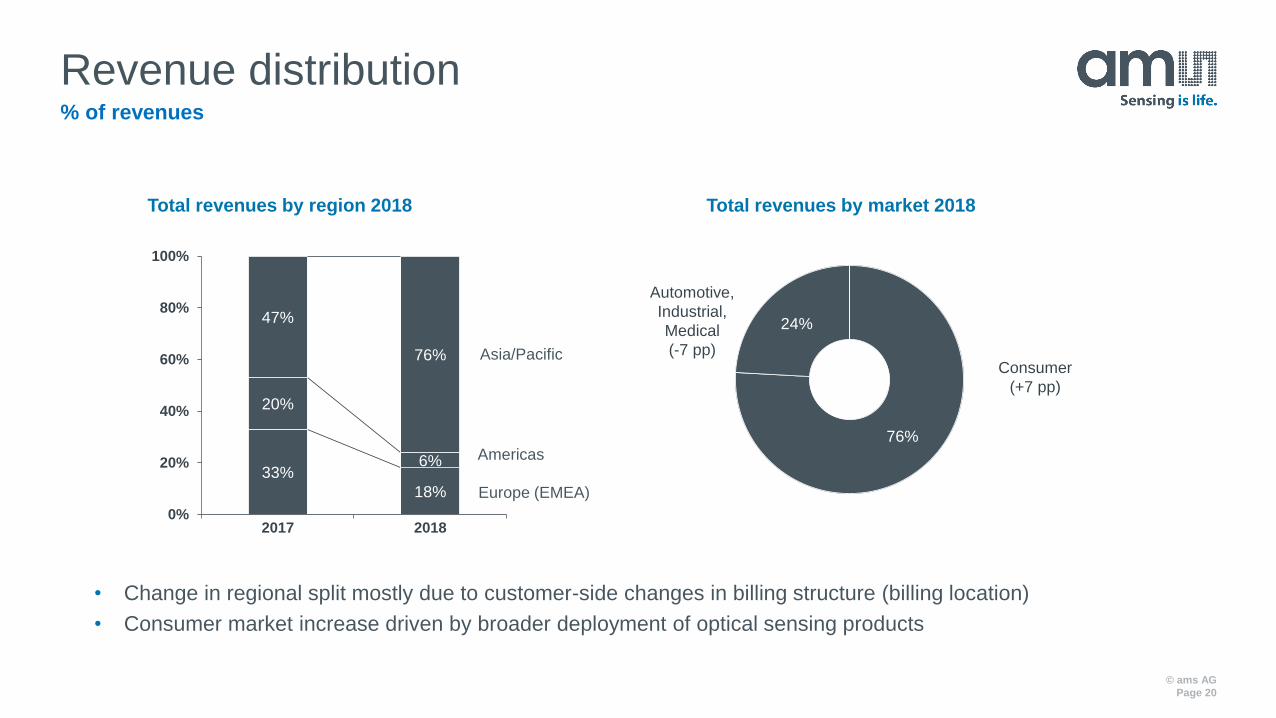
Revenue distribution
© ams AG
Page 20
% of revenues
• Change in regional split mostly due to customer-side changes in billing structure (billing location)
• Consumer market increase driven by broader deployment of optical sensing products
Europe (EMEA)
Asia/Pacific
Americas
Total revenues by region 2018
33%
18%
20%
6%
47%
76%
0%
20%
40%
60%
80%
100%
2017 2018
76%
24%
Automotive,
Industrial,
Medical
(-7 pp)Consumer
(+7 pp)
Total revenues by market 2018

Total backlog
© ams AG
Page 21
USDm
• Backlog at year-end 2018 reflects unfavorable market environment, lower smartphone demand, typical seasonality
618.3
333.0
0
150
300
450
600
750
Dec 31 2017 Dec 31 2018
1)
Consignment
stock agreements
approx. USD 12-17m- 46%
1) incl. certain forecasted commitments

Gross profit / gross profit margin
© ams AG
Page 22
USDm, % of revenues, adjusted1)
• Gross profit margin development reflects product mix, strong underutilization of Singapore production in H1 2018
• Gross profit margin IFRS: 2018: 27.2%, Q4 2018: 28.2%
522.1 515.4
43.0%
31.7%
0
100
200
300
400
500
600
700
2017 2018
1) excl. acquisition-related, one-time restructuring, share-based compensation costs / one-time Q4 2018 restructuring cost regarding customer-related equipment (USD 24.6m)
233.7
174.0
43.5%
35.4%
0
50
100
150
200
250
300
Q4 2017 Q4 2018
-26%
-1%

R&D expenses
© ams AG
Page 23
USDm, % of revenues
• High R&D investments continued through 2018 for large projects in consumer and non-consumer markets
• Substantial decrease in 2018 relative R&D spending, Q4 2018 shows year-end effects
244.2
272.8
20.1%16.8%
0
50
100
150
200
250
300
350
2017 2018
67.3
90.6
12.5% 18.4%
0
25
50
75
100
125
Q4 2017 Q4 2018
+ 12%
+ 35%

SG&A expenses
© ams AG
Page 24
USDm, % of revenues
• SG&A spending includes very selective improvements of organizational structure and global sales team
• Significant decrease in relative SG&A spending showing cost discipline
158.9 162.1
13.1%10.0%
0
50
100
150
200
250
300
350
2017 2018
46.238.9
8.6%7.9%
0
25
50
75
100
125
Q4 2017 Q4 2018
+ 2%
- 16%

Results from operations (EBIT)
© ams AG
Page 25
USDm, % of revenues, adjusted1)
• EBIT reflects gross profitability given H1 2018 underutilization and Q4 2018 lower demand plus Q4 2018 R&D effect
• EBIT (EBIT margin) IFRS: 2018 USD 14.7m (0.9%), Q4 2018 USD 8.9m (1.8%)
192.5
145.6
15.9%
8.9%
0
50
100
150
200
250
2017 2018
146.6
61.9
27.3%
12.6%
0
25
50
75
100
125
150
175
Q4 2017 Q4 2018
- 58%
- 24%
1) excl. acquisition-related, one-time restructuring, share-based compensation costs / one-time Q4 2018 restructuring cost regarding customer-related equipment
and reorganization of the environmental sensing business (total USD 29.6m)

Net financial result
© ams AG
Page 26
USDm
• FY 2018 result due to major impact of USD convertible bond option component valuation effects
• Q4 2018 reflects increased debt and balance sheet revaluation effects
-2.5
89.5
-20
0
20
40
60
80
100
2017 2018
+ 3,639%
-12.6
-17.1
-20
-15
-10
-5
0
5
Q4 2017 Q4 2018
- 35%

Tax expense
© ams AG
Page 27
USDm, tax rate: % of result before tax (PBT)
-17.1
-2.4
-20.4%
-2.3%
-25
-20
-15
-10
-5
0
2017 2018
Tax rate
-14.8
-9.3
-14.5%-114.0%
-20
-16
-12
-8
-4
0
Q4 2017 Q4 2018
• Negative tax expense 2018 predominantly due to unwinding of historic tax structure and released tax provisions

Net income / earnings per share
© ams AG
Page 28
USDm, earnings per share (EPS) in CHF and USD (basic/diluted), adjusted1)
145.5
12.10
25
50
75
100
125
150
175
2017 2018
CHF 1.74 / 1.63USD 1.78 / 1.67
- 92%
CHF 0.15 / 0.14USD 0.15 / 0.13
161.3
1.70
25
50
75
100
125
150
175
Q4 2017 Q4 2018
CHF 2.00 / 1.87USD 1.96 / 1.83
- 99%
CHF 0.02 / 0.02USD 0.02 / 0.02
• Adjusted net income significantly impacted by considerable valuation effect of option element of USD convertible
• Net income reported: FY 2018 USD 106.6m, Q4 2018 USD 1.1m
• EPS reported (basic/diluted): 2018 CHF 1.34/0.72, USD 1.14/0.61, Q4 2018 CHF 0.01/0.01, USD 0.01/0.01
1) Excl. valuation effect of the option element of the issued USD convertible bond

Financial results
P&L
Balance sheet
Cash flow

Working capital
© ams AG
Page 30
USDm
• Positive working capital management in light of strong business growth
• Inventories includes year-end 2018 effects from current demand environment
262.8
291.0
0
50
100
150
200
250
300
350
Dec 31 2017 Dec 31 2018
Working capital at year-end
2018 2017
Trade receivables 138.1 325.0
+ Inventories 353.6 289.7
- Trade liabilities 200.7 351.8
Working capital 291.0 262.8
in % of revenues 18% 22%
+ 11%

987.9
1,362.2
25.4%
36.1%
0
250
500
750
1,000
1,250
1,500
Dec 31 2017 Dec 31 2018
Net debt, cash and short-term investments
© ams AG
Page 31
USDm, % of total liabilities
• Net debt increase in 2018 largely driven by convertible bond and further capacity investments in Singapore
• Increase in cash and cash equivalents reflects strong H2 cash generation and lower H2 CAPEX
447.7
713.3
0
200
400
600
800
Dec 31 2017 Dec 31 2018
Net debt, equity ratio Cash and short-term investments
Equity ratio
+ 38%
+ 59%
Financial results
P&L
Balance sheet
Cash flow

Cash flow from operations
© ams AG
Page 33
USDm, % of revenues
• Positive cash flow development for FY 2018
• Strong Q4 2018 cash flow helped by lower CAPEX, high Q4 2018 free cash flow of USD 226m
-4.1
359.9
-0.3%
22.1%
-50
0
50
100
150
200
250
300
350
400
450
2017 2018
40.9
293.5
7.6%
59.7%
0
50
100
150
200
250
300
350
Q4 2017 Q4 2018
Cash flow as % of revenues
+ 8,978%
+ 618%

Capital expenditures
© ams AG
Page 34
USDm, % of revenues – Acquisition of intangibles, property, plant and equipment
• High 2018 capital expenditures to expand production capacity predominantly at Singapore sites
• Q4 2018 reflects expected slowdown of CAPEX as significant investment cycle is completed
663.9
471.2
54.7%
29.0%
0
200
400
600
800
2017 2018
- 29%
234.4
47.5
43.7%
9.7%
0
50
100
150
200
250
300
Q4 2017 Q4 2018
Capital expenditures as % of revenues
- 80%

Shaping the world with sensor solutions
Company highlights

Outlook
© ams AG
Page 36
Q1 2019 outlook
• Revenues expected to reflect the current more unfavorable end market environment and
subdued smartphone demand in addition to characteristic first quarter consumer market seasonality
• Expected first quarter revenues of USD 350-390 million based on available information
• Driven by lower expected production volumes in the consumer business in the first quarter,
adjusted operating (EBIT) margin expected in the low single-digit percentage range
• Experiencing growing end market volatility, customer performance that is becoming
more difficult to anticipate, and ongoing uncertainty regarding end market demand trends,
industry development, and the macro-economic environment
• Decision to continue to provide detailed guidance for the relevant upcoming quarter going forward
and discontinue other numerical guidance

ams highlights
© ams AG
Page 37
• Successful strategy to drive clear leadership in three strategic sensing areas: optical, imaging, audio
• Addressing sensing megatrends through ongoing R&D investments as basis for longer-term growth
• Key success factors: differentiation, innovation, high performance and “solution play” capabilities
• Focused on building diversified business in consumer and non-consumer markets
• Major investment cycle completed in 2018, significantly lower capex expected for 2019 and going forward
• Focus on solid financial base and improving balance sheet
• Strongly positioned for long-term profitable growth opportunities in exciting area of technology sector

Appendix

Profit and loss statement
© ams AG
Page 39
USDm
(IFRS) 2018 2017 Q4 2018 Q4 2017
Total revenues
• Products
• Foundry
1,627.4
1,575.4
52.0
1,213.7
1,154.9
58.9
491.4
476.3
15.1
536.6
522.8
13.9
Gross profit• Gross margin (adjusted 1))
• Gross margin (IFRS reported)
442.631.7%
27.2%
467.643.0%
38.5%
138.335.4%
28.2%
217.343.5%
40.5%
Research and development
Selling, general and administrative
Other operating income/expenses
-272.8
-162.1
7.6
- 244.2
- 158.9
22.2
-90.6
-38.9
0.2
- 67.3
- 46.2
11.2
Result from operations (EBIT)• EBIT margin (adjusted 1))
• EBIT margin (IFRS reported)
14.78.9%
0.9%
86.615.9%
7.1%
8.912.6%
1.8%
114.927.3%
21.4%
Net financing costs 89.5 -2.5 -17.1 -12.6
Result before tax
Income tax result
104.2
2.4
84.1
17.1
-8.2
9.3
102.2
14.8
Net result (adjusted 2))
Net result (IFRS reported)
12.1
106.6
145.5
101.3
1.7
1.1
161.3
117.0
1) Excl. acquisition-related, one-time restructuring and share-based compensation costs2) Net result excluding valuation effect of the option element of the issued convertible bond
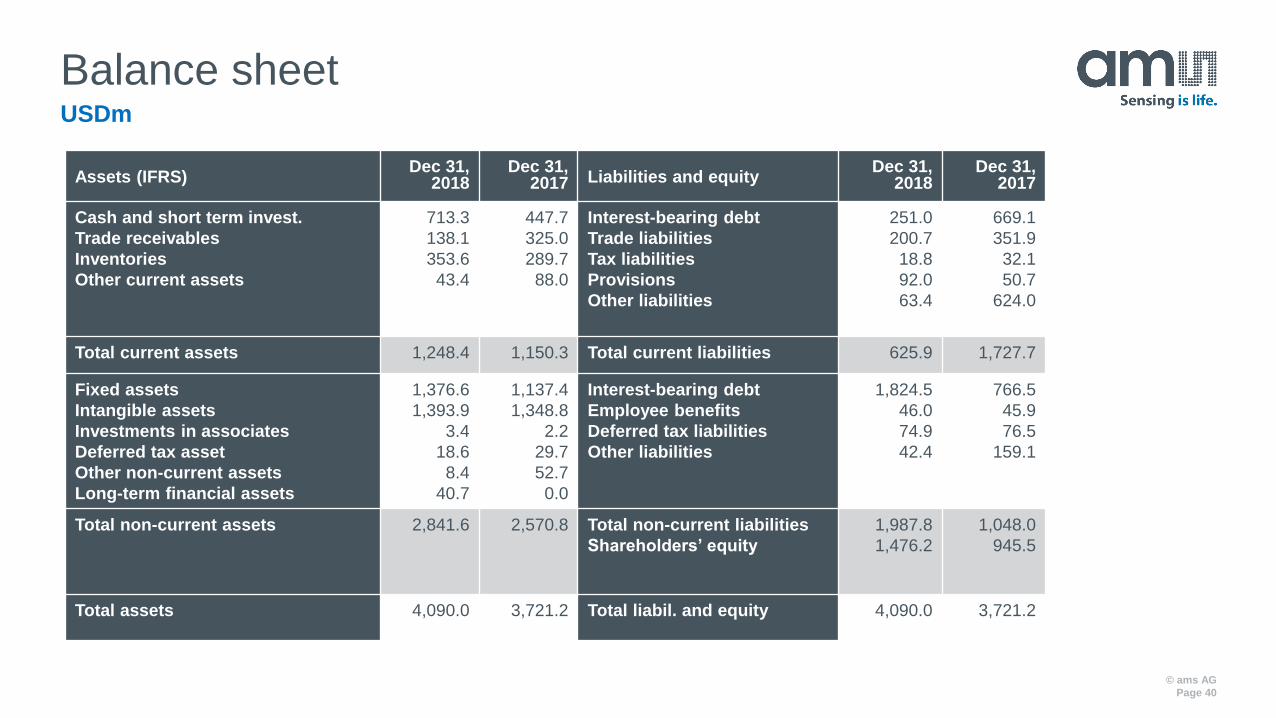
Balance sheet
© ams AG
Page 40
USDm
Assets (IFRS)Dec 31,
2018Dec 31,
2017 Liabilities and equityDec 31,
2018Dec 31,
2017
Cash and short term invest.
Trade receivables
Inventories
Other current assets
713.3
138.1
353.6
43.4
447.7
325.0
289.7
88.0
Interest-bearing debt
Trade liabilities
Tax liabilities
Provisions
Other liabilities
251.0
200.7
18.8
92.0
63.4
669.1
351.9
32.1
50.7
624.0
Total current assets 1,248.4 1,150.3 Total current liabilities 625.9 1,727.7
Fixed assets
Intangible assets
Investments in associates
Deferred tax asset
Other non-current assets
Long-term financial assets
1,376.6
1,393.9
3.4
18.6
8.4
40.7
1,137.4
1,348.8
2.2
29.7
52.7
0.0
Interest-bearing debt
Employee benefits
Deferred tax liabilities
Other liabilities
1,824.5
46.0
74.9
42.4
766.5
45.9
76.5
159.1
Total non-current assets 2,841.6 2,570.8 Total non-current liabilities
Shareholders’ equity
1,987.8
1,476.2
1,048.0
945.5
Total assets 4,090.0 3,721.2 Total liabil. and equity 4,090.0 3,721.2

Cash flow statement
© ams AG
Page 41
USDm
(IFRS) 2018 2017 Q4 2018 Q4 2017
Result before tax
Depreciation
104.2
242.6
84.1
169.4
-8.2
68.0
102.2
53.1
Cash flow from operations 359.9 -4.1 293.5 40.9
Capital expenditures -471.2 -663.9 -47.5 -234.4
Cash flow from investing activities -473.1 -587.4 -46.1 -223.2
Proceeds from borrowings
Proceeds from issue of convertible bond
Repayment of debt
Dividends paid
Changes resulting from capital increase
375.9
698.3
-361.6
-31.5
0.0
785.0
339.9
-172.0
-28.6
0.0
132.5
0.0
-12.8
0.0
0.0
114.7
0.0
0.0
0.0
0.0
Cash flow from financing activities 463.8 784.7 95.2 48.8
Change in cash and cash equivalents(incl. effects of changes in foreign exchange rates)
347.8 166.6 342.1 -136.2
Cash and cash equivalents at end of period 713.3 329.0 713.3 329.0


