56
FULL YEAR RESULTS 2017

FULL YEAR RESULTS 2017

2© SGS SA 2018 ALL RIGHTS RESERVED
FULL-YEAR RESULTS PRESENTATION 23 JANUARY 2018
DISCLAIMER
Certain matters discussed in this presentation may constitute forward-looking statements that are neither historical facts nor guarantees of future performance. Because these statements involve risks and uncertainties that are beyond control or estimation of SGS, there are important factors that could cause actual results to differ materially from those expressed or implied by these forward-looking statements. These statements speak only as of the date of this document. Except as required by any applicable law or regulation, SGS expressly disclaims any obligation to release publicly any updates or revisions to any forward-looking statements contained herein to reflect any change in SGS Group’s expectations with regard thereto or any change in events or conditions on which any such statements are based.

HIGHLIGHTS FINANCIAL REVIEW
BUSINESS REVIEW
OUTLOOK Q&A APPENDIX

4© SGS SA 2018 ALL RIGHTS RESERVED
1. Constant currency basis. – 2. Before amortisation of acquired intangibles and non-recurring items. – 3. Profit for the period / (Non-current assets + Net Working Capital).
2017 HIGHLIGHTS
5.4% 1
CHF 6.3 BNFX 0.7%
15.3%
CHF 969 MIO5.4% 1
21.3%
19.3%CHF 987 MIO
(2.7)%
CHF 75CHF 70
REVENUE GROWTH
PROFIT FOR THE PERIOD
ADJUSTED OPERATING INCOME MARGIN2
CASH FLOW FROM OPERATIONS
ROIC3 IN %
PROPOSED DIVIDEND
CHF 664 MIO
13.3%
FULL-YEAR RESULTS PRESENTATION 23 JANUARY 2018

5© SGS SA 2018 ALL RIGHTS RESERVED
2017 ACQUISITIONS AND SUBSEQUENT EVENTS
WIN SERVICES PTY LTD AND LEADERSHIP DIRECTIONS PTY LTD.
AUSTRALIA
THE GOVMARK TESTING SERVICES, INC.
USA
GEOSTRADA
SOUTH AFRICA
CTR CONSULTING TESTING RESEARCH SRL
ITALY
MACO CUSTOMS SERVICE
THE NETHERLANDS
SGS LEICESTER LTD.
UNITED KINGDOM
BIOVISION SEED RESEARCH LIMITED (BIOVISION)
CANADA
CENTRAL ILLINOIS GRAIN INSPECTION, INC.
USA
FULL-YEAR RESULTS PRESENTATION 23 JANUARY 2018
ACQUISITIONS

6© SGS SA 2018 ALL RIGHTS RESERVED
2017 ACQUISITIONS AND SUBSEQUENT EVENTS
BF MACHINERY PTY LTD AND CBF ENGINEERING PTY LTD.AUSTRALIA
LABORATOIRE LCA
MOROCCO
FULL-YEAR RESULTS PRESENTATION 23 JANUARY 2018
ILC MICRO-CHEM, INC.
CANADA
HARRISON RESEARCH LABORATORIES, INC.
USA
LABORATOIRE DE CONTRÔLE ET D’ANALYSE
BELGIUM
VANGUARD SCIENCES
USA
ACQUISITIONS SUBSEQUENT EVENTS

7© SGS SA 2018 ALL RIGHTS RESERVED
EUROPE, AFRICA AND MIDDLE EAST
AMERICAS
ASIA PACIFIC
1. End of period.
95 700 EMPLOYEES1 AND 2 400 LOCATIONS AROUND THE GLOBE
480
23 100
1 400
39 700
520
32 900
Locations
Employees
FULL-YEAR RESULTS PRESENTATION 23 JANUARY 2018

HIGHLIGHTS FINANCIAL REVIEW
BUSINESS REVIEW
OUTLOOK Q&A APPENDIX

9© SGS SA 2018 ALL RIGHTS RESERVED
1. Before amortisation of acquired intangibles and non-recurring items. – 2. Constant currency basis.
2017 FINANCIAL HIGHLIGHTS
(CHF million) DECEMBER 2017DECEMBER 2016
PRO-FORMA2 DECEMBER 2016
REVENUE 6 349 6 025 5 985Change in % 5.4 6.1
ADJUSTED OPERATING INCOME1 969 919 919Change in % 5.4 5.4
ADJUSTED OPERATING INCOME MARGIN1 IN % 15.3 15.3 15.4
OPERATING INCOME (EBIT) 894 816 816Change in % 9.6 9.6
OPERATING INCOME (EBIT) MARGIN IN % 14.1 13.5 13.6
PROFIT FOR THE PERIOD 664 587 586Change in % 13.1 13.3
PROFIT ATTRIBUTABLE TO EQUITY HOLDERS OF SGS SA 621 544 543
Change in % 14.2 14.4
BASIC EPS (CHF) 82.41 71.66 71.54
ADJUSTED BASIC EPS (CHF)1 91.74 83.13 83.00
FULL-YEAR RESULTS PRESENTATION 23 JANUARY 2018

REVENUE
ADJUSTED OPERATING INCOME
BALANCE SHEET
CASH FLOW
CURRENCY
SECOND HALF 2017
HIGHLIGHTS FINANCIAL REVIEW
BUSINESS REVIEW
OUTLOOK Q&A APPENDIX

11© SGS SA 2018 ALL RIGHTS RESERVED
2017 REVENUE GROWTH COMPOSITION
REVENUE DECEMBER 2016
CHF MIO
2016
ORGANIC
2.5%
ACQUISITIONS
3.5%
DISPOSALS
0.0%
CURRENCY IMPACT
(1.2)%
REVENUE DECEMBER 2017
4.8%
5 985
72252
- 40 6 349
4.2% 0.0% 1.2% 0.7% 6.1%
Constant currency growth: 5.4%
FULL-YEAR RESULTS PRESENTATION 23 JANUARY 2018

12© SGS SA 2018 ALL RIGHTS RESERVED
2017 BUSINESS PORTFOLIO
4.2%GIS
(0.2)% 0.3% 16.0%AFL
17.9%OGC
10.8%MIN
8.6%TRP
0.5%0.1%
7.6%EHS
(0.2)%
(0.4)%14.3%IND
(0.8)%
5.4%CBE
0.0% 0.7% 15.2%CRS
2017 REVENUE
Change1 Change1
1. Constant currency basis. FULL-YEAR RESULTS PRESENTATION 23 JANUARY 2018

13© SGS SA 2018 ALL RIGHTS RESERVED
0.4%
1.7%
1. Constant currency basis.
2017 REVENUE GROWTH1 BY BUSINESS
AFL
MIN
OGC
CRS
CBE
IND
EHS
TRP
GIS
TOTAL
Organic Acquisitions
2.6%
1.2%
0.2%
(2.6)%
6.7%
7.6%
0.2%4.7%
1.3%
11.4%
0.7%0.1%
4.2%
GROWTH
2017 20167.7%
5.6%
3.2%
10.4%
4.9%
0.0%
3.0%
11.6%
0.8%
5.4%
6.1%
2.6%
(2.1)%
6.3%
9.1%
5.5%
23.6%
12.9%
10.0%
6.0%
FULL-YEAR RESULTS PRESENTATION 23 JANUARY 2018
5.2%
3.2%
2.8%
1.0%

14© SGS SA 2018 ALL RIGHTS RESERVED
2017 REVENUE GROWTH1 BY REGION
EUROPE / AFRICA / MIDDLE EAST
AMERICAS
ASIA PACIFIC
TOTAL GROUP
1.7%
1.2%
Organic Acquisitions
Revenue %
1. Constant currency basis.
3.5%
2.9%
1.6%6.3%
4.2%
2017 2016
GROWTH
4.2%
4.6%
7.9%
5.4%
5.2%
9.6%
4.5%
6.0%
FULL-YEAR RESULTS PRESENTATION 23 JANUARY 2018
0.7%
15© SGS SA 2018 ALL RIGHTS RESERVED
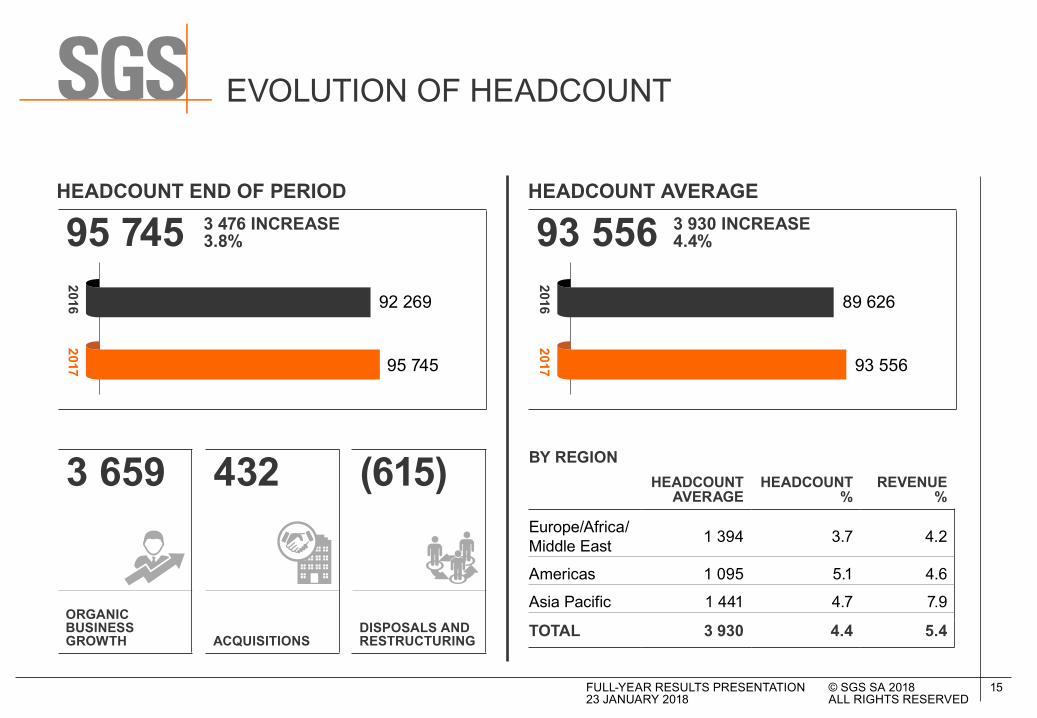
EVOLUTION OF HEADCOUNT
HEADCOUNT END OF PERIOD
3 659 432 (615)
HEADCOUNT AVERAGE
2016
2016
2017
2017
89 62692 269
93 55695 745
93 55695 745
HEADCOUNT AVERAGE
HEADCOUNT %
REVENUE %
Europe/Africa/ Middle East 1 394 3.7 4.2
Americas 1 095 5.1 4.6
Asia Pacific 1 441 4.7 7.9
TOTAL 3 930 4.4 5.4
BY REGION
3 930 INCREASE4.4%
3 476 INCREASE3.8%
ORGANIC BUSINESS GROWTH ACQUISITIONS
DISPOSALS AND RESTRUCTURING
FULL-YEAR RESULTS PRESENTATION 23 JANUARY 2018

HIGHLIGHTS FINANCIAL REVIEW
BUSINESS REVIEW
OUTLOOK Q&A APPENDIX
REVENUE
ADJUSTED OPERATING INCOME
BALANCE SHEET
CASH FLOW
CURRENCY
SECOND HALF 2017

17© SGS SA 2018 ALL RIGHTS RESERVED
1. Before amortisation of acquired intangibles and non-recurring items.
2017 ADJUSTED OPERATING INCOME1 GROWTH
ADJ. OP. INC. DECEMBER 2016
2016
ORGANIC
0.2%
ACQUISITIONS
2.2%
DISPOSALS
0.0%
CURRENCY IMPACT
(2.2)%
ADJ. OP. INC. DECEMBER 2017
0.2%
919
743
- - 969
4.6% 0.0%0.8% 0.0% 5.4%
Constant currency growth: 5.4%
CHF MIO
FULL-YEAR RESULTS PRESENTATION 23 JANUARY 2018

18© SGS SA 2018 ALL RIGHTS RESERVED
1. Before amortisation of acquired intangibles and non-recurring items. – 2. Constant currency basis.
2017 ADJUSTED OPERATING INCOME1 PORTFOLIO
Change 2 Change 2
6.1%GIS
(0.6)% 0.6% 16.8%AFL
12.3%OGC
10.8%MIN
9.3%TRP
0.7% 0.6%
5.0%EHS
(1.1)%
(0.5)%7.6%IND
(1.5)%
6.6%CBE
0.4% 1.4% 25.5%CRS
FULL-YEAR RESULTS PRESENTATION 23 JANUARY 2018

19© SGS SA 2018 ALL RIGHTS RESERVED
1. Before amortisation of acquired intangibles and non-recurring items. – 2. Constant currency basis.
ADJUSTED OPERATING MARGIN1 BY BUSINESS
30%
25%
20%
15%
10%
5%
0%
AFL CRSMIN CBE TRPOGC IND GISEHS
15.8%14.4%
10.6%
25.4%
17.5%
9.3%
11.8%
16.2%
23.3%
16.0%15.3%
10.5%
25.6%
18.9%
8.1%
10.0%
16.5%
21.9%
20162 2017
FULL-YEAR RESULTS PRESENTATION 23 JANUARY 2018

20© SGS SA 2018 ALL RIGHTS RESERVED
6% OPEX cost avoidance
29% CAPEX
65% OPEX P&L
FULL-YEAR RESULTS PRESENTATION 23 JANUARY 2018
PROCUREMENT EFFICIENCY
PROCUREMENT SAVINGS BY REGION PROCUREMENT SAVINGS BY NATURE
CHF 60 MIO CHF 61 MIO
70
60
50
40
30
20
10
0
Americas Asia Pacific EAME
TARGET 2017
20
15
21
24
16
25
ACTUAL 2017

HIGHLIGHTS FINANCIAL REVIEW
BUSINESS REVIEW
OUTLOOK Q&A APPENDIX
REVENUE
ADJUSTED OPERATING INCOME
BALANCE SHEET
CASH FLOW
CURRENCY
SECOND HALF 2017

22© SGS SA 2018 ALL RIGHTS RESERVED
1. Profit for the period / (Non-current assets + Net Working Capital).
2017 CONSOLIDATED BALANCE SHEET
(CHF million) DEC 2017 DEC 2016
Land, buildings and equipment 1 002 972Goodwill 1 238 1 195Intangible assets 222 246Other Long-term assets 341 325NON-CURRENT ASSETS 2 803 2 738
Unbilled revenues and inventories 339 290Trade accounts and notes receivable 1 068 997Other receivables and prepayments 340 340Marketable securities 10 9Cash and cash equivalents 1 383 975CURRENT ASSETS 3 140 2 611
TOTAL 5 943 5 349
ROIC1 21.3% 19.3%
(CHF million) DEC 2017 DEC 2016
Share capital 8 8Reserves 1 911 1 765SHAREHOLDERS’ EQUITY 1 919 1 773
NON-CONTROLLING INTERESTS 86 80
Long-term loans 2 090 1 719Provisions and other liabilities 267 289NON-CURRENT LIABILITIES 2 357 2 008
Accounts payable 677 641Other liabilities 904 847CURRENT LIABILITIES 1 581 1 488
LIABILITIES 3 938 3 496
TOTAL 5 943 5 349
ASSETS SHAREHOLDERS’ EQUITY AND LIABILITIES
NET DEBT (698) (736)
FULL-YEAR RESULTS PRESENTATION 23 JANUARY 2018

HIGHLIGHTS FINANCIAL REVIEW
BUSINESS REVIEW
OUTLOOK Q&A APPENDIX
REVENUE
ADJUSTED OPERATING INCOME
BALANCE SHEET
CASH FLOW
CURRENCY
SECOND HALF 2017

24© SGS SA 2018 ALL RIGHTS RESERVED
2017 CONDENSED CASH FLOW
(CHF million) DEC 2017 DEC 2016
PROFIT FOR THE PERIOD 664 586 Non-cash items 565 560 (Increase)/Decrease in working capital (1) 75 Taxes paid (241) (207)CASH FLOW FROM OPERATING ACTIVITIES 987 1 014 Net purchase of fixed assets (281) (276)Net acquisition of businesses (35) (172)Decrease in marketable securities and other 5 247 CASH FLOW USED BY INVESTING ACTIVITIES (311) (201)Dividends paid to equity holders of SGS SA (528) (517)Dividends paid to non-controlling interests (40) (39)Transaction with non-controlling interests 1 (4)Net cash received/(paid) on treasury shares 13 (161)Proceeds/(Reimbursements) of corporate bonds 374 (491)Interest paid (56) (58)Decrease in borrowings (3) (3)CASH FLOW USED BY FINANCING ACTIVITIES (239) (1 273)Currency translation (29) (55)INCREASE/(DECREASE) IN CASH AND CASH EQUIVALENTS 408 (515)
FREE CASH FLOW1 706 738 1. Cash flow from operating activities net of capital expenditures. FULL-YEAR RESULTS PRESENTATION
23 JANUARY 2018

25© SGS SA 2018 ALL RIGHTS RESERVED
FULL-YEAR RESULTS PRESENTATION 23 JANUARY 2018
NETWORKING CAPITAL
(INCREASE)/DECREASE IN NET WORKING CAPITAL
OPERATING NET WORKING CAPITAL % REVENUE
5.2%8.4% 4.1% 3.9%
Operating Net Working Capital (CHF MIO)In % of Revenue
461
296 249 245
75
160
(109)
(1)
FY 2014
FY 2014
FY 2015
FY 2015
FY 2016
FY 2016
FY 2017
FY 2017
500
450
400
350
300
250
200
150
100
50
0
9%
8%
7%
6%
5%
4%
3%
2%
1%
0%
200
150
100
50
0
-50
-100
-150
CHF MIO

26© SGS SA 2018 ALL RIGHTS RESERVED
2017 CAPITAL EXPENDITURE
CAPEX BY REGION
ANNUAL CAPEX CHF MIO
400
300
2002013 2016 20172014 2015
Capital Expenditure
Depreciation and amortisation
CHF 302 MIO
4.2%GIS
14.0%TRP
7.1%EHS
10.1%IND
1.4%CBE
18.0%AFL
17.0%OGC
9.3%MIN
18.9%CRS
CAPEX BY BUSINESS
34.4%Asia Pacific
19.5%Americas
46.1%Europe / Africa / Middle East
FULL-YEAR RESULTS PRESENTATION 23 JANUARY 2018
CHF 302 MIO

27© SGS SA 2018 ALL RIGHTS RESERVED
1. Net Capex.
CASH SOURCES AND USES IN 2017
SOURCES USES
CHF 1.0 BNCHF 0.9 BN
ORGANIC CASH FLOW GENERATION FULLY FUNDING THE USES
OPERATING CASH FLOW GENERATION
GROWTH OPPORTUNITIES• Organic growth1
• M&A
SHAREHOLDERS RETURNS• Dividends paid• Share buy-back programme
CHF 0.3 BN
CHF 0.6 BN
FULL-YEAR RESULTS PRESENTATION 23 JANUARY 2018

HIGHLIGHTS FINANCIAL REVIEW
BUSINESS REVIEW
OUTLOOK Q&A APPENDIX
REVENUE
ADJUSTED OPERATING INCOME
BALANCE SHEET
CASH FLOW
CURRENCY
SECOND HALF 2017

29© SGS SA 2018 ALL RIGHTS RESERVED
2017 FOREIGN CURRENCY REVENUES
MAJOR CURRENCIES
26.1%OTHER
2.2%HKD
2.6%AUD
2.9%BRL
2.7%GBP
2.7%CLP
3.5%CAD
26.1%EUR
14.1%USD
13.3%CNY
3.8%TWD
FULL-YEAR RESULTS PRESENTATION 23 JANUARY 2018

30© SGS SA 2018 ALL RIGHTS RESERVED
EUR USD CNY TWD CAD CLP GBP BRL AUD HKD20172016
CHANGE
FOREIGN CURRENCY AVERAGE RATE CHANGE FY 2017 VERSUS FY 2016 RATE
10%
8%
6%
4%
2%
0%
(2)%
(4)%
(6)%
2.0%
(0.0)%(1.8)%
5.9%
2.1%
4.2%
(5.1)%
3.0%
8.7%
(0.4)%
1.11151.09012.0%
0.98490.9849(0.0)%
0.14570.1483(1.8)%
0.03240.03055.9%
0.75890.74362.1%
0.00150.00154.2%
1.26831.3360(5.1)%
0.30850.28388.7%
0.75450.73273.0%
0.12640.1269(0.4)%
FULL-YEAR RESULTS PRESENTATION 23 JANUARY 2018

HIGHLIGHTS FINANCIAL REVIEW
BUSINESS REVIEW
OUTLOOK Q&A APPENDIX
REVENUE
ADJUSTED OPERATING INCOME
BALANCE SHEET
CASH FLOW
CURRENCY
SECOND HALF 2017

32© SGS SA 2018 ALL RIGHTS RESERVED
H2 2017 FINANCIAL HIGHLIGHTS
1. Before amortisation of acquired intangibles and non-recurring items. – 2. Constant currency basis.
(CHF million) 2017 H22016 H2
PRO-FORMA2 2016 H2
REVENUE 3 302 3 120 3 084Change in % 5.8 7.1
ADJUSTED OPERATING INCOME1 540 511 508Change in % 5.7 6.3
ADJUSTED OPERATING INCOME MARGIN1 IN % 16.4 16.4 16.5
OPERATING INCOME (EBIT) 484 425 422Change in % 14.0 14.7
OPERATING INCOME (EBIT) MARGIN IN % 14.7 13.6 13.7
PROFIT FOR THE PERIOD 371 312 309Change in % 18.8 20.1
PROFIT ATTRIBUTABLE TO EQUITY HOLDERS OF SGS SA 345 288 289
Change in % 19.9 19.4
FULL-YEAR RESULTS PRESENTATION 23 JANUARY 2018

33© SGS SA 2018 ALL RIGHTS RESERVED
H2 2017 REVENUE GROWTH COMPOSITION
REVENUE H2 2016
CHF MIO
H2 2016
ORGANIC
1.6%
ACQUISITIONS
3.6%
DISPOSALS
0.0%
CURRENCY IMPACT
(1.0)%
REVENUE H2 2017
4.2%
3 084
27154 - 37 3 302
4.9 % 0.0%0.9% 1.3 % 7.1%
Constant currency growth: 5.8%
FULL-YEAR RESULTS PRESENTATION 23 JANUARY 2018

34© SGS SA 2018 ALL RIGHTS RESERVED
1.4%
0.0%
H2 2017 REVENUE GROWTH1 BY BUSINESS
1. Constant currency basis.
AFL
MIN
OGC
CRS
CBE
IND
EHS
TRP
GIS
TOTAL
Organic Acquisitions
1.6%
1.2%
(0.0)%
6.4% 0.9%
8.0%
5.0% (0.0)%
2.2%6.9%
0.4%5.5%
4.0%
8.4%
4.9%
GROWTH
2017 20167.3%
8.0%
5.0%
9.1%
5.9%
1.2%
5.2%
8.4%
(0.1)%
5.8%
4.0%
3.7%
(2.5)%
6.8%
7.5%
2.9%
20.5%
11.9%
11.7%
5.2%
FULL-YEAR RESULTS PRESENTATION 23 JANUARY 2018
(1.5)%
(0.4)%
0.9%

35© SGS SA 2018 ALL RIGHTS RESERVED
1. Before amortisation of acquired intangibles and non-recurring items. – 2. Constant currency basis.
H2 2017 ADJUSTED OPERATING MARGIN1 BY BUSINESS
35%
30%
25%
20%
15%
10%
5%
0%
AFL CRSMIN CBE TRPOGC IND GISEHS
17.2%15.7%
11.4%
26.4%
19.9%
9.2%
13.0%
16.3%
27.2%
16.9% 16.6%
11.0%
26.1%
20.4%
9.0%
11.7%
15.0%
31.5%
H2 20162 H2 2017
FULL-YEAR RESULTS PRESENTATION 23 JANUARY 2018

36© SGS SA 2018 ALL RIGHTS RESERVED
2017 FULL YEAR FINANCIAL SUMMARY
1. Before non-recurring items – 2. Profit for the period / (Non-current assets + Net Working Capital).
FULL-YEAR RESULTS PRESENTATION 23 JANUARY 2018
·Revenue growth of 5.4% of which 4.2% organic
· Increase in Adjusted Operating Income1 on a constant currency basis by 5.4%
·Net investment of CHF 316 million in Capex and Acquisitions
·Operating cash flow of CHF 987 million
·Return on Invested Capital (ROIC2) of 21.3%
·Proposed dividend of CHF 75

HIGHLIGHTS FINANCIAL REVIEW
BUSINESS REVIEW
OUTLOOK Q&A APPENDIX

38© SGS SA 2018 ALL RIGHTS RESERVED
1. Before amortisation of acquired intangibles and non-recurring items – 2. Constant currency basis.
AGRICULTURE, FOOD AND LIFE (AFL)
(CHF million) 20172016
PRO-FORMA2 2016
REVENUE 1 016.3 943.8 934.9 Change in % 7.7 8.7ADJUSTED OPERATING INCOME¹ 162.5 149.0 147.2
Change in % 9.1 10.4MARGIN %¹ 16.0 15.8 15.7
OVERVIEW · Strong momentum in Food activities · Seed and Crop growth supported by recent investments in precision agriculture · Trade & Logistics performance hampered by high stocks and low volatility in the market · Double-digit growth in Life driven by Laboratories
OUTLOOK · Strong Food market fundamentals and investment in digital initiatives · Trade & Logistics expects moderate growth · Continued recovery of the input supplier market and portfolio expansion in Seed and Crop services · Growth in Life activities with emphasis on biopharma and laboratory expansion · Strong pipeline for both biometrics and the Viral Challenge Unit · Solid acquisition pipeline, particularly for Food
FULL-YEAR RESULTS PRESENTATION 23 JANUARY 2018

39© SGS SA 2018 ALL RIGHTS RESERVED
MINERALS (MIN)
1. Before amortisation of acquired intangibles and non-recurring items – 2. Constant currency basis.
OVERVIEW · Double-digit growth in Energy Minerals in Russia, Indonesia, South Africa and Colombia · Strong growth in Trade Services with volume increase in major bulk commodities · Increased sample volumes in Geochemistry and six onsite laboratory contracts · Strong recovery and growth in the Metallurgical Testing business
OUTLOOK · Market growth to continue with funding for exploration projects · Continued good performance expected in Trade Services and Energy Minerals · Onsite laboratory network expected to increase as projects move into production phase · Healthier project pipeline for Process Engineering
(CHF million) 20172016
PRO-FORMA2 2016
REVENUE 683.6 647.1 635.0 Change in % 5.6 7.7ADJUSTED OPERATING INCOME¹ 104.6 93.3 90.9
Change in % 12.1 15.1MARGIN %¹ 15.3 14.4 14.3
FULL-YEAR RESULTS PRESENTATION 23 JANUARY 2018

40© SGS SA 2018 ALL RIGHTS RESERVED
1. Before amortisation of acquired intangibles and non-recurring items – 2. Constant currency basis.
OIL, GAS AND CHEMICALS (OGC)
OVERVIEW · Strong growth in Upstream production segment · Solid growth in Plant and Terminal Operations, specifically in North America · Trade-related activity under pressure, but growth in Asia · Significant growth and solid pipeline for remaining portfolio
OUTLOOK · Solid growth with new contracts in Plant and Terminal Operations · Focus on oil production market in Upstream services · Trade-related business to compete in difficult market conditions · Solid pipeline of projects in laboratory outsourcing for Non-Inspection-Related Testing Services · Rest of the portfolio to perform well
(CHF million) 20172016
PRO-FORMA2 2016
REVENUE 1 138.8 1 103.8 1 098.4 Change in % 3.2 3.7ADJUSTED OPERATING INCOME¹ 119.7 117.3 116.4
Change in % 2.0 2.8MARGIN %¹ 10.5 10.6 10.6
FULL-YEAR RESULTS PRESENTATION 23 JANUARY 2018

41© SGS SA 2018 ALL RIGHTS RESERVED
CONSUMER AND RETAIL (CRS)
1. Before amortisation of acquired intangibles and non-recurring items – 2. Constant currency basis.
OVERVIEW · Strong organic growth in North East Asia, Eastern Europe, Middle East and Africa · Robust growth in Softlines and Hardlines · Expansion in textile sustainability segment · Growth momentum returned to Wireless activity · Outstanding performance of Cosmetic, Personal Care and Household in Asia and North America
OUTLOOK · Ongoing robust growth in the Electrical and Electronics segment · Strengthening of geographical footprint in new sourcing and emerging markets · Hardlines to boost its portfolio of services and continue the development of new services in E-commerce · Leverage automation tools and implement robotisation across the network
(CHF million) 20172016
PRO-FORMA2 2016
REVENUE 963.2 872.2 872.8 Change in % 10.4 10.4ADJUSTED OPERATING INCOME¹ 246.9 221.7 223.6
Change in % 11.4 10.4MARGIN %¹ 25.6 25.4 25.6
FULL-YEAR RESULTS PRESENTATION 23 JANUARY 2018

42© SGS SA 2018 ALL RIGHTS RESERVED
CERTIFICATION AND BUSINESS ENHANCEMENT (CBE)
1. Before amortisation of acquired intangibles and non-recurring items – 2. Constant currency basis.
OVERVIEW · Solid organic growth driven by Business Enhancement activities · Improved margin driven by most regions and further consolidation of back-office operations · Conversion to ISO new standard progressing as expected · Double-digit growth in Performance Assessment and Training · Opening of additional Academy facilities
OUTLOOK · Certification to keep delivering low single-digit growth · Business Enhancement, which includes Performance Assessment and training, to remain healthy with roll-out of new contracts gained in 2017 and is expected to grow in double digits
(CHF million) 20172016
PRO-FORMA2 2016
REVENUE 340.3 324.3 324.1 Change in % 4.9 5.0ADJUSTED OPERATING INCOME¹ 64.3 56.8 57.5
Change in % 13.2 11.8MARGIN %¹ 18.9 17.5 17.7
FULL-YEAR RESULTS PRESENTATION 23 JANUARY 2018

43© SGS SA 2018 ALL RIGHTS RESERVED
INDUSTRIAL (IND)
1. Before amortisation of acquired intangibles and non-recurring items – 2. Constant currency basis.
OVERVIEW · Continuous erosion of Oil and Gas services with volume reduction and price pressure · Moderate growth in the Manufacturing segment · Infrastructure market decline in South and Central America · Growth in Power and Utilities services, driven by “One Belt - One Road” initiative in China · High margins in Laboratory Testing activities
OUTLOOK · Increased presence in Power and Utilities and Manufacturing markets · Further growth of Industrial laboratory capabilities and geographical footprint · Promotion of sensor-based Asset Health Monitoring projects on bridges in the US and Europe
(CHF million) 20172016
PRO-FORMA2 2016
REVENUE 906.5 906.5 890.9 Change in % 0.0 1.8ADJUSTED OPERATING INCOME¹ 73.4 84.1 83.6
Change in % (12.7) (12.2)MARGIN %¹ 8.1 9.3 9.4
FULL-YEAR RESULTS PRESENTATION 23 JANUARY 2018

44© SGS SA 2018 ALL RIGHTS RESERVED
ENVIRONMENT, HEALTH AND SAFETY (EHS)
1. Before amortisation of acquired intangibles and non-recurring items – 2. Constant currency basis.
OVERVIEW · Overall growth offset by project completion in 2016 in Europe · Strong performance in Laboratory services resulting from network optimisation and diversification · Development of service portfolio for hospitality, retail and real estate sectors · Dynamic laboratory growth in China and Taiwan driven by focus on dioxins and new regulations
OUTLOOK · Emerging opportunities in the digital sensor technology market · Global contract wins expected to increase · Positive momentum for asbestos testing services in Europe, Asia, Middle East and Americas · Acceleration for Marine services from regulatory enforcement in specific countries
(CHF million) 20172016
PRO-FORMA2 2016
REVENUE 485.8 471.7 464.3 Change in % 3.0 4.6ADJUSTED OPERATING INCOME¹ 48.6 55.8 54.9
Change in % (12.9) (11.5)MARGIN %¹ 10.0 11.8 11.8
FULL-YEAR RESULTS PRESENTATION 23 JANUARY 2018
45© SGS SA 2018 ALL RIGHTS RESERVED
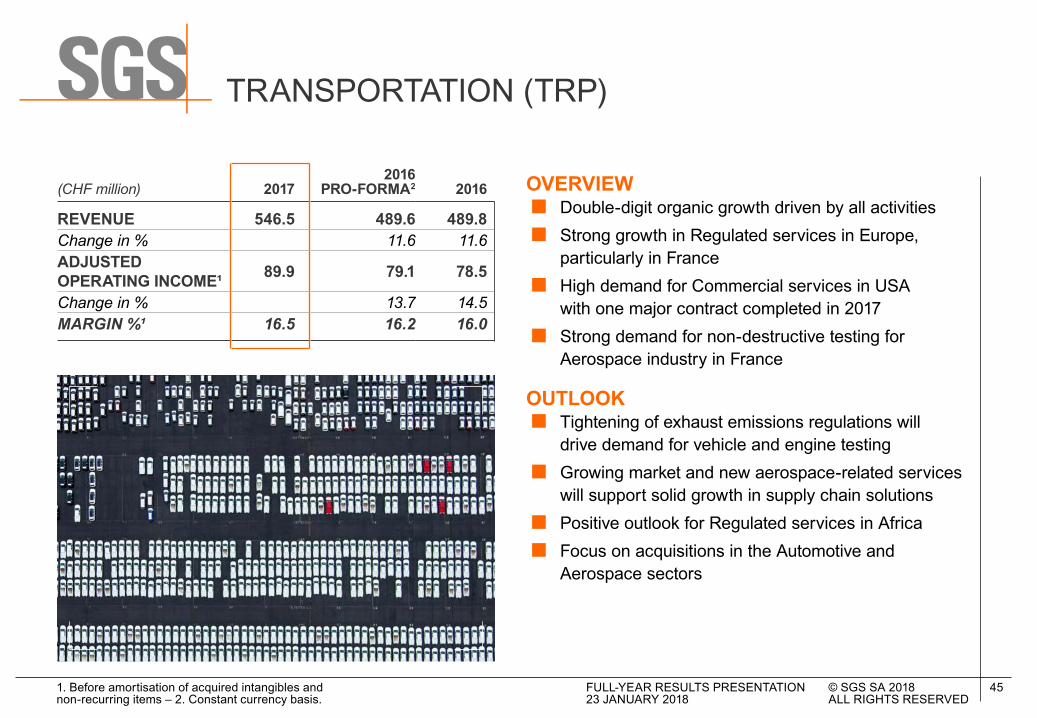
TRANSPORTATION (TRP)
1. Before amortisation of acquired intangibles and non-recurring items – 2. Constant currency basis.
OVERVIEW · Double-digit organic growth driven by all activities · Strong growth in Regulated services in Europe, particularly in France · High demand for Commercial services in USA with one major contract completed in 2017 · Strong demand for non-destructive testing for Aerospace industry in France
OUTLOOK · Tightening of exhaust emissions regulations will drive demand for vehicle and engine testing · Growing market and new aerospace-related services will support solid growth in supply chain solutions · Positive outlook for Regulated services in Africa · Focus on acquisitions in the Automotive and Aerospace sectors
(CHF million) 20172016
PRO-FORMA2 2016
REVENUE 546.5 489.6 489.8 Change in % 11.6 11.6ADJUSTED OPERATING INCOME¹ 89.9 79.1 78.5
Change in % 13.7 14.5MARGIN %¹ 16.5 16.2 16.0
FULL-YEAR RESULTS PRESENTATION 23 JANUARY 2018

46© SGS SA 2018 ALL RIGHTS RESERVED
GOVERNMENTS AND INSTITUTIONS (GIS)
1. Before amortisation of acquired intangibles and non-recurring items – 2. Constant currency basis.
OVERVIEW · High double-digit growth in TransitNet services through geographical expansion · Strong growth in PCA activities with new mandates in Gabon and Cameroon, despite completion of the mandate in Kurdistan · Several scanning contracts extended · Transformation of PSI in Cameroon and Haiti drives growth in Valuation offseting completion of Benin programme
OUTLOOK · Global economy recovery to positively impact volume of world merchandise trade · Opportunities from E-economy and Brexit · Strong pipeline in Port Solutions · New innovative solutions for NGOs and Institutions · New consultancy and training services to enhance service offering · New digital solutions to be launched
(CHF million) 20172016
PRO-FORMA2 2016
REVENUE 268.1 265.9 274.7 Change in % 0.8 (2.4)ADJUSTED OPERATING INCOME¹ 58.7 62.0 66.6
Change in % (5.3) (11.9)MARGIN %¹ 21.9 23.3 24.2
FULL-YEAR RESULTS PRESENTATION 23 JANUARY 2018

HIGHLIGHTS FINANCIAL REVIEW
BUSINESS REVIEW
OUTLOOK Q&A APPENDIX

48© SGS SA 2018 ALL RIGHTS RESERVED
SOLID ORGANIC REVENUE GROWTH
HIGHER ADJUSTED OPERATING INCOME MARGIN ROBUST CASH FLOW
GUIDANCE 20181
1. At stable market conditions. FULL-YEAR RESULTS PRESENTATION 23 JANUARY 2018

49© SGS SA 2018 ALL RIGHTS RESERVED
OUTLOOK 2020
FULL-YEAR RESULTS PRESENTATION 23 JANUARY 2018
·Mid single-digit organic growth with improvement over the 2016-20 period underpinned by the new focused structure and new strategic initiatives
·Accelerating M&A activities with acquired revenue over the period in the range of CHF 1 billion
·Adjusted Operating Income Margin of at least 18% by the end of the period
·Strong cash conversion
·Solid returns on invested capital
·Dividend distributions, in line with improvement in net earnings

HIGHLIGHTS FINANCIAL REVIEW
BUSINESS REVIEW
OUTLOOK Q&A APPENDIX

TO REGISTER FOR QUESTIONSPRESS * AND 1 ON YOUR TELEPHONE

HIGHLIGHTS FINANCIAL REVIEW
BUSINESS REVIEW
OUTLOOK Q&A APPENDIX

53© SGS SA 2018 ALL RIGHTS RESERVED
ACRONYMS AND OTHER ABBREVIATIONS
EOP End Of Period
NGO Non-Governmental Organisation
PCA Product Conformity Assessments
PSI Pre-shipment Inspections
ROIC Return On Invested Capital
FULL-YEAR RESULTS PRESENTATION 23 JANUARY 2018

54© SGS SA 2018 ALL RIGHTS RESERVED
UPCOMING EVENT DATES
ANNUAL GENERAL MEETING OF SHAREHOLDERSMonday, 19 March 2018Geneva, Switzerland
2018 HALF YEAR RESULTSWednesday, 18 July 2018
INVESTOR DAYS – EUROPEThursday and Friday8 and 9 November 2018
DIVIDEND PAYMENT DATESEx-Date: 21 March 2018Record data: 22 March 2018Payment date: 26 March 2018
FULL-YEAR RESULTS PRESENTATION 23 JANUARY 2018

55© SGS SA 2018 ALL RIGHTS RESERVED
SGS SA CORPORATE OFFICE1 place des Alpes P.O. Box 2152 CH – 1211 Geneva 1 t +41 (0)22 739 91 11 f +41 (0)22 739 98 86 e [email protected] www.sgs.com
INVESTOR RELATIONSJulie Engelen SGS SA 1 place des Alpes P.O. Box 2152 CH – 1211 Geneva 1 t +41 (0)22 739 92 78 f +41 (0)22 739 92 00 www.sgs.com
STOCK EXCHANGE TRADINGSIX Swiss Exchange
MEDIA RELATIONSDaniel Rufenacht SGS SA 1 place des Alpes P.O. Box 2152 CH – 1211 Geneva 1 t +41 (0)22 739 94 01 f +41 (0)22 739 92 00 www.sgs.com
COMMON STOCK SYMBOLSBloomberg: Registered Share: SGSN.VX Reuters: Registered Share: SGSN.VX Telekurs: Registered Share: SGSN ISIN: Registered Share: CH0002497458 Swiss security number: 249745
STOCK EXCHANGE LISTINGSIX Swiss Exchange, SGSN
INVESTOR RELATIONS INFORMATION
FULL-YEAR RESULTS PRESENTATION 23 JANUARY 2018

© S
GS
Gro
up M
anag
emen
t SA
– 2
018
– A
ll rig
hts
rese
rved
– S
GS
is a
regi
ster
ed tr
adem
ark
of S
GS
Gro
up M
anag
emen
t SA
.
WWW.SGS.COM


