49
FULL YEAR RESULTS 20 TH APRIL 2016

FULL YEAR RESULTS
20TH APRIL 2016
11% H2 PBT GROWTH A MAJOR MILESTONE
1
• 11% PBT growth delivered in H2
• Trading PBT in line with consensus
• Reported PBT ahead due to restatement
• Strategy working well with great progress in our digital KPIs
• Strong Power Brand performance, up 10%
• Headwind from the Traditional Segment
• FY17 focus: Fit 4 the Future implementation

AGENDA
FINANCIALS
STRATEGIC UPDATE
SUMMARY
ANY QUESTIONS?
2

CRAIG LOVELACE, CFO
FINANCIALS
3
FINANCIAL SUMMARY
• Revenue £866.2m, +3.5%
• Product revenue +4.1% and Financial Services revenue +2.1%
• Gross margin -10bps to 55.7%
• Trading profit* £84.5m, -2.0% yoy
• H2 trading profit* £49.5m, +11%
• Adjusted EPS 24.02p
• Net debt £289.7m
• Final dividend held at 8.56p
4* Defined as continuing PBT excluding exceptionals and unrealised FX movement, and prior to
impact of restatement
5
IAS39 RESTATEMENT
• No impact on business operations or cash flow
• Restated provision rate 18.3% FY14 and 16.1% FY15; FY16 15.6%
• Net asset write-down of £48.3m FY14 and £46.6m FY15; FY16
£43.9m
• Changes to Financial Services revenue, COGS and resultant gross
margin as a result of taking into account suspended interest
• FY15 PBT increased by £2.0m and FY16 by £3.8m as a result of the
reduction in provision yoy
• We view the P&L credit as a one-off and do not expect any impact in
FY17 and onwards

6
REVENUE
£m FY16 FY15 Change
Product 606.6 582.9 +4.1%
Financial Services 259.6 254.3 +2.1%
Cont. Revenue 866.2 837.2 +3.5%
% yoy growth Q1 (13wks) Q2 (13wks) Q3 (18wks) Q4 (8wks)
Product +4.3% +7.9% +4.3% -3.5%
Financial Services -1.9% +1.0% +3.7% +8.1%
Cont. Revenue +2.5% +5.8% +4.1% +0.2%
• Q4 (8wks) comparatives: Product +6.7%, Financial Services -8.8%
• January & February driven by sale activity, product volume up 2%
• Full price sales for SS16 started slowly in line with the industry
7
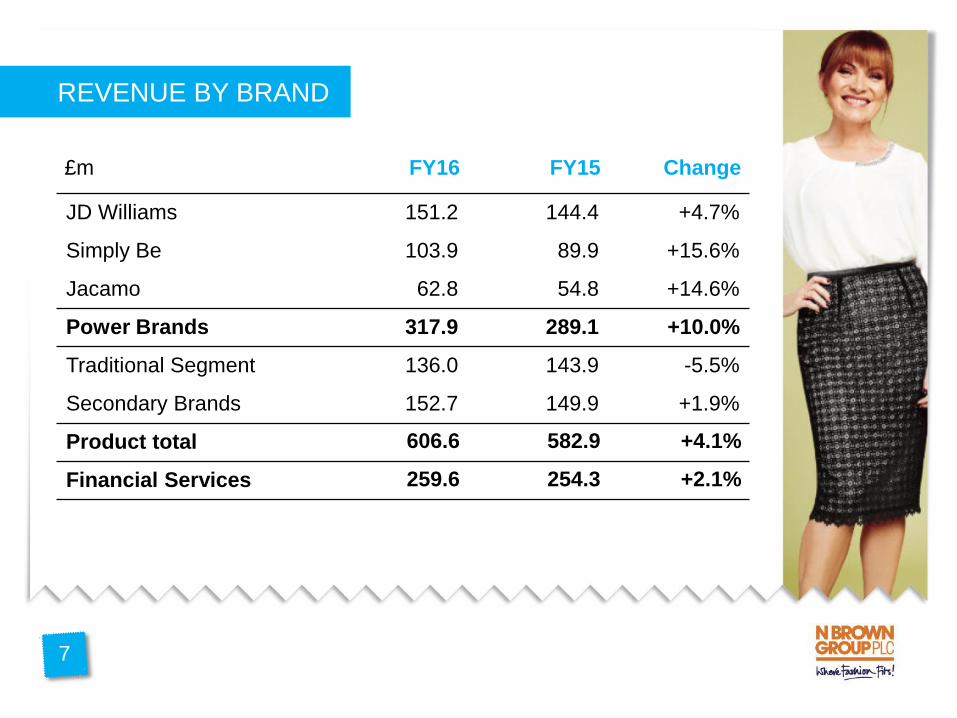
REVENUE BY BRAND
£m FY16 FY15 Change
JD Williams 151.2 144.4 +4.7%
Simply Be 103.9 89.9 +15.6%
Jacamo 62.8 54.8 +14.6%
Power Brands 317.9 289.1 +10.0%
Traditional Segment 136.0 143.9 -5.5%
Secondary Brands 152.7 149.9 +1.9%
Product total 606.6 582.9 +4.1%
Financial Services 259.6 254.3 +2.1%
8
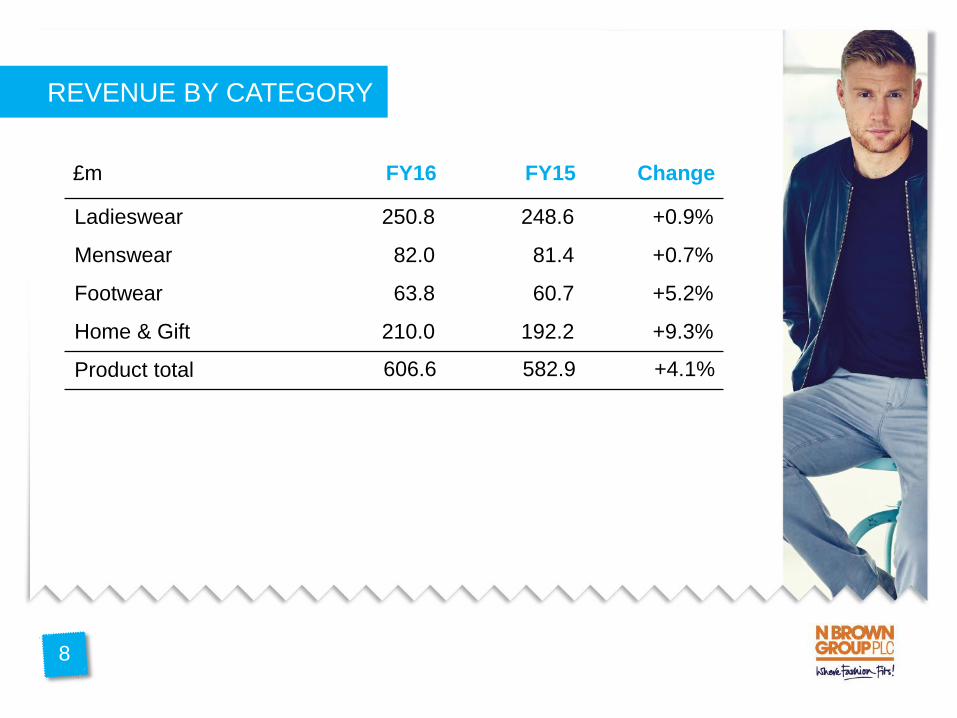
REVENUE BY CATEGORY
£m FY16 FY15 Change
Ladieswear 250.8 248.6 +0.9%
Menswear 82.0 81.4 +0.7%
Footwear 63.8 60.7 +5.2%
Home & Gift 210.0 192.2 +9.3%
Product total 606.6 582.9 +4.1%
9
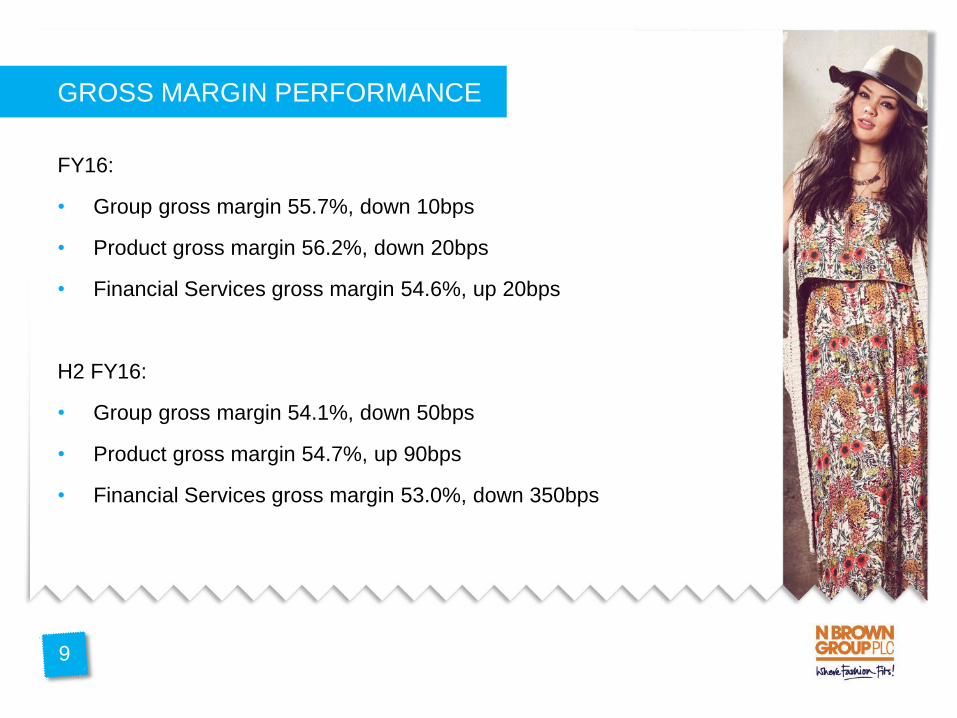
GROSS MARGIN PERFORMANCE
FY16:
• Group gross margin 55.7%, down 10bps
• Product gross margin 56.2%, down 20bps
• Financial Services gross margin 54.6%, up 20bps
H2 FY16:
• Group gross margin 54.1%, down 50bps
• Product gross margin 54.7%, up 90bps
• Financial Services gross margin 53.0%, down 350bps

OPERATING EXPENSES
£m FY16 FY15 Chg Chg % rev
Warehouse & fulfilment (76.7) (73.9) +3.8% Flat
Marketing & production (161.7) (154.7) +4.5% +20bps
Admin & payroll (122.6) (121.8) +0.7% -40bps
Depreciation & amortisation (25.2) (21.2) +18.9% +40bps
Operating Profit* 96.4 95.8 +0.6%
Operating Margin 11.1% 11.4% -30bps
IAS39 restatement credit 3.8 2.0
U’lying Operating Profit* 92.6 93.8 -1.3%
U’lying Operating Margin 10.7% 11.2% -50bps
* Continuing operations, pre-exceptional items
10

11
GROUP PROFIT & LOSS
£m FY16 FY15 Change
U’lying Operating Profit* 92.6 93.8 -1.3%
Finance Costs (net) (8.1) (7.6) +6.6%
Underlying Trading Profit 84.5 86.2 -2.0%
Exceptional Costs (17.2) (12.6)
Unrealised FX movement 1.1 2.7
Profit Before Tax 68.4 76.3 -10.4%
IAS39 restatement credit 3.8 2.0
Taxation (17.3) (16.8) +3.0%
Profit from Cont. Ops 54.9 61.5 -12.5%
Discontinued Ops (G&O) (0.6) (10.4)
Group Profit 54.3 51.1 +6.3%
* Continuing operations, pre-exceptional items and restatement effect

NET ASSETS
12
£m FY16 FY15 Change
Non Current Assets 205.5 176.0 +16.8%
Inventories 101.5 94.8 +7.1%
Receivables/Prepayments 560.9 550.6 +1.9%
Creditors/Accruals (113.0) (121.5) -7.0%
Retirement Benefit Surplus /
(Deficit)
10.8 (3.3) -
Net Debt (289.7) (246.6) +17.5%
Net Assets 476.0 450.0 +5.8%
Gearing 61% 55%
13
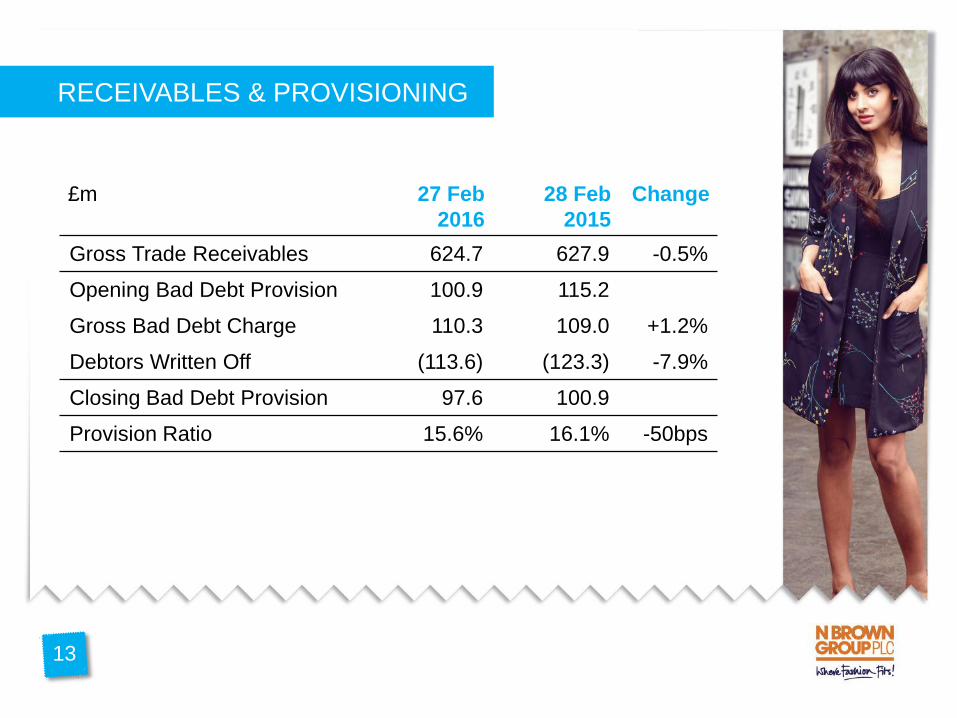
RECEIVABLES & PROVISIONING
£m 27 Feb
2016
28 Feb
2015
Change
Gross Trade Receivables 624.7 627.9 -0.5%
Opening Bad Debt Provision 100.9 115.2
Gross Bad Debt Charge 110.3 109.0 +1.2%
Debtors Written Off (113.6) (123.3) -7.9%
Closing Bad Debt Provision 97.6 100.9
Provision Ratio 15.6% 16.1% -50bps

17
CASH FLOW
14
Cash flow from operations: £86.9m
121.6 (17.9)(18.0)
(58.2)
(22.4)
(9.6)(40.2)
1.6
-60
-40
-20
0
20
40
60
80
100
120
140
(43.1)
15
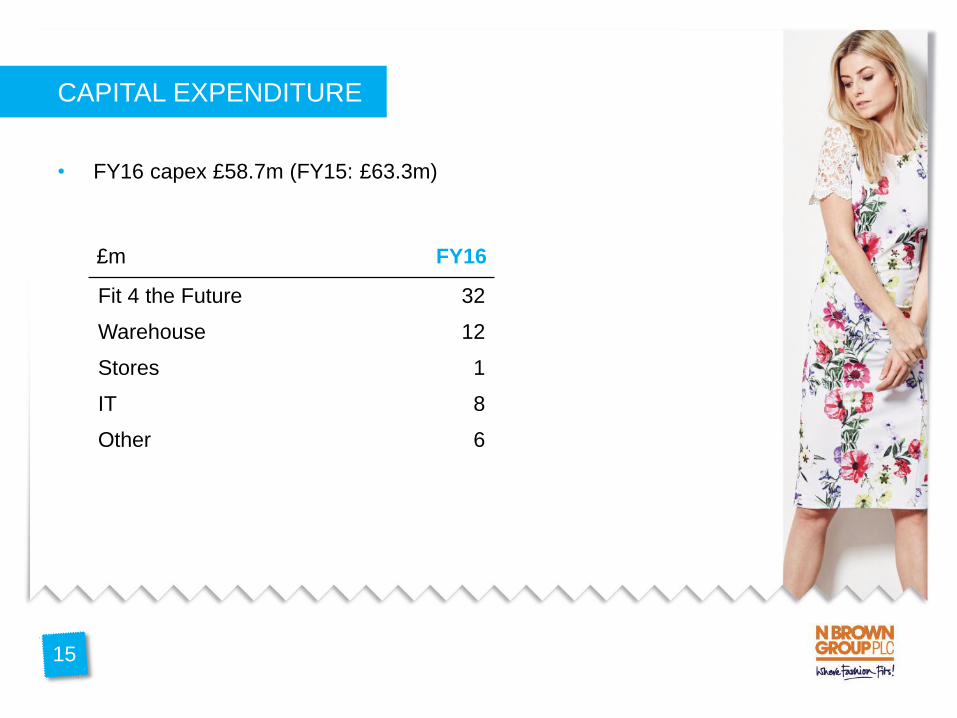
CAPITAL EXPENDITURE
15
• FY16 capex £58.7m (FY15: £63.3m)
£m FY16
Fit 4 the Future 32
Warehouse 12
Stores 1
IT 8
Other 6
19
BALANCE SHEET UNDERSTANDING
16
• Gross debt drawn £335m
– RCF £85m
– Securitisation £250m (secured on our £625m customer loan book)
• Net debt £289m
• EBITDA £122m
– Headline Leverage ratio 2.4x
– Indicative Leverage ratio on RCF 0.7x

20
FY17 GUIDANCE
• Gross margin:
– Product margin -50bps to -150bps; includes impact of non-trading
headwinds of FX and aged inventory clearance
– Financial Services margin +50bps to -50bps
• Group operating costs (excluding D&A) up 2% to 4%
• Depreciation & amortisation £29m-£30m
• Net interest costs £8m-£9m
17

41
FY17 GUIDANCE
• Capex £38m-£40m
• Net debt £270m - £290m
• Tax rate c.20%
• Exceptional costs c.£2m
18

19
STRATEGIC UPDATE
FINANCIALS
SUMMARY
ANY QUESTIONS?

OUR STRATEGY
20

22
H2 ACHIEVEMENTS
PROCESS
Continued focus on
product newness
Improving our
promotional
efficiency
Creation of a
dedicated Traditional
segment marketing
team
PEOPLE
Outsourced Creative
Production and IT
support
Digital marketing,
Merchandising,
Design and DCE
teams expanded
Digitalised all people
processes
SYSTEMS
Early releases of F4F
delivered and
programme
delivering well
Warehouse
extension completed
and currently coming
on stream
221
FY17 KEY PRIORITIES
22
• Fit 4 the Future:
– First stage of new merchandising tool rolled out in May
– First wave of new web platform live in August (USA), roll-out to main
brands early 2017
– New Financial Services system rolled out alongside web platform
– Focused on landing roll-out, minimising disruption and risk, and
maximising potential benefits
• Further developing our digital capabilities; launch of “JDWorks”
• Driving Power Brand growth
• Addressing the headwind from the Traditional Segment
• New customers +36%
• 89% online penetration, with first order penetration 97%
• Further increasing customer choice through new product collections
and brands
• Driving digital marketing techniques
• Planning to launch a loyalty app to further drive retention
SIMPLY BE
23
• New customers +12%
• 90% online penetration, with first order penetration 97%
• Refreshed brand look and feel
• Driving on Dave TV sponsorship
• Improved fit of our smaller sizes – driving increased revenues
and lower returns rates
24
JACAMO

2525
• Brand resonating well with our customers; new customers up 5%
• Increasingly digital:
– Online penetration 51%
– New customer online penetration +13ppts to 65%
– Online share up from 1.0% to 1.6% (Hitwise)
• Increased product newness
• Williams & Brown menswear offer relaunched, performing strongly
• VIP scheme performing ahead of expectations
• Over 50’s fashion show live-streamed onto JDWilliams.co.uk
JD WILLIAMS
5026
• Ambrose Wilson, Premier Man, Julipa, House of Bath
• Dedicated marketing team established
• Increasing variety of promotions and paper formats
• Optimise tablet – more important than mobile for these customers
• Increasing product choice and unifying home & gift offer
• Will take time (earliest AW16) to improve performance
TRADITIONAL SEGMENT

27
CUSTOMERS: CONTINUED GREAT PROGRESS
TY LY Change
Active customer accounts 4.14m 4.05m +2.2%
Power Brand active customer accounts 2.00m 1.87m +6.9%
% growth of most loyal* customers -0.4% +1.0% -140bps
Customer satisfaction rating 85.8% 85.9% -10bps
* Defined as those customers who have ordered in each of the last four seasons27
• Ranked third in the UK for customer service, behind only John Lewis
and Amazon
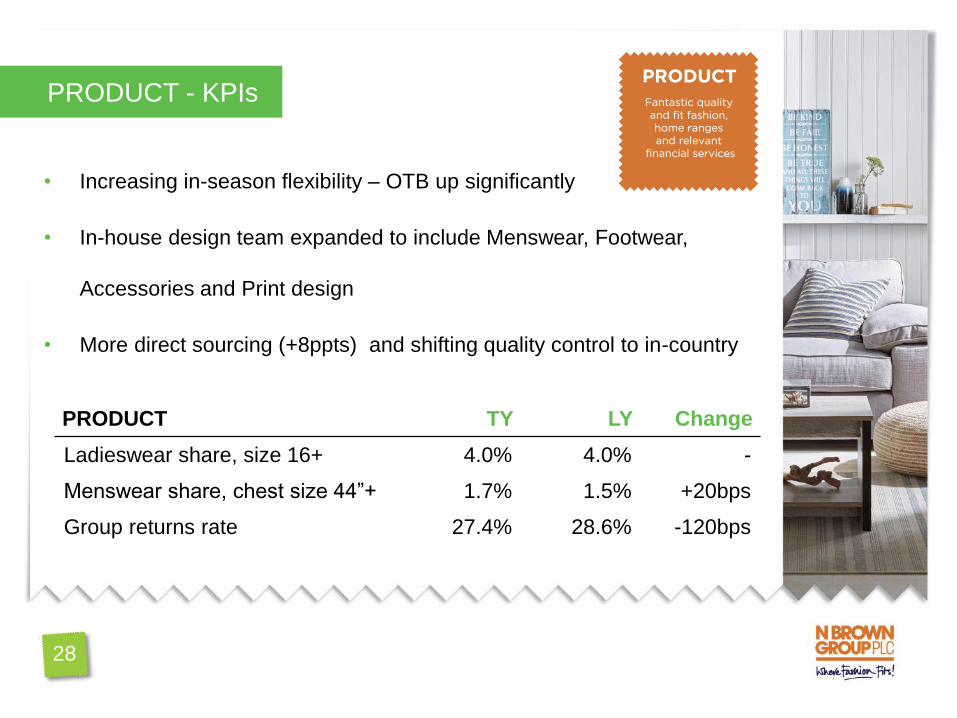
PRODUCT TY LY Change
Ladieswear share, size 16+ 4.0% 4.0% -
Menswear share, chest size 44”+ 1.7% 1.5% +20bps
Group returns rate 27.4% 28.6% -120bps
28
• Increasing in-season flexibility – OTB up significantly
• In-house design team expanded to include Menswear, Footwear,
Accessories and Print design
• More direct sourcing (+8ppts) and shifting quality control to in-country
PRODUCT - KPIs
PRICE ASSERTIVE
• Overall pricing strategy unchanged:
– Competitive with the mid-market
– Focused on value for money
– Strong price architecture
• Taking the opportunity to be assertive on price selectively
• More efficient, event-linked promotions
29
FINANCIAL SERVICES
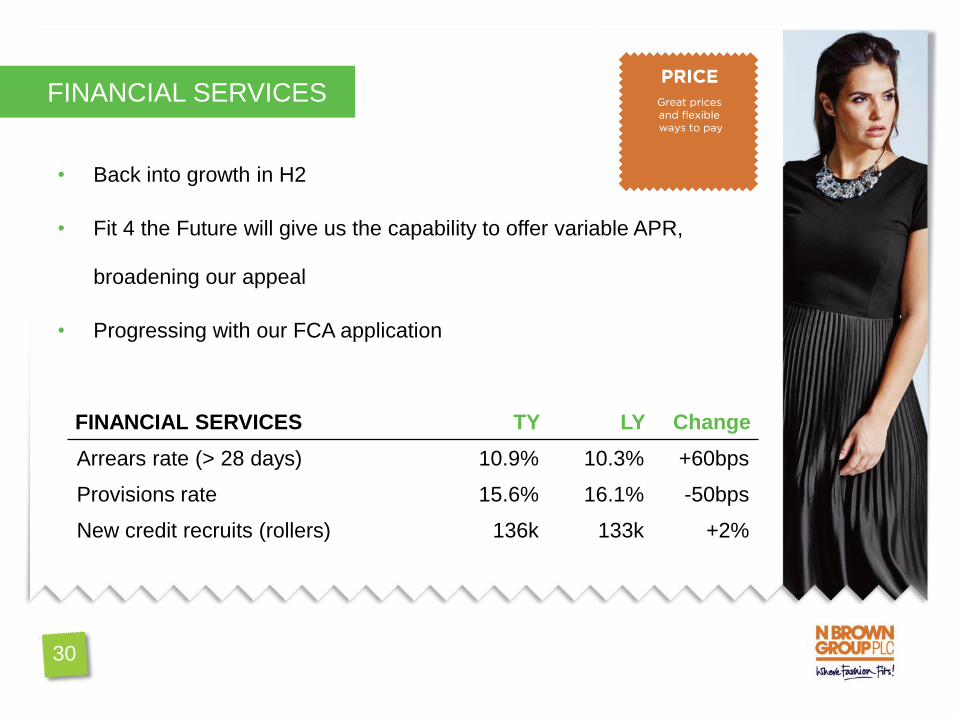
FINANCIAL SERVICES TY LY Change
Arrears rate (> 28 days) 10.9% 10.3% +60bps
Provisions rate 15.6% 16.1% -50bps
New credit recruits (rollers) 136k 133k +2%
30
• Back into growth in H2
• Fit 4 the Future will give us the capability to offer variable APR,
broadening our appeal
• Progressing with our FCA application
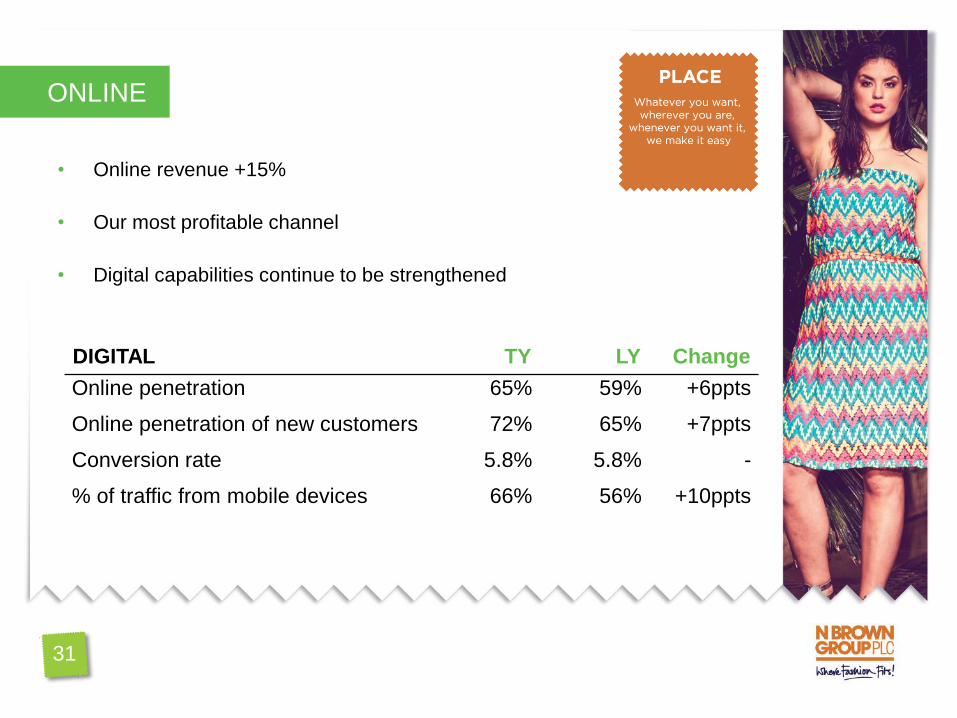
ONLINE
• Online revenue +15%
• Our most profitable channel
• Digital capabilities continue to be strengthened
DIGITAL TY LY Change
Online penetration 65% 59% +6ppts
Online penetration of new customers 72% 65% +7ppts
Conversion rate 5.8% 5.8% -
% of traffic from mobile devices 66% 56% +10ppts
31
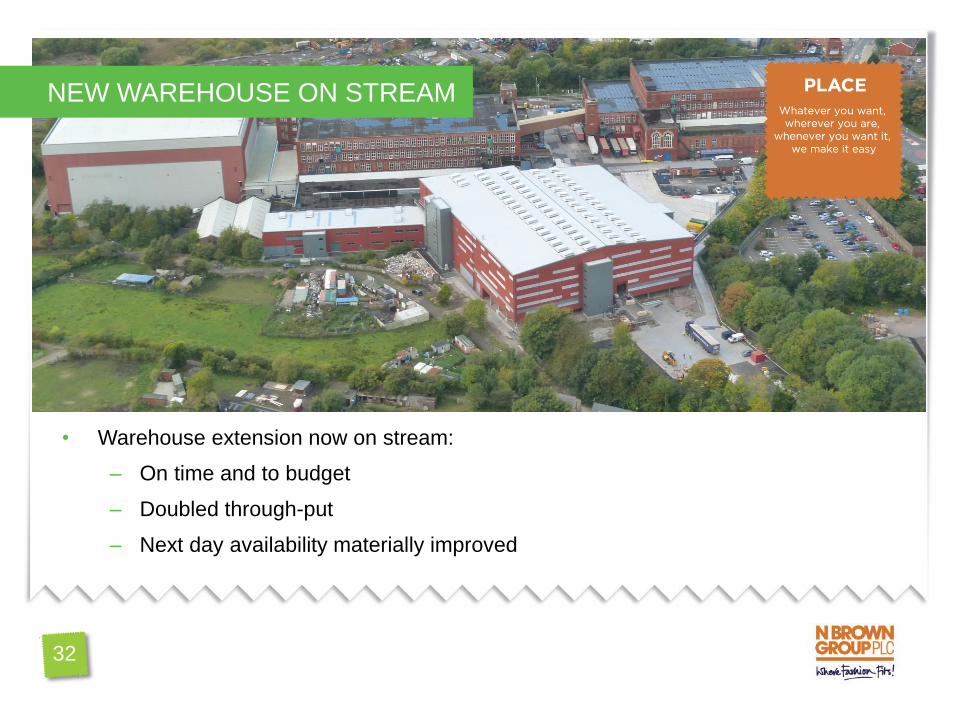
• Warehouse extension now on stream:
– On time and to budget
– Doubled through-put
– Next day availability materially improved
32
NEW WAREHOUSE ON STREAM

USA
33
• Revenue £14.3m, +29% (+20% constant fx)
• Operating loss £1.0m vs £2.5m FY15
• H2 $ profit: $0.2m profit vs $0.9m loss H2 FY15
• Improved profitability a result of:
– Customer order frequency
– Marketing efficiency
– Promotional efficiency
– Change to our delivery offering
• Launched JD Williams brand in March – early days but performing well
• New web platform live in USA in August

FINANCIALS
ANY QUESTIONS?
STRATEGIC UPDATE
SUMMARY
34
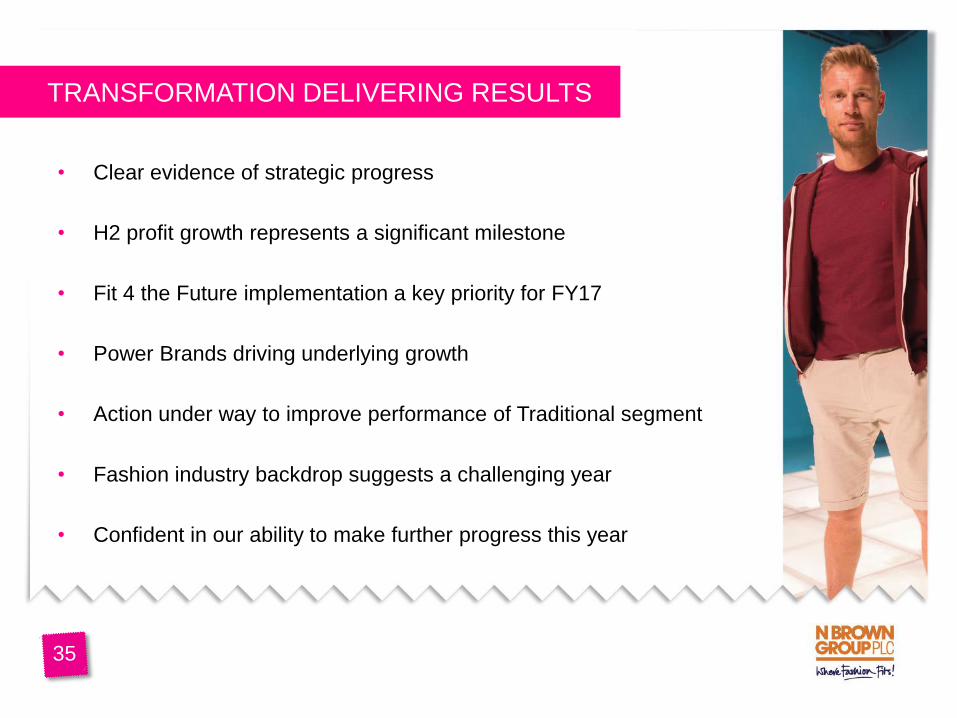
TRANSFORMATION DELIVERING RESULTS
35
• Clear evidence of strategic progress
• H2 profit growth represents a significant milestone
• Fit 4 the Future implementation a key priority for FY17
• Power Brands driving underlying growth
• Action under way to improve performance of Traditional segment
• Fashion industry backdrop suggests a challenging year
• Confident in our ability to make further progress this year

AGENDA
FINANCIALS & GUIDANCE
STRATEGY UPDATE
IMPROVING OUR RETAIL BASICS
FINANCIAL SERVICES
FIT 4 THE FUTURE
INTERNATIONAL & STORES UPDATE
Q&A
SUMMARY
43
FINANCIALS
STRATEGIC UPDATE
SUMMARY
ANY QUESTIONS?
36

APPENDIX
• Operating cash flow
• Group cash flow
• Exceptional cost breakdown
• Revenue by brand, H1 FY15, H1 FY16 and FY14
• Fit 4 the Future timescale, costs and benefits
• Financial Calendar
• Investor relations contacts
37
37
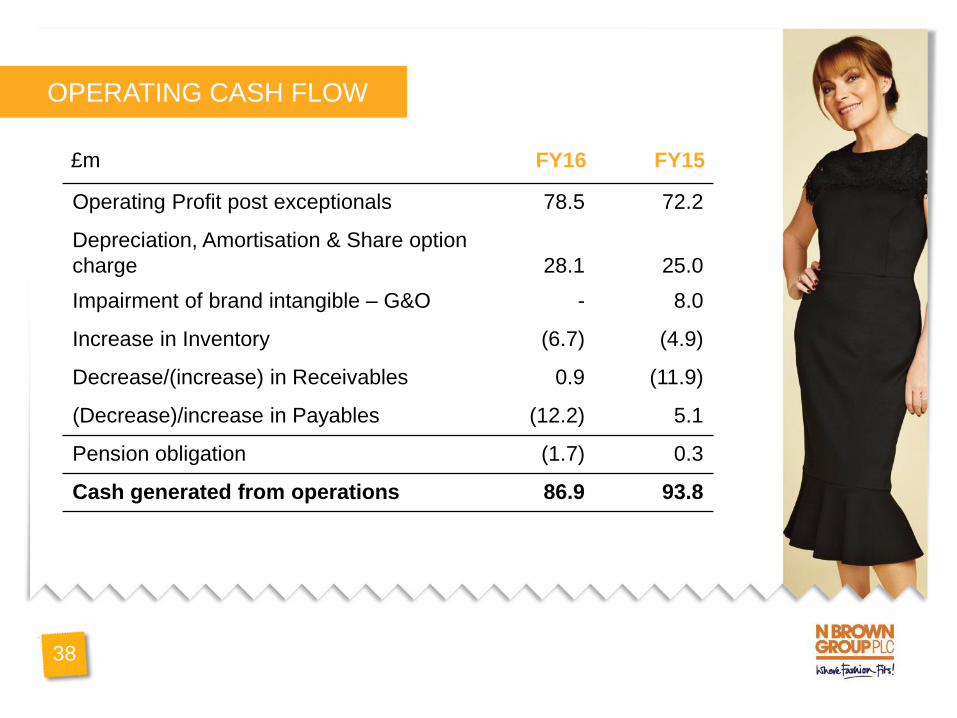
OPERATING CASH FLOW
38
£m FY16 FY15
Operating Profit post exceptionals 78.5 72.2
Depreciation, Amortisation & Share option
charge 28.1 25.0
Impairment of brand intangible – G&O - 8.0
Increase in Inventory (6.7) (4.9)
Decrease/(increase) in Receivables 0.9 (11.9)
(Decrease)/increase in Payables (12.2) 5.1
Pension obligation (1.7) 0.3
Cash generated from operations 86.9 93.8
17
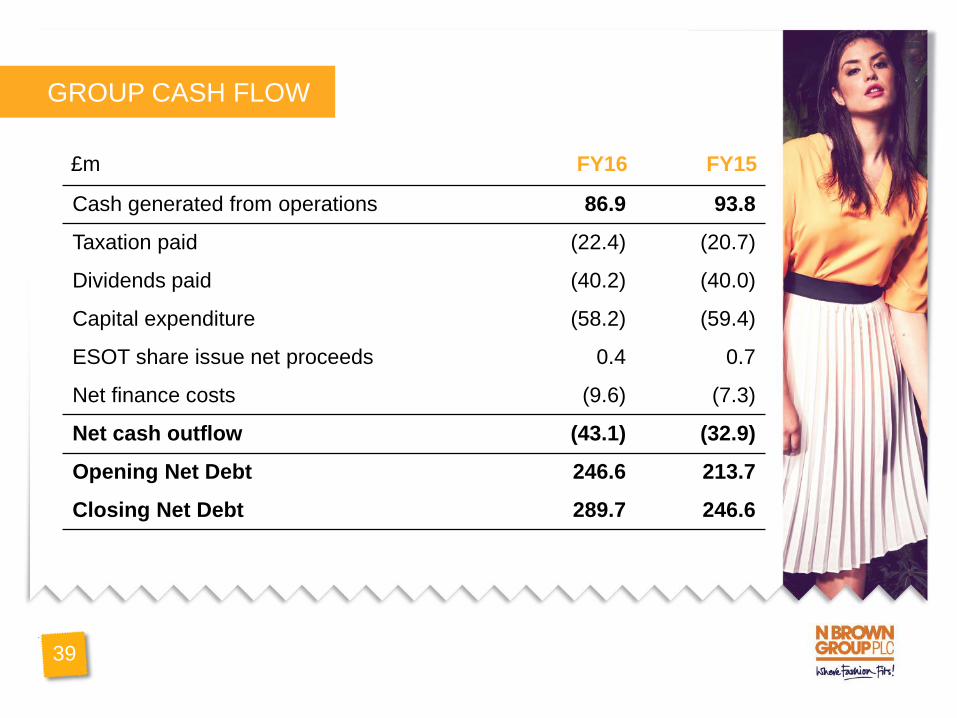
GROUP CASH FLOW
39
£m FY16 FY15
Cash generated from operations 86.9 93.8
Taxation paid (22.4) (20.7)
Dividends paid (40.2) (40.0)
Capital expenditure (58.2) (59.4)
ESOT share issue net proceeds 0.4 0.7
Net finance costs (9.6) (7.3)
Net cash outflow (43.1) (32.9)
Opening Net Debt 246.6 213.7
Closing Net Debt 289.7 246.6
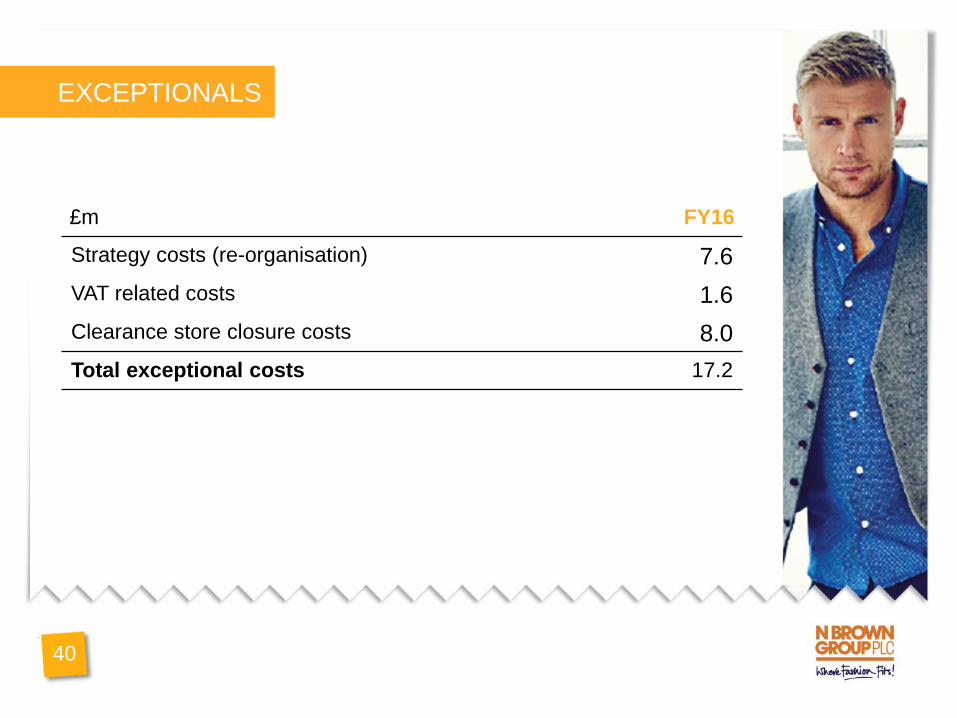
EXCEPTIONALS
£m FY16
Strategy costs (re-organisation) 7.6
VAT related costs 1.6
Clearance store closure costs 8.0
Total exceptional costs 17.2
40

REVENUE BY BRAND, FY14, H1 FY15 & H1 FY16
41
£m H1 FY16 H1 FY15 FY14
JD Williams 75.6 70.6 139.4
Simply Be 50.2 41.4 87.2
Jacamo 30.4 25.0 48.0
Power Brands 156.2 137.0 274.6
Traditional Brands 68.1 72.8 142.6
Secondary Brands 74.9 72.3 159.5
Product total 299.2 282.1 576.7

Test
International
Website Roll-Out
Planning
TransformationBuild
Test
UK
Website Roll-Out
Global
Multichannel
Transformation
Credit
Transformation
Build
Test
Live
Build
20162015 2017
Pilot
Live
FIT 4 THE FUTURE TIMESCALE
42
2019
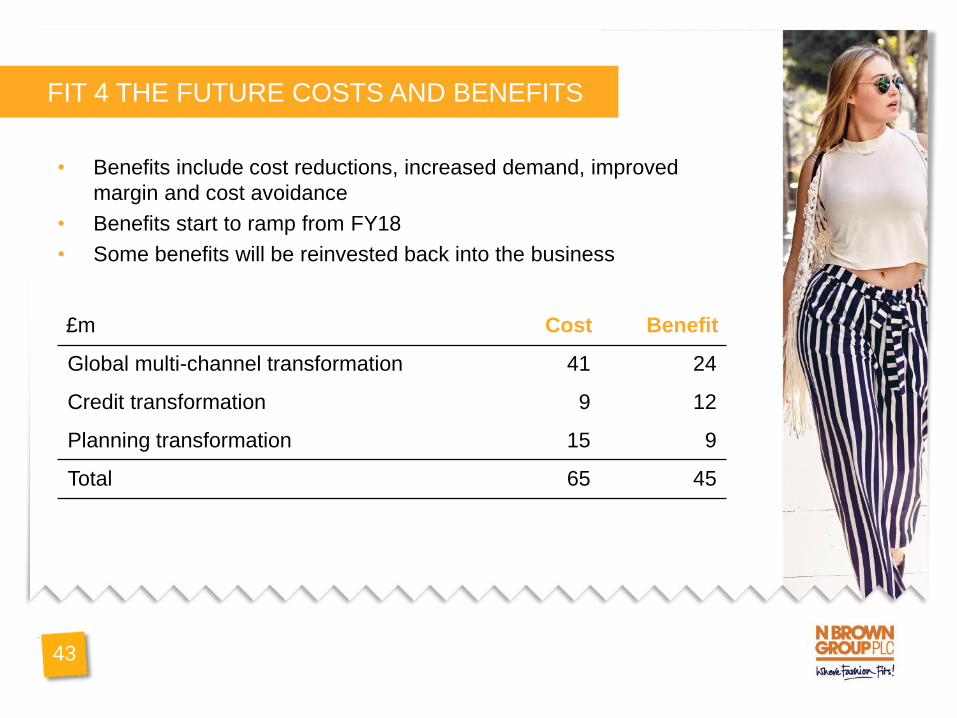
FIT 4 THE FUTURE COSTS AND BENEFITS
43
• Benefits include cost reductions, increased demand, improved
margin and cost avoidance
• Benefits start to ramp from FY18
• Some benefits will be reinvested back into the business
£m Cost Benefit
Global multi-channel transformation 41 24
Credit transformation 9 12
Planning transformation 15 9
Total 65 45

FINANCIAL CALENDAR
44
• Q1 trading statement 16th June 2016
• Interims 11th October 2016

IR CONTACT DETAILS
45
Bethany Hocking
Director of Investor Relations
Email: [email protected]
Tel: 0161 238 1845
Mobile: 07887 536 153