Page 1
Accepted Manuscript
Fully automated contour detection of the ascending aorta incardiac 2D phase-contrast MRI
Marina Codari, Marco Scarabello, Francesco Secchi, ChiarellaSforza, Giuseppe Baselli, Francesco Sardanelli
PII: S0730-725X(17)30267-9DOI: doi:10.1016/j.mri.2017.11.010Reference: MRI 8872
To appear in:
Received date: 7 September 2017Revised date: 15 November 2017Accepted date: 21 November 2017
Please cite this article as: Marina Codari, Marco Scarabello, Francesco Secchi, ChiarellaSforza, Giuseppe Baselli, Francesco Sardanelli , Fully automated contour detection of theascending aorta in cardiac 2D phase-contrast MRI. The address for the correspondingauthor was captured as affiliation for all authors. Please check if appropriate. Mri(2017),doi:10.1016/j.mri.2017.11.010
This is a PDF file of an unedited manuscript that has been accepted for publication. Asa service to our customers we are providing this early version of the manuscript. Themanuscript will undergo copyediting, typesetting, and review of the resulting proof beforeit is published in its final form. Please note that during the production process errors maybe discovered which could affect the content, and all legal disclaimers that apply to thejournal pertain.
Page 2
ACC
EPTE
D M
ANU
SCR
IPT
1
Fully Automated Contour Detection of the Ascending Aorta in Cardiac 2D
Phase-Contrast MRI
Marina Codaria, Marco Scarabello
b, Francesco Secchi
a, Chiarella Sforza
c, Giuseppe Baselli
d,
Francesco Sardanellia,e
a Unit of Radiology, IRCCS Policlinico San Donato, Via Morandi 30, San Donato Milanese, 20097,
Milan, Italy.
b Postgraduate School in Radiodiagnostics, Università degli Studi di Milano, Via Festa del Perdono
7, 20122, Milan, Italy
c Department of Biomedical Sciences for Health, Università degli Studi di Milano, Via Mangiagalli
31, Milan, 20133, Milan, Italy
d Department of Electronics, Information and Bioengineering, Politecnico di Milano, Piazza
Leonardo Da Vinci 32, Milan, 20133, Milan, Italy
e Department of Biomedical Sciences for Health, Università degli Studi di Milano, Via Morandi 30,
San Donato Milanese, 20097, Milan, Italy
Corresponding Author:
Marina Codari, MSc, PhD
Unit of Radiology, IRCCS Policlinico San Donato,
Via Morandi 30, San Donato Milanese, 20097, Milan, Italy.
Tel +39 0252774641; Fax +390252774925
E-mail: [email protected]
ACCEPTED MANUSCRIPT
Page 3
ACC
EPTE
D M
ANU
SCR
IPT
2
Abstract
Purpose: In this study we proposed a fully automated method for localizing and segmenting the
ascending aortic lumen with phase-contrast magnetic resonance imaging (PC-MRI).
Material and Methods: Twenty-five phase-contrast series were randomly selected out of a large
population dataset of patients whose cardiac MRI examination, performed from September 2008 to
October 2013, was unremarkable. The local Ethics Committee approved this retrospective study.
The ascending aorta was automatically identified on each phase of the cardiac cycle using a priori
knowledge of aortic geometry. The frame that maximized the area, eccentricity, and solidity
parameters was chosen for unsupervised initialization. Aortic segmentation was performed on each
frame using active contouring without edges techniques. The entire algorithm was developed using
Matlab R2016b. To validate the proposed method, the manual segmentation performed by a highly
experienced operator was used. Dice similarity coefficient, Bland-Altman analysis, and Pearson’s
correlation coefficient were used as performance metrics.
Results: Comparing automated and manual segmentation of the aortic lumen on 714 images,
Bland-Altman analysis showed a bias of -6.68 mm2, a coefficient of repeatability of 91.22 mm
2, a
mean area measurement of 581.40 mm2, and a reproducibility of 85%. Automated and manual
segmentation were highly correlated (R = 0.98). The Dice similarity coefficient versus the manual
reference standard was 94.6 ± 2.1% (mean ± standard deviation).
Conclusion: A fully automated and robust method for identification and segmentation of ascending
aorta on PC-MRI was developed. Its application on patients with a variety of pathologic conditions
is advisable.
Keywords: Aorta, Magnetic Resonance Imaging, Computer-Assisted Image Processing
ACCEPTED MANUSCRIPT
Page 4
ACC
EPTE
D M
ANU
SCR
IPT
3
1. Introduction
Monitoring cardiovascular disease progression from subclinical changes to advanced stages is
crucial for the definition of a target population to apply preventive strategies and perform
longitudinal studies [1,2]. Structural and functional changes in the aortic wall can induce arterial
stiffness, which is correlated with hypertension, associated with hearth failure, and is a major
predictor of stroke and myocardial infarction [3–5]. Aortic stiffness can be non-invasively measured
through different methodologies. An average estimate of aortic stiffness can be obtained measuring
pulse wave velocity by applanation tonometry [6]. On the other hand, local markers of aortic
elasticity in the different aortic segments can be estimated using magnetic resonance imaging (MRI)
[7,8]. In particular, phase-contrast MRI (PC-MRI) sequences application in cardiovascular imaging
allows to obtain quantitative information on blood flow. These sequences can be easily performed
during normal respiration or during breath-hold and MRI data acquisition can be synchronized with
the cardiac cycle using both prospective and retrospective gating techniques [9]. Due to their high
spatial and temporal resolution, these sequences are currently used to evaluate aortic elasticity in
clinical practice [8].
The estimation of local parameters of aortic elasticity strictly rely on the accuracy and
reproducibility of its lumen segmentation. In the last years, several attempts were performed to
overcome the limitations of manual tracing, which is time-demanding and operator-dependent
[2,10]. In particular, the high temporal resolution that can be achieved with PC-MRI sequence make
the manual delineation of the aortic lumen time-consuming, unsuitable for daily clinical workflow
and prone to measurement variability [2]. Moreover, the increasing number of data that can be
generated with advanced PC sequences can increase the time needed for manual segmentation up to
approximatively 30 minutes for a real time PC image series of 148 frames [11]. To overcome the
limitation of manual aortic lumen segmentation, in the last years several attempts were made to
reach the highest possible level of automation.
ACCEPTED MANUSCRIPT
Page 5
ACC
EPTE
D M
ANU
SCR
IPT
4
Automated aortic lumen segmentation on cine cardiac imaging requires the detection of the aorta
within the image and its segmentation throughout the whole cardiac cycle. Goel et al. proposed a
possible solution to the localization of ascending and descending aorta on 2D PC-MRI images in
2014. However, once detected, vessel lumen boundaries were approximated to a perfect circle, so
that local distensibility parameters could not be calculated [12]. In the last years, other research
groups proposed semi-automated methods for aortic lumen segmentation still requiring an operator
to perform a manual initialization of the segmentation process [8,11].
To the best of our knowledge, no methods were published that combine fully automated detection
and segmentation of the ascending aorta on PC-MRI images. Thus, the aim of our study was to
propose a fully automated method for localizing and segmenting the ascending aortic lumen on 2D
PC-MRI images.
2. Materials and methods
2.1. Dataset
The local Ethics Committee approved this retrospective study and informed consent by patients was
obtained. Twenty-five cardiac MR studies in 25 different subjects were randomly selected from a
database of 192 patients, whose cardiac MR examination was unremarkable and negative with
regard to the clinical question, being part of a large study dataset composed of 1027 consecutive
cardiac 2D PC-MRI images performed at our institution from September 2008 to June 2014. Our
sample was composed of 13 men and 12 women, whose age (mean ± standard deviation) was 37 ±
23 years (range 7-77 years). The selected MR studies were performed from September 2008 to
October 2013.
Images were acquired using a 1.5-T unit (Magnetom Sonata Maetsro Class, Siemens, Erlangen,
Germany). Breath-hold retrospectively electrocardiographically-gated two-dimensional phase-
contrast gradient recalled echo sequences were acquired on a transverse plane about 3 cm above the
aortic anulus, with a through-plane velocity encoding gradient ranging from 150 to 350 cm/s. In 23
ACCEPTED MANUSCRIPT
Page 6
ACC
EPTE
D M
ANU
SCR
IPT
5
out of 25 selected datasets, sequence parameters were set as follows: repetition time 41 ms; echo
time 3.2 ms; flip angle 30°; parallel imaging with acceleration factor 2, retrospective
electrocardiographic gating with 30 phases per cycle; in-plane spatial resolution of 1.3672 × 1.3672
mm2. The remaining two image series had the following acquisition parameters: repetition time 55
ms, echo time 3.2 ms, flip angle 30°; in-plane spatial resolution of 1.5625 × 1.5625 mm2;
retrospective electrocardiographic gating with 11 phases per cycle in one series and 13 phases per
cycle in the other one.
2.2. Ascending Aorta Detection
The automated detection of ascending aorta on 2D PC-MRI magnitude images required the aortic
contour to be automatically selected and distinguished by the algorithm form other closed-line
vessel-like structures. To this aim, the segmentation method started with the application of an edge
detection filter to delineate the anatomical structures included in each frame. To facilitate this
process, a sharpening preparatory step was performed in order to improve the contrast along image
edges. The unsharp masking technique was used to this aim setting the standard deviation of the
Gaussian lowpass filter at 2 pixels. After this preprocessing step, edge detection was performed
using the Canny method [13]. Once the edge-image was created, the closed edges were
automatically filled using morphological operators. This step allowed the detection of the vessels
included in each image frame. Thereafter, a binary image containing all vessels was created. Within
this image, for each vessel lumen were calculated: the area (A); the distance of its barycenter from
the image center (D); the solidity (S), which is the ratio between object area and the area of smallest
convex polygon that can contain it; the eccentricity (E), a scalar that indicates how much a conic
section deviates from being circular (E = 0 for a perfect circle). Finally, the ascending aorta was
automatically detected in each frame using a priori knowledge of aortic morphology. During this
process, for the three larger vessels depicted in each frame of the cardiac cycle, the “ascending
aortic score” (AAS) was calculated as follow:
ACCEPTED MANUSCRIPT
Page 7
ACC
EPTE
D M
ANU
SCR
IPT
6
The vessels that maximized this score and had an eccentricity value lower than 0.55 was labeled as
aorta in each frame of the cardiac cycle.
Due to the flow-induced variation of phase-contrast intensity during the cardiac cycle [8], it was not
possible to detect the ascending aorta in all the frames of the sequence. For this reason, among
vessels labeled as aorta in each frame of the cardiac cycle the one with the highest AAS was chosen
as “best frame”, which was used as initialization mask for the segmentation process.
2.3. Ascending Aorta Segmentation
The aortic lumen was segmented through the whole cardiac cycle using the active contour without
edges technique, which is suited to detect objects whose boundaries are not necessarily defined by
the image gradient, such as PC-MRI images [14]. The segmentation started with the “best frame”
using the binary image with the previously localized aortic lumen as initialization mask. After that,
the segmentation continued in a two steps process where the aortic lumen was segmented from the
best frame to the first frame (best-to-first branch) and from the best frame to the last frame of the
cardiac cycle (best-to-last branch). In each frame, the initialization mask was set as the binary
image obtained segmenting the t+1 or t-1 frame depending on the algorithm branch.
The active contour technique has two main regularization factors, namely the smoothness of the
boundaries (bS) and the tendency of the contour to grow or shrink (bG). In order to make the
algorithm able to segment ascending aortae with different stiffness, these parameters were pre-set to
standard values (bS = 2.0; bG = -0.3) and then iteratively optimized in each frame. The optimization
process stopping criteria were: i) an aortic eccentricity lower than 0.60; and ii) an area difference
between the initialization mask (namely the previous or subsequent segmented frame) and the
segmented area lower than 7% of the initialization mask. This parameter was empirically set to this
value based on the maximum area difference recorded in the original dataset of 1,027 2D PC-MRIs,
ACCEPTED MANUSCRIPT
Page 8
ACC
EPTE
D M
ANU
SCR
IPT
7
which comprises both healthy and pathological subjects. In that dataset the maximum area
difference between the systolic and diastolic phase was equal to 176% in image series of 30 frames.
For this reason, we set the upper limits of area increment to 200% on the whole cardiac cycle that,
assuming a gradual area increment during the cardiac cycle, corresponds to an area increment of
6.6% in each frame (successively rounded to 7%).
At the end of this process, the aortic lumen was segmented in each frame of the cardiac cycle. The
whole algorithm was developed using Matlab (MathWorks, Natick, MA, USA), version R2016b, on
an Intel i7 processor 2.5 GHz with 8 GB of RAM and an NVIDIA GeForce 940MX graphic card.
Its flowchart is depicted in Figure 1.
2.4. Validation
To validate the proposed segmentation method, manual tracing of the aortic lumen performed by an
expert operator was used as a reference standard. This operator was a radiology resident who had
previously manually segmented more than 1,300 2D PC-MRI series of the ascending aorta in a
large retrospective study (10). In order to evaluate the intra-operator agreement of repeated
measurements, the manual segmentation was performed twice on 10 randomly selected subjects
(300 images) with at least 3 months of interval between the two repetitions. Moreover, to evaluate
algorithm repeatability the operators run it two times on the whole dataset. Bland-Altman analysis
and the one-way random model inter-class correlation coefficient (ICC) were used to assess
operator and algorithm repeatability [15]. Elapsed time was also recorded for both manual and
automated segmentations, which were performed on the same computer used to develop the
proposed algorithm.
Bland-Altman analysis was also used to evaluate the agreement between the manual and automated
segmentation [15]. In addition, linear regression and Dice similarity coefficient [16] were used as
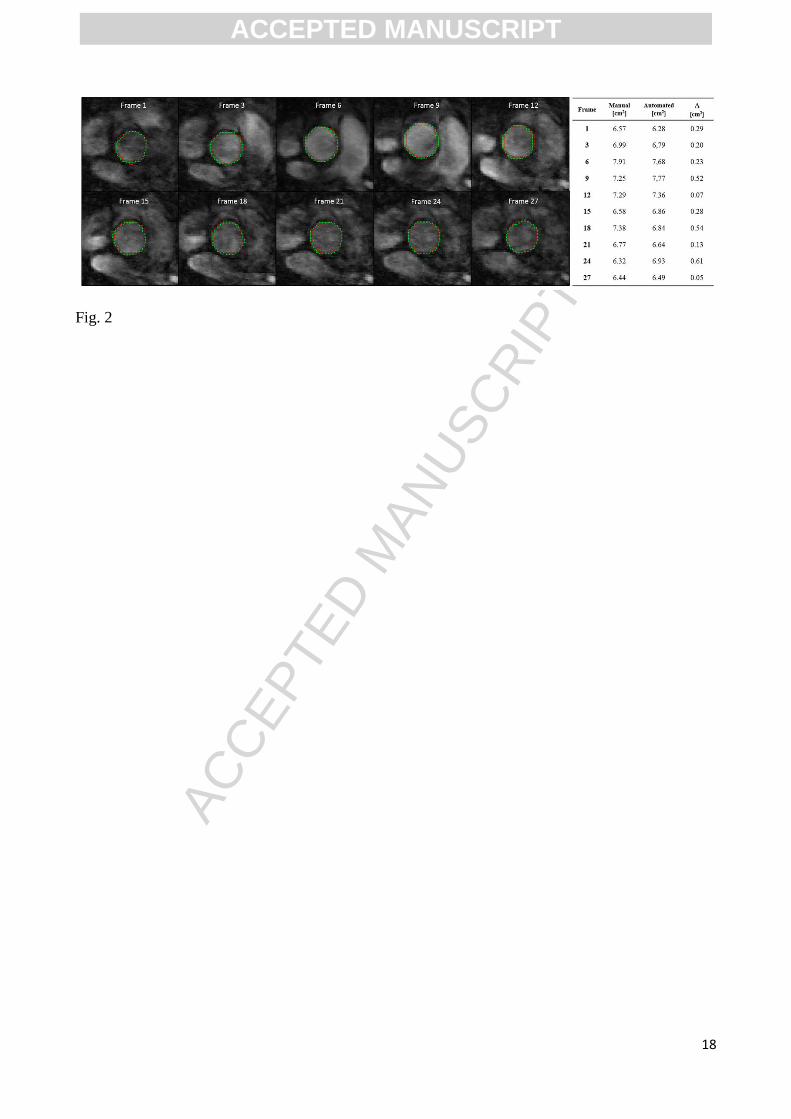
performance metrics. In Figure 2 an example of the comparison between manual and automated
segmentation is shown.
ACCEPTED MANUSCRIPT
Page 9
ACC
EPTE
D M
ANU
SCR
IPT
8
3. Results
The proposed segmentation method of the ascending aorta on 2D PC-MRI images was fully
automated and provides full repeatability, with an ICC value between repeated measurement equal
to 1.00 (95% confidence interval [CI]: 1.00 -1.00). The Bland-Altman analysis on repeated
measurements performed with the proposed algorithm shows a bias of 0.00 mm2 (95% CI: 0.00 –
0.00), a coefficient of repeatability (CoR) of 0.00 mm2 over a mean measurements of 622.63 mm
2,
resulting in a reproducibility of 100% (Figure 3a). The mean segmentation time for a 2D PC-MRI
image series composed of 30 frames (± standard deviation) was equal to 19.4 ± 11.7 sec in the case
of automatic segmentation.
On the other hand, intra-operator analysis of the manual segmentation process showed an ICC value
on single measurements equal to 0.989 (95% CI: 0.986 – 0.991). Intra-operator Bland-Altman
analysis showed: a mean area measurement equal to 612.45 mm2, a bias equal to -10.90 mm
2 (1.7%
of the average measurement), a 95% CI equal to -80.85 – 59.05 mm2, a CoR equal to 71.38 mm
2,
with a resulting reproducibility of 88% (Figure 3b). The mean manual segmentation time was 877.0
± 43.5 sec.
The algorithm was able to segment all frames of the analyzed dataset. Comparing the automated
and the manual segmentation approaches, the linear regression showed a high correlation value (R =
0.98, automated = 0.96 manual + 27 mm2). The Bland-Altman analysis showed a mean area
measurement equal to 581.4 mm2, a bias equal to -6.68 mm
2 (1.2% of the average measurement),
with a 95% CI equal to -96.07 – 82.72 mm2, a CoR equal to 91.22 mm
2 and a resulting
reproducibility equal to 85% (Figure 4). The Dice similarity coefficient resulted to be 94.6 ± 2.1%
4. Discussion
In this study, we developed a robust, accurate, and fully automated method for localization and
segmentation of the ascending aorta on two-dimensional PC-MRI magnitude images.
ACCEPTED MANUSCRIPT
Page 10
ACC
EPTE
D M
ANU
SCR
IPT
9
The proposed algorithm is fully repeatable, therefore minimizes the operator dependency of the
manual segmentation and all the limitations that stem from it, as can be seen in the Bland-Altman
plot of repeated manual measurements. Bland-Altman analysis demonstrated that the measurement
variability on repeated measurements is null in case of automated segmentation, making it suitable
for use in longitudinal assessment.
The algorithm was validated by comparison with manual tracing performed by a highly experienced
operator on 25 image series, corresponding to 714 images. The validation showed a high correlation
between the automated and manual tracing. However, considering that manual tracing suffers from
the operator-dependency, we also used the Bland-Altman analysis, more suitable when two methods
are compared without preliminary preference for one of them [15]. Finally, the Dice coefficient
demonstrated a high correspondence between automatically and manually traced contours,
comparable to those obtained by others using semi-automated methods [8].
During the last years, several semi-automated methods were developed using different segmentation
approaches, which still need to be manually initialized, thus compromising their reproducibility
[8,11,17–19]. In particular, Herment et al. developed a robust approach that requires the operator to
select a squared region of interest around the aorta [8]. On the other hand, Goel et al, to overcome
the initialization problem, proposed an automated tool for both ascending and descending aortic
lumen localization on 2D PC-MRI images. Although they developed a robust localization
algorithm, after being localized, the aortic lumen was just approximated as a perfect circle. For this
reason, their solution did not replace previous approaches that semi-automatically segment the aorta
because an accurate segmentation and the adherence to the actual anatomical structure is
fundamental to evaluate local aortic elasticity parameters [12].
Our results in term of Dice similarity coefficient (mean 94.6%) are very close to those obtained
from Herment et al. (mean 94.5%). However, in addition to the good results of this study, we
minimized the operator dependency. Moreover, the algorithm is designed to converge to a unique
ACCEPTED MANUSCRIPT
Page 11
ACC
EPTE
D M
ANU
SCR
IPT
10
solution, with null algorithm outcome variability; this makes it suitable for follow-up assessments
of aortic morphology and elasticity.
The algorithm was tested on a series of randomly selected subjects with negative cardiac PC-MRI
examination. One might argue that applying the algorithm only on healthy aortae is a relevant
limitation. Nevertheless, the wide age range of the included subjects (7-77 years) made it possible
to assess aortic elasticity at different ages, given the well-known reduction of aortic distensibility
even with normal ageing. [1]. Moreover, due to the design of the proposed algorithm, an enlarged
aortic lumen of an elderly man would have been easier to segment than a healthy child’s aorta,
which is more elastic. This apparent paradox is due to the reduced distensibility of an enlarged
aorta. Once the algorithm detected and segmented the aorta in the “best frame”, it easily tracked its
contours through the whole cardiac cycle. Moreover, the iterative calculation of the active
contouring regularization factors should make the algorithm able to segment different aortic
morphologies; some examples of segmentation outcome are depicted in Figure 5.
This study has limitations. Firstly, manual tracing was used as reference standard, even if it is
affected by intra- as well as inter-operator variability with a intra-operator reproducibility equal to
88%. However, manual contouring is still one of the most practiced segmentation methods in
cardiovascular MR imaging, when it comes to precisely delineate structures. Secondly, the methods
proposed here have been validated only for the ascending aorta. In order to extend the algorithm
application to different aortic segments or to other vessels, the localization parameters would need
to be adapted to the anatomical structure of interest.
In this study, the elastic deformation of the aortic wall was approximated as a linear area increment.
In particular, we set the maximum area increment or decrement for each phase of the cardiac cycle
equal to 7% based on the maximum area increment observed in the above mentioned population
database of 1,027 subject.
ACCEPTED MANUSCRIPT
Page 12
ACC
EPTE
D M
ANU
SCR
IPT
11
This assumption represents a simplification of the complex deformation process and could make
algorithm performance sample dependent. Nevertheless, the wide age range of this sample and the
full spectrum of physiological aortic deformations (i.e. low and high ascending aortic strain) on
which this algorithm has been tested make this experience-based choice mostly able to suite the
everyday clinical practice. However, the validation of the proposed algorithm on subjects belonging
to a larger and different sample will prove the strength of this assumption.
In this study, we used only the magnitude images to segment the ascending aortic lumen in order to
take advantage of the morphological information contained therein, which is crucial for ascending
aorta detection and segmentation initialization. Nevertheless, further performance improvement
could be obtained by combining both magnitude and phase image information to improve aortic
boundary detection during the active contour segmentation step.
Finally, the computational time of the algorithm is still relatively long (with a mean of about 20
seconds), albeit low if compared to the time needed to perform the manual segmentation
(approximatively equal to 15 minutes).
5. Conclusions
In conclusion, this study proposes a fully automated detection and segmentation method for the
ascending aorta on 2D cardiac PC-MRI images. Results show high performances in terms of
accuracy and reproducibility. This method may accelerates the evaluation of ascending aortic
morphology and elasticity minimizing operator dependency during lumen segmentation. Its
validation requires the application on larger series of patients with a variety of pathologic
conditions.
Funding
This study was supported by local research funds of the IRCCS Policlinico San Donato, a Clinical
Research Hospital partially funded by the Italian Ministry of Health.
ACCEPTED MANUSCRIPT
Page 13
ACC
EPTE
D M
ANU
SCR
IPT
12
Conflicts of interest
None.
ACCEPTED MANUSCRIPT
Page 14
ACC
EPTE
D M
ANU
SCR
IPT
13
References
[1] Redheuil A, Yu WC, Wu CO, Mousseaux E, De Cesare A, Yan R, et al. Reduced ascending
aortic strain and distensibility: Earliest manifestations of vascular aging in humans.
Hypertension 2010;55:319–26
[2] Medrano-Gracia P, Cowan BR, Suinesiaputra A, Young AA. Challenges of cardiac image
analysis in large-scale population-based studies. Curr Cardiol Rep 2015;17:563–74.
[3] Mattace-Raso FUS, Van Der Cammen TJM, Hofman A, Van Popele NM, Bos ML,
Schalekamp MADH, et al. Arterial stiffness and risk of coronary heart disease and stroke:
The Rotterdam Study. Circulation 2006;113:657–63.
[4] Giannattasio C, Achilli F, Failla M, Capra A, Vincenzi A, Valagussa F, et al. Radial, carotid
and aortic distensibility in congestive heart failure: Effects of high-dose angiotensin-
converting enzyme inhibitor or low-dose association with angiotensin type 1 receptor
blockade. J Am Coll Cardiol 2002;39:1275–82.
[5] Boutouyrie P, Tropeano AI, Asmar R, Gautier I, Benetos A, Lacolley P, et al. Aortic
Stiffness Is an Independent Predictor of Primary Coronary Events in Hypertensive Patients:
A Longitudinal Study. Hypertension 2002;39:10–5.
[6] Laurent S, Cockcroft J, Van Bortel L, Boutouyrie P, Giannattasio C, Hayoz D, et al. Expert
consensus document on arterial stiffness: Methodological issues and clinical applications.
Eur Heart J 2006;27:2588–605.
[7] Cavalcante JL, Lima JAC, Redheuil A, Al-Mallah MH. Aortic stiffness: Current
understanding and future directions. J Am Coll Cardiol 2011;57:1511–22.
[8] Herment A, Kachenoura N, Lefort M, Bensalah M, Dogui A, Frouin F, et al. Automated
segmentation of the aorta from phase contrast MR images: Validation against expert tracing
in healthy volunteers and in patients with a dilated aorta. J Magn Reson Imaging
ACCEPTED MANUSCRIPT
Page 15
ACC
EPTE
D M
ANU
SCR
IPT
14
2010;31:881–8.
[9] Lotz J, Meier C, Leppert A, Galanski M. Cardiovascular Flow Measurement with Phase-
Contrast MR Imaging: Basic Facts and Implementation. RadioGraphics 2002;22:651–71.
[10] Kozerke S, Botnar R, Oyre S, Scheidegger MB, Pedersen EM, Boesiger P, et al. Automatic
vessel segmentation using active contours in cine phase contrast flow measurements. J Magn
Reson Imaging 1999;10:41–51.
[11] Odille F, Steeden JA, Muthurangu V, Atkinson D. Automatic segmentation propagation of
the aorta in real-time phase contrast MRI using nonrigid registration. J Magn Reson Imaging
2011;33:232–8.
[12] Goel A, McColl R, King KS, Whittemore A, Peshock RM. Fully automated tool to identify
the aorta and compute flow using phase-contrast MRI: Validation and application in a large
population based study. J Magn Reson Imaging 2014;40:221–8.
[13] Canny J. A Computational Approach to Edge Detection. IEEE Trans Pattern Anal Mach
Intell 1986;PAMI-8:679–98.
[14] Chan TF, Vese LA. Active contours without edges. IEEE Trans Image Process 2001;10:266–
77.
[15] Bland JM, Altman DG. Statistical methods for assessing agreement between two methods of
clinical measurement. Lancet 1986;327:307–10.
[16] Zou KH, Warfield SK, Bharatha A, Tempany CMC, Kaus MR, Haker SJ, et al. Statistical
Validation of Image Segmentation Quality Based on a Spatial Overlap Index. Acad Radiol
2004;11:178–89.
[17] Van Der Geest RJ, Niezen R, Van Der Wall EE, De Roos A, Reiber JHC. Automated
measurement of volume flow in the ascending aorta using MR velocity maps: Evaluation of
ACCEPTED MANUSCRIPT
Page 16
ACC
EPTE
D M
ANU
SCR
IPT
15
inter- and intraobserver variability in healthy volunteers. J Comput Assist Tomogr
1998;22:904–11.
[18] Martin Rodriguez Z, Kenny P, Gaynor L. Improved characterisation of aortic tortuosity. Med
Eng Phys 2011;33:712–9.
[19] Chwialkowski MP, Ibrahim YM, Li HF, Peshock RM. A method for fully automated
quantitative analysis of arterial flow using flow-sensitized MR images. Comput Med
Imaging Graph 1996;20:365–78.
ACCEPTED MANUSCRIPT
Page 17
ACC
EPTE
D M
ANU
SCR
IPT
16
Figure 1. Flowchart of the proposed automated segmentation method. The flowchart shows the
main steps of the proposed algorithm: edge detection, vessel detection, ascending aorta detection
and its segmentation through the entire cardiac cycle.
Figure 2. Phase-contrast MR images of the ascending aorta on in a 44-year old female subject. Of
the 30 frames acquired, only 10 are shown, one frame every 3 frames. Comparison between
automated segmentation (green contour) and manual segmentation (red contour). The near-
complete overlapping of the two segmented areas can be appreciated. Area values obtained with
each method for each phase are reported in the table. = the absolute difference between manually
and automatically obtained areas.
Figure 3. Bland-Altman plot resulting from the comparison between repeated area measurements
performed automatically (A) and manually (B) on phase-contrast MR images in a subset of 10
subjects.
Figure 4. Bland-Altman plot resulting from the comparison between automatically (AA) and
manually (AM) segmented luminal areas of the ascending aorta on phase-contrast MR images in the
entire analyzed dataset.
Figure 5. Examples of segmentation outcomes (right) and their corresponding original images (left)
in case of different aortic lumen morphology.
ACCEPTED MANUSCRIPT
Page 18
ACC
EPTE
D M
ANU
SCR
IPT
17
Fig. 1
ACCEPTED MANUSCRIPT
Page 19
ACC
EPTE
D M
ANU
SCR
IPT
18
Fig. 2
ACCEPTED MANUSCRIPT
Page 20
ACC
EPTE
D M
ANU
SCR
IPT
19
Fig. 3
ACCEPTED MANUSCRIPT
Page 21
ACC
EPTE
D M
ANU
SCR
IPT
20
Fig. 4
ACCEPTED MANUSCRIPT
Page 22
ACC
EPTE
D M
ANU
SCR
IPT
21
Fig. 5
ACCEPTED MANUSCRIPT
Page 23
ACC
EPTE
D M
ANU
SCR
IPT
22
Highlights
1) Fully automated and robust detection and segmentation of the ascending aorta lumen
2) Fully reproducible segmentation tool suitable for longitudinal examinations
3) High correlation between automatically and manually segmented areas (R=0.98)
ACCEPTED MANUSCRIPT