FULTON COUNTY BOARD OF EDUCATION FY2014 Preliminary Budget Requests for Debt Service, Grants and Special Revenue, and School Nutrition Program Funds Budget Markup #2 Thursday, April 18, 2013 4:00 p.m. Dunwoody Springs Charter Elementary School For further information contact the Budget Services department at 404-763-6760.
Transcript
FULTON COUNTY BOARD OF EDUCATION
FY2014 Preliminary Budget Requests for Debt Service, Grants and Special Revenue, and School Nutrition
Program Funds
Budget Markup #2
Thursday, April 18, 2013
4:00 p.m.
Dunwoody Springs Charter Elementary School
For further information contact the Budget Services department at 404-763-6760.
FULTON COUNTY BOARD OF EDUCATION
FY2014 PRELIMINARY TENTATIVE BUDGETS FOR DEBT SERVICE, GRANTS/SPECIAL REVENUE, AND SCHOOL NUTRITION PROGRAM FUNDS
Table of Contents
1. Introduction • Description of Funds presented in Markup #2 1.1 • Budget Calendar 1.2 2. Debt Service Fund
• Q & A 2.1 • Multi-Year Debt Service Plan 2.2 • Millage Rate and Cash Flow Analysis 2.3
3. Grants and Special Revenue Fund • Introduction 3.1 • Grant Application Process 3.2 – 3.10
• Did you know? 3.11 • Special Revenue Fund – Description of Grants 3.12 – 3.30 • Financial Information FY2014 Tentative Summary Budget by Program 3.31 – 3.32 Grant Revenue Summary (Where does the money come from) 3.33
Grant Expenditures Summary by Function (Where does the money go?) 3.34 – 3.35 Five-Year Special Revenue Budget Summary 3.36
Looking Ahead 3.37 – 3.38
4. School Nutrition Program Fund • Q & A 4.1 • Contents of School Nutrition Program Fund 4.2 • Introduction 4.3 • Program Highlights for FY2014 4.4 – 4.14 • Smart Goals FY2014 4.15 – 4.16 • Summary of Forecasted Revenues and Projected Expenditures 4.17 – 4.23 5. Additional Information
1.1
INTRODUCTION
As required by the State DOE and the Governmental Accounting Standards Board (GASB), the accounts of the Fulton County School System are organized and operated on the basis of funds. Each fund is an independent fiscal and accounting entity and is considered a separate reporting entity, with a separate set of self-balancing accounts that comprise its assets, liabilities, fund balances, revenues, and expenditures. Fund accounting is designed to demonstrate legal compliance, greater accountability, and to assist financial management by segregating transactions related to certain government functions or activities. The following funds will be presented in Budget Markup #2:
• Debt Service Fund: Sometimes called the Bond Sinking Fund. This fund services all debts, mainly principal and interest payments, created as a result of a bond issue. The major revenue sources for this fund are Ad Valorem taxes and a transfer from SPLOST proceeds as approved by the School Board.
• Grants and Special Revenue Fund: This fund is used to account for the proceeds of specific revenue sources (other than Fiduciary Fund or Capital Programs Fund) that are legally restricted to specified purposes. The major revenue source is money received from the federal government for special programs such as Title I, Title II-A, Title VI-B, etc...
• The School Nutrition Program Fund: This fund is used to account for the United States Department of Agriculture (USDA)
approved School Nutrition Program. The intent of the school system is that the costs of the School Nutrition Service Fund be financed or recovered primarily through Federal resources and users’ charges. In Fulton County School System, the School Nutrition Program Fund is a self-supported program.
1.2
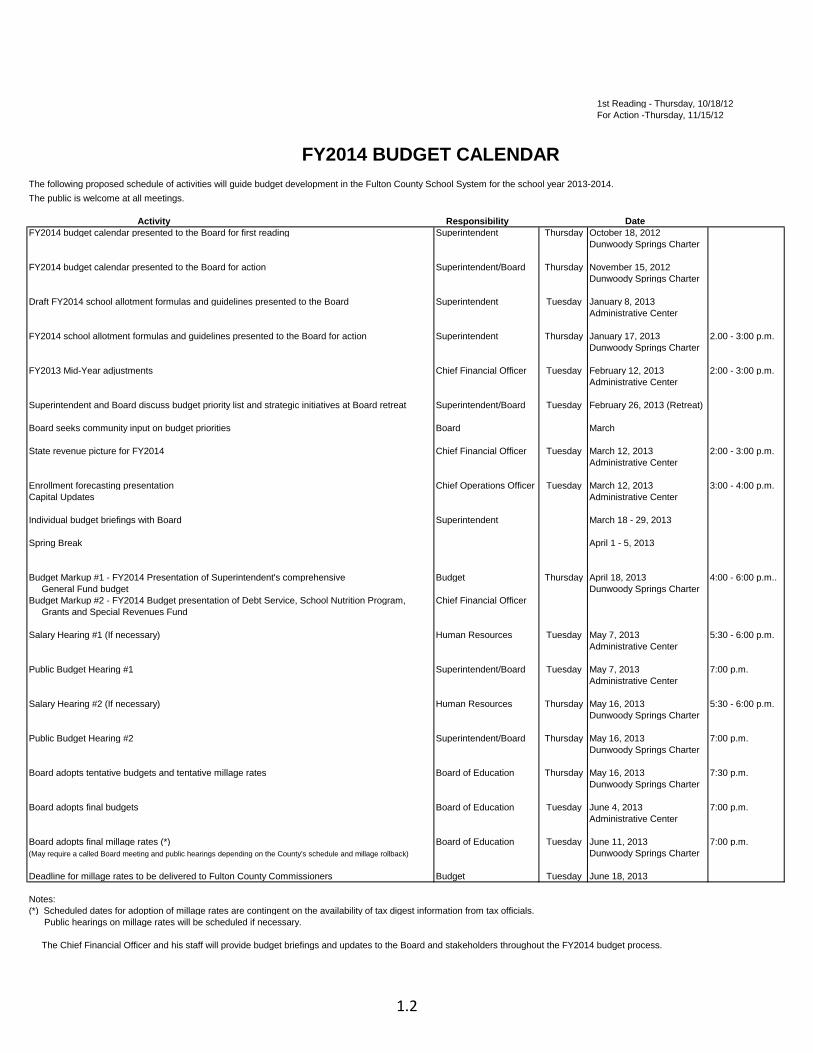
1st Reading - Thursday, 10/18/12 For Action -Thursday, 11/15/12
FY2014 BUDGET CALENDARThe following proposed schedule of activities will guide budget development in the Fulton County School System for the school year 2013-2014. The public is welcome at all meetings.
Activity Responsibility DateFY2014 budget calendar presented to the Board for first reading Superintendent Thursday October 18, 2012
Dunwoody Springs Charter
FY2014 budget calendar presented to the Board for action Superintendent/Board Thursday November 15, 2012Dunwoody Springs Charter
Draft FY2014 school allotment formulas and guidelines presented to the Board Superintendent Tuesday January 8, 2013 Administrative Center
FY2014 school allotment formulas and guidelines presented to the Board for action Superintendent Thursday January 17, 2013 2.00 - 3:00 p.m.Dunwoody Springs Charter
FY2013 Mid-Year adjustments Chief Financial Officer Tuesday February 12, 2013 2:00 - 3:00 p.m.Administrative Center
Superintendent and Board discuss budget priority list and strategic initiatives at Board retreat Superintendent/Board Tuesday February 26, 2013 (Retreat)
Board seeks community input on budget priorities Board March
State revenue picture for FY2014 Chief Financial Officer Tuesday March 12, 2013 2:00 - 3:00 p.m.Administrative Center
Enrollment forecasting presentation Chief Operations Officer Tuesday March 12, 2013 3:00 - 4:00 p.m.Capital Updates Administrative Center
Individual budget briefings with Board Superintendent March 18 - 29, 2013
Spring Break April 1 - 5, 2013
Budget Markup #1 - FY2014 Presentation of Superintendent's comprehensive Budget Thursday April 18, 2013 4:00 - 6:00 p.m.. General Fund budget Dunwoody Springs CharterBudget Markup #2 - FY2014 Budget presentation of Debt Service, School Nutrition Program, Chief Financial Officer Grants and Special Revenues Fund
Salary Hearing #1 (If necessary) Human Resources Tuesday May 7, 2013 5:30 - 6:00 p.m.Administrative Center
Public Budget Hearing #1 Superintendent/Board Tuesday May 7, 2013 7:00 p.m.Administrative Center
Salary Hearing #2 (If necessary) Human Resources Thursday May 16, 2013 5:30 - 6:00 p.m.Dunwoody Springs Charter
Public Budget Hearing #2 Superintendent/Board Thursday May 16, 2013 7:00 p.m.Dunwoody Springs Charter
Board adopts tentative budgets and tentative millage rates Board of Education Thursday May 16, 2013 7:30 p.m.Dunwoody Springs Charter
Board adopts final budgets Board of Education Tuesday June 4, 2013 7:00 p.m.Administrative Center
Board adopts final millage rates (*) Board of Education Tuesday June 11, 2013 7:00 p.m.(May require a called Board meeting and public hearings depending on the County's schedule and millage rollback) Dunwoody Springs Charter
Deadline for millage rates to be delivered to Fulton County Commissioners Budget Tuesday June 18, 2013
Notes:(*) Scheduled dates for adoption of millage rates are contingent on the availability of tax digest information from tax officials. Public hearings on millage rates will be scheduled if necessary.
The Chief Financial Officer and his staff will provide budget briefings and updates to the Board and stakeholders throughout the FY2014 budget process.
FY2014 TENTATIVE BUDGET Debt Service Fund
Table of Contents
Page Q&A 2.1 Multi-Year Debt Service Plan 2.2 Millage Rate and Cash Flow Analysis 2.3
2.1
FULTON COUNTY SCHOOLS Questions and Answers on Debt Service Fund (Q&A)
The following Q&A is presented to help the board, cabinet, staffs, and community better understand the contents and answer potential questions raised while reviewing this document. If further questions exist or additional clarification is needed, the Budget Services department will provide additional information. Debt Service Fund: 1. Question: What is the Debt Service Fund?
Answer: The Debt Service Fund is a separate budgetary entity used to account for the proceeds and expenditures associated with school district debts, mainly principal and interest payment, created as a result of a bond issue. The district currently has two General Obligation Bonds (GO ) outstanding.
2. Question: What type of expenditure is included in the Debt Service Fund?
Answer: Expenditures included in this fund are those associated exclusively with the school district long term-debts, mainly principal and interest payment, created as a result of a bond issue.
3. Question: What is the total amount still due in the Debt Service Fund?
Answer: The total amount of principal and interest due as of 06/30/2013 (after making the FY2013 payment) is approximately $126.54 million.
4. Question: When will this amount be fully paid off?
Answer: During the FY2008 budget development process, the board approved the financial plan that includes fully paying off this long-term debt within the next five years. However, the board subsequently elected to dedicate the millage intended to pay off the debt to the capital program to shore up sales tax receipts which fell sharply due to the financial crisis. The General Obligation debt will be paid off in 2021. Please see Debt Service, Section 2, page 2.3.
5. Question: Where does the money come from to cover the yearly expenditures included in the Debt Service Fund (mainly principal
and interest)?
Answer: The money for the GO bonds comes from mainly two separate sources: Ad valorem taxes through millage rate and transfer from SPLOST proceeds as approved by the taxpayers and the school board.
Local Revenues $0 $0 $0 $0 $0 $11,917,992Interest Income 86,000 40,000 15,000 7,500 10,000 10,000Incoming Transfers from SPLOST IV 0 0 16,203,288 19,983,994 17,597,528 0
Total Revenues and Other Resources ( I ) $86,000 $40,000 $16,218,288 $19,991,494 $17,607,528 $11,927,992
Debt Service Interest on Debt Service $6,730,812 $5,799,032 $4,915,044 $4,013,994 $3,084,356 $2,326,344 Redemption of Bond 15,960,000 15,280,000 15,620,000 15,970,000 13,350,000 9,805,000 Subtotal of Principal and Interest 22,690,812 21,079,032 20,535,044 19,983,994 16,434,356 12,131,344 Fiscal Agent 3,000 3,000 3,000 3,000 3,000 3,000
Total Expenditures and Other Uses ( II ) $22,693,812 $21,082,032 $20,538,044 $19,986,994 $16,437,356 $12,134,344
Est. Revenues in excess of Expenditures ( III = I - II ) -$22,607,812 -$21,042,032 -$4,319,756 $4,500 $1,170,172 -$206,352
Est. Beginning Fund Balance ( IV ) $47,975,600 $25,367,788 $4,325,756 $6,000 $10,500 $1,180,672
Est. /Ending Fund Balance ( V = III + IV ) $25,367,788 $4,325,756 $6,000 $10,500 $1,180,672 $974,320
2.3
FULTON COUNTY SCHOOL DISTRICT DEBT SERVICE REQUIREMENTSDEBT SERVICE FUND FY 09 TO MATURITYMILLAGE RATE & CASH FLOW ANALYSIS
1 FY 2009- 2012 per audited financial statements, estimates thereafter2 Millage is levied on the assessed value as of January 1 of the pervious year. For example: in FY 2018 , .440 milll will be levied in the fall of 2017 on the assessed value of property on 01/01/2017 (the 2017 Tax Digest).3 Assumes the value of one mill in FY 15 through FY 21 is approximately $27.6 million.
FY2014 TENTATIVE BUDGET Grants and Special Revenue Fund
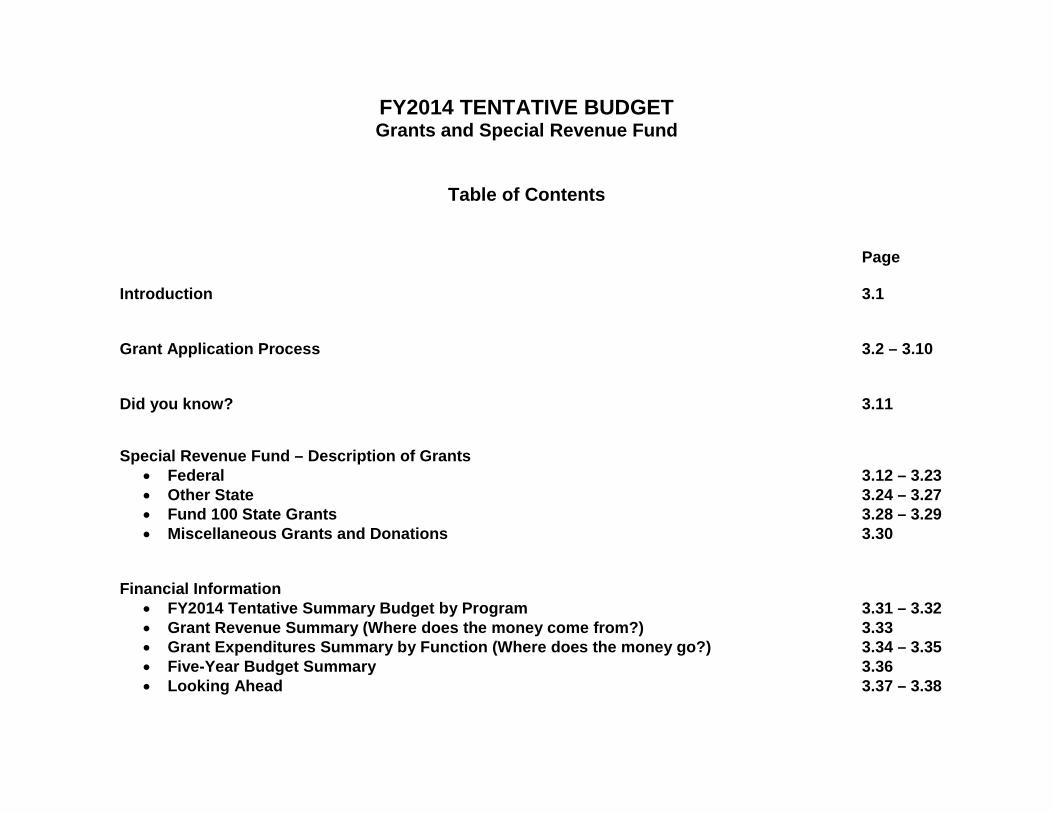
Table of Contents
Page Introduction 3.1 Grant Application Process 3.2 – 3.10 Did you know? 3.11 Special Revenue Fund – Description of Grants
• Federal 3.12 – 3.23 • Other State 3.24 – 3.27 • Fund 100 State Grants 3.28 – 3.29 • Miscellaneous Grants and Donations 3.30
Financial Information
• FY2014 Tentative Summary Budget by Program 3.31 – 3.32 • Grant Revenue Summary (Where does the money come from?) 3.33 • Grant Expenditures Summary by Function (Where does the money go?) 3.34 – 3.35 • Five-Year Budget Summary 3.36 • Looking Ahead 3.37 – 3.38
3.1
Grants and Special Revenue Fund
INTRODUCTION
The Fulton County School System recognizes that valuable supplemental funding for our instructional programs is provided by grants from various outside agencies and organizations, including state and federal agencies, as well as private organizations. The tentative grant information presented here represents an early estimate of the grant programs expected for FY2014 and has been developed based on information currently available. This document does not list all grants that the Fulton County School System may pursue during the year, nor does it represent the total amount that will be awarded by the grantors during Fiscal Year 2013-2014. Unless a grant application is officially approved by a grantor, there is still a level of uncertainty regarding funding, especially with the numerous small grants that our school system is awarded. When the State provides final allocations, we will present you with updated grant budget proposals. Final revised grant budgets, as approved and amended by the State and other grantors will be presented to you in the monthly board report. All grant proposals are tentative pending final approval by the grantors. During the year, additional grant opportunities may arise. Information on additional grants will be provided as it becomes available.
Updated April 2013
3.2
GRANT APPLICATION PROCESS Grant Submission Checklist � Inform Principal or Department Head of intent to submit a grant proposal or intent to participate in a
grant with another organization. Discuss grant objectives, alignment to strategic plan, grant budget, reporting requirements, roles and responsibilities, etc.
� Contact the Office of Grant Development 404-763-6772, for assistance developing your grant, as appropriate.
� Complete the Grant Approval Form. There are 3 separate forms: 1) for grants under $5,000, 2) for grants valued $5,000 to $49,999, and 3) for grants valued $50K or more.
� Attach the grant proposal and grant budget to the completed Grant Approval Form. � Route the Grant Approval Form with the attached grant proposal and budget to the appropriate
administrators. Secure signatures for approval based on the amount of funding being requested. Allow up to 3 weeks to obtain approvals prior to grant submission. Coordinate with the Office of Grant Development to facilitate securing signatures in the Central Office. Grant Approval Forms submitted within a week of the grant deadline will not be accepted.
Approvals for Grants under $5K: • School-Based Grants – Both the Principal and Area Superintendent must approve and sign.
If multiple schools are involved in the grant, each participating Principal and Area Superintendent must approve and sign.
• Departmental Grants – Both the Departmental Director and Executive Staff Representative must approve and sign.
Approvals for Grants from $5K to $49,999: • School-Based Grants – The Principal, Area Superintendent, Coordinator Grant Development,
and the Chief Financial Officer must approve and sign. If multiple schools are involved in the grant, each participating Principal and Area Superintendent must approve and sign.
• Departmental Grants – The Departmental Director, Executive Staff Representative, Coordinator Grant Development, and the Chief Financial Officer must approve and sign.
Approvals for Grants $50K or higher: • School-Based Grants - Principal, Area Superintendent, Coordinator Grant Development,
Chief Financial Officer, Cabinet Representative, and Superintendent must approve and sign. If multiple schools are involved in the grant, each participating Principal and Area Superintendent must approve and sign.
• Departmental Grants – Departmental Director, Executive Staff Representative, Coordinator Grant Development, Chief Financial Officer, Cabinet Representative, and Superintendent must approve and sign.
� Complete grant application according to guidelines provided by the grantor. � Submit grant application to the grantor once the Grant Approval Form has been approved by all the
required administrators. � Send the Grant Approval Form with original signatures along with a copy of the grant proposal and
budget to the Office of Grant Development, Administrative Center. This information is needed to provide updates to the School Board per board policy DFC.
� Inform the Office of Grant Development if the grant is funded or not. This information is needed for the monthly grant report to the School Board.
Key Factors to Consider � If the grant proposal includes a research component (any form of data retrieval, collection, analysis,
evaluation, etc.), contact the Accountability Division and complete the research application prior to grant submission. Allow 6-8 weeks for application review.
• The research application should be completed if you or partnering organizations are requesting data for a needs assessment or other background information related to the grant application.
• If an external evaluator will be collecting data as part of the evaluation plan, then the research application should be completed by the external evaluator.
• If only one school will be involved and data collection will be conducted entirely by school system employees who work at that school, then the review and approval of the research proposal will be the responsibility of the Principal.
� If the grant application requires a Memorandum of Agreement (MOA) or a Memorandum of Understanding (MOU), the terms and conditions may need to be reviewed by Nelson Mullins. Your Cabinet Representative can approve a Request for Legal Review form. Factor in the lead time required to secure legal approval prior to routing the Grant Approval Form.
� If the grant budget includes purchasing equipment, indicate in the ‘School / Department Responsibilities’ section of the Grant Approval Form how the equipment will be supported and how you will provide training to use the equipment. For example, you should include in the grant budget funding for Apple Product Support if you plan to purchase iPod Touches and funding for training users.
� If the grant includes any sort of alterations to existing buildings and grounds, e.g., building a school garden, expanding play structures, etc., you must secure approval from Facilities Services prior to routing the Grant Approval Form.
� If you are partnering with a non-profit organization or an Institute of Higher Education that plans to use school facilities as part of the grant proposal, e.g., an after-school program requesting classroom space, etc., complete a Facility Use Application in SchoolDude and include funding in the grant budget to lease facility space according to the fee schedule.
� If a non-profit organization or an Institute of Higher Education wants a letter of support from your school or department, you must complete the Grant Approval Form and attach the letter of support to be signed.
� Based on certain factors, the School Board will need to be notified and in some cases approve grant proposals prior to submission per board policy DFC. Contact the Office of Grant Development to discuss.
• If a grant is directly aligned with the strategic plan, and is in an amount greater than $500,000, then the School Board must be notified prior to submission of the application.
• If a grant is not directly aligned with the strategic plan, and is in an amount greater than $100,000, then the School Board must be notified prior to submission of the application.
• Grant applications requiring matching funds in cash that have not been budgeted must receive School Board approval prior to the application being submitted. In-kind contributions (vs. a cash match) do not require School Board approval. Discuss the approval process for unbudgeted matching funds in cash with your Area Superintendent or Executive Staff Representative.
Grant Award Grant Awards under $5K: • Grant funds should be deposited and managed in the local school fund. • If the grantor is a local, state or federal government agency, regardless of the grant award
amount, the grant award must be reported to Budget and Accounting and deposited in a special revenue fund at the district level.
• If the grant includes stipends, regardless of the grant award amount, the grant award must be reported to Budget and Accounting and deposited in a special revenue fund at the district level.
• The Audit Department may conduct an internal audit of grant awards deposited in local school funds.
Grant Awards $5K or Higher: • Grant managers should inform the Budget Department when they receive a grant valued at
$5K or more. The Budget Department will forward to the grant manager a budget form to complete based on the grantor’s approved award amount. The budget form will be used to establish accounts and make funds available. Once the budget form is completed and returned to the Budget Department, the new grant will be assigned an SAP number and set up for budgeting and accounting purposes. Grant managers will be notified via email when funds are available to use. The Budget Department will report and track these grants on a monthly basis.
• Grant managers should also inform the Accounting Department when they receive a grant valued at $5K or more. The Accounting Department will submit draw down requests, assist with expenditure posting questions, and will submit required financial reports. If grant managers prefer submitting reports directly to grantors, the original prepared report must be reviewed by the Accounting Office prior to the submission deadline. Please note: All financial reports must be signed by the CFO or his designee.
• The Accounting Department is available to meet periodically with grant managers and their staff to provide assistance with grant reviews and training.
Contact Information
Grant Development: Kelly Hopkins 404-763-6773 and Staci Lynch 404-763-4573 Accountability: Wayne Bellcross 404-669-4933 Budget: Jennifer Banks 404-763-6760 Accounting: Cassandra Maddox 404-763-6835
Updated April 2013
3.5
Grant Approval Form Grants Valued Less Than $5,000
School or Department Name:
FCS Contact Person: (Person who wrote the grant application or who is working with the partnering organization)
Phone: (For the Contact Person)
Email: (For the Contact Person)
Grant Name: (Provide the name for your grant application)
Grantor (Funding Agency): (Indicate who is the funding organization)
Purpose of grant: (Provide brief overview of the grant, e.g., goals, outcomes, etc.)
Grant Deadline: (Date grant is due)
School / Department Responsibilities: (What are the expectations for staff/students involved with the grant? What are our obligations related to grant implementation? For example, do staff members have to complete surveys or collect data?)
Grant Period: (Period of time during which a funded project is in operation, e.g., 1 year)
Total amount requested: (Dollar amount of the grant)
Fiscal Agent: (The organization responsible for the grant budget, e.g., FCS, a non-profit, an Institute of Higher Education)
Fulton County Schools Other entity (provide name):
Does grant involve other schools? Yes (list schools involved): (If yes, list schools involved) No Does grant involve other departments? Yes (list departments involved): (If yes, list departments involved) No Does grant require matching funds? (Cash Match not budgeted must receive School Board approval prior to grant submission)
Yes (list amount of match below) No
Cash Match: $_________ or In-kind Match: $_________
Attach the grant narrative and grant budget to this form for approvers to review
Updated April 2013
3.6
Grant Approval Form Grants Valued Less Than $5,000
(Allow 3 weeks for approval)
School-Based Grants – if multiple schools are involved each Principal and Area Sup should sign
Principal
Print Name Signature Date Area Super-intendent
Print Name Signature Date
Departmental Grants – if multiple departments are involved, each Dept Dir and Exec Staff Rep should sign
Depart-mental Director
Print Name Signature Date Executive Staff Rep
Print Name Signature Date
Note: Authorization to Seek Grant Funding Forms submitted within a week of the grant deadline will not be accepted.
Updated April 2013
3.7
Grant Approval Form Grants Valued from $5,000 to $49,999
School or Department Name:
FCS Contact Person: (Person who wrote the grant application or who is working with the partnering organization)
Phone: (For the Contact Person)
Email: (For the Contact Person)
Grant Name: (Provide the name for your grant application)
Grantor (Funding Agency): (Indicate who is the funding organization)
Purpose of grant: (Provide brief overview of the grant, e.g., goals, outcomes, etc.)
Grant Deadline: (Date grant is due)
School / Department Responsibilities: (What are the expectations for staff/students involved with the grant? What are our obligations related to grant implementation? For example, do staff members have to complete surveys or collect data?)
Grant Period: (Period of time during which a funded project is in operation, e.g., 1 year)
Total amount requested: (Dollar amount of the grant)
Fiscal Agent: (The organization responsible for the grant budget, e.g., FCS, a non-profit, an Institute of Higher Education)
Fulton County Schools Other entity (provide name):
Does grant involve other schools? Yes (list schools involved): (If yes, list schools involved) No Does grant involve other departments? Yes (list departments involved): (If yes, list departments involved) No Does grant require matching funds? (Cash Match not budgeted must receive School Board approval prior to grant submission)
Yes (list amount of match below) No
Cash Match: $_________ or In-kind Match: $_________
Attach the grant narrative and grant budget to this form for approvers to review
Updated April 2013
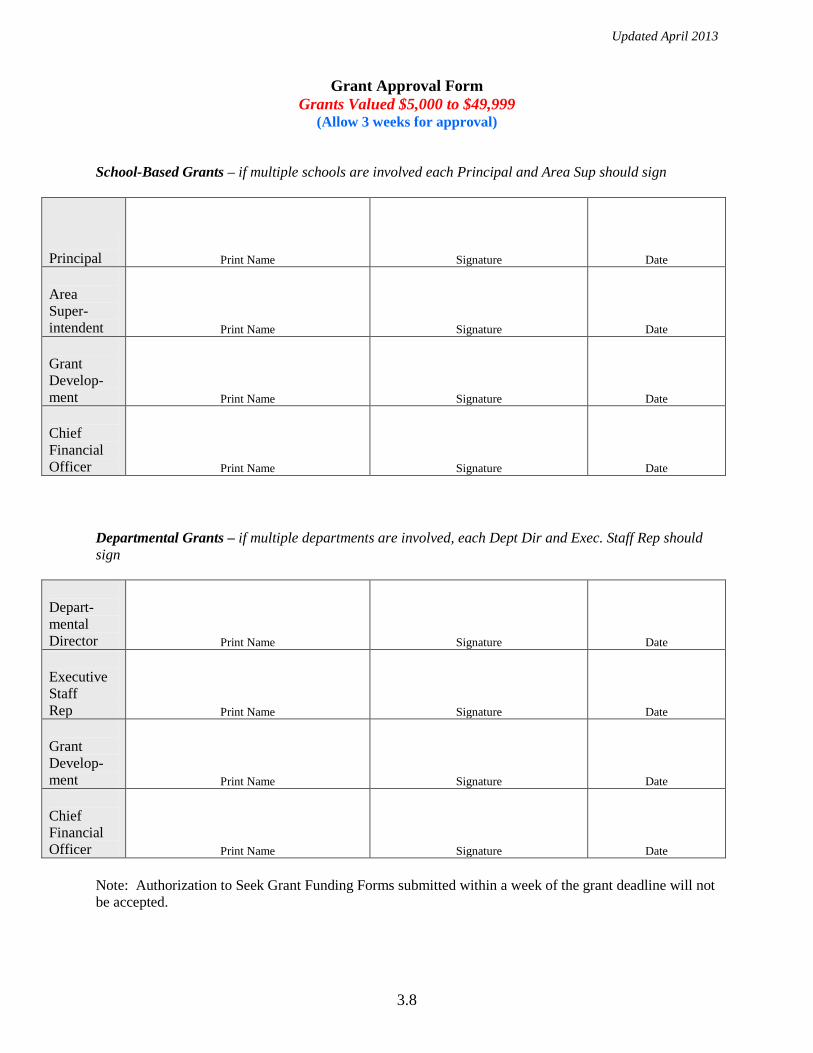
3.8
Grant Approval Form Grants Valued $5,000 to $49,999
(Allow 3 weeks for approval)
School-Based Grants – if multiple schools are involved each Principal and Area Sup should sign
Principal
Print Name Signature Date Area Super-intendent
Print Name Signature Date Grant Develop- ment
Print Name Signature Date Chief Financial Officer
Print Name Signature Date
Departmental Grants – if multiple departments are involved, each Dept Dir and Exec. Staff Rep should sign
Depart-mental Director
Print Name Signature Date Executive Staff Rep
Print Name Signature Date Grant Develop- ment
Print Name Signature Date Chief Financial Officer
Print Name Signature Date
Note: Authorization to Seek Grant Funding Forms submitted within a week of the grant deadline will not be accepted.
Updated April 2013
3.9
Grant Approval Form Grants Valued $50,000 or Higher
School or Department Name:
FCS Contact Person: (Person who wrote the grant application or who is working with the partnering organization)
Phone: (For the Contact Person)
Email: (For the Contact Person)
Grant Name: (Provide the name for your grant application)
Grantor (Funding Agency): (Indicate who is the funding organization)
Purpose of grant: (Provide brief overview of the grant, e.g., goals, outcomes, etc.)
Grant Deadline: (Date grant is due)
School / Department Responsibilities: (What are the expectations for staff/students involved with the grant? What are our obligations related to grant implementation? For example, do staff members have to complete surveys or collect data?)
Strategic Plan Alignment (Is the grant directly aligned with the strategic plan? If yes, indicate which strategic initiative)
Yes (list the strategic initiative): No
Grant Period: (Period of time during which a funded project is in operation, e.g., 1 year)
Total amount requested: (Dollar amount of the grant)
Fiscal Agent: (The organization responsible for the grant budget, e.g., FCS, a non-profit, an Institute of Higher Education)
Fulton County Schools Other entity (provide name):
Does grant involve other schools? Yes (list schools involved): (If yes, list schools involved) No Does grant involve other departments? Yes (list departments involved): (If yes, list departments involved) No Does grant require matching funds? (Funds not budgeted must receive School Board approval prior to grant submission)
Yes (list amount of match below) No
Cash Match: $_________ or In-kind Match: $_________
Attach the grant narrative and grant budget to this form for approvers to review
Updated April 2013
3.10
Grant Approval Form Grants Valued $50,000 or Higher
(Allow 3 weeks for approval)
School-Based Grants – if multiple schools are involved each Principal and Area Sup should sign
Principal
Print Name Signature Date
Area Super-intendent
Print Name Signature Date
Grant Develop- ment
Print Name Signature Date
Chief Financial Officer
Print Name Signature Date
Cabinet Member
Print Name Signature Date
Super-intendent
Print Name Signature Date
Departmental Grants – if multiple dept’s are involved, each Dept Dir and Exec. Staff Rep should sign
Depart-mental Director
Print Name Signature Date
Executive Staff Rep
Print Name Signature Date
Grant Develop- ment
Print Name Signature Date
Chief Financial Officer
Print Name Signature Date
Cabinet Member
Print Name Signature Date
Super-intendent
Print Name Signature Date
Note: Authorization to Seek Grant Funding Forms submitted within a week of the grant deadline will not be accepted.
3.11
Did you know?
1. Currently, Fulton County Schools grant revenue budget exceeds $61 million dollars.
2. There are 53 federal, state, and local grants managed in our financial system.
3. There are 20 different grant managers, some managing multiple grants.
4. Fulton County Schools has won a second round of funding, $3.2M for the Striving Reader Comprehensive Literacy grant. The grant provides funding for literacy initiatives that address the needs of students from pre-k through 12th grade. Fulton is the only school district to be awarded funding for two consecutive years. Also, 14 Fulton high schools have received nearly $18,000 in grants for the training of teachers at 2013 advanced Placement Summer Institutes. The institute provides teachers with the support and training needed to teach AP courses and allow opportunities to exchange ideas and information about AP courses and exams. In addition, two Race to the Top grants (Innovation Fund which supports the system’s transition from a traditional school system to a charter and Education Resource Strategies which will be used to supplement local funding to develop teacher compensation models) were awarded to Fulton to support district-wide initiatives.
5. In FY2014, grant revenues will fund approximately 853.51 various positions. Approximately 93% of these positions are allocated in the schools, and the remaining positions provide school support.
6. Most federal revenue is allocated through the Georgia Department of Education to the school district.
7. There is a required internal pre-approval process before a grant application can be submitted. Contact the office of Grant Development at 404-763-6772.
8. Training for grant managers and their team is available and coordinated by the Grants Budget Analyst and the Grants Accountant.
3.12
Special Revenue Fund
Special Revenue Funds are used to account for those funds that are restricted to specific purposes. Most of the federal, state, and local grants that the district receives are accounted for in the special revenue fund and must be spent and accounted for according to the specific grant requirements. Should the funding for most of these programs be eliminated, it is likely that the services would also be eliminated unless another funding source is identified. Below is a brief description of the various types of grants included in this section.
Federal grants are mostly allocated through the Georgia Department of Education to the school district. Title I, which provides remedial education, is one of our largest federal programs. Another major federal program is Title VIB for exceptional children.
• Title I –A, Improving the Academic Achievement of the Disadvantage (402) is used to provide federal funds through the Georgia Department of Education to LEAs and public schools with high numbers or percentages of poor children to help ensure that all children meet challenging State academic content and student achievement standards.
• Title I-A, School Improvement (402) is used for schools identified for school improvement, corrective action, and restructuring for activities under section 1116(b).
• Title I-A, Reward Schools (402) is used to honor and reward K-12 Title I schools and school districts for significant progress in improving student achievement and/or making significant progress in closing the achievement gap. Note: See Title I supplemental information on next nine pages.
3.13
1. Question: What schools are expected to receive Title I, Part A funds in FY2014?
Answer: The following schools did not receive Title I funds in FY2013 but are expected to receive the funds in FY2014 based upon eligibility criteria as defined by the federal guidelines: Langston Hughes HS. Manning Oaks ES will no longer be eligible to receive Title I funds due to a decrease in Free and Reduced percentage.
2. Question: Do we actually use 35% as the poverty rate to allocate Title I, Part A funds? Who made this decision?
Answer: Yes, this information is correct based on the survey of several metro school districts. Eight years ago, during the budget development process, our board directed us to start using 35% rather than 40% as the minimum poverty rate for allocating Title I, Part A funds.
3. Question: Are all Title I, Part A funds earned by the district distributed to the schools, or does the district keep a portion of Title I funds at the central
level? Answer: Most Title I funds flow to the schools using the following two layers of allocation:
I. Direct distribution based on Per Pupil Allocation.
II. Indirect distribution in the form of school-based positions and services such as Lead Data Support Specialists, Lead ELA Specialists and Lead
Math Specialists for the Learning Communities, Flexible Learning Programs, parental involvement, professional development for improving quality of teachers, Summer Camp, homeless, neglected and delinquent and equitable services for Fulton County disadvantaged students who attend private schools.
As required by the state and federal guidelines, at least 5% of Title I, Part A funds must be set aside under the Elementary and Secondary Education Act (ESEA) for Flexible Learning Programs, and 1% for parental involvement.
4. Question: What is Sequestration?
Answer: The sequestration trigger-cuts were put in place as part of an effort to raise the debt ceiling last summer. They called it “sequestration” which is a legal procedure where automatic spending cuts are implemented to balance the budget. The sequester was implemented on March 1, 2013. When “sequestration” happens – Title I Part A funds will be automatically reduced by approximately 8-10% for FY14
5. Question: What steps has Fulton County taken to prepare for sequestration?
Answer: We have set aside a total of $1,736,584 (9.1%) in anticipation of sequestration. The school draft budgets will be developed on any remaining funds after sequestration. School districts typically receive preliminary allocations from the GaDOE at the Annual Title I Conference held in Atlanta in late June. The DOE has advised districts to anticipate 8-10% in cuts due to sequestration and reductions to federal grants.
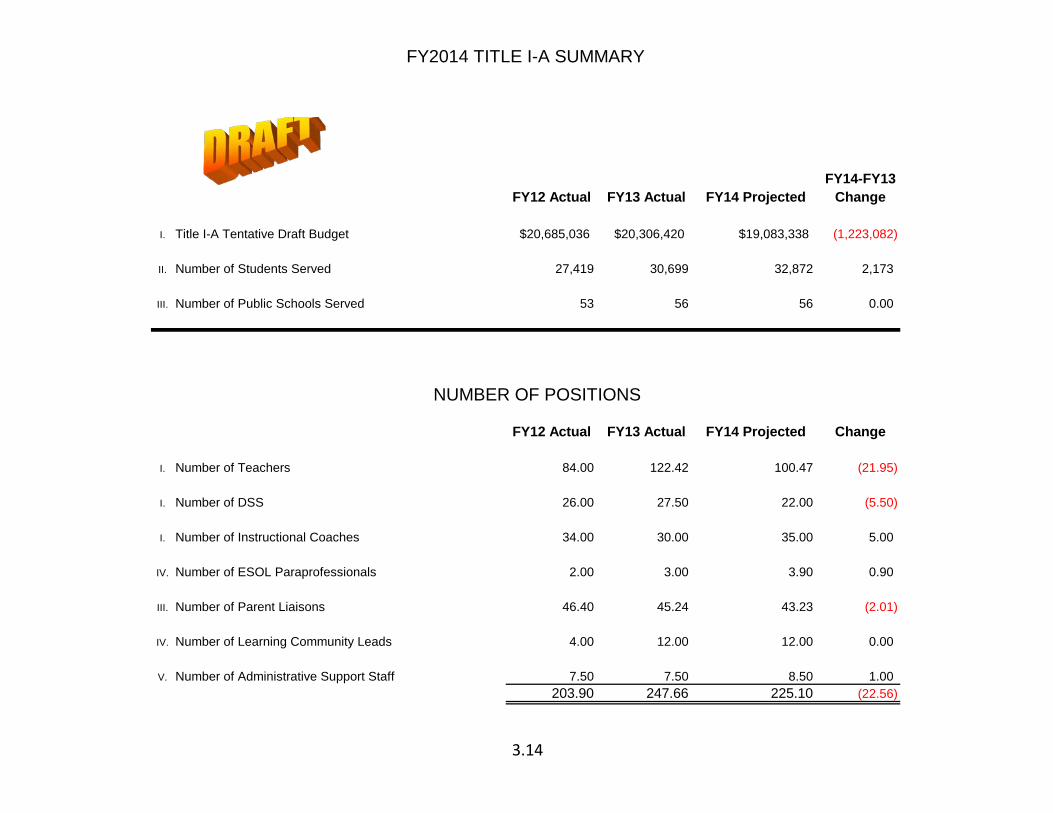
FY2014 TITLE I-A SUMMARY
3.14
FY14-FY13FY12 Actual FY13 Actual FY14 Projected Change
I. Title I-A Tentative Draft Budget $20,685,036 $20,306,420 $19,083,338 (1,223,082)
II. Number of Students Served 27,419 30,699 32,872 2,173
III. Number of Public Schools Served 53 56 56 0.00
FY12 Actual FY13 Actual FY14 Projected Change
I. Number of Teachers 84.00 122.42 100.47 (21.95)
I. Number of DSS 26.00 27.50 22.00 (5.50)
I. Number of Instructional Coaches 34.00 30.00 35.00 5.00
IV. Number of ESOL Paraprofessionals 2.00 3.00 3.90 0.90
III. Number of Parent Liaisons 46.40 45.24 43.23 (2.01)
IV. Number of Learning Community Leads 4.00 12.00 12.00 0.00
V. Number of Administrative Support Staff 7.50 7.50 8.50 1.00203.90 247.66 225.10 (22.56)
NUMBER OF POSITIONS
3.15
FY2014 Budget Summary Explanation
• Students served including private students increased from 30,699 to 32,872 (2,173 student increase) due to the reduction of one
elementary school and the addition of one high school.
• School Per Pupil Allocation (PPA) will decrease as follows:
- $90 decrease per student in schools above 75% poverty level (from $500
in FY13 to $410 in FY14)
- $80 decrease per student in schools below 75% poverty level (from $460
in FY13 to $380 in FY14)
• Schools served – 56 schools, 13 private and 7 neglected institutions
Added one additional Title I school - Langston Hughes HS. Eliminated one
Title I elementary school – Manning Oaks.
HISTORY OF TITLE I CARRYOVER
Year Carryover
2008-09 $0.6M
2009-10 $1.2M
2010-11 $3.1M
2011-12 $3.6M
2012-13 $2.2M
FY2014 TITLE I PRELIMINARY BUDGET ALLOCATION SUMMARY
I. Direct School Allocation Improvement of Instruction plus Neglected & Delinquent (N/D), Private Schools, Education of Children & Youth in Transition, Lead ELA/Math Specialists, Lead Data Support Specialists, Reading Literacy Support, Parent Involvement (School Support), and Summer Camp $8,597,947 43% $16,128,235 79% $15,147,465 79%
Subtotal ( I ) $8,597,947 43% $16,128,235 79% $15,147,465 79%
II. Set Asides and/or Additional Support to Schools (Includes Flexible Learning Program (FLP), Professional Development, and Hi-Q) $10,112,718 $3,102,582 $1,116,987
III. Indirect Cost $446,890 $368,845 $346,629IV. Program Management & Administrative Cost $976,111 $706,758 $735,673V. Sequestration Set Aside $0 $0 $1,736,584
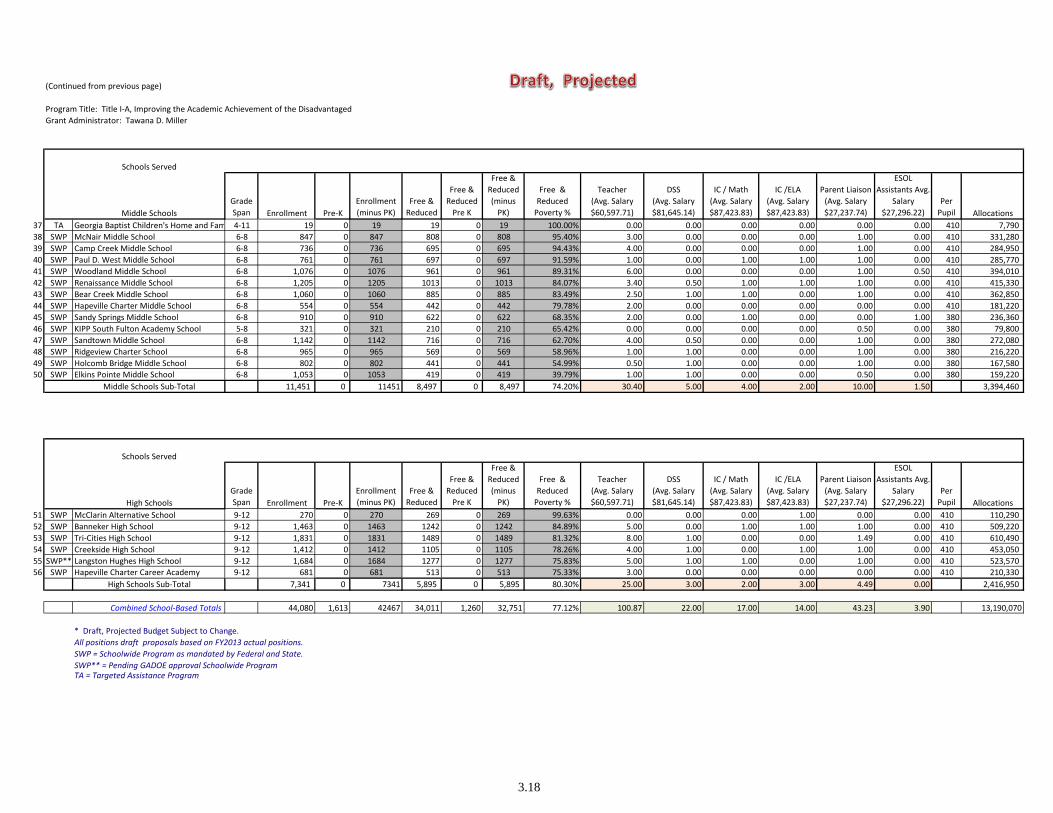
Elementary Schools Sub-Total 25,288 1,613 23675 19,619 1,260 18,359 77.55% 45.47 14.00 11.00 9.00 28.74 2.40 7,378,660(Continued on next page)
* Draft, Projected Budget Subject to Change.All positions draft proposals based on FY2013 actual positions.SWP = Schoolwide Program as mandated by Federal and State.SWP** = Pending GADOE approval Schoolwide ProgramTA = Targeted Assistance Program
3.18
(Continued from previous page)
Program Title: Title I-A, Improving the Academic Achievement of the DisadvantagedGrant Administrator: Tawana D. Miller
* Draft, Projected Budget Subject to Change.All positions draft proposals based on FY2013 actual positions.SWP = Schoolwide Program as mandated by Federal and State.SWP** = Pending GADOE approval Schoolwide ProgramTA = Targeted Assistance Program
3.19
(Continued from previous page)
Program Title: Title I-A, Improving the Academic Achievement of the DisadvantagedGrant Administrator: Tawana D. Miller
a. Neglected Institutions (7) 58,932b. Private Schools (11 sites for 121 students) amount includes equitable services cost 71,405c. Education of Children and Youth in Transition (Homeless Youth) 36,084d. Lead ELA/Math Specialists (Salary/Benefits) - 8 710,214e. Lead Data Support Specialist (Salary/Benefits) - 4 340,695f. Reading Literacy Support (Salary/Benefits) - 3 287,448g. School Support Items (Parent Involvement, Parent Resource Materials, Parent Workshops and Project Adult Literacy) 294,679h. Summer Camp 157,937
I Combined School-Based Direct Allocations Subtotals (All Schools plus a., b., c., d., e., f. g., and h.) 15,147,465i. Flexible Learning Program (5%) 954,167j. Professional Development and Highly Qualified Teachers 2% 162,820
II Set-Asides or Additional Support to Schools Subtotals (i. and j.) 1,116,987III Combined School Based Direct Allocations and Set-Asides Total (I. plus II.) 16,264,452
k. Indirect Cost (1.85%) 346,629l. Sequestration - 9.1% 1,736,584
m. Program Management, Administrative Cost 735,673Title I Total Draft, Projected Allocations for FY2014 19,083,338$
* Draft, Projected Budget Subject to Change.All positions draft proposals based on FY2013 actual positions.SWP = Schoolwide Program as mandated by Federal and State.SWP** = Pending GADOE approval Schoolwide ProgramTA = Targeted Assistance Program
3.20
FY2013 Actual
Enrollment ActualSchool(s) (3rd Month) Amount
Esther Jackson ES 629 53,000$ High Point ES 870 53,000$ Randolph ES 606 53,000$ S. L. Lewis ES 529 53,000$ Bear Creek MS 1,045 53,000$ Renaissance MS 1,207 53,000$ Ridgeview Charter MS 970 53,000$ Sandy Springs Charter MS 900 53,000$ Banneker HS 1,447 25,000$ Creekside HS 1,379 53,000$ McClarin HS 312 80,000$ Tri-Cities HS 1,798 53,000$
Total 11,692 635,000$
FY2014 Projected Projected
School(s) Enrollment Amount
Esther Jackson ES 635 TBDHigh Point ES 869 TBDRandolph ES 615 TBDS. L. Lewis ES 520 TBDBear Creek MS 1060 TBDRenaissance MS 1205 TBDRidgeview Charter MS 965 TBDSandy Springs Charter MS 910 TBDBanneker HS 1461 TBDCreekside HS 1409 TBDMcClarin HS 270 TBDTri-Cities HS 1828 TBD
Total 11,747
FY2014 Title I, Part ASchool Improvement Summary
3.21
FY13 ActualSchool(s) Category Enrollment Amount
Lake Forest Elementary School High Progress 914 3,000$ River Eves Elementary School Highest Performing 836 10,000$ KIPP South Fulton Academy School Highest Performing 321 10,000$
Total 2,071 23,000$
FY2014 Title I, Part AReward Schools Summary
3.22
• Striving Readers Comprehensive Literacy (402) is used to improve reading performance of students from birth through twelve and requires schools to develop literacy plans to better implement the Common Core Georgia Performance standards, Georgia Early Learning standards, Georgia Pre-K standards, and Head Start standards. These funds will assist schools in leveraging print and technology resources for students instruction and engagement, provide teachers with professional learning based on their identified needs, foster implementation of research-based models of tiered instruction, and provide useful student assessment protocols.
• Special Education – VIB Flow through (404) is used to assist school systems with the excess cost of special education and related services as prescribed by the Individuals with Disabilities Education Act (IDEA) as authorized by Congress. Related services include audiology, assistive technology, occupational therapy, physical therapy, speech therapy, special transportation, orientation and mobility, nursing services, interpreting services and transition services.
• Special Education Federal Preschool (404) is used to implement the Individuals with Disabilities Education Act; specifically, to provide special education and related services to preschool children with disabilities, ages three through five.
• High Cost Fund Pool (404) is used to assist local school systems in covering the direct special education instructional costs of children with disabilities who meet the criteria established in IDEA 2004 and the system plan for GHCF.
• CTE – Perkins IV Grants – Program Improvement (406) is used to develop, implement, and maintain programs for middle and high school students interested in specific careers.
• Title II-A, Improving Teacher Quality (414) is used to increase the academic achievement of all students by helping schools and school districts improve teacher and principal quality and ensure that all teachers are highly qualified.
3.23
• Title II-A, Advanced Placement (414) is a program that provides financial support for teachers to receive training during the summer of 2013 to teach Advanced Placement (AP) courses during the 2013-2014 school year for schools that currently offer the fewest number of AP courses.
• Race to the Top Education Resource Strategies (416) is used to supplement local funding to develop teacher compensation models.
• Race to the Top Innovation Fund Project (416) is used to implement Fulton County Schools Leadership and Innovation Academy for the purpose of supporting the system’s transition from a traditional school system to a charter system by developing its principals and school governance councils.
• Charter Implementation Grant (430) is used to fund first year activities and provide supplies.
• Education for Homeless Children and Youth (432) is used to assist students who are homeless and in transition while attending Fulton County Schools. The assistance comes in the form of tutoring, afterschool programs, assistance with immunizations, transportation, enrollment, school supplies, uniforms, etc.
• Title II-A, Limited English Proficient (460) is used to ensure that Limited English Proficient (LEP) students or English language learners, including immigrant students, develop English proficiency and meet the same academic achievement standards that all other students are expected to meet.
• Student Against Destructive Decisions – SADD (493) is used to provide students with the best prevention and intervention tools possible to deal with the issues of underage drinking, other drug uses, impaired driving, and other destructive decisions.
• Network for Enhancing Teacher Quality – Net –Q (496) is used to enhance teacher preparation programs, improve the quality and diversity of prospective/new teachers and leaders, improve teaching effectiveness, induction, and retention, and improve student achievement in high needs schools.
3.24
Other State Revenue includes a major portion of state revenue lottery funds allocated to pre-kindergarten and to classroom technology. Another large portion of state revenue is allocated to the exceptional children preschool program.
• Prekindergarten Program (560) is used to provide children, who are 4 years of age on September 1st of the enrollment year, with the learning experiences they need to prepare for Kindergarten. Fulton’s Prekindergarten Curriculum focuses on Language and Literacy, Mathematical Thinking, Scientific Thinking, Social Studies, The Arts, Personal and Social Development and Physical Development and Health. Bright from the Start Georgia Department of Early Care and Learning funded Fulton’s 77 Prekindergarten classes in FY12 – 13. These classes are located in 42 of our elementary schools serving up to 1,678 students (class size: 22 students in the 69 typical classes and 20 students in the 8 inclusion classes). Local Fulton County funds are not required to supplement the Pre-K classes and grant-approved support personnel (2.0 program specialists, 1.0 transition coach, and 1.0 professional assistant). Note: See Pre-K supplemental information on next three pages.
Difference Revenue/Expenditures (Remaining Funds Not Spent in FY11 and FY12 Have Been Carried Over to FY12 and FY13 accordingly and Are Not Included above in State Revenue.) -$ -$ 783,889$ 154,000$ -$ -$
FY14 Assumptions and Notes: - COSTS For FY14, Pre-K Teacher and Parapro salaries are calculated based on proposed FY14 GA BFTS salary rates. a. Current FY13 Teachers' credentials were used when projecting Teachers' salaries for FY14. b. FY13 FCSS benefit rates (27.7%) were used for calculating Teachers and Parapros benefit costs. c. The state requires subs for Teacher and Pararo absences, but does not pay for substitutes. FY14 substitutes are calcuated @ 15 days for Teachers and 13 days for Parapros which should cover substitutes for Teachers and Parapros who attend mandated state trainings as well as regular absences due to illness, etc. d. FY14 salary calculations are based on 190 days for Teachers; and 185 days for Parapros. - REVENUE1 The state pays the following benefit rates: a. The state pays 32.264% benefit rate for Teachers. b. The state pays 22% benefit rate for Parapros.2. Factors that may increase the actual amount paid by the state: Additional funding is earned from the state for each student who receives financial aid and rides the school bus.3. Other factors that may limit the actual amount paid by the state: a. The state reduces class payments if the number of students enrolled is less than 22 in typical classes and 20 in inclusion classes. b. If current FY13 Pre-K Teachers do not return to Pre-K in FY14, the state revenue could change from the estimated amount above.
FCSS PreKindergarten Program Summary
2013-2014 Proposed Georgia Prekindergarten Class Locations
State Grants include State Department of Education grants such as Career Technology, Charter Schools - Facilities, Pre-school Handicapped State grant, etc.
• Preschool Handicapped State Grant provides state funding for services to preschool children with disabilities, ages three and four. The funding formula is currently based on birth cohorts, rather than child counts.
• Residential and Reintegration Services assist systems in paying for the excess cost of residential placements and to require a reintegration plan in returning the student to a less restrictive placement for services.
• Residential Treatment Centers grant serves students who have severe mental health diagnoses which have prevented them from attending public school while in residential placement.
• CTAE – Agriculture Education/Extended Day/Year provides funding to support extended day/year salary supplements
for Agriculture and Environmental Science teachers who perform additional duties beyond the regular school day/year. The state grant supplements duties associated with Short Term Adult Agribusiness Education projects and leadership activities associated with the Future Farmers of America.
• CTE - Youth Apprenticeship provides funding to support opportunities for students in all Fulton County High Schools to participate in a structured combination of school and work-based learning. Youth Apprenticeship utilizes guidelines and regulations given by federal and state agencies.
• CTE - Extended Day provides funding to support extended day/year salary supplements for teachers who perform additional duties beyond the regular school year.
• CTE - Industry Certification promotes high quality instruction in various Career and Technical Education programs by providing recognition to schools which have outstanding programs of instruction. Each school will be provided a set of criteria which must be met in order for the program to be declared as “certified’.
3.29
State Grants continued:
• CTAE – Supervision provides funding for the base salaries and benefits for vocational administrators.
• Charter Facilities Grant can be used to purchase real property, construct school facilities, purchase or lease school facilities, purchase vehicles to transport students to and from the charter school, and renovate, repair, and maintain the school facility.
3.30
Miscellaneous Grants and Donations
• Miscellaneous Grants and Donations (559) represent other local grants such as Fulton County Arts and Culture, Sports Champion, Georgia Humanities, Delta Air Lines, AirTran Airways, NFL Youth Football, CHEST Foundation, and Action Healthy Kids.
• BROAD Residency Grant (555) is used to provide high-caliber individuals from the business community to work at the senior level of the school system for two years. This mutually beneficial program prepares this individual for a future as a school system administrator while providing the school system with a staff resource for leadership support.
3.31
Grant General Fund Grant Program % ofGrants and Special Revenue Title Manager Contribution Revenues Total Budget
Title I-A, Improving Academic Achievement of the Disadvantaged Dr. Tawana Miller 0 19,083,338 19,083,338 45.2%
Title I-A, School Improvement Dr. Tawana Miller 0 635,000 635,000 1.5%
Title I-A, Reward Schools Dr. Tawana Miller 0 23,000 23,000 0.1%
Striving Readers Comprehensive Literacy Grant Larry Wallace 0 2,153,000 2,153,000 5.1%
Education for Homeless Children Sarah Blake Smith 0 48,000 48,000 0.1%
Career Vocational Technology - Program Improvement Kirstyn Martin 0 612,157 612,157 1.5%
Total of Federal Grants 0 42,179,950 42,179,950 100.0%
Special Education State Preschool Handicapped Grant Cristy Smith 0 1,922,351 1,922,351 60.7%
Residential and Reintegration Services Cristy Smith 0 387,145 387,145 12.2%
Special Education Residential Treatment Centers Cristy Smith 0 83,919 83,919 2.6%
(Continued on next page)
FY14 Tentative Summary Budget by Program as of April 2013
3.32
Grant General Fund Grant Program % ofGrants and Special Revenue Title Manager Contribution Revenues Total Budget
FY14 Tentative Summary Budget by Program as of April 2013
Career Vocational Technology - Agr. (Ext. Day/Yr.) Kirstyn Martin 0 7,564 7,564 0.2%
Career Vocational Technology - Apprenticeship Kirstyn Martin 62,000 40,204 102,204 3.2%
Career Vocational Technology - Extended Day Kirstyn Martin 0 264,010 264,010 8.3%
Career Vocational Technology - Industry Certification Kirstyn Martin 0 145,000 145,000 4.6%
Career Vocational Technology - Vocational Supervision Kirstyn Martin 0 56,244 56,244 1.8%
Charter Schools - Facilities Laura Stowell 0 200,000 200,000 6.3%
Total of Fund 100 State Grants 62,000 3,106,437 3,168,437 100.0%
Pre-Kindergarten Program Montreal Bell 0 5,700,000 5,700,000 100.0%
Total of Other State Grant 0 5,700,000 5,700,000 100.0%
BROAD Residency Grant Patty Foglesong 298,712 147,130 445,842 93.3%
Fulton County Arts and Culture Jena Sibille 0 30,000 30,000 6.3%
Sports Champion Steven Craft 0 2,000 2,000 0.4%
Total of Miscellaneous Grants and Donations 298,712 179,130 477,842 100.0%
SPECIAL REVENUE TOTAL $360,712 $51,165,517 $51,526,229 100%
Note: All state grants are required to be recorded in the school system's General SUMMARY OF REVENUE SOURCESFund. All other programs are recorded in the Special Revenue Fund, 40. Federal 42,179,950$ 81.9%This includes the general fund contribution. State DOE Fund 100 Grants 3,106,437$ 6.0%
Other State Grant 5,700,000$ 11.1%Misc. Grants & Donations 179,130$ 0.3%
General Fund Contribution 360,712$ 0.7%Total 51,526,229$ 100.0%
Where Does the Money Come From?
Federal $42,179,950
81.9%
State DOE $3,106,437
6.0%
State – Other $5,700,000
11.1%
Miscellaneous $179,130
0.3%
General Fund Contribution
$360,712 0.7%
3.33
3.34
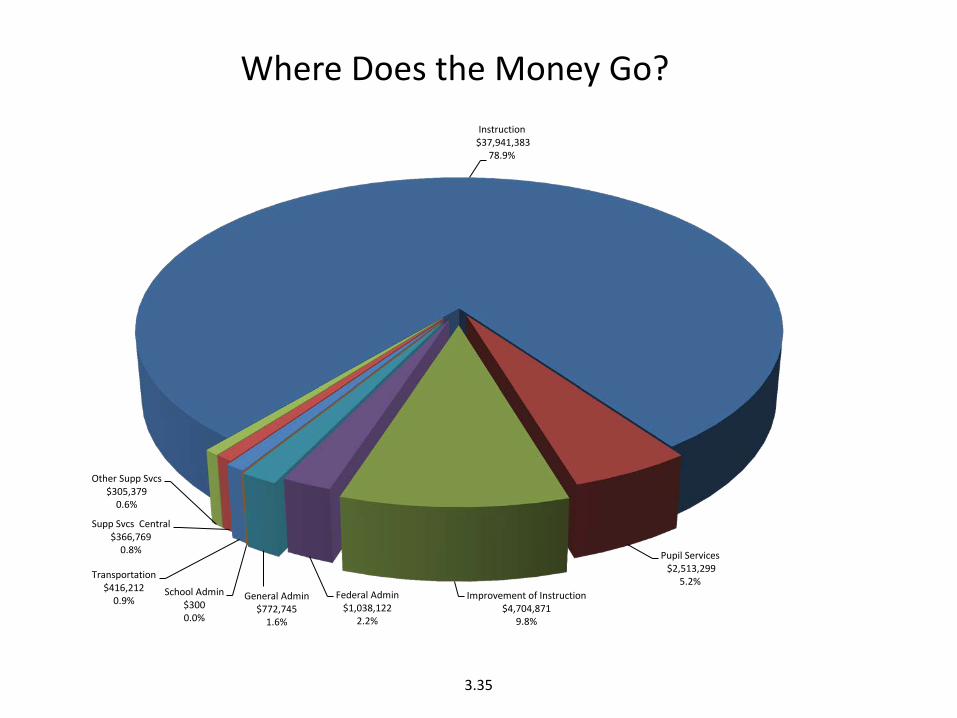
FY2014 Grant Expenditures Summary by FunctionWhere Does the Money Go?
Function DescriptionFY14 Proposed
Budget %1000 Instruction 37,941,383$ 78.9%2100 Pupil Services 2,513,299 5.2%2210 Improvement of Instructional Services 4,704,871 9.8%2230 Federal Administration 1,038,122 2.2%2300 General Administration 772,745 1.6%2400 School Administration 300 0.0%2700 Student Transportation 416,212 0.9%2800 Support Services - Central 366,769 0.8%2900 Other Support Services 305,379 0.6%
48,059,080$ 100.0%
Where Does the Money Go? Instruction
$37,941,383 78.9%
Pupil Services $2,513,299
5.2% Improvement of Instruction
$4,704,871 9.8%
Federal Admin $1,038,122
2.2%
General Admin $772,745
1.6%
School Admin $300 0.0%
Transportation $416,212
0.9%
Supp Svcs Central $366,769
0.8%
Other Supp Svcs $305,379
0.6%
3.35
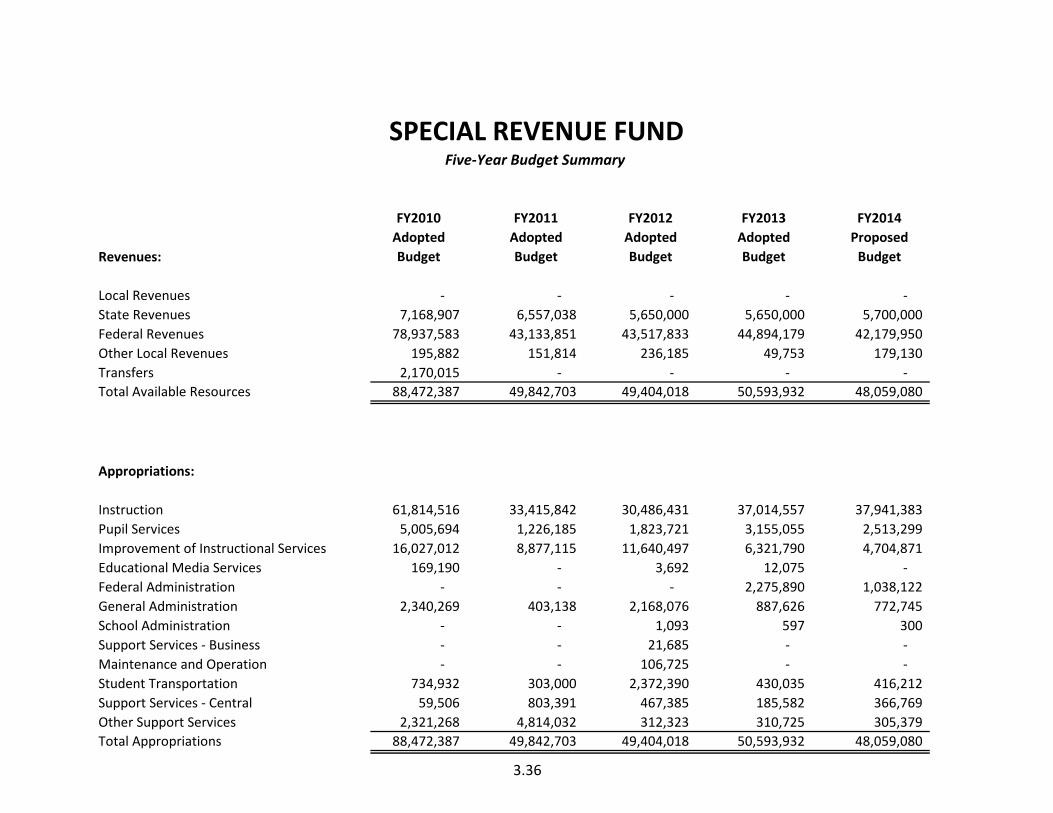
3.36
SPECIAL REVENUE FUNDFive-Year Budget Summary
Revenues:
FY2010 Adopted Budget
FY2011 Adopted Budget
FY2012 Adopted Budget
FY2013 Adopted Budget
FY2014 Proposed
Budget
Local Revenues - - - - - State Revenues 7,168,907 6,557,038 5,650,000 5,650,000 5,700,000 Federal Revenues 78,937,583 43,133,851 43,517,833 44,894,179 42,179,950 Other Local Revenues 195,882 151,814 236,185 49,753 179,130 Transfers 2,170,015 - - - - Total Available Resources 88,472,387 49,842,703 49,404,018 50,593,932 48,059,080
Appropriations:
Instruction 61,814,516 33,415,842 30,486,431 37,014,557 37,941,383 Pupil Services 5,005,694 1,226,185 1,823,721 3,155,055 2,513,299 Improvement of Instructional Services 16,027,012 8,877,115 11,640,497 6,321,790 4,704,871 Educational Media Services 169,190 - 3,692 12,075 - Federal Administration - - - 2,275,890 1,038,122 General Administration 2,340,269 403,138 2,168,076 887,626 772,745 School Administration - - 1,093 597 300 Support Services - Business - - 21,685 - - Maintenance and Operation - - 106,725 - - Student Transportation 734,932 303,000 2,372,390 430,035 416,212 Support Services - Central 59,506 803,391 467,385 185,582 366,769 Other Support Services 2,321,268 4,814,032 312,323 310,725 305,379 Total Appropriations 88,472,387 49,842,703 49,404,018 50,593,932 48,059,080
3.37
Looking Ahead….
Our district has challenging years ahead given the current economic climate, especially the decline in local funding which is the primary source of revenue that supports the district’s day-to-day operation. Another possible challenge is that some federal grant program budgets, Title I, Title II, Title III, Title VIB, and Federal Preschool, are in jeopardy of being cut between 5% and 10% due to the sequestration policy. In the United States federal budget, the sequester or sequestration refers to budget cuts to particular categories of federal spending that began on March 1, 2013 as an austerity fiscal policy. If funding for federal programs is reduced, this may mean some services would have to either be reduced or eliminated altogether. After much discussion with grant program managers, the potential financial impact as a result of sequestration is as follows:
Grant Title
Projected Loss of
Revenue Potential Impact from loss of revenue 1. Title I-A, Improving the
Academic Achievement of the Disadvantage
$1,736,584 Reduction to staff:
a. 24.41 Teachers were moved to cost center positions
b. 2 Teachers were surplused c. 1 Data support specialist surplused d. 2 Math coaches surplused
e. 5.47 Parent liaisons end-dated or
retired 2. Special Education - VIB
Flow through $703,927 Reduction to staff: 23.25 paraprofessionals.
3. Title II-A, Improving Teacher Quality
$99,671 No impact to personnel; decrease in funding for professional development for teachers
4. Title III-A, Limited English Proficient
$40,820 No impact to personnel; less materials and supplies for schools
Projected total revenue loss: $2,581,002 Grant managers already have a contingency plan in place to address sequestration if enforced.
3.38
Despite today’s economic uncertainties, the district will continue to strive to maintain the same quality of services by concentrating on providing core services and looking toward partnering with community organizations to provide the services and programs that the district can no longer support. Also, the office of grant development is being more strategic and proactive in its approach to finding grant funding directly aligned with the district’s strategic plan, meeting specific funding gaps where there is the greatest need. A prime example of how successful the efforts of the grant development office have been, the district was awarded the following grants that align directly with the objectives of the district wide strategic plan initiatives: Race to the Top Innovation Fund ($640,326) grant supports the system’s conversion from a traditional school system to a charter system. The award provides training to principals and governance councils. Race to the Top Education Resource Strategies – Teacher Compensation Models ($130,746) grant provides federal funds for supplementing local funding to develop teacher compensation models. In addition, a portion of Title II-A funds will be used to meet the professional learning needs of all Fulton County employees through the purchase of an electronic professional learning platform that is tied to the State’s teacher effectiveness system and targets the individual growth needs of teachers throughout the system. All of these grants are very relevant to the district achieving its overall goals.
Moving forward, the grant development office will actively pursue funding from within the philanthropic community. Similarly, the grant development office will continue to seek federal, state, and local grants and focus on securing funding currently available and build relationships with external organizations.
FY2014 TENTATIVE BUDGET School Nutrition Program Fund
Table of Contents
Page
Q&A 4.1 Contents of School Nutrition Program Fund 4.2 Introduction 4.3 Program Highlights for FY2013 4.4 – 4.14 Smart Goals FY2014 4.15 – 4.16 Summary of Forecasted Revenues and Projected Expenditures 4.17 – 4.23
4.1
FULTON COUNTY SCHOOLS Fiscal Year 2013-2014 Budget Development
Q&A – Questions and Answers on School Nutrition Program Fund The following Q&A is presented to help the board, cabinet, staffs, and community better understand the contents of the Red Book and answer potential questions raised while reviewing this document. If further questions exist or additional clarification is needed, the Budget Services Department will provide additional information. 1. Question: What is the School Nutrition Program Fund?
Answer: The School Nutrition Program (SNP) Fund is a separate budgetary entity used to account for the United States Department of Agriculture (USDA) approved School Nutrition Program. It supports instructional programs and student achievement by offering nutritious meals (breakfast and lunch) and snacks to students and staffs.
2. Question: What type of expenditures is included in the School Nutrition Program Fund?
Answer: Expenditures included in this fund are those associated exclusively with the School Nutrition Program Fund. These expenditures include, but are not limited to, food products, labor/benefit costs (SNP Employees, Managers, and Administration), supplies, large and small equipment, indirect cost and other expenditures.
3. Question: Is the School Nutrition Program Fund supported by the General Fund?
Answer: No. General Funds are not budgeted to the SNP Fund.
4. Question: Does the FY2014 proposed budget include a meal price increase?
Answer: The FY2014 proposed budget does not include a proposal for a meal price increase. The federal legislation implemented the Lunch in Equity School Lunch Pricing to bring the paying meal price in line with the federal meal price. Fulton has made great progress the past few years in closing the gap between pricing categories and has elected to keep meal prices the same for SY14.
5. Question: Are we planning to have a meal price increase in FY2015?
Answer: The option of a meal price increase should be reevaluated each year and determined based on projected expenses to operate the program versus projected revenue and federal legislation requirements.
6. Question: Is the current School Nutrition Program Fund Balance still within acceptable financial benchmarks?
Answer: The review of the School Nutrition Program financial accounts and program operations show that, the current SNP Fund Balance is within the recommended State Fund Balance of 1.5 months - 3 months average operating expenses.
Introduction Program Highlights for FY2013 Smart Goals FY2014 Summary of Forecasted Revenues and
Projected Expenditures
4.2
Introduction Our Mission Providing safe, nutritious and customer-acceptable breakfasts, lunches and snacks to all students in support of student achievement. Our Purpose Is for all students to consume a safe and nutritious school breakfast and lunch in support of student health and achievement. The program ensures that the local school nutrition programs provide students, parents, teachers, and the community with a learning environment to promote good eating habits. The department is a leader in nutrition education. Key department functions/services • Serve nutritious breakfast and lunch daily in all schools that meet the nutritional needs of students. • Stimulate student and adult meal participation through promotions and nutrition education. • Effectively communicate sound nutrition education with staff, parents, and the community. • Operate a self-sufficient, financially sound program. • Comply with federal, state, and local laws, rules, policies and procedures. Staffing context Our department consists of twenty-three central office staff persons (1 Executive Director, 3 Coordinators, 8 Area Supervisors, 3 Tech Specialist III, 3 Specialist I, 1 Accounting Clerk IV, 1 Personal Assistant III, 1 Accounting Clerk II, and 3 Personal Assistant II) and eight hundred eleven local school staff persons (100 managers, 10 managers- in-training, 11 production chefs, and 690 food service workers) 4.3
Certification and Validation Review • School Nutrition – A Year in Review
4.4
Web-site Improvements • Your Café News • School Nutrition Events on Menu Calendar • Monthly Newsletters • Fully Responsive Web-Site
http://fultonschools.org/dept/schoolnutrition
4.5
Your Café News • Ability to review your
school menu for the day • View Calories, Fat and
Carbs • View special news
about your school cafeteria (promotions or events)
4.6
School Nutrition Events
4.7
Monthly Newsletter • The school nutrition newsletter is now web-based.
You can subscribe on our web-site and the newsletter will be emailed to you each month.
http://fultonschools.org/dept/schoolnutrition
4.8
Fully Responsive Web-site • The School Nutrition web-site now changes it’s look
depending on what device accesses it. “Mobile device friendly for touch screens.”
4.9
Software Transition • School Nutrition has completely transitioned to a
new Enterprise Management Software System that has streamlined data migration across multiple platforms and improved the efficiency with which student records and accountability data can be collected, analyzed, and reported.
4.10
Grants & Partnerships • Action for Healthy Kids
– Hapeville Elementary School • $1,570.00 to launch Breakfast in the Classroom
– Banneker High School • $2,000.00 to promote Access to Healthy Foods
• Finalist in AASA Breakfast Expansion Grant – proposal for ~$395,000.00 to expand alternative breakfast service models
(Breakfast in the Classroom and Grab-n-Go Breakfast)
• Children’s Healthcare of Atlanta – Strong4Life School Nutrition Program Training and Pilot Program
4.11
Recognitions & Awards • USDA Southeast Regional Best Practice Award
– Autrey Mill Middle School – Customer Service
• State DOE Best Practice Award – Autrey Mill Middle School – Customer Service – FCS School Nutrition Program – Farm to School
• Healthier US School Challenge – Bronze Level
– Abbotts Hill Elementary School – Palmetto Elementary School
• Golden Radish Award
– FCS School Nutrition Program
• Face of Fulton, November – Marva Fahie, Centennial High School Nutrition Manager
4.12
USDA and GADOE Certification and Validation Review
• March 12th - 14th Review determined: – Compliance with new meal pattern – Eligibility to receive additional 6 cents reimbursement per meal
= $233,574.48 additional reimbursement for October - February
4.13
School Nutrition-A Year in Review
4.14
SMART Goals
4.15
School Nutrition SMART Goals
#1 • Support student achievement by increasing lunch meals served at
schools by .25% district wide in SY13-14.
#2 • Ensure a safe environment in all schools by adhering to HACCP
guidelines and meeting departmental sanitation standards in SY13-14.
#3 • Maintain financial stability in SY13-14 through effective management
of expenses analyzed monthly against revenue earned.
4.16
Summary of Forecasted Revenues and Projected Expenditures
4.17
Georgia Metro Districts Meals Served Comparison
System % Free and Reduced
Enrollment Number of Schools
Metro #5 51.62% 40,180 50
Metro #6 75.36% 49,558 101
Metro #1 86.48% 51,757 61
Fulton 45.09% 94,080 94
Metro #3 71.43% 98,910 132
Metro #2 45.36% 108,452 112
Metro #4 55.67% 164,976 131
0
20000
40000
60000
80000
100000
120000
140000
160000
180000
200000
Average Meals Served Daily
Metro #5
Metro #6
Metro #1
Fulton
Metro #3
Metro #2
Metro #4
4.18
Operating Budget
Total Budget= $42,687,233
FY2014 Budget Request
Labor 13,527,459
32%
Benefits 6,706,360
16% Equipment
344,500 1%
Food 16,209,506
38%
USDA 1,904,650
4%
Indirect Cost 1,968,989
4%
Supplies 2,025,768
5%
4.19
Personnel Impact • 33% of our personnel budget for FY2014 is allocated to
benefit cost.
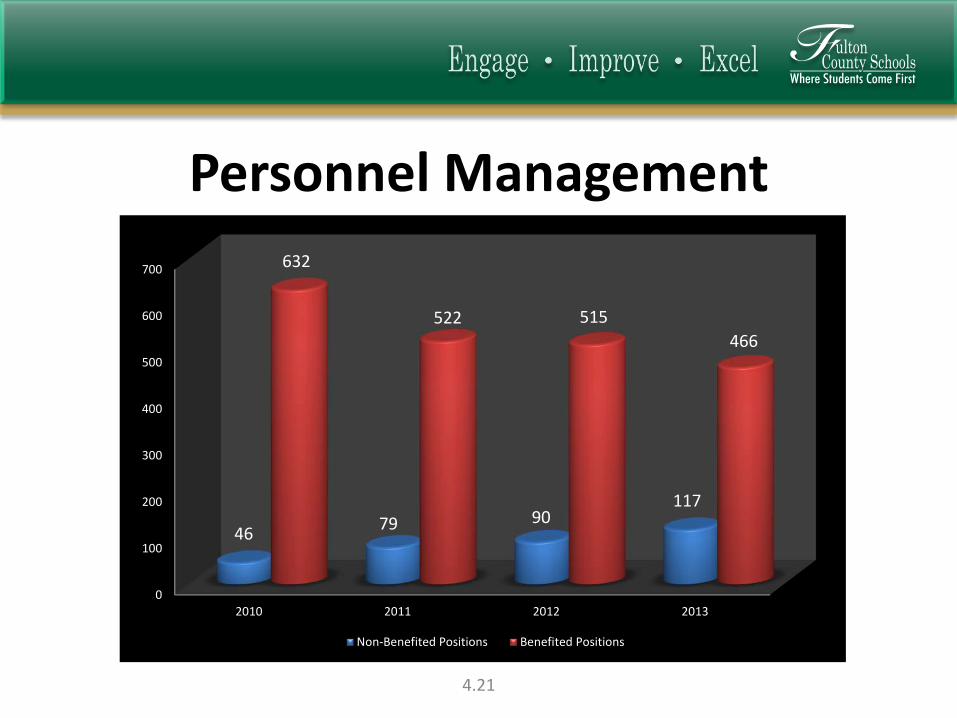
• The FY14 budget is forecasting an increase in part-time (non-benefited) positions and reduction in benefited positions.
33%
67%
Benefits
OtherPersonnel
4.20
Personnel Management
0
100
200
300
400
500
600
700
2010 2011 2012 2013
46 79 90 117
632
522 515 466
Non-Benefited Positions Benefited Positions
4.21
Non-Personnel Analysis
• FY2014 Total Non-Personnel Request - $22,453,413 (.83% increase over FY2013)
• 72% of our non-personnel budget for FY2014 is allocated to food cost.
72%
19%
9% Food
Other Non-PersonnelIndirect Cost
4.22
Summary of Forecasted Revenues and Projected Expenditures School Nutrition Program Fund 3 -Year Budget Forecast FY12 FY13 FY14 FY15 FY16
Y/E Actual Forecast Forecast Forecast Forecast
TOTAL FORECASTED REVENUES 38,004,503 39,735,736 40,843,116 42,721,899 44,687,107 REVENUE ASSOCIATED WITH USDA DONATED COMMODITIES 2,345,174 2,052,063 1,904,650 1,904,650 1,904,650
TOTAL AVAILABLE RESOURCES 40,349,677 41,787,799 42,747,766 44,626,549 46,591,757
RESOURCES IN EXCESS OF EXPENDITURES $ 1,613,116 $ 36,905 $ 60,533 $ 155,880 $ 255,530
Estimated Beginning Fund Balance 9,990,681 10,027,586 10,088,119 10,243,999
Estimated Ending Fund Balance (FY12 State DE46 Cash Balance) 9,953,776 10,027,586 10,088,119 10,243,999 10,499,529 % Estimated Ending Fund Balance 25.7% 24.0% 23.6% 23.0% 22.7% Estimated Ending Fund Balance in Terms of Months Of Operation 3.08 2.88 2.84 2.76 2.72
Other Notes: Estimated Ending Fund Balance does not take out Year-End Liablilities total $2,386,366.27
Assumptions starting in FY2015: 1. Revenues are based on an Est. 4.6% increase 2. Salary expenditures are based on an Est. 4.5% increase 3. Food Products are based on an Est. 5% increase 4. Other non-personnel costs are based on an Est. 1% increase 4.23
FULTON COUNTY BOARD OF EDUCATION
BOARD MEMBERS
Linda Schultz, President Linda McCain, Vice President