24
FUMONISINS IN ITALIAN MAIZE: ANALYSIS AND CONSIDERATIONS Italian Mycotoxin Working Group

FUMONISINS IN ITALIAN MAIZE:
ANALYSIS AND CONSIDERATIONS
Italian Mycotoxin Working Group

185.570 ha
25 ha
274.776 ha223 ha
302.983 ha
107.804 ha
112.930 ha
14.762 ha
7.120 ha2.750 ha
1.575 ha
7.465 ha
580 ha
2.280 ha
20.578 ha
27.050 haha
3.158 ha
16.954 ha
28.757 ha
516 ha
Estimated Grain Cornsurface Italy 2005 :
Tot: 1.117.856 ha
Source: Our elaboration on ISTAT data

91% of the Italian yield, are produced in Piemonte, Lombardia, Veneto,
Friuli V. G., Emilia Romagna

The maize food chain in Italy
feed82%
others2%
food4%
starch industry
12%
Source: Aires

In Italy products for human uses made from maize generate a business of 592 million €
60%16%
11%
5%8%
Amiderie Molini industriali Molini artigianale Trasporto Manut.ne e Comm.le
ECONOMICS OF FOOD MAIZE IN ITALY
Source: Aires.

FUSARIUM-TOXINS IN EUROPE
Fumonisine B1-B2 Media 1999-2003
DeossinivalenoloMedia 1999-2003
ZearalenoneMedia 1999-2003
Fumonisins are higherin South Europe
DON and ZEA are higher Center-North Europe
da 0 a 75% della media Europea1999 - 2003
da 75 a 125%
da 125 a 250%
più di 250%
dati non sufficienti
M edia di tut te le località 1999 - 2003
Zearalenone 0.06 ppm
Deossinivalenolo 0.82 ppm
Fumonisine B1 e B2 1.59 ppm
Source: Indagine Europea di Syngenta Seeds

FUSARIUM-TOXINS IN EUROPE2001
2003
2000
2002
1999
1999-2003 Fumonisinsdistribution
Source: Indagine Europea di Syngenta Seeds

5 (1995, 1996, 1997, 1998, 1999)Number of years
503Number of samples
Pietri A. et al., (2004), “Occurrence of mycotoxins and ergosterol in maize harvested over 5 years in Northern Italy”, Food Additives and Contaminants 21 (5): 479-487
Literature Reference
Università Cattolica di PiacenzaScientific Reference
HPLCMethods of analysis
Following Dir. CE 76/371Sampling methods
Commercial lots from drying units and milling plains Source of samples
Po plainArea of sampling
931149410498N. of samples
45,213,19,61,917,3>5000 ppb (%)
38,758,863,852,948,01000-5000 ppb (%)
16,128,126,645,234,7<1000 ppb (%)
51732655310313243347Mean
19991998199719961995
Survey N.1

4 (1999, 2000, 2003, 2004)Number of years
1468Number of samples
Verderio A. et al., (2005), “La diffusione delle micotossine nelle produzioni italiane di mais”, L’Informatore Agrario 61 (10): 47-51
Literature Reference
Regione Lombardia - Direzione Generale Agricoltura; CRA - Ist. Sper. per la Cerealicoltura, Sezione di Bergamo; Assincer; AIRES; Pioneer Hi-Bred Italia
Scientific Reference
ELISA Test, fluorimetric method, validated with a HPLC ring test Methods of analysis
“Dynamic” methods from grain in movement Sampling methods
a. Commercial lots from 60 drying unitsb. Production from 44 experimental fields: network “on farm” 2003
Source of samples
Po PlainArea of sampling
344131310360323N. of samples
1,544,345,57,52,2>6000 ppb (%)
2,325,28,711,15,64000-6000 ppb (%)
61,319,824,519,718,02000-4000 ppb (%)
12,53,85,56,124,51500-2000 ppb (%)
22,46,915,855,649,8<1500 ppb (%)
2004a2003b2003a2000a1999a
Survey N. 2
a= samples from drying unitsb= samples from fields
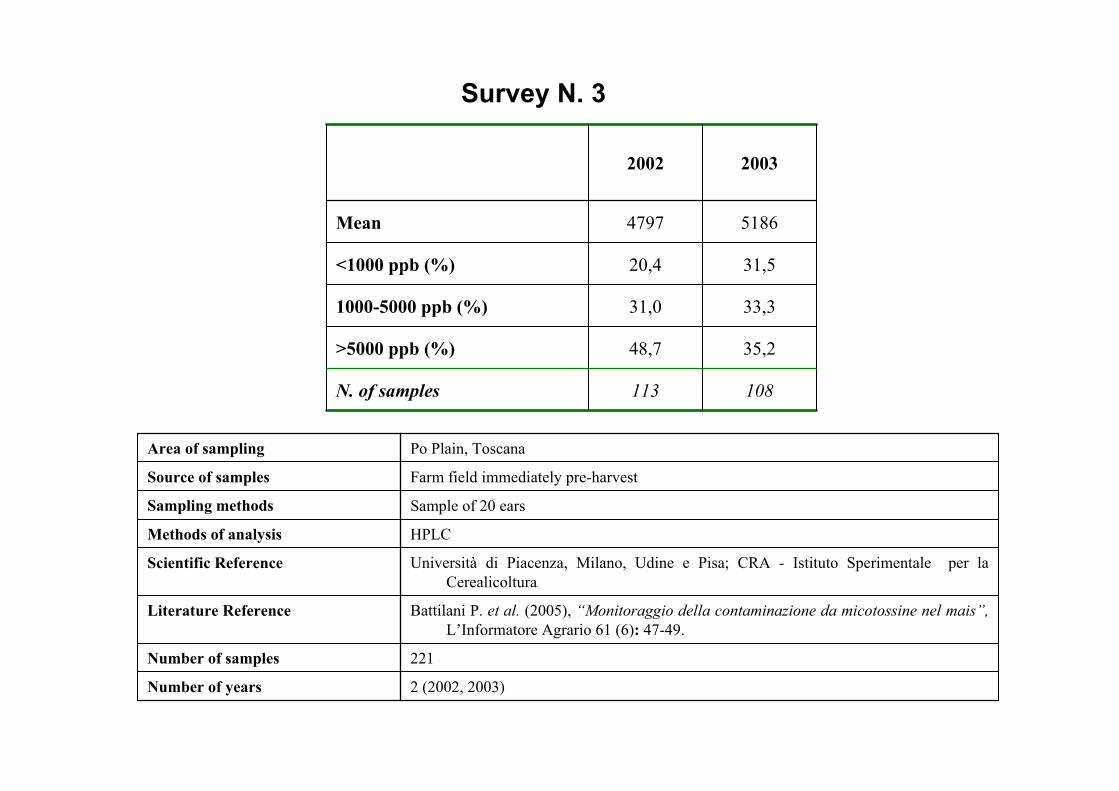
2 (2002, 2003)Number of years
221Number of samples
Battilani P. et al. (2005), “Monitoraggio della contaminazione da micotossine nel mais”,L’Informatore Agrario 61 (6): 47-49.
Literature Reference
Università di Piacenza, Milano, Udine e Pisa; CRA - Istituto Sperimentale per la Cerealicoltura
Scientific Reference
HPLCMethods of analysis
Sample of 20 ears Sampling methods
Farm field immediately pre-harvestSource of samples
Po Plain, ToscanaArea of sampling
108113N. of samples
35,248,7>5000 ppb (%)
33,331,01000-5000 ppb (%)
31,520,4<1000 ppb (%)
51864797Mean
20032002
Survey N. 3
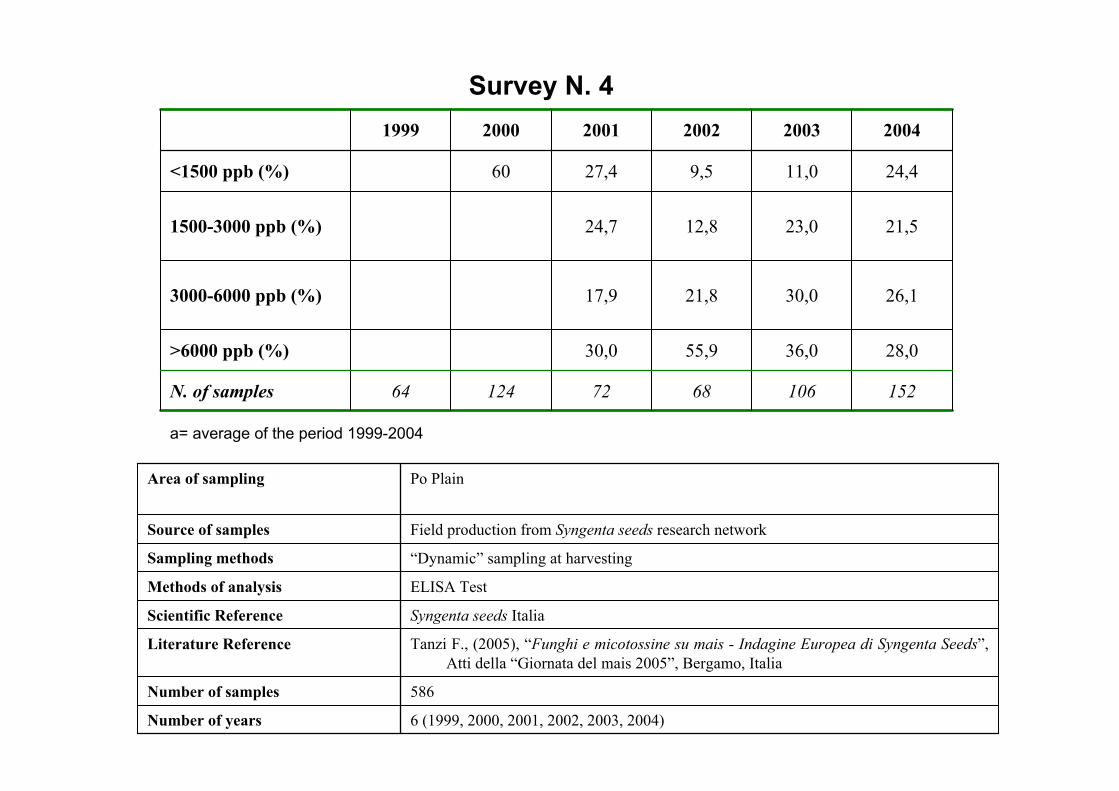
6 (1999, 2000, 2001, 2002, 2003, 2004)Number of years
586Number of samples
Tanzi F., (2005), “Funghi e micotossine su mais - Indagine Europea di Syngenta Seeds”, Atti della “Giornata del mais 2005”, Bergamo, Italia
Literature Reference
Syngenta seeds ItaliaScientific Reference
ELISA TestMethods of analysis
“Dynamic” sampling at harvestingSampling methods
Field production from Syngenta seeds research networkSource of samples
Po PlainArea of sampling
152106687212464N. of samples
28,036,055,930,0>6000 ppb (%)
26,130,021,817,93000-6000 ppb (%)
21,523,012,824,71500-3000 ppb (%)
24,411,09,527,460<1500 ppb (%)
200420032002200120001999
Survey N. 4
a= average of the period 1999-2004
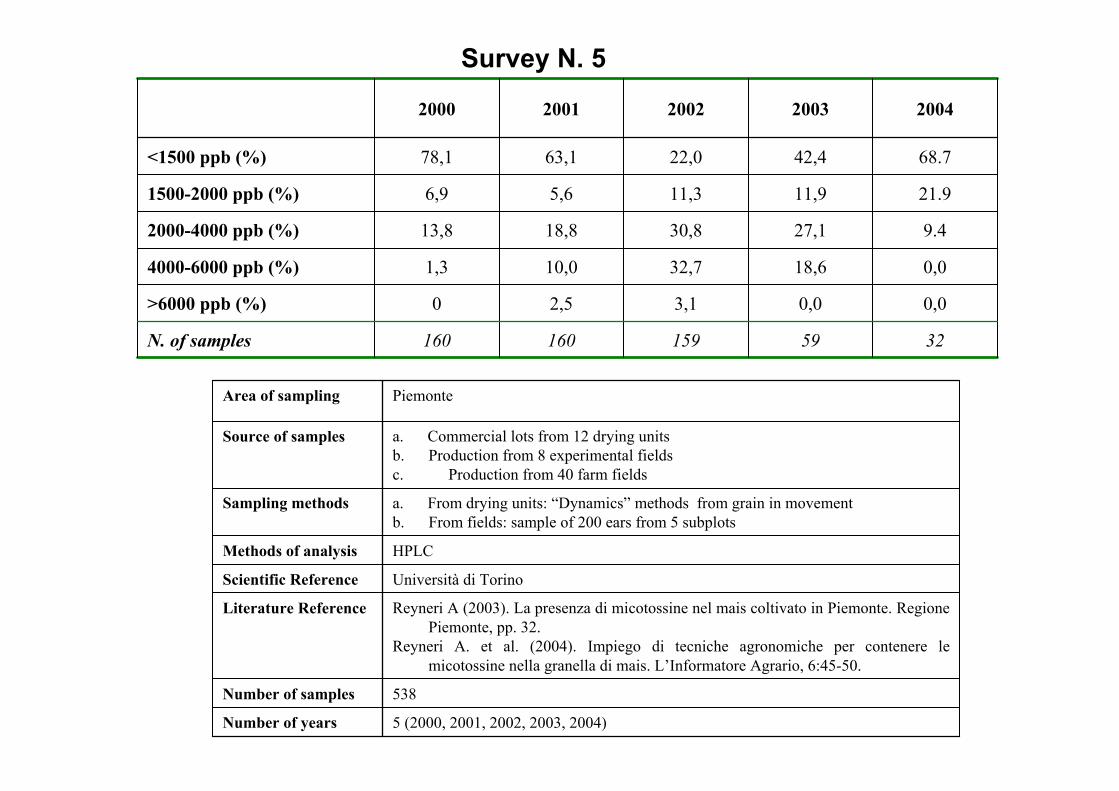
Survey N. 5
5 (2000, 2001, 2002, 2003, 2004)Number of years
538Number of samples
Reyneri A (2003). La presenza di micotossine nel mais coltivato in Piemonte. Regione Piemonte, pp. 32.
Reyneri A. et al. (2004). Impiego di tecniche agronomiche per contenere le micotossine nella granella di mais. L’Informatore Agrario, 6:45-50.
Literature Reference
Università di TorinoScientific Reference
HPLCMethods of analysis
a. From drying units: “Dynamics” methods from grain in movementb. From fields: sample of 200 ears from 5 subplots
Sampling methods
a. Commercial lots from 12 drying unitsb. Production from 8 experimental fieldsc. Production from 40 farm fields
Source of samples
PiemonteArea of sampling
3259159160160N. of samples
0,00,03,12,50>6000 ppb (%)
0,018,632,710,01,34000-6000 ppb (%)
9.427,130,818,813,82000-4000 ppb (%)
21.911,911,35,66,91500-2000 ppb (%)
68.742,422,063,178,1<1500 ppb (%)
20042003200220012000

Effects of cultural practices on mycotoxin contamination
Crop RotationManagement of debriesSeeding timeHarvest timeHybridFertilizationWeed controlInsect controlIrrigation
Effect on concentration 1 < 2 3 > 4
DON - ZEAFUM
Source :researches conducted in Italy


2.954 18.431 average
1.394 3.902 1999
5.448 31.632 1998
2.021 19.759 1997
bt Maizenon bt MaizeAnno
Source: A. Pietri et al. “ Terra e Vita “ n. 6-2005
Mais BT and Fumonisins

Pre-harvest control strategies in three milling industries (A:C)
Source : A. Reyneri
A B CMain maize products flour, grits homini grits gritsGAP - hybrids yes yes yes - seeding time no yes yes - fertilization no yes no - insect control yes yes yes - irrigation yes yes no - moisture at harvest no yes yesGMP yes yes yes
Rate of fumonisins reduction(1) 1.5-2.5 2.0-3.0 2.0-2.5Premium price (€/t)(2) 6 15 5

Researches conducted in Italy of the fate of fumonisins and other mycotoxins:
milling industries (A:E)
A B C DYears 2000-2005 2005 2002 2004-2005Lots (n,) 19 11 2 46Sampling methods Dynamics sampling
during processingDynamics sampling during processing
Following Dir. 98/57 CE
Dynamics sampling during processing
Methods of analysis HPLC - ELISA ELISA HPLC HPLC - ELISAFraction analysed - Unprocessed grain √ √ √ √ - Germ √ √ √ - Flour √ √ √ √ - Grits √ √ √ √ - Feed meal √ √ √
Reference(1) 48 (2) 12 (2)
(1) cfr. Reference in Annex 1 (2) Unpublished
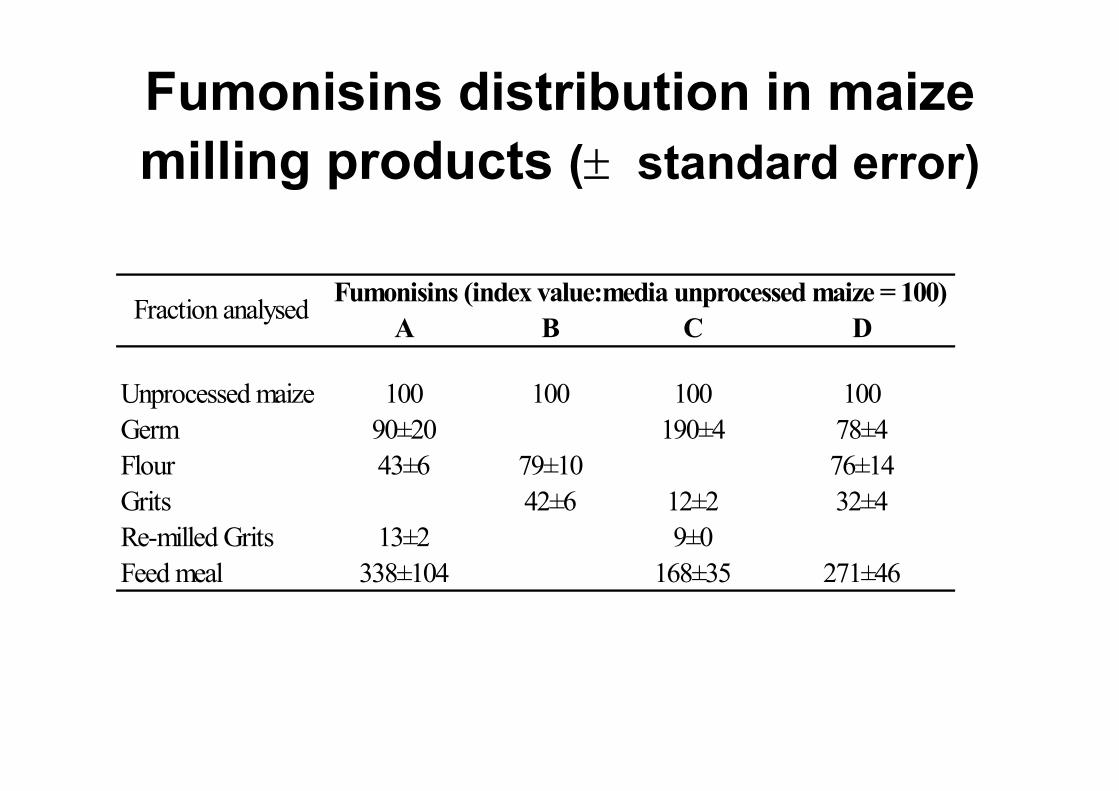
Fumonisins distribution in maize milling products (± standard error)
A B C D
Unprocessed maize 100 100 100 100Germ 90±20 190±4 78±4Flour 43±6 79±10 76±14Grits 42±6 12±2 32±4Re-milled Grits 13±2 9±0Feed meal 338±104 168±35 271±46
Fraction analysed Fumonisins (index value:media unprocessed maize = 100)

Exposure to fumonisin B1 (µg/kg pc/die) for population groups of Italian population
0
0.5
1
1.5
2
AE* E 95* AE* E 95* AE* E 95* AE* E 95*
Expo
sure
(µg/
kg p
c/di
e)
Maize flour
Flakes
Others
TDI reccomanded by Scientific Committee for Food (2 µg/kg pc/die)
Children Adolescents Adults Old people
* AE: Average exposure* E 95: Exposure 95 percentile

Comparison among the different TDI and thresholds for Fusarium-toxins
375 g400maize based foods for directconsumption
1502.0FUMONISINS
300 g50bread150.2ZEA
100 g750pasta
150 g500bread751.0DON
Amount diF.P. to be
eaten to reachthe TDI
Final Products limitscurrently proposed
µg/kg
TDIin µg for aperson of
75 kg
TDIµg/kg BW

Final ConsiderationsMaize is the main Italian crop by volume and almost 10% of the harvest enter the food chain.Fumonisin are present at variable rate depending on the year and on the region considered, but on the average, most of the Italian maize is above 2000 ppb.Italian farmers don’t have today, and it not expect they will have by 2007, the tools to keep their maize below 2000 ppb with a reasonable probability.The milling process does not reduce the unprocessed corn contamination consistently and equally for all the milling fractions and for all the milling diagrams. The milling industries are particularly concerned for the future of grits and flour production, which will hardly achieve the proposed maximum levels, and for the survival of typical artisanal products as polenta, with a greater involvement of the organic agiculture products;

Final ConsiderationsThe DG-SANCO approach is correctly based on the precautionary principle. Nevertheless, both the European SCOOP task 3.2.10 “Collection of occurrence data on Fusarium toxins in food and assessment of dietary intake by the population of EU member States” presented on September 2003 and the Italian study reported in this document shows that the average intake offumonisins is far below the TDI for most exposed consumers and even without a regolamentation.An Industry sector with more than 2000 employees and a turnover of 513 millions € could be unable to face the current proposed fumonisin limits.If the Italian food maize will enter the feed market the Italianmaize producers (over 200.000 producers) could face a decrease on corn price close to 20% meaning a total loss of over 200 million €.We agree that very high contaminated maize lots should be kept out of the food chain but a limit of 2000 ppb will keep out of business many Italian farmers and industries without improving consumers health

Hence
We ask for a better tuning of fumonisinslimits and implementations time to guarantee both consumers and producers health.
Italian Mycotoxin Work Group


