Functional and structural diversity of external tufted and deep short-axon cells in the main olfactory bulb Doctoral Dissertation Miklós Antal M.D. Semmelweis University John Szentágothai Neuroscience School of Ph.D. Studies Supervisor: Zoltán Nusser D.Phil., D.Sc. Scientific Referees of the Ph.D. Dissertation: Zoltán Benyó M.D., Ph.D., D.Sc. Katalin Halasy Ph.D., D.Sc. Chair of the Comprehensive Exam: András Csillag M.D., Ph.D., D.Sc Committee Members of the Comprehensive Exam: Gábor Tamás Ph.D., D.Sc. Tibor Zelles Ph.D. Budapest 2008
Transcript
Functional and structural diversity of external tufted and deep short-axon cells in the main olfactory bulb
Doctoral Dissertation
Miklós Antal M.D.
Semmelweis University John Szentágothai Neuroscience School of Ph.D. Studies
Supervisor: Zoltán Nusser D.Phil., D.Sc. Scientific Referees of the Ph.D. Dissertation: Zoltán Benyó M.D., Ph.D., D.Sc.
Katalin Halasy Ph.D., D.Sc.
Chair of the Comprehensive Exam: András Csillag M.D., Ph.D., D.Sc Committee Members of the Comprehensive Exam:
Gábor Tamás Ph.D., D.Sc. Tibor Zelles Ph.D.
Budapest 2008
2
I. TABLE OF CONTENTS
I. TABLE OF CONTENTS…………………………..………………………………..2
II. LIST OF ABBREVIATIONS…….………………………………………………..5
III. INTRODUCTION……………………………………..…………………………..9
III.1. Neuronal components of the main olfactory bulb…………………………….9
III.1.1. Afferents……………………………………………………………….10
III.1.1.1. Sensory afferents and the olfactory glomerulus…………………10
uIPSC unitary IPSC (evoked by one presynaptic cell)
VIP vasoactive intestinal polypeptide
9
III. INTRODUCTION
The olfactory bulb is a bilateral structure of the vertebrate forebrain involved in
olfaction, the perception of odors. It processes and transmits smell information from the
nose to the brain and is divided into two distinct structures, the main olfactory bulb
(MOB), and the accessory olfactory bulb. The latter forms an independent parallel
pathway from the MOB, believed to play an important role in detection of pheromones,
which are essential for mate selection, reproductive behavior and hormonally regulated
odor-stimulated behaviors in many mammals (e.g. aggression) (Keverne, 1995).
III.1. Neuronal components of the main olfactory bulb
The main olfactory bulb, in most vertebrates, is the most rostral part of the brain.
Similar to other sensory systems in the brain, the neuronal building blocks of the MOB
can be categorized into three groups: input, output and intrinsic elements.
Figure 1. A summary of the olfactory pathway. The olfactory bulb receives direct sensory input from olfactory receptor neurons (ORNs) of the nasal epithelium and sends its output directly to the olfactory cortex. Some general aspects of projections patterns and connections with central brain regions are indicated. Abbreviations: PG: periglomerular cell, MC: mitral cell, TC: tufted cell, GS: superficial granule cell, GD: deep granule cell.
10
It receives a single source of direct sensory input, axons from olfactory receptor neurons
(ORN) of the olfactory epithelium and sends its output directly to the olfactory cortices
(Figure 1). However, it also receives "top-down" information from higher brain areas.
The main olfactory bulb presents a multi-layered cellular architecture. In order from the
surface towards the center of the bulb the layers are (Figure 2):
1. Olfactory nerve layer
2. Glomerular layer
3. External plexiform layer
4. Mitral cell layer
5. Internal plexiform layer
6. Granule cell layer
7. Lateral olfactory tract
III.1.1. Afferents
III.1.1.1. Sensory afferents and the olfactory glomerulus
The sensory input is made up of a sophisticated arrangement of axons originating from
the ORNs in the nasal olfactory epithelium. Despite the fact that within the epithelium
ORNs possess a homogeneous appearance, they are highly diverse regarding their
molecular characteristics. In rodents, a large multigene family encodes more than 1000
different olfactory receptors (Buck and Axel, 1991). Subpopulations of ORNs
expressing the same odorant receptor are located in one of several regions across the
epithelium, although the precise nature of their distribution is still under investigation.
These tightly packed bundles of ORN axons form the most superficial layer of the
MOB, the olfactory nerve layer. As they target regions of the MOB, they defasciculate
and reorganize. Axons that originate from ORNs expressing the same olfactory
receptor gene usually terminate in two synaptic complexes, also known as, glomeruli
within the glomerular layer, one being on the medial and one on the lateral side of each
MOB (Ressler et al., 1994; Vassar et al., 1994).
The olfactory glomeruli are spherical regions of neuropil that form the first processing
station of the olfactory pathway, where sensory axons form synapses on the apical
dendrites of the principal cells (mitral and tufted cells) and on some intrinsic neurons
(Figure 2A) (Pinching and Powell, 1971b; Kosaka et al., 1998; Shepherd et al., 2004).
11
Figure 2. Layout of neuronal components in the main olfactory bulb. A. Input – Output and B. Intrinsic neurons. Abbreviations of layers: ONL: olfactory nerve layer, GL: glomerular layer, EPL: external plexiform layer, MCL: mitral cell layer, IPL: internal plexiform layer, GCL: granule cell layer, LOT: lateral olfactory tract. A. ON: olfactory nerve, Centrifugal afferents are from (indicated in red) *: ipsi-, contralateral anterior olfactory nucleus; tenia tecta; primary olfactory cortex; horizontal limb of the diagonal band; locus coeruleus; raphe nuclei and **: horizontal limb of the diagonal band; locus coeruleus; raphe nuclei. The output from the main olfactory bulb is carried by the axons of the principal cells, mitral (MC) and different types of tufted cells, external (ETC), middle (MTC), internal (ITC). B. Intrinsic neurons are organized into specific layers. PGC: periglomerular cell; SAC: short axon cell; VGC: Van Gehuchten cell; GI, GII, GIII: three types of granule cells; dSAC: deep short-axon cell.
12
They are clear examples of the principle of grouping neural elements and synapses into
well defined modules. Their size ranges from 30-50 µm in diameter in small mammals
to 100-200 µm in rabbits and cats (Allison, 1953).
III.1.1.2. Centrifugal inputs, neuromodulators
The main olfactory bulb is under extensive and well defined control by different areas
of the brain. The substantial number of inputs shows a particular laminar organization.
Most centrifugal fibers arise from the following areas of the brain (Figure 2A):
a. Olfactory cortex. One type of input is comprised of axon collaterals from
pyramidal cells located in the primary olfactory cortex, also called the piriform
cortex. These fibers terminate in the granule cell layer (GCL).
b. Anterior olfactory nucleus. The terminals of axons that arise from different
parts of both ipsi- and contralateral anterior olfactory nucleus in extensive
numbers are also confined to the GCL.
c. Brainstem. The brainstem sends noradrenalinergic fibers from the locus
coeruleus that distribute evenly through the glomerular, internal plexiform and
other neuromodulators, such as serotonin arrive from the dorsal and median
raphe nuclei and, in different species, preferentially terminate in different layers
of the MOB (Takeuchi et al., 1982; McLean and Shipley, 1987).
d. Basal forebrain. One basal forebrain cholinergic center, the horizontal diagonal
band also sends axons to granule cells, as well as to the periglomerular region
(Hoffer et al., 1971).
As mentioned above it is notable that the olfactory bulb is enormously rich in a variety
of neurotransmitters and -modulators. This is likely related to the fact that it mediates
information that contributes to the generation of behaviors such as feeding, social
organization and reproduction, which are controlled through these multiple types of
neuroactive substances.
13
III.1.2. Principal neurons
Several studies have provided a substantial body of evidence suggesting that the output
of the MOB flows through axonal projections of two types of principal cells, the mitral
(MC) and tufted cells (TC) (Figure 2A).
1. Mitral cells. The somata of most MCs are confined to the mitral cell layer in
vertebrates, which is a thin and distinct layer 200-400 µm deep to the glomerular
layer. Having a diameter of 15-20 µm, the cell bodies of MCs give rise to a single
primary, apical dendrite which passes through the external plexiform layer (EPL)
and branches into a tuft within a single glomerulus. Characteristic of MCs are the
laterally directed secondary dendrites which do not branch extensively and
terminate in the EPL. Unique is their length of at least 500 µm, up to over one mm,
in cases reaching up to halfway around the circumference of the bulb. MC axons
give rise to recurrent collaterals, and after traversing through the internal plexiform
layer (IPL) form the lateral olfactory tract (LOT). The major targets of the LOT are,
primarily, layer Ia of the piriform cortex, as well as anterior olfactory nuclei, the
olfactory tubercle, the entorhinal cortex, and portions of the amygdala. Pyramidal
cell axons in the piriform cortex in turn project to several thalamic and
hypothalamic nuclei and to the hippocampus and amygdala. Studies suggest that
axonal targeting within the cortex is influenced by the molecular identity of the
glomerulus serving as the source of sensory input for the given MC (Zou et al.,
2001).
2. Tufted cells. Another major source of output is the more superficially located
TCs. Three main groups can be identified according to their laminar location, they
are termed: external (ETC), middle (MTC) and internal (ITC) tufted cells.
a. External tufted cells. ETCs are a diverse population of neurons possessing a
variety of dendritic branching and axonal projection patterns. Their axonal
collaterals in the internal plexifrom and granule cell layers contribute to an
intrabulbar associational system, establishing connections between glomeruli
of the medial and lateral sides of the MOB that receive input from ORNs
expressing the same odorant receptor (Belluscio et al., 2002). Based on
whether an ETC projects out of the MOB through the LOT or not, one can
identify them as principal or intrinsic neurons, respectively.
14
b. Middle tufted cells. The largest population, the MTCs, lie in the outer half
(Bartolomei and Greer, 1998) of the external plexiform layer, they have a
primary dendrite branching within a glomerulus and several thin secondary
dendrites. Their axons, similar to mitral cells, after giving off collaterals join
the LOT.
c. Internal tufted cells. The third group is the ITCs, which exhibit similar
properties to other TCs and due to their location overlap with superficially
displaced mitral cells.
Despite the fact that tufted cells show many similarities to mitral cells, differences
on the basis of molecular phenotype, somatic location, dendritic morphology, axonal
connections, targets of extrabulbar projections, neurotransmitters and
neuromodulators can be clearly established (Greer and Shepherd, 1982; Orona et al.,
1984; Macrides et al., 1985; Mori, 1987; Bartolomei and Greer, 1998).
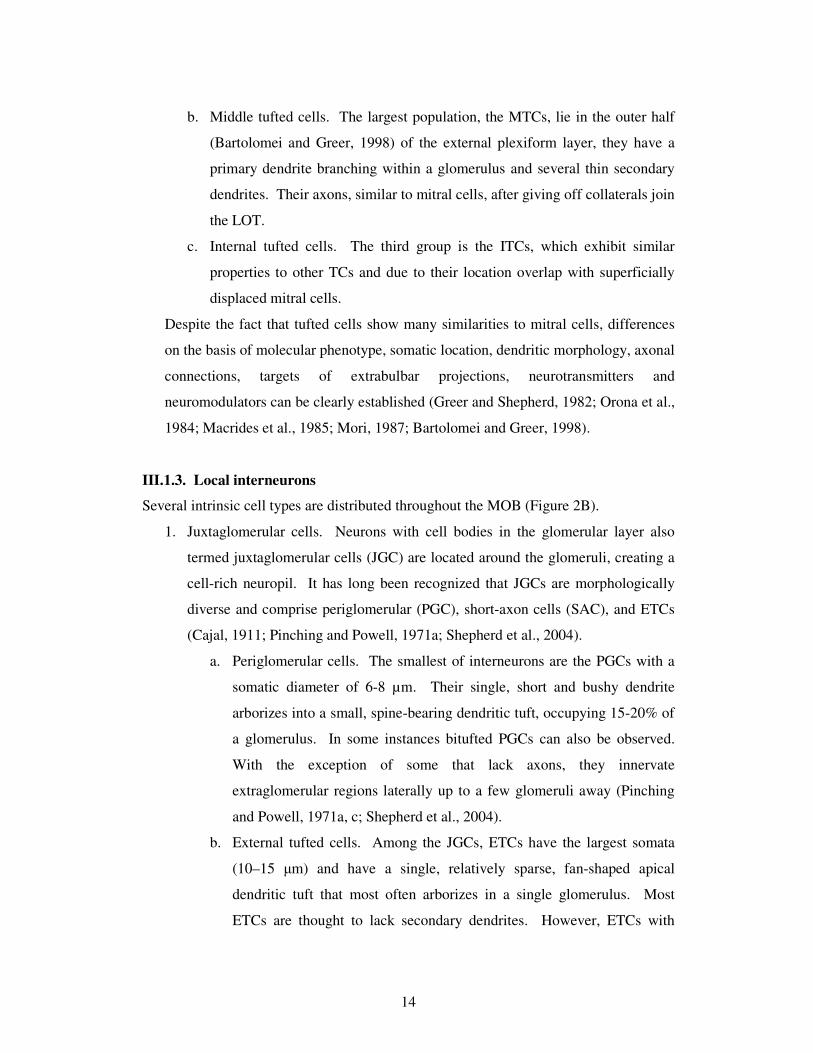
III.1.3. Local interneurons
Several intrinsic cell types are distributed throughout the MOB (Figure 2B).
1. Juxtaglomerular cells. Neurons with cell bodies in the glomerular layer also
termed juxtaglomerular cells (JGC) are located around the glomeruli, creating a
cell-rich neuropil. It has long been recognized that JGCs are morphologically
diverse and comprise periglomerular (PGC), short-axon cells (SAC), and ETCs
(Cajal, 1911; Pinching and Powell, 1971a; Shepherd et al., 2004).
a. Periglomerular cells. The smallest of interneurons are the PGCs with a
somatic diameter of 6-8 µm. Their single, short and bushy dendrite
arborizes into a small, spine-bearing dendritic tuft, occupying 15-20% of
a glomerulus. In some instances bitufted PGCs can also be observed.
With the exception of some that lack axons, they innervate
extraglomerular regions laterally up to a few glomeruli away (Pinching
and Powell, 1971a, c; Shepherd et al., 2004).
b. External tufted cells. Among the JGCs, ETCs have the largest somata
(10–15 m) and have a single, relatively sparse, fan-shaped apical
dendritic tuft that most often arborizes in a single glomerulus. Most
ETCs are thought to lack secondary dendrites. However, ETCs with
15
basal dendrites have also been described, as have ETCs with apical tufts
ramifying in two glomeruli (Pinching and Powell, 1971a; Macrides and
Schneider, 1982; Hayar et al., 2004a; Shepherd et al., 2004) indicating
the morphological heterogeneity of these cells.
c. Short-axon cells. These interneurons of the glomerular layer have an
intermediate soma size and are distinguished by dendrites that arborize
around the glomeruli in the periglomerular region without forming an
apical tuft (Pinching and Powell, 1971a; Aungst et al., 2003; Shepherd et
al., 2004).
Juxtaglomerular cells are diverse, based on their active and passive electrical
properties and their synaptic connectivity (Puopolo and Belluzzi, 1998a;
McQuiston and Katz, 2001; Hayar et al., 2004a; b). Recently, Hayar et al.
(2004b) have functionally characterized several JGCs and found robust
differences between PGCs, ETCs and SACs, but most physiological properties
of the ETCs were found to be rather uniform.
2. Van Gehuchten cells. Although, the external plexiform layer is mainly occupied
by primary and secondary dendrites of M/TCs and somata of TCs and displaced
MCs, interneurons first identified by Van Gehuchten can also be observed in this
layer.
3. Granule cells. Deep to the mitral cell and internal plexiform layers lies the
granule cell layer, a 300-400 µm thick band of neuropil containing the cell
bodies of granule cells (GC), which reside preferentially in clusters. They
possess one radial dendrite extending up to different depths of the external
plexiform layer, and a few deep processes that branch sparingly. Their dendrites
bear numerous spines, also termed gemmules, that are larger but less in number
than e.g. pyramidal cell dendritic spines in the cerebral cortex. Another unique
feature of GCs is that they lack axons. This has been repeatedly confirmed
using the Golgi impregnation method and electron microscopy. It has been
suggested earlier that GCs at different depths could serve different functional
roles in olfactory circuitry (Shepherd, 1972). There are 3 major types of granule
cells, superficial (Figure 2B, GIII), deep (GII) and intermediate (GI) GCs, with
16
dendritic ramifications mainly in superficial, deep parts or throughout the entire
area of the external plexiform layer, respectively.
4. Deep short-axon cells. Similar to the glomerular layer, only in higher number, a
third type of interneurons resides in granule cell layer, the inframitral deep short-
axon cells (dSAC). They exhibit a variety of dendritic trees and axonal arbors
within the external plexiform and granule cell layers based on which they have
been subdivided into four groups (Cajal, 1911; Pinching and Powell, 1971a;
Schneider and Macrides, 1978). So far, little is known about their functional
and structural properties, or their place in the circuitry of the olfactory bulb.
In the olfactory bulb convergence is one the main principles of organizing of cellular
components. In rodents, an estimate of the number of olfactory receptor neurons is
approximately 20 x 106, giving rise to as many axons targeting each olfactory bulb.
Within one MOB they converge onto 1800-2000 glomeruli to which an estimated 50000
MCs and 100000 TCs are connected (Allison, 1953). This yields convergence ratios of
10000:1 onto glomeruli, 400:1 onto MCs and 200:1 onto TCs. Ratios of intrinsic
neurons onto principal cells are also high, an estimated 20:1 PG to MC, 50-100:1 GC to
MC and 1:1 SAC to MC (Shepherd, 1972). These rough estimates indicate an extensive
intrinsic circuitry for olfactory information processing.
III.2. Synaptic connectivity in the main olfactory bulb
The main olfactory bulb was one of the first brain regions where identification of
synaptic communication was made. The variety of principal and intrinsic neurons gives
rise to a wide array of intrinsic circuits for sensory information processing in the bulb.
III.2.1. Synapses in the glomerular layer
The identity of a single glomerulus can be defined based on the molecular phenotype of
the olfactory receptor neuron populations targeting it. It is the first processing station of
the olfactory pathway, where sensory axon terminals establish axo-dendritic contacts
with dendritic tufts of both mitral/tufted cells and subpopulations of juxtaglomerular
cells (periglomerular and external tufted cells) (Pinching and Powell, 1971a, c;
Kasowski et al., 1999) (Figure 3A).
17
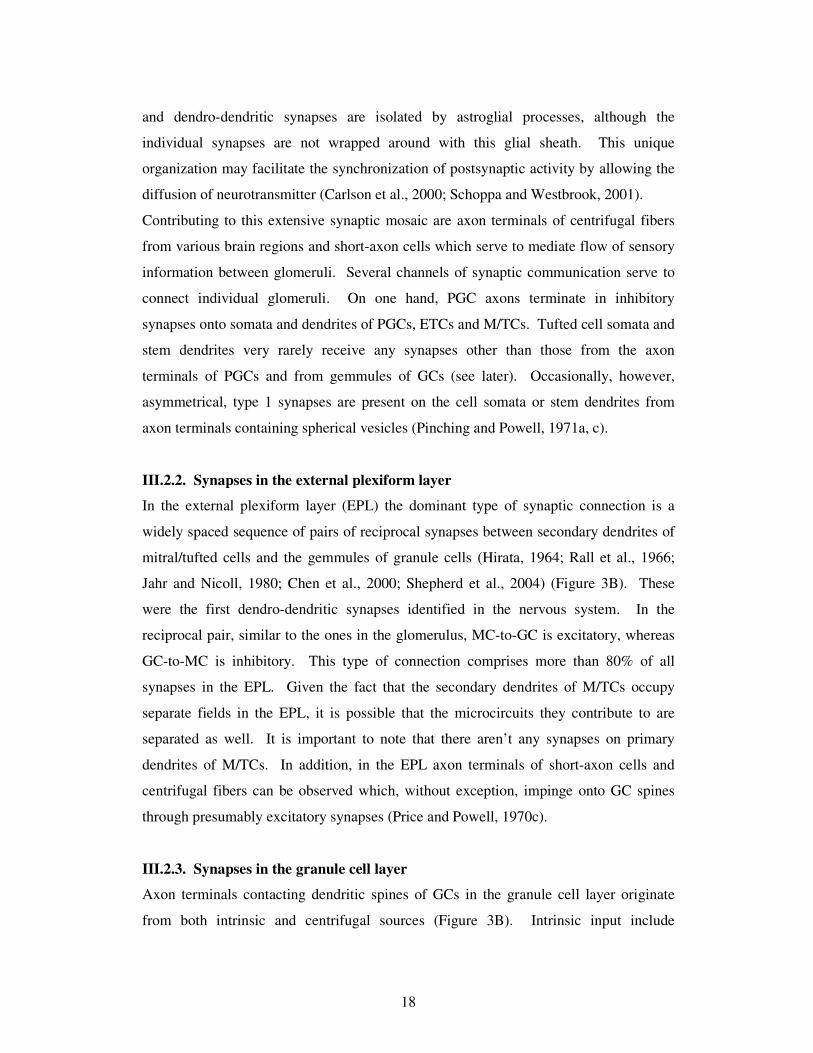
Figure 3. Synaptic connections within the glomerular and external plexiform layers in the main olfactory bulb. A. The typical synaptic arrangement within the glomerulus is shown, which includes axo-dendritic and dendro-dendritic connections. B. Granule cell spines (GCs) establish reciprocal dendro-dendritic synapses with mitral cell secondary dendrites (MCd) in the EPL (solid and dashed black arrows: excitatory and inhibitory connections, respectively). Furthermore, axon terminals of centrifugal afferents, recurrent collaterals and deep short-axon cells impinge onto GC dendrites in the GCL (green arrows). Abbreviations: ONL, EPL, GCL: olfactory nerve, external plexiform, granule cell layers, respectively; PGCd: periglomerular cell dendrite; GCd: GC dendrite; a: axons. These synaptic contacts are type I (Gray, 1959), excitatory synapses. A special feature
of dendrites within a glomerulus is that they not only receive sensory input, but are
themselves presynaptic to JGCs. Complex dendro-dendritic interactions occur within
the glomeruli between principal cells and JGCs (Kosaka et al., 1998; Kosaka et al.,
2001; Hayar et al., 2004b; Shepherd et al., 2004; Hayar et al., 2005; Kosaka and
Kosaka, 2005) (Figure 3A).
The most common of connections is excitatory from M/TC to PGC. Synaptic
communication in the opposite direction, from PGC to M/TC, is another frequently
observed pattern which comprise type 2 (Gray, 1959) inhibitory synapses. These two
types of synapses are arranged mainly in reciprocal, side-by-side pairs. Periglomerular
cells may also receive inhibition from other PGC dendrites or short-axon cell axons
(White, 1972). This complex synaptic arrangement is well organized; the axo-dendritic
18
and dendro-dendritic synapses are isolated by astroglial processes, although the
individual synapses are not wrapped around with this glial sheath. This unique
organization may facilitate the synchronization of postsynaptic activity by allowing the
diffusion of neurotransmitter (Carlson et al., 2000; Schoppa and Westbrook, 2001).
Contributing to this extensive synaptic mosaic are axon terminals of centrifugal fibers
from various brain regions and short-axon cells which serve to mediate flow of sensory
information between glomeruli. Several channels of synaptic communication serve to
connect individual glomeruli. On one hand, PGC axons terminate in inhibitory
synapses onto somata and dendrites of PGCs, ETCs and M/TCs. Tufted cell somata and
stem dendrites very rarely receive any synapses other than those from the axon
terminals of PGCs and from gemmules of GCs (see later). Occasionally, however,
asymmetrical, type 1 synapses are present on the cell somata or stem dendrites from
axon terminals containing spherical vesicles (Pinching and Powell, 1971a, c).
III.2.2. Synapses in the external plexiform layer
In the external plexiform layer (EPL) the dominant type of synaptic connection is a
widely spaced sequence of pairs of reciprocal synapses between secondary dendrites of
mitral/tufted cells and the gemmules of granule cells (Hirata, 1964; Rall et al., 1966;
Jahr and Nicoll, 1980; Chen et al., 2000; Shepherd et al., 2004) (Figure 3B). These
were the first dendro-dendritic synapses identified in the nervous system. In the
reciprocal pair, similar to the ones in the glomerulus, MC-to-GC is excitatory, whereas
GC-to-MC is inhibitory. This type of connection comprises more than 80% of all
synapses in the EPL. Given the fact that the secondary dendrites of M/TCs occupy
separate fields in the EPL, it is possible that the microcircuits they contribute to are
separated as well. It is important to note that there aren’t any synapses on primary
dendrites of M/TCs. In addition, in the EPL axon terminals of short-axon cells and
centrifugal fibers can be observed which, without exception, impinge onto GC spines
through presumably excitatory synapses (Price and Powell, 1970c).
III.2.3. Synapses in the granule cell layer
Axon terminals contacting dendritic spines of GCs in the granule cell layer originate
from both intrinsic and centrifugal sources (Figure 3B). Intrinsic input include
19
excitatory M/TCs and, presumably, inhibitory deep short-axon cells. Centrifugal
excitatory terminals can be found at different depths within the granule cell layer. For
example, fibers arising from the contralateral anterior olfactory nucleus (AON) run
through the anterior commissure to target mainly deep processes. The axons from the
ipsilateral AON, however, distribute over the middle regions of dendritic area and the
horizontal diagonal band projects primarily to spines in the external plexiform layer.
The key site for gating and modulating processing of olfactory information, it seems, is
the dendritic spine of GCs, the reciprocal MC-GC-MC connection, making it a
multifunctional synapse.
III.3. Functional and structural diversity of interneurons
Information processing in a neuronal network does not only depend on the structural
building blocks of synaptic circuitry but also on the electrophysiological properties of
neuronal elements and how these are influenced by neurochemical substances. Two
neurons possessing similar morphological features may respond to the same input in a
very different manner due to their diverse intrinsic electrical properties.
Synaptic integration within a glomerulus involves a multineuronal circuitry. Within a
glomerulus the sensory axons of olfactory receptor neurons synapse onto an extensive
neuron population of juxtaglomerular cells (JGC) that comprise periglomerular, short-
axon cells, and ETCs. Despite their large number and strategic location, little is known
about the electrophysiological characteristics or the morphological heterogeneity of
these cells. Although a few studies have functionally characterized several JGCs and
robust differences were found between ETCs, their functional roles in olfactory
information processing remain poorly understood.
The extraordinary diversity of nerve cells was already recognized over a century ago
(Cajal, 1911). It is now widely accepted that within most brain regions, the
glutamatergic principal cells are rather homogeneous, whereas the GABAergic non-
principal cells, or interneurons (IN), form a much more diverse population (Freund and
Buzsaki, 1996; Kosaka et al., 1998; Somogyi et al., 1998; McBain and Fisahn, 2001;
Markram et al., 2004). Traditionally, the classification of IN types has relied primarily
20
on their axonal and dendritic morphologies. However, recently their intrinsic electrical
properties, gene expression profiles and firing behavior in relation to ongoing network
activity have all been taken into account. Such combined molecular, morphological and
physiological approaches have provided compelling evidence for the astonishing
diversity of INs and for the variety of roles they play in neuronal networks. The
classical view regarding the connectivity of INs has been that they primarily innervate
the principal cells, and to a smaller extent each other. However, additional populations
of hippocampal and neocortical INs have been revealed (Acsady et al., 1996; Gulyas et
al., 1996; Meskenaite, 1997; Gulyas et al., 2003) that are specialized to selectively
control the activity of other GABAergic INs, and the presence of such cells has also
been suggested to occur in the main olfactory bulb (Mugnaini et al., 1984; Gracia-
Llanes et al., 2003).
As in many other brain regions, the GABAergic periglomerular and granule cells also
receive GABAergic inputs (Price and Powell, 1970b; Pinching and Powell, 1971b;
Puopolo and Belluzzi, 1998b; Nusser et al., 1999; Smith and Jahr, 2002; Murphy et al.,
2005; Pressler and Strowbridge, 2006), but their source is largely unknown. A recent
report (Pressler and Strowbridge, 2006) has demonstrated that GCs receive GABAA
receptor-mediated inhibition from a subpopulation of infra-mitral deep short-axon cells
called Blanes cells, but it remains to be seen whether other cell types also contribute to
the GABAergic control of GCs. Short-axon cells form another, rather diverse
GABAergic IN population distinct from the numerically dominant GCs and PGCs
(Cajal, 1911; Price and Powell, 1970a; Schneider and Macrides, 1978; Mugnaini et al.,
1984). However, very little is known about their axonal arborizations, their intrinsic
electrical properties, their synaptic inputs and their postsynaptic targets.
To understand the cellular and synaptic mechanisms of olfactory information
processing, the intrinsic properties and synaptic connectivity of these different types of
nerve cells need to be deciphered. This requires the identification of whether structural
and functional heterogeneity correlates with each other, resulting in well defined
subpopulations of cells; or whether these measured features of the cells vary
independently, resulting in a single but highly diverse population.
21
IV. AIMS
First, I aimed to characterize the intrinsic electrical and morphological properties of
external tufted cells (ETCs) in the rat main olfactory bulb. Based on a large number of
measured physiological and morphological parameters, I asked whether:
1. External tufted cells comprise a single population or multiple subpopulations
exist, and whether
2. The pattern of dendritic arborization of ETCs could be predicted from their
active and passive electrical properties and vice versa.
Second, I aimed to provide a combined characterization of deep short-axon cells, by
carrying out a detailed analysis of their
1. intrinsic electrophysiological properties and synaptic inputs,
2. molecular content and
3. axo-somato-dendritic morphologies
in order to reveal their place in the olfactory bulb network.
22
V. METHODS
V.1. Acute slice preparation and electrophysiological recordings
For my experiments I used male Wistar rats (20–78 days old), which were anesthetized
with ketamine (50 mg per animal) in accordance with the ethical guidelines of the
Institute of Experimental Medicine, Hungarian Academy of Sciences (license number:
2288/003/Fv/2006). After decapitation, the brain was removed and placed into ice-
5.3-8 biocytin (pH=7.25; osmolarity: 270–290 mOsm). Using intracellular solutions
containing 5.3-8 mM biocytin allowed us visualization and post hoc anatomical analysis
23
of recorded cells following electrophysiological recordings. After establishing the
whole-cell configuration, if needed, hyper- or depolarizing DC current injections were
applied to maintain cells at membrane potentials just below firing threshold. In ETCs,
trains of action potentials were evoked by injecting one-second long depolarizing
current pulses of different amplitudes (20-200 pA); in dSACs, by injecting one-second
long depolarizing current pulses of 100 pA in amplitude. The passive properties were
derived from single exponentials fitted to average traces of membrane voltage responses
to small (1-20 pA, 400 ms) hyper- and depolarizing current injections. For testing the
subthreshold resonance properties of ETCs, two-second long sinusoidal (0.5-60 Hz)
currents (amplitudes from 5 to 40 pA) were injected into the cells.
Figure 4. Measurements of physiological properties of external tufted cells. A. somatic DC current injection-evoked spike train is shown. Parameters such as the action potential (AP) threshold, peak amplitude, full width at half maximum, AP after-hyperpolarization (AHP) amplitude and width at 25%, 50%, 75% decay were automatically measured with a custom-made software. B. Passive membrane properties (input resistance and membrane time constant, Rin and , respectively) of ETCs were derived from single exponential fits (dashed lines) to averaged (of 50-100 traces) voltage responses to small (1-20 pA, 400 ms) hyper- (gray trace, inverted) and depolarizing (black trace) current injections. C. For testing subthreshold resonance properties, two-second long sinusoidal currents (0.5-60 Hz, 5-40 pA, 2 s) were injected into the cells (bottom black trace). The voltage responses of the cells (black trace) were then compared to responses of a single compartment model cell with passive membrane properties (gray trace) following fast Fourier transformation. (ETC response: black; passive model: gray).
24
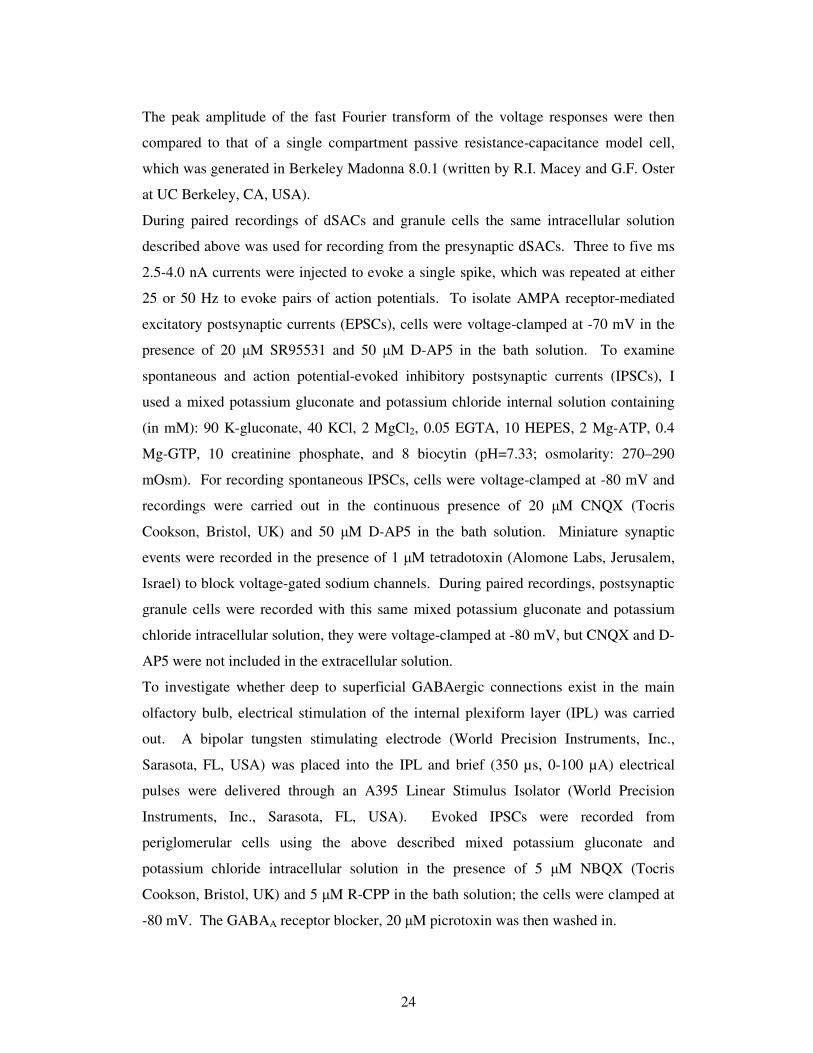
The peak amplitude of the fast Fourier transform of the voltage responses were then
compared to that of a single compartment passive resistance-capacitance model cell,
which was generated in Berkeley Madonna 8.0.1 (written by R.I. Macey and G.F. Oster
at UC Berkeley, CA, USA).
During paired recordings of dSACs and granule cells the same intracellular solution
described above was used for recording from the presynaptic dSACs. Three to five ms
2.5-4.0 nA currents were injected to evoke a single spike, which was repeated at either
25 or 50 Hz to evoke pairs of action potentials. To isolate AMPA receptor-mediated
excitatory postsynaptic currents (EPSCs), cells were voltage-clamped at -70 mV in the
presence of 20 M SR95531 and 50 M D-AP5 in the bath solution. To examine
spontaneous and action potential-evoked inhibitory postsynaptic currents (IPSCs), I
used a mixed potassium gluconate and potassium chloride internal solution containing
were then blocked in tris-buffered saline (TBS) with 3% bovine serum albumin (BSA),
0.1% cold water fish skin gelatin (CWFSG; Aurion, Wageningen, The Netherlands) and
0.05% sodium azide for 60 minutes and then incubated with streptavidin-conjugated 1
nm gold particles (1:50, Aurion) in TBS with 0.8% BSA, 0.1% CWFSG and 0.05%
sodium azide overnight. Sections were then treated with 2% glutaraldehyde in TBS for
10 minutes, followed by silver enhancement (Aurion SE-LM kit) for 30 minutes at
25oC. Slices were then postfixed in 0.5% OsO4 at 4oC for 15 minutes, stained in 1%
uranyl acetate for 25 minutes, and dehydrated and embedded in Durcupan as above.
For the retrogradely labeled cells (see below), prior to the ABC-DAB reaction the
biocytin was visualized with Alexa488 or Cy5 conjugated to streptavidin and the
colocalization of biocytin and the fluorescent microspheres was confirmed using
confocal laser scanning microscopy.
V.3. In vivo injection of fluorescent microspheres
In vivo injections were also performed by Dr. Mark D. Eyre Ph.D. Male Wistar rats
(n=11 rats; 28-42 days old) were anaesthetized with 2 ml/kg of a 1:1 mixture of
Ketamine and Xylazine and were mounted in a stereotaxic apparatus. Solutions of 40
nm diameter fluorescent latex microspheres (as supplied by Molecular Probes) were
pressure injected (100-300 nl) into the anterior olfactory nucleus, the olfactory tubercle,
the piriform cortex and the deep endopiriform nucleus. Three to 14 days after the
surgery, acute horizontal slices from the main olfactory bulb were prepared as described
above and with the aid of an appropriate fluorescence filter, fluorescently labeled cells
with inframitral somatic locations were subject of whole-cell recordings.
V.4. Immunofluorescent microscopy
In some cases, slices with recorded and biocytin-filled cells were fixed after recordings
as above except the glutaraldehyde concentration in the fixative was only 0.05% and the
fixative was thoroughly washed out after 3 hours. Slices were then cryoprotected,
freeze-thawed and re-sectioned as above. Slices were blocked in TBS with 10% normal
27
goat serum (NGS; Vector Laboratories) for one hour, and then incubated overnight with
anti-GABAA receptor 1 subunit primary antibodies (diluted 1:500; gifts of Prof. J-M.
Fritschy and Prof. W. Sieghart) in TBST containing 2% NGS (TBS with 2% NGS and
0.05% Triton X-100). Sections were then washed and incubated in a mixture of either
streptavidin conjugated to Alexa488 and goat-anti-rabbit IgG conjugated to Cy3 or
streptavidin conjugated to Cy5 and goat-anti-rabbit IgG conjugated to Alexa-488 (all
diluted in 2% NGS TBST; Alexa dyes from Invitrogen, Eugene, OR, USA; Cy dyes
from Jackson ImmunoResearch, West Grove, PA, USA) for two hours. Slices were
then washed in TBS and mounted. When fluorescent immunolabeling of
periglomerular cells for tyrosine hydroxylase and calbindin was carried out, slices were
similarly cryoprotected, freeze-thawed, re-sectioned and blocked with TBS in 10%
NGS as described above. Slices were then incubated overnight with mouse anti-
tyrosine hydroxilase (diluted 1:1000, DiaSorin, Saluggia, Italy) and rabbit anti-calbindin
primary antibodies (diluted 1:1000, Oncogene Research Products, San Diego, CA,
USA) in TBST containing 2% NGS (TBS with 2% NGS and 0.05% Triton X-100). The
sections were then washed and incubated in a mixture of streptavidin conjugated to
Alexa488, goat-anti-rabbit IgG conjugated to Cy3 and goat-anti-mouse IgG conjugated
to Cy5 (all diluted 1:500 in TBS with 2% NGS and 0.05% Triton X-100). The
colocalization of biocytin and the GABAA receptor 1 subunit or the presence of
tyrosine hydroxilase and calbindin was then confirmed by using an Olympus BX62
microscope equipped with appropriate fluorescence filters and a DP30BW CCD camera
or an Olympus FV1000 confocal microscope. Biocytin was subsequently visualized
with the ABC-DAB method and the slices were similarly dehydrated and embedded in
Durcupan as above.
V.5. Three-dimensional reconstructions of deep short axon cells
Labeled cells were identified as ETCs or dSACs from their size, the location of their
somata and their dendritic morphology. Neurons with no obvious truncations in their
dendrites or no obvious truncations in their dendrites and axons, in the case of ETCs or
dSACs, respectively, were fully reconstructed with the NeuroLucida system (Micro-
BrightField Europe, Magdeburg, Germany) attached to a Zeiss Axioscope 2 microscope
using a 100x oil-immersion objective, and were subjected to morphometric
28
measurements.
V.6. Electron microscopy and postembedding immunolabeling
Portions of cells were re-embedded and serial sections were cut at 60 nm thickness
using an ultramicrotome (Ultracut; Leica Microsystem, Vienna, Austria). Sections were
collected alternately onto copper and nickel pioloform-coated slot grids. Sections on
nickel slot grids were subjected to postembedding immunoreactions for GABA,
modified from Somogyi & Hodgson (1985). Briefly, slot-grids were treated with 1%
periodic acid for 8 minutes, followed by blocking with 50 mM glycine in 0.081% NaCl
TB (TBLS) and 1.5% BSA in TBLS fro 90 minutes. This was followed by incubation
in primary rabbit-anti-GABA antibodies (GABA9; diluted 1:500; gift of Prof. P.
Somogyi) in TBLS containing 1.5% BSA for 90 minutes. The reaction was visualized
with 10 nm gold-conjugated goat-anti-rabbit secondary antibodies (British Biocell
International, Cardiff, UK; diluted 1:50 in TB with 1% BSA and 0.5% Tween-20).
Sections were contrasted with uranyl acetate and lead citrate and viewed using a
JEOL1011 electron microscope. Digital images were captured with a cooled CCD
camera (Cantega; Soft Imaging System, Munster, Germany). Ultrastructurally
identified mitral/tufted cell apical and lateral dendrites were consistently
immunonegative, verifying the specificity of our anti-GABA immunoreactions.
V.7. Statistical procedures
Throughout my dissertation, all data are expressed as mean ± standard deviation. In
ETCs recordings, to ensure that variability in the physiological parameters was not the
consequence of different time elapsed from the establishment of the whole-cell
configuration, I measured all active and passive electrical properties at the beginning
and at the end of the whole-cell recording period. Following Shapiro-Wilk normality
test, either paired t-test or sign-test was used to compare data measured at the beginning
and at the end of the recording. Parameters that significantly (p<0.01) changed during
the whole-cell recordings were discarded from my analysis. I utilized Pearson’s
regression analysis to determine whether the measured physiological parameters
depended on the amplitudes of the injected current (20, 40 and 70 pA). Parameters
where a significant correlation (p<0.01) was found were also discarded from my
29
analysis. Principal component analysis (PCA; (Joliffe and Morgan, 1992) and
agglomerative clustering methods were carried out with the Statistica 6.0 software
(StatSoft, Inc., Tulsa, OK, USA). Briefly, the aim of PCA is to reduce the number of
parameters describing a population to a smaller number of ‘factors’, which account for a
large fraction of the total variance in the population. Only factors with large Eigenvalue
(usually >1) are selected to represent the population. PCA also transforms the data to
standard scores, removing any potential bias due to the fact that parameters are in
different units. Agglomerative or joining clustering was employed to group data (PCA
factors) without any a priori assumption concerning the number of clusters.
Dissimilarities between cells were measured as Euclidean distances and Ward’s
amalgamation rule was used to determine cluster linkage. The joining tree indicated
clusters of differing sizes depending on the degree of dissimilarity. For analysis of
ETCs the number of clusters that were statistically different from one another was
determined by calculating the squared Euclidean distance of each cell from the center of
each cluster. The coordinates of each cluster centre in a multidimensional space along
each axis (i.e. for each factor used in the clustering) were calculated as the average of
each factor score for cells assigned to that cluster by the joining tree. Distances of cells
in each cluster from each center were then compared. Specifically, we first tested the
validity of two clusters by calculating the centers of cluster 1 and 2, and then the
distances of each member from each center. By using Mann-Whitney-U test, we
statistically compared the mean distance of the members of cluster 1 and 2 from the
center of cluster 1. Then the reverse comparison was carried out (members of cluster 1
and 2 from the center of cluster 2). If both of these tests were statistically significant
(p<0.001), then we concluded that ETCs form two subpopulations. Subsequently, a
similar statistical comparison was carried out with 3 clusters, 4 clusters etc. using a
Kruskal-Wallis non-parametric test, and if significant, a post hoc test (multiple
comparisons of mean ranks for all groups) was used to decide whether the groups were
different or not. None of our analyses revealed 3 or more subpopulations with
significant difference between all subgroups.
Following dSAC recordings, the data were subject to the Shapiro-Wilk normality test,
and the Levene and Brown-Forsythe or Hartley F-max tests for homogeneity of
variances. To compare averaged spontaneous and miniature synaptic events within
30
subtypes I employed the t-test for dependent samples or the Wilcoxon matched pairs
test. At the individual cell level, I carried out comparisons using a non-parametric
Kolmogorov-Smirnov test. Either parametric ANOVA or non-parametric Kruskal-
Wallis ANOVA was used to compare data between dSAC subtypes, depending on
whether the distribution was normal or not. Where appropriate, data were further
assessed by conducting a post hoc test (Tukey’s Unequal n HSD test or multiple
comparisons of mean ranks, respectively). All differences were considered significant
if p<0.05. Morphological data was subjected to PCA. The first 4 factors had
Eigenvalues greater than 1 and were then used for agglomerative clustering of
Euclidean distances using Ward’s method. The gap statistic method (Tibshirani et al.,
2001) was used to determine the number of clusters. All analyses (including analysis of
parameter correlations, PCA and unsupervised clustering) were performed using the
Statistica 6.0 software (StatSoft, Inc., Tulsa, OK, USA; www.statsoft.com). The gap
statistic calculation was implemented as a macro within the Statistica software.
31
VI. RESULTS AND CONCLUSIONS
VI.1. Correlation of functional and structural characteristics predicts two
subpopulations of external tufted cells.
VI.1.1. Active and passive electrical properties of external tufted cells
To ensure an unbiased, representative sampling of the external tufted cell (ETC)
population, I randomly selected juxtaglomerular cells with a somatic diameter of >10m
without any additional selection criterion (e.g. soma shape, number of emerging
dendrites etc). I paid particular attention to ensure that only cells with somata located in
the glomerular layer (GL) and not within the external plexiform layer (EPL) were
selected. All cells were filled with biocytin and were subject to post hoc morphological
identification. Several cells with somatic diameter of >10 m were subsequently
identified as short-axon cells, which were discarded (i.e. only anatomically identified
ETCs were included in my work). First, I assessed the spontaneous spiking activity of
the ETCs in cell-attached recording configuration. The recorded cells displayed large
heterogeneity based on their spontaneous firing behavior. A large proportion (57%)
fired bursts of action potentials (APs; from 0.03 to 8 Hz), some (25%) fired individual
APs at frequencies ranging from 0.1 to 38 Hz, and the remaining 18% of the cells were
completely silent. This spontaneous activity was also observed during the first minute
of whole-cell recordings, similar to that found by Hayar et al. (2004a). When a cell
showed spontaneous suprathreshold activity, small hyperpolarizing DC current was
injected to keep the membrane potential just below firing threshold. Under such
conditions, trains of action potentials were evoked by injecting one-second long
depolarizing currents of different amplitudes into the cells (Figure 4, see Methods and
materials).
The firing patterns of ETCs were extremely diverse (Figure 5); qualitative descriptions
commonly used to characterize such patterns are regular spiking, irregular spiking with
accommodation and burst firing. Eighty eight percent of the cells that showed
spontaneous bursting in the cell attached configuration also displayed bursts of APs
upon DC current injections. In 82% of the cells that did not fire bursts spontaneously,
somatic current injections evoked regular and irregular firing patterns.
32
Figure 5. Diverse action potential firing patterns of individual external tufted cells. Whole-cell voltage recordings of suprathreshold responses to depolarizing current injections from ETCs. Although, the firing patterns of the members of cluster 1 (A) are clearly different from those in cluster 2 (B), large within-group variability is also apparent. In all panels, the first part of the trace is shown on an expanded timescale on the right.
Of the silent cells 37.5% fired bursts of APs and the remaining 62.5% were non-
bursting following somatic current injections. To quantitatively characterize the spikes
of ETCs, I measured (Figure 4A) the threshold, peak amplitude, full width at half
maximum of the first and last APs of the train, the amplitude of spike after-
hyperpolarization (AHP) and decay times at 25, 50 and 75% of AHP amplitude after the
first and last AP. The ratios of these values were also calculated (parameter X of last
33
spike divided by that of the 1st spike). In addition, the first and last inter-spike intervals
(ISI) were measured and their ratio was calculated. In the case of burst firing cells the
first and last ISIs of the first burst were measured, but all ISIs (intra- and inter-burst)
were used to generate the ISI distribution (see below). To characterize the firing
patterns of ETCs, I calculated the mean, maximum, minimum and coefficient of
variation (CV) of the ISI distributions. These parameters allow distinctions to be made
among qualitatively different firing patterns. For example, a bursting pattern would
result in very different minimum and maximum ISI values, and as a consequence a large
CV of the ISI distribution. In contrast, a regular firing pattern would be characterized
by similar maximum and minimum ISI values, resulting in a small CV of the ISI
distribution. Dissimilarities in individual spike shape, spike frequency adaptation and
AP amplitude accommodation are also reflected by our measurements. The membrane
time constant () and the input resistance (Rin) of the cells were also measured (Figure
4B) and revealed tremendous heterogeneities: ranging from 5.7 to 63.7 ms with a CV
of 0.71 and Rin spanning from 43 to 990 MΩ with a CV of 0.6. I also characterized the
cells with respect to their intrinsic, subthreshold resonant properties (Figure 4 and
Materials and Methods). In one-fourth of the cells, no active resonance was found at
the frequencies tested, whereas in the rest of the cells, the peak resonant frequency
varied from 1 to 10 Hz (Figure 8).
Next, I selected those measured and calculated parameters that did not show any
dependence on two important experimental variables, and therefore reliably
characterized the cells. In order to ensure that the elapsed time from the establishment
of the whole-cell configuration did not affect my parameters, I re-measured them at the
end of the whole-cell recording period. All parameters were statistically compared
between the beginning (first 3.5±1.2 minutes) and at the end (10±3 minutes later) of the
recording periods, and parameters showing significant difference were discarded from
my analysis (Table 1). I also tested whether the measured and calculated parameters
depended on the amount of injected current to evoke the spike trains. If regression
analysis yielded a significant correlation between a parameter and the amount of current
injected, the parameter was also discarded. Following these selection criteria, twelve
physiological parameters remained and were used for quantitative characterization of
ETCs (Table 1).
34
Table 1. Selection of functional parameters. Pearson’s regression analysis was used to ensure that the parameters used to characterize the cells do not depend on the amplitude of the injected current. To ensure that the parameters are not influenced by the elapsed time during the whole-cell recordings, they were compared at the beginning and at the end of the recording period with either parametric (paired t-test, indicated by italics) or nonparametric (Sign-test) tests as appropriate (following Shapiro-Wilk’s normality test, at p<0.01). Parameters independent of both the amplitude of injected current and the elapsed time are highlighted in bold.
Regression analysis of Paired comparison between
injected current independence beginning and end of recording
Pearson's R Correlation Sign test or Paired t-test
p= p=
Input resistance 0.405
Membrane time constant 0.868
Threshold of 1st AP 0.584 0.220
Peak amplitude of 1st AP 0.579 0.000
Full width at half maximum of 1st AP 0.259 0.006
Amplitude of AHP of 1st AP 0.136 0.560
Decay time at 25 % of AHP amplitude 0.007 0.360
Decay time at 50 % of AHP amplitude 0.005 0.542
Decay time at 75 % of AHP amplitude 0.007 0.877
1st ISI 0.004 0.291
Threshold of last AP 0.020 0.880
Peak amplitude of last AP 0.305 0.000
Full width at half maximum of last AP 0.410 0.095
Amplitude of AHP of last AP 0.739 0.263
Decay time at 25 % of AHP amplitude 0.737 0.440
Decay time at 50 % of AHP amplitude 0.475 0.542
Decay time at 75 % of AHP amplitude 0.265 0.222
Last ISI 0.169 0.175
Ratio of last and 1st ISI 0.061 0.651
Ratio of thresholds of last and 1st AP 0.000 0.877
Ratio of peak amplitude of last and 1st AP 0.007 0.000Ratio of FWHMs of last and 1st AP 0.011 0.519
Ratio of AHP Amplitude of last and 1st AP 0.093 0.014
Mean of ISI distribution 0.082 0.880
Maximum of ISI distribution 0.203 0.880
Minimum of ISI distribution 0.009 0.291
Coefficient of variance of ISI distribution 0.524 0.880
Functional
parameters
VI.1.2. The presence of two subpopulations of external tufted cells based on their
physiological properties
To determine whether ETCs form multiple subpopulations based on their active and
passive electrical properties or whether a single heterogeneous population exists, I
performed principal component and cluster analysis (Figure 6). Because the number of
available cells (62 cells in total) is likely to be insufficient for clustering in a 12-
dimensional space, principal component analysis (PCA) of the parameters was first
carried out. As shown in the scree plot in figure 6A, the first 4 factors had Eigenvalues
of >1 and accounted for >75% of the total variance; therefore they were selected for
subsequent cluster analysis. Agglomerative clustering revealed a joining tree with two
dominant and several additional sub-branches (Figure 6C).
35
Figure 6. Principal component and cluster analysis of the recorded cells based on their electrophysiological parameters. A. Scree plot of the Eigenvalues derived from principal component analysis of 12 physiological parameters. The first 4 factors had Eigenvalues of >1 and together accounted for 75.1% of the total variance. B. Factor loading plot showing the contribution of the 12 physiological parameters to each of the first 4 factors. C. Joining tree of agglomerative clustering using the first 4 principal component factor scores for each cell. Individual cells are illustrated in the X axis and the Y axis shows the percentage of the maximum Euclidean distance between any two cells. Cluster 1 and 2 significantly differ from each other. D. Cumulative probability plots of squared Euclidean distances of each cell in cluster 1 (black) and 2 (gray) from the center of cluster 1. The distributions are statistically different (p<0.001, Mann-Whitney test). E. Similar plot as in panel D, but distances of cells in clusters 1 and 2 are shown from the center of cluster 2. The distributions are statistically significant (p<0.001, Mann-Whitney test). σ2: variance, AP: action potential, AHP: spike after-hyperpolarization, ISI: inter-spike interval, FWHM: full width at half maximum amplitude of AP, CV: coefficient of variation, Rin: input resistance, : membrane time constant. Dlink: linkage distance, Dmax: maximum linkage distance.
36
Next, I developed a method of objective determination of the number of distinct
subpopulations following such clustering (see Materials and Methods). I considered
two clusters significantly different in an n-dimensional space if the distance of the
members of cluster 1 from the center of cluster 1 was significantly smaller than the
distance of the members of cluster 2 from the center of cluster 1, and vice versa. By
performing this analysis on ETCs based on the first 4 factors obtained with PCA, I
found that two clusters differed significantly (Figure 6D and E), but additional
subdivisions (into 3, 4 … clusters) were not supported statistically.
So far, these results demonstrate the presence of two subpopulations of ETCs based on
PCA factors calculated from parameters describing the intrinsic electrical properties of
the cells. Next, I asked how different the individual active and passive electrical
properties between the two subpopulations were. Statistical comparisons revealed that
i: the threshold of the first AP (cluster 1: -36.1±3.7 mV vs. cluster 2: -33.3±4.9 mV;
Figure 7B); ii-iii: the amplitude of the AHP after the first (4.5±4.0 mV vs. 13.3±4.6
mV; Figure 7A) and last (7.2±3.8 mV vs. 14.3±3.7 mV) APs; iv: the ratio of the last and
first spike width (1.5±0.4 vs. 1.1±0.1); v-vii: the mean (77.6±35.2 ms vs. 39.8±18.7 ms),
maximum (319.6±140.3 ms vs. 104.1±71.4 ms) and CV (1.6±0.5 vs. 0.6±0.5; Figure
7D) of the ISI distributions; and viii: the membrane time constants (13.6±6.5 ms vs.
27.8±17.2 ms; Figure 7C) are significantly different between the two subpopulations.
Qualitatively, the most prominent difference between the two subpopulations was that
all members of cluster 1 fired bursts of APs, whereas those of cluster 2 had regular or
irregular firing patterns (Figure 5) and did not change to burst firing when
hyperpolarized to -60 mV or more negative membrane potentials. However, it is
important to note that members of each subpopulation displayed large variability based
on several parameters. For example, cells in cluster 1 showed large variability in the
degree of the spike amplitude accommodation (Figure 5A) or the amplitude of the AHP
(Figure 5A and 7A). Cells belonging to cluster 2 displayed very different spike
frequency adaptations (Figure 5B, 7D), amplitude and time course of AHP (Figure 5B,
7A) or (Figure 7C).
The peak resonance of the cells was also significantly different; cells in cluster 1
displayed a higher peak resonant frequency (Figure 8; 2.5±2.2 Hz vs. 0.9±0.8 Hz).
37
Figure 7. Between- and within-cluster variability of physiological parameters. A-D. Cumulative probability plots of 4 parameters (cluster 1: black; cluster 2: gray), showing significant difference between the two external tufted cell subpopulations. Each parameter varied considerably within each cluster (CVs ranging from 0.34 to 0.88), resulting in some overlap between the subpopulations. The positions of the cells illustrated in figure 5 are marked in each panel.
Figure 8. External tufted cells significantly differ with regard to their subthreshold resonant behavior. A-D. Plots of frequency against FFT relative amplitude for four individual cells (black and gray symbols). For comparison, the behavior of passive model cells are shown (open symbols). The peak resonant frequency was determined from these plots. Cells in panel A and B belong to cluster 1 and those in C and D to cluster 2. E. Cumulative probability plot of peak resonant frequencies for cells in cluster 1 (black) and cluster 2 (gray). The two subpopulations are significantly different (p<0.002, Mann-Whitney U-test). FFT: fast Fourier transformation.
38
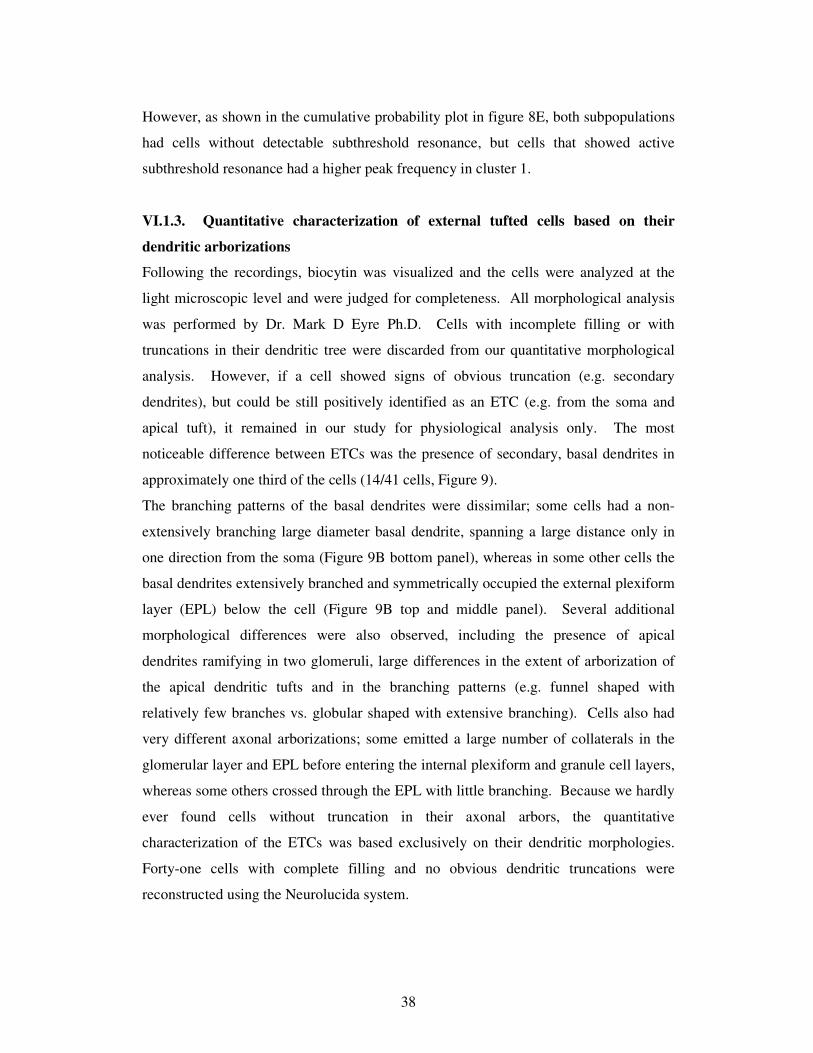
However, as shown in the cumulative probability plot in figure 8E, both subpopulations
had cells without detectable subthreshold resonance, but cells that showed active
subthreshold resonance had a higher peak frequency in cluster 1.
VI.1.3. Quantitative characterization of external tufted cells based on their
dendritic arborizations
Following the recordings, biocytin was visualized and the cells were analyzed at the
light microscopic level and were judged for completeness. All morphological analysis
was performed by Dr. Mark D Eyre Ph.D. Cells with incomplete filling or with
truncations in their dendritic tree were discarded from our quantitative morphological
analysis. However, if a cell showed signs of obvious truncation (e.g. secondary
dendrites), but could be still positively identified as an ETC (e.g. from the soma and
apical tuft), it remained in our study for physiological analysis only. The most
noticeable difference between ETCs was the presence of secondary, basal dendrites in
approximately one third of the cells (14/41 cells, Figure 9).
The branching patterns of the basal dendrites were dissimilar; some cells had a non-
extensively branching large diameter basal dendrite, spanning a large distance only in
one direction from the soma (Figure 9B bottom panel), whereas in some other cells the
basal dendrites extensively branched and symmetrically occupied the external plexiform
layer (EPL) below the cell (Figure 9B top and middle panel). Several additional
morphological differences were also observed, including the presence of apical
dendrites ramifying in two glomeruli, large differences in the extent of arborization of
the apical dendritic tufts and in the branching patterns (e.g. funnel shaped with
relatively few branches vs. globular shaped with extensive branching). Cells also had
very different axonal arborizations; some emitted a large number of collaterals in the
glomerular layer and EPL before entering the internal plexiform and granule cell layers,
whereas some others crossed through the EPL with little branching. Because we hardly
ever found cells without truncation in their axonal arbors, the quantitative
characterization of the ETCs was based exclusively on their dendritic morphologies.
Forty-one cells with complete filling and no obvious dendritic truncations were
reconstructed using the Neurolucida system.
39
Figure 9. External tufted cells possess distinct dendritic arborization patterns. Two-dimensional projections of 3-D reconstructed ETCs with somata and dendrites indicated by blue and the axon is by red. The most pronounced difference between the cells in cluster 1 (A) and 2 (B) is the absence of basal dendrites in the EPL of the cells in cluster 1. Cells within each subpopulation show large diversity based on the total length, number of segments and arborization pattern of their apical tufts. The basal dendrites of ETCs in cluster 2 can also be remarkably different. MA137 and MA142 possessed extensive axonal arbors of in the EPL, MCL, IPL and GCL. MA235 also projects out through the EPL and MCL. The physiological properties of some of these cells are illustrated in Figures 5-8. mcl: mitral cell layer
40
To quantitatively describe differences in the dendritic arborizations among ETCs, we
measured and calculated 9 parameters for the apical as well as the basal dendrites
(Figure 10B). For example, dendritic tufts with extensive branching could be easily
discriminated from fan-shaped tufts by calculating the number of segments and the total
dendritic length. Cells with similar total dendritic length, but very different density of
branches can be distinguished by the furthest sholl intercept and from the mean segment
tortuosity. I am confident that these measured parameters are sufficient to discriminate
between qualitatively dissimilar dendritic patterns and provide comparable values for
visually similar dendritic arbors. To reduce the number of dimensions within which
clustering was carried out, we performed PCA of the 18 anatomical parameters. The
scree plot in figure 10A indicates that 4 factors had Eigenvalues of >1, accounting for
>73% of the total variance. Agglomerative clustering using the first 4 PCA factor
scores for each cell revealed two main branches on the joining tree with several
additional sub-branches (Figure 10C). Similar statistical analysis to that performed
above indicated the presence of two subpopulations of ETCs based on their dendritic
arborization patterns (Figure 10C-E). To determine the morphological parameters that
are significantly different between the two ETC subpopulations, we performed a
between-groups statistical comparison for each variable. Fifteen out of the 18 variables
differed significantly (p<0.05) between the groups (Table 2).
These results demonstrate that most of the measured morphological parameters are
significantly different between the two ETC subpopulations. However, similarly to the
physiological parameters, large within-group variability was observed for most
measurements (Figure 11), indicating that ETCs within each subpopulation are highly
heterogeneous.
41
Figure 10. Principal component and cluster analysis of the recorded cells based on their morphological properties. A. Scree plot of the Eigenvalues derived from principal component analysis of the 18 morphological parameters. The first 4 factors had Eigenvalues >1, and together account for 73.3% of the total variance. B. Factor loading plots demonstrate the contribution of the 18 variables, 9 for dendrites in the GL and 9 for dendrites in the EPL, to each of the 4 factors. C. Joining tree of agglomerative clustering using the first 4 principal component factor scores for each cell. Individual cells are shown in the X axis. Cluster 1 and 2 are significantly different from each other. However, further subdivision of the clusters is not justified (neither clusters 1a and 1b nor cluster 2a and 2b are significantly different). D. Cumulative probability plot of squared Euclidean distances of cells in cluster 1 (black) and 2 (gray) from the center of cluster 1. E. Cumulative probability plot of squared Euclidean distances of cells in cluster 1 (black) and 2 (gray) from the center of cluster 2. σ2: variance; GL: glomerular layer; EPL: external plexiform layer; vertex ratio: a measure of the branching pattern of the dendrites; tortuosity: ratio of the length along a dendritic segment and the shortest distance in 3D between the two ends of the segment; furthest sholl intercept: radius of the largest virtual sphere centered on the soma that is still intercepted by the dendrite. Dlink: linkage distance, Dmax: maximum linkage distance.
42
Table 2. Parameters describing the dendritic arborization pattern of external tufted cells. Significant differences (Mann-Whitney or t-test at p<0.05) are indicated in bold. Cluster 1 contains 27 and cluster 2 14 ETCs. Vertex ratio: a measure of the branching pattern of the dendrites; tortuosity: ratio of the length along a dendritic segment and the shortest distance in 3D between the two ends of the segment; furthest sholl intercept: radius of the largest virtual sphere centered on the soma that is still intercepted by the dendrite.
Figure 11. Quantitative comparisons of the morphological parameters between and within external tufted cell subpopulations. Fifteen out of 18 parameters significantly differed between cluster 1 (black) and 2 (gray). Some of these parameters include the total dendritic length in GL (A) and EPL (D), the number of dendritic segments in GL (B) and EPL (E) and the first segment length in GL (C) and EPL (F). Each parameter varied considerably within each subpopulation (CVs ranging from 0.32 to 1.15). Cumulative probability distributions of EPL dendrites of cells in cluster 1 are not shown (D-F) because they lacked such dendrites. GL and EPL: glomerular and external plexiform layer, respectively; CV: coefficient of variation.
43
VI.1.4. Comparing physiologically and morphologically determined external
tufted cell subpopulations
Finally, I asked how the two morphologically determined ETC subpopulations
correspond to those derived from the physiological properties. To address this question,
I restricted my analysis to a total of 37 ETCs in which all 30 (12 physiological and 18
morphological) parameters were determined (Figure 12).
Principal component analysis indicated 7 factors with Eigenvalues of >1 (Figure 12A),
accounting for 78.5% of the total variance. Agglomerative clustering showed a joining
tree with two major branches. The presence of two subpopulations was statistically
confirmed (Figure 12C and D). When the position of each individual cell was
compared, a perfect match was found between the anatomically determined groups and
the groups based on all parameters (Figure 12B). This could be the consequence of a
large dominance of the anatomical parameters in the first 7 factors derived from PCA.
However, a very close agreement between the results of clustering based on all
parameters and only the physiological parameters was also observed. Only one cell
(MA136) was clustered into the first group based on its physiological properties, which
was clustered to the second group when all parameters were taken into account. The
rest of the cells (n=20 cells) in the first cluster based on the electrophysiological
properties alone were also in the first cluster based on all parameters.
Our results demonstrate that a number of electrophysiological (e.g. burst firing) and
morphological (e.g. lack of basal dendrites) parameters of ETCs are highly predictive of
one another.
44
Figure 12. Principal component and cluster analysis of the recorded cells based on both electrophysiological and morphological properties. A. Scree plot of the Eigenvalues derived from principal component analysis of the 30 variables (12 functional and 18 structural). The first 7 factors together accounted for 78.5% of the total variance. B. Joining tree of agglomerative clustering using the first 7 principal component factor scores for each cell (37 cells in total for which all 30 parameters were determined). The ID of individual cells is shown on the X axis, whereas the normalized maximum Euclidean distances between any two cells are shown on the Y axis. At the bottom, the group membership of each cell is shown based on clustering of either only the electrophysiological or only the morphological parameters. Note the almost perfect matching between the three ways of clustering. C. Cumulative probability plot of squared Euclidean distances of cells in cluster 1 (black) and 2 (gray) from the center of cluster 1. D. Cumulative probability plot of squared Euclidean distances of cells in cluster 1 (black) and 2 (gray) from the center of cluster 2. The distributions on both panel C and D are significantly different from each other (Mann-Whitney, p<0.001). σ2: variance, Dlink: linkage distance, Dmax: maximum linkage distance.
45
VI.1.5. Summary of the results and conclusions
My results demonstrate the presence of two subpopulations of ETCs of the rat main
olfactory bulb based on their active and passive intrinsic electrical properties and their
dendritic morphologies. Although 24 out of the 30 measured parameters significantly
differed between the two ETC subpopulations, qualitatively the most prominent
differences between them were the:
1. presence and absence of basal dendrites and the
2. lack and presence of action potential bursting, respectively.
Although our quantitative analysis indicated the existence of only two ETC
subpopulations, a large heterogeneity in both physiological and morphological
properties within each subpopulation was apparent.
46
VI.2. Novel intra- and extrabulbar GABAergic connections in the main olfactory
bulb are provided by distinct subtypes of deep short-axon cells.
VI.2.1. The morphological diversity of deep short-axon cells
I carried out patch pipette recordings from the somata of 158 neurons located below the
mitral cell layer (MCL) in acute main olfactory bulb slices obtained from P20-P41 rats.
Cells with a somatic diameter of >10 m were randomly selected in the internal
plexiform (IPL) and granule cell (GCL) layers and were recorded first in cell-attached,
and then in whole-cell configurations. Following electrophysiological recordings, the
slices were fixed and the biocytin-filled cells were subjected to neurochemical and
morphological characterizations.
All of the recorded cells exhibited dendritic and axonal morphologies distinct from both
mitral/tufted and granule cells. The location and shape of the somata and the dendritic
arbors of these cells were heterogeneous, and examples of all categories of deep short-
axon cells (dSACs) described previously were observed (Blanes, 1898; Cajal, 1911;
Price and Powell, 1970a; Schneider and Macrides, 1978). Large spiny Blanes cells
(73/158 cells) were the most frequent cell morphology encountered, whereas sparsely
spiny large Golgi cells (28/158 cells), medium-sized horizontal cells (42/158 cells) and
smaller Cajal cells (15/158 cells) were less common. Due to the advantages offered by
intracellular labeling techniques compared to Golgi impregnations, we were able to
recover extensive axonal trees of the recorded cells. Many dSACs had a very extensive
axonal arbor, ramifying in distinct layers of the main olfactory bulb (Figure 13).
A substantial number of cells projected their axons across the external plexiform layer
(EPL) and ramified broadly in the glomerular layer (GL). The majority of these
branches encircled many glomeruli, and only a few collaterals were found in the EPL
and the granule cell layer (GCL) (Figure 13A, B). Their somata were elongated parallel
to the MCL, and were often located in the internal plexiform layer (IPL) (32/51 cells).
Their dendrites were either sparsely (30/51 cells) or densely (8/51 cells) spiny and
predominantly confined to the IPL, corresponding to horizontal cells. The remaining
cells (13/51 cells) had an overall appearance of Golgi cells. In contrast, many other
dSACs had axonal ramifications predominantly within the EPL, with some collaterals in
the IPL and superficial GCL (Figure 13E, F).
47
Figure 13. Three subpopulations of deep short-axon cells based on their axonal and dendritic arborizations. Three-dimensional Neurolucida reconstructions of individual deep short-axon cells (dSACs). A, B. Some dSACs (A: MA324; B: MA344) have axonal ramifications predominantly in the glomerular layer (GL-dSACs). The cells possess a variable extent of lateral axonal ramification. The dendrites of these cells are mainly confined to the internal plexiform layer (IPL). Inset in B shows voltage responses to one-second long 100 pA depolarizing somatic current injections. C, D. The axonal arbor of some dSACs is confined to the granule cell layer (GCL-dSAC; C: MA334; D: MA862). The somatic location of GCL-dSACs varies throughout the IPL and granule cell layer (GCL) down to the GCL-white matter border. Inset in C demonstrates the firing properties of the reconstructed cell. E, F. The largest proportion of dSACs have an axonal arbor predominantly located in the external plexiform layer (EPL-dSAC; E: MA340; F: MA349) with some local collaterals in the IPL and GCL. These cells mainly possess vertically oriented dendritic trees. Inset in F shows the voltage response of the EPL-dSAC to 1 s long depolarizing (100 pA) current injection. All panels: axons, red; dendrites, blue. Color-coded contours represent boundaries between layers: ONL-GL: dark gray; GL-EPL: blue; EPL-MCL: green; MCL-IPL: red;
48
IPL-GCL: orange; GCL-WM: light gray. Scale bars: 50 m along each axis. Scale bars for spike trains: 10 mV/200 ms. G. Joining tree of agglomerative clustering using the first 4 principal component factor scores for each cell. Individual cells are illustrated on the y-axis (ID labels are color-coded by identified subtype) and the x-axis shows the percentage of the maximum Euclidean distance between any two cells. The gap statistic method suggested that the smallest number of clusters was 3.
The axonal arbor was dense, column-like and had a characteristic sharp border between
the EPL and GL; axons never entered the GL. The majority (72/79 cells) displayed
vertically-polarized somata in the GCL and their stellate or vertically oriented dendrites
were usually covered with spines (62/79 cells), giving them the appearance of Blanes
cells (Figure 13F). However, some cells with similar axonal morphologies possessed
smooth dendrites almost devoid of spines, typical of vertical Cajal cells (Figure 13E;
14/79 cells). Finally, the smallest subset of dSACs had axonal arbors restricted to the
GCL (Figure 13C, D). In order to exclude the possibility that the lack of axons in the
superficial layers was the consequence of truncation during slice preparation, we
discarded all such cells from our analysis. The somata of these cells were often located
in the GCL (13/28 cells) and their dendrites were usually sparsely spiny (25/28 cells),
having an overall appearance of horizontal or Golgi cells.
Thus, our analysis of the somato-dendritic morphologies was in agreement with the
classical Golgi studies, but when the axonal arborizations were also considered, a more
complex picture emerged. In order to assess whether dSACs can be objectively divided
into well-defined subpopulations based on both their axonal and dendritic
morphologies, we reconstructed a subpopulation of these cells in 3D and subjected them
to morphometric measurements. Following principal component analysis,
agglomerative clustering (see Materials and Methods) suggested 3 main subpopulations
(Figure 13G), which was confirmed using the gap statistic method (Tibshirani et al.,
2001). Based on the predominant axonal arborizations of the subpopulations in
different layers, they were termed as GL-, EPL- and GCL-dSACs (Figure 13). Our
results also demonstrate that many morphological parameters (e.g. dendritic fractal
Table 3. Many morphological parameters significantly differ between subtypes of deep short axon cells. Significant differences are indicated by * and ** for parametric ANOVA or by * and ** for Kruskal-Wallis nonparametric ANOVA tests at p<0.05 and p<0.01 levels, respectively. # and $ depict significant (p<0.05) differences between the indicated pairs following post hoc tests. Vertex ratio: a measure of the branching pattern of the dendrites; furthest Sholl intercept: radius of the largest virtual sphere centered on the soma that is still intercepted by the dendrite or the axon; fractal index: a measure of the space-filling nature of the object.
VI.2.2. Granule cell layer-dSACs project to higher olfactory areas
When the local axon collaterals of distinct dSAC subtypes were analyzed, we noticed
that a branch of the main axon of GCL-dSACs often entered the white matter and
projected caudally in the lateral olfactory tract, suggesting that GCL-dSACs might form
an extrabulbar projection (Kosaka and Kosaka, 2007). In order to address this issue
directly, my colleague, Mark D. Eyre Ph.D. injected fluorescent microspheres into
many higher order olfactory areas, including the anterior olfactory nucleus, the olfactory
tubercule, the piriform cortex and the deep endopiriform nucleus (Figure 14).
50
Figure 14. A granule cell layer-dSAC projecting to the piriform cortex. A. Neurolucida reconstruction of a retrogradely labeled GCL-dSAC (MA1034) showing dendrites (blue) and axons (red) confined to the inframitral layers extending considerably in the rostro-caudal axis of the GCL. Scale bar: 200 µm. Inset illustrates the voltage response of the cell to a one-second long 100 pA depolarizing current injection. B. Post hoc visualization of the intracellularly applied biocytin (red) confirmed that the recorded cell contained fluorescent microspheres (green). Note that many mitral cells also contained fluorescent microspheres (green cells in B3). Scale bars: B1 and B2: 10 µm, B3: 50 µm. C. The site of the injection of fluorescent microspheres (green overlay) is shown superimposed on coronal maps (from Paxinos and Watson, 1998) at six rostro-caudal levels relative to Bregma. The injection is mainly confined to the piriform cortex and the deep endopiriform nucleus. Scale bar: 1 mm. GL, EPL, MCL, IPL, GCL: glomerular, external plexiform, mitral cell, internal plexiform, granule cell layer, respectively
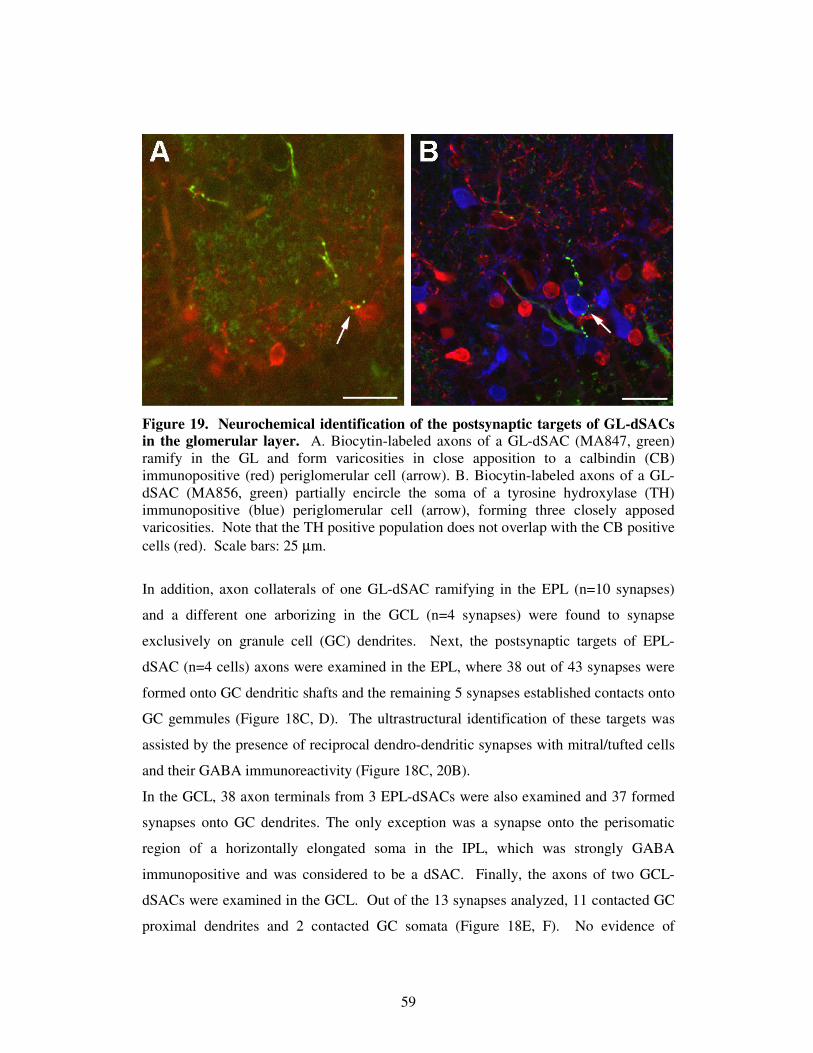
Three to 14 days after surgery, I prepared acute in vitro slices from the main olfactory
bulb and fluorescently labeled cells with inframitral somatic locations were subject of
whole cell recordings. Following the characterization of their active and passive
electrical properties and their synaptic inputs (see below), the presence of microspheres
in the biocytin-filled cells was verified (Figure 14B) followed by full morphological
51
reconstructions. Figure 14A shows the reconstruction of a dSAC with projection to the
piriform cortex and the deep endopiriform nucleus. The soma was located in the GCL,
had horizontally oriented dendrites, and the local axon collaterals were also restricted to
the inframitral layers. Qualitatively very similar axonal and dendritic arborizations
were found in all 17 cells in which sufficient axons and dendrites were recovered
following in vitro electrophysiological characterization (n=42 cells). The axo-dendritic
morphologies of these retrogradely labeled cells were indistinguishable from the
randomly recorded and filled GCL-dSACs, but it remains to be seen whether all GCL-
dSACs project outside the main olfactory bulb.
VI.2.3. Molecular differences between deep short-axon cells
We then addressed whether molecular differences also exist among dSAC subtypes.
Previous immunolabeling studies have indicated that neuropeptide Y (NPY), vasoactive
intestinal polypeptide (VIP), calbindin (CB) and nitric oxide synthase (NOS) are
neurochemical markers for dSACs in the inframitral layers. However, because these
markers labeled very few cells (e.g. VIP and CB <4% of all dSACs), we found none of
them to be a good candidate as a selective marker of a particular dSAC subtype. In
contrast, the GABAA receptor (GABAAR) 1 subunit selectively labels the somato-
dendritic domain of a large population of non-granule cells in the inframitral layers of
the main olfactory bulb (Figure 15A), making it a potential subtype-selective marker.
As illustrated in figure 15A, only dSACs are immunopositive for this subunit in the
GCL; the strong labeling of the EPL originates from mitral/tufted cells. A subset of the
in vitro recorded cells (n=50 cells) was processed for immunolabeling for the GABAAR
1 subunit in conjunction with fluorescent visualization of the biocytin. All EPL-
dSACs (n=30 cells) were intensely labeled for the 1 subunit (Figure 15C). Eleven out
of 15 GL-dSACs were found to be moderately labeled (Figure 15B), whereas two were
strongly labeled and two appeared to be immunonegative. Finally, the majority (4/5
cells) of GCL-dSACs were apparently immunonegative (Figure 15D); only a single cell
showed very weak immunoreactivity.
52
Figure 15. Deep short-axon cell subtypes differentially express the GABAA receptor 1 subunit. A. Immunofluorescent labeling for the GABAA receptor 1 subunit in the main olfactory bulb. In the IPL and GCL, the 1 subunit is exclusively expressed by dSACs. Strongly and weakly-labeled cells are indicated by filled and open arrowheads, respectively. The very strong labeling of the EPL originates from mitral/tufted cell somata and dendrites. Scale bar: 50 m. B-D. Confocal images of intracellularly filled dSACs (biocytin: blue) immunolabeled post hoc for the GABAA receptor 1 subunit (green). Glomerular layer-dSACs (B: MA900) are weakly immunopositive, EPL-dSACs (C: MA916) are strongly immunopositive, whereas the GCL-dSACs (D: MA920) are immunonegative for the GABAA receptor 1 subunit. Note the extensive dendritic labeling of EPL-dSACs in panel C2 and the lack of labeling of GCL-dSACs despite adjacent strongly-labeled processes (arrowheads) in D2. Scale bars: B-D: 10 m. ONL, GL, EPL, MCL, IPL, GCL: olfactory nerve, glomerular, external plexiform, mitral cell, internal plexiform, granule cell layer, respectively; dSAC: deep short-axon cell.
53
These results clearly demonstrate that molecular differences exist, but future
experiments will be needed to identify other dSAC subtype-selective molecular
markers.
VI.2.4. Deep short-axon cells show distinct intrinsic electrical properties
Given the morphological and molecular heterogeneity of dSACs, I also aimed to reveal
potential subtype-specific differences in the electrophysiological properties of the cells.
Cell-attached recordings prior to the establishment of the whole-cell configuration
demonstrated differences in the spontaneous spiking activity of dSACs in acute in vitro
slices. Both GL- and GCL-dSACs were found to be spontaneously active, whereas 27
out of 28 EPL-dSACs were silent (Table 4).
Table 4. Significant differences in physiological properties of deep short-axon cells. Significant differences are indicated by * and ** using Kruskal-Wallis nonparametric ANOVA test at p<0.05 and p<0.01 levels, respectively. # and $ indicate a significant (p<0.05) post hoc test (multiple comparisons of mean ranks) between the indicated pairs. AP: action potential; AHP: after-hyperpolarization; FWHM: full width at half maximum amplitude; ISI: inter-spike interval
Physiological parameters GL-dSAC
Mean ± SD EPL-dSAC Mean ± SD
GCL-dSAC Mean ± SD
ANOVA
Spontaneous firing activity (Hz) #
7.41 ± 6.54
# 0.25 ± 1.31
$
3.26 ± 3.29
$ **
Input resistance (MΩ) #
306.2 ± 150.1
# 160.8 ± 68.6
$
406.6 ± 180.7
$ **
Membrane time constant (ms) #
25.4 ± 8.9
# 13.5 ± 5.7
$
32.8 ± 18.6
$ **
Threshold of first AP (mV) -38.2 ± 5.4 #
-39.8 ± 5.6
# -35.1 ± 3.2
*
Amplitude of AHP of first AP (mV) #
14.0 ± 5.1
# 11.2 ± 3.5
13.1 ± 2.2 *
Decay time at 75 % of AHP amplitude of first AP (ms) #
21.1 ± 19.8
# 25.5 ± 6.3
$
12.4 ± 7.5
$ **
Ratio of thresholds of last and first AP #
0.86 ± 0.07 $
# 0.73 ± 0.47
0.74 ± 0.14
$ **
Ratio of FWHMs of last and first AP #
1.19 ± 0.17
# 1.26 ± 0.16
1.44 ± 0.72 *
Ratio of AHP Amplitude of last and first AP #
1.17 ± 0.37
# 1.32 ± 0.23
$
1.08 ± 0.12
$ **
Mean of ISI distribution (ms) #
36.4 ± 19.1
40.1 ± 8.8
$
# 21.1 ± 7.8
$ **
54
In whole-cell recordings, dSACs exhibited a variety of action potential firing patterns in
response to one-second long 100pA depolarizing current injections (Figure 13 insets).
Quantitative analysis of a large number of parameters derived from the spike trains,
individual spikes and the passive electrical properties of the cells revealed significant
dSAC subtype-specific differences and prominent within-subtype heterogeneity for
many parameters (Table 4).
VI.2.5. Excitatory and inhibitory inputs onto deep short-axon cells
In order to gain insights into the potential role of a neuron in a network, not only the
morphological, molecular and intrinsic electrical properties should be deciphered, but
the synaptic connectivity must be determined as well. To investigate the synaptic inputs
of dSACs, I performed in vitro voltage-clamp recordings of spontaneous excitatory and
inhibitory postsynaptic currents before and during the application of 1 µM tetrodotoxin
(TTX). Potential sources of glutamatergic excitation are either the local mitral/tufted
cells or centrifugal inputs from the anterior olfactory nucleus and piriform cortex
(Shepherd et al., 2004). I argued that if TTX reduces the frequency of spontaneous
excitatory postsynaptic currents (sEPSCs), then the cells providing the excitatory inputs
must be present in the slice and should be spontaneously active. Figure 16A shows
representative recordings of AMPA receptor-mediated sEPSCs in the presence of
GABAA and NMDA receptor antagonists for each dSAC subtype.
Tetrodotoxin dramatically reduced the frequency and amplitude of sEPSCs in a GL- and
an EPL-dSAC, and less dramatically in a GCL-dSAC (Figure 16A, B). When examined
at the population level, a significant decrease in EPSC frequency was detected in all
subtypes without any change in the kinetics of the responses (Figure 16C). The
amplitude of sEPSCs was significantly reduced in GL- and EPL-, but not in GCL-
dSACs. I also noted the prevalence of bursts of sEPSCs in control conditions, which
disappeared following TTX application, indicating that the sources of these synaptic
currents are likely to be bursting external tufted (Hayar et al., 2004a) or some mitral
cells (Carlson et al., 2000). The amplitude, rise and decay kinetics showed no
significant differences among the subtypes (Figure 16B, C). The extremely rapid rise of
the miniature EPSCs (mEPSCs) (10-90% rise time: 230-300 µs) suggests that neither
asynchronous release nor dendritic filtering is severe in these cells.
55
Figure 16. Tetradotoxin reduces the amplitude and frequency of sEPSCs in a cell type-specific manner. A. Representative recordings of spontaneous EPSCs before (black traces) and after (red traces) bath application of 1 M TTX, in the presence of 20 µM SR95531 and 50 µM D-AP5. Note the large reduction in the frequency and amplitude of EPSCs in GL- (MA934) and EPL- (MA889), and the moderate change in GCL-dSACs (MA915). Scale bars: 100 pA/200 ms. B. Consecutive individual spontaneous (gray traces) and miniature (red traces) EPSCs are shown superimposed on an extended time scale with their corresponding averaged traces (black and dark red, respectively). Scale bars: 50 pA/2 ms. C. Summary plots of the effect of TTX on the frequency, amplitude and kinetics of EPSCs in all dSAC subtypes. For GL- (n=6 cells), EPL- (n=6 cells) and GCL-dSACs (n=12 cells) dSACs, TTX resulted in a significant (Wilcoxon matched paired test, *: p<0.05) reduction in the frequency without affecting the kinetics of the responses. The amplitude of sEPSCs was significantly reduced in GL- and EPL-, but not in GCL-dSACs. sEPSC: spontaneous excitatory postsynaptic current; TTX: tetradotoxin; GL, EPL, GCL: glomerular, external plexiform, granule cell layer, respectively; dSAC: deep short axon cell. In addition, the identical decay time constants (weighted decay time constant (τw) = 1.4
ms for all subtypes, Figure 16C) indicate similar postsynaptic AMPA receptors and
synaptic glutamate concentration waveforms. In summary, dSACs receive some of
their AMPA receptor-mediated excitatory input from spontaneously active mitral/tufted
cells. In agreement with this, electron microscopy (EM) analysis revealed that the
presynaptic elements establishing asymmetrical synapses on dSACs were axon
terminals (data not shown).
56
Next, I examined the inhibitory inputs of dSAC subtypes by recording spontaneous
inhibitory postsynaptic currents (sIPSCs) using high chloride containing intracellular
solutions in the presence of the glutamate receptor antagonists, CNQX and D-AP5. The
average frequency of sIPSCs ranged from 3.4 to 7.1 Hz under control conditions, which
was significantly reduced following the application of TTX in all dSAC subtypes
(Figure 17).
Figure 17. The effect of blocking the network activity with tetradotoxin on spontaneous IPSCs. A. Continuous current recordings before (black traces) and after (red traces) bath application of 1 M TTX, in the presence of 20 µM CNQX and 50 µM D-AP5, are shown from individual cells of each dSAC subtype (GL-: MA858; EPL-: MA882; GCL-: MA913). Scale bars: 40 pA/200 ms. B. Consecutive individual spontaneous (gray traces, average in black) and miniature (red traces, average in dark red) IPSCs are shown on an extended time scale. Scale bars: 20 pA/5 ms. C. Summary of the effects of 1 M TTX on spontaneous IPSCs in GL (n=6 cells), EPL (n=5) and GCL (n=5) dSACs. For all three subtypes, a significant (Wilcoxon matched paired test, *: p<0.05) effect was only detected for IPSC frequency. IPSC: inhibitory postsynaptic current; TTX: tetradotoxin; GL, EPL, GCL: glomerular, external plexiform, granule cell layer, respectively; dSAC: deep short axon cell.
57
Application of TTX did not change the amplitudes of sIPSCs significantly, suggesting a
low quantal content (~1) in all dSACs. Comparisons between dSAC subtypes showed
no statistically significant differences in mIPSC amplitudes or kinetics (Figure 17C).
The fast rise times of mIPSCs (10-90% rise time: 280-330 µs) also indicate the lack of
both severe dendritic filtering and robust asynchronous release. The comparable decay
time constants (τw=2.3, 2.6 and 2.9 ms for EPL-, GL- and GCL-dSAC, respectively)
suggest similar postsynaptic GABAA receptor subunit compositions and synaptic
GABA concentration waveforms. These data demonstrate that all dSAC subtypes
receive some of their fast synaptic inhibition from spontaneously active, local
GABAergic interneurons. From our current knowledge of the main olfactory bulb
microcircuit, these could be either granule cells or short-axon cells. By using EM
analysis, we found that the presynaptic elements of symmetrical synapses onto dSACs
were exclusively GABA immunoreactive axon terminals. No evidence of dendro-
dendritic synapses, either established by or formed onto dSAC subtypes was observed,
suggesting that the majority of the GABAergic inputs of dSACs originate from short-
axon cells (data not shown).
VI.2.6. The postsynaptic targets of GABAergic deep short-axon cells are other
GABAergic interneurons
Following the identification of the synaptic inputs of dSACs, we carried out EM
analysis of the postsynaptic targets of biocytin-filled dSAC axon terminals. In addition
to the classification of postsynaptic profiles based on ultrastructural features, their
neurotransmitter content was also revealed using postembedding immunogold labeling
for GABA. Axon terminals of GL-dSACs (n=3 cells) ramifying in the juxtaglomerular
space established symmetrical synapses onto small diameter somata (5 synapses), and
large (22 synapses) and small (17 synapses) diameter dendrites, which all showed
ultrastructural features of periglomerular cells (PGCs) (Figure 18A, B) and were
immunopositive for GABA (Figure 18B, 20A). Because PGCs form a very diverse cell
population, we asked whether GL-dSAC axons selectively innervate a single
subpopulation or indiscriminately synapse on all cell types.
58
Figure 18. Deep short-axon cell subtypes selectively innervate other GABAergic interneurons. A. Electron micrograph showing an axon terminal (b; black DAB precipitate) of a biocytin-filled GL-dSAC (MA324) forming a symmetrical synapse (arrowhead) onto the soma of a periglomerular neuron (PG soma). The section was immunoreacted for GABA (small gold particles) using the
postembedding immunogold method. Inset shows the area at a lower magnification. Note the absence of gold particles in the adjacent principal cell process (M/Td). B. An axon terminal (b) of a GL-
dSAC (MA324) in the GL forms a symmetrical synapse (arrowhead) onto a strongly GABA immunopositive periglomerular cell dendrite (PGd). C. The postsynaptic target of an EPL-dSAC (MA340) in the EPL is a granule cell dendrite (GCd). A gemmule (GCg) emerges from this dendrite and forms a symmetrical synapse (arrow) onto a mitral/tufted dendrite (M/Td). Note the presence of immunogold particles labeling GABA in the vesicle-filled gemmule. D. A bouton (b) of an EPL-dSAC (MA349) in the EPL establishes a symmetrical synapse (arrowhead) onto the gemmule of a granule cell, which forms a reciprocal synapse with a mitral/tufted profile (M/Td; mitral-granule asymmetric synapse, open arrowhead; granule-mitral symmetrical synapse, arrow). E, F. The postsynaptic targets of GCL-dSACs (MA372) in the GCL are granule cell dendrites (GCd). Note that in panel E the granule cell dendrite also receives a symmetrical synapse (arrow) from an unidentified axon terminal (t). All scale bars: 500 nm, except inset of panel A: 2 m
Using fluorescent immunolabeling for tyrosine hydroxylase and calbindin, and
visualizing biocytin in the intracellularly filled axons, we found that at least these two
neurochemically defined PGC subpopulations are among the postsynaptic targets of
GL-dSACs (Figure 19).
59
Figure 19. Neurochemical identification of the postsynaptic targets of GL-dSACs in the glomerular layer. A. Biocytin-labeled axons of a GL-dSAC (MA847, green) ramify in the GL and form varicosities in close apposition to a calbindin (CB) immunopositive (red) periglomerular cell (arrow). B. Biocytin-labeled axons of a GL-dSAC (MA856, green) partially encircle the soma of a tyrosine hydroxylase (TH) immunopositive (blue) periglomerular cell (arrow), forming three closely apposed varicosities. Note that the TH positive population does not overlap with the CB positive cells (red). Scale bars: 25 µm.
In addition, axon collaterals of one GL-dSAC ramifying in the EPL (n=10 synapses)
and a different one arborizing in the GCL (n=4 synapses) were found to synapse
exclusively on granule cell (GC) dendrites. Next, the postsynaptic targets of EPL-
dSAC (n=4 cells) axons were examined in the EPL, where 38 out of 43 synapses were
formed onto GC dendritic shafts and the remaining 5 synapses established contacts onto
GC gemmules (Figure 18C, D). The ultrastructural identification of these targets was
assisted by the presence of reciprocal dendro-dendritic synapses with mitral/tufted cells
and their GABA immunoreactivity (Figure 18C, 20B).
In the GCL, 38 axon terminals from 3 EPL-dSACs were also examined and 37 formed
synapses onto GC dendrites. The only exception was a synapse onto the perisomatic
region of a horizontally elongated soma in the IPL, which was strongly GABA
immunopositive and was considered to be a dSAC. Finally, the axons of two GCL-
dSACs were examined in the GCL. Out of the 13 synapses analyzed, 11 contacted GC
proximal dendrites and 2 contacted GC somata (Figure 18E, F). No evidence of
60
synaptic contacts onto mitral/tufted cells was observed for any dSAC subtype in any
layer.
Visualization of intracellular biocytin at the EM level with a diaminobenzidine (DAB)
reaction results in an electron-dense precipitate throughout the cytoplasm (Figure 18),
preventing the access of primary antibodies to the aldehyde-fixed neurotransmitter
molecules. To overcome this technical drawback, we visualized the intracellular
biocytin with silver-enhanced ultrasmall gold particles (Figure 20). This technique not
only allowed 3D light microscopic reconstruction of the cells and unequivocal
identification of the filled processes at the EM level, but the visualization of GABA in
the filled profiles was also possible. For each dSAC subtype, all examined terminals
were immunopositive for GABA, as were their postsynaptic target cells (Figure 20).
Figure 20. Deep short-axon cells are GABAergic. A1, A2. Serial ultrathin sections of a bouton (b) of a biocytin-filled (large silver-enhanced particles in A1) GL-dSAC (MA633) in the GL. The GABA immunopositive bouton (small gold particles in A2) forms a symmetrical synapse (black arrowhead) onto a GABA immunopositive periglomerular cell dendrite (PGd). The axon terminal (t) that establishes an asymmetric synapse (white arrowhead) on the same dendrite is GABA immunonegative. B1, B2. Serial sections of a biocytin-filled (large silver particles in B1) EPL-dSAC (MA796) bouton (b) in the EPL, which forms a
symmetrical synapse (black arrowhead) onto a granule cell dendrite (GCd). Both the
61
presynaptic dSAC bouton and the postsynaptic dendrite contain a large number of gold particles labeling GABA. Note the lack of immunogold particles in the adjacent mitral/tufted cell dendrite (M/Td). C1, C2. Sequential ultrathin sections of a biocytin-filled (large silver particles in C1) GCL-dSAC (MA799) bouton (b) in the GCL, forming a symmetrical synapse (black arrowhead) onto a granule cell dendrite (GCd). Both the biocytin-filled terminal and the postsynaptic dendrite contain small immunogold particles labeling GABA. The large silver particles are not visible in the sections A2, B2 and C2 because they were removed during the immunogold labeling procedure. Scale bars in all panels: 250 nm. dSAC: deep short-axon cell; GL, EPL, GCL: glomerular, external plexiform, granule cell layer, respectively.
VI.2.7. Functional characterization of the synaptic outputs of deep short-axon
cells
Our ultrastructural data suggest that dSACs are GABAergic and that they provide
synaptic inputs to local GABAergic interneurons. To functionally characterize the
output of dSACs, I carried out paired whole-cell recordings from presynaptic dSACs
and postsynaptic GCs. In 7 pairs, action potentials in the presynaptic dSACs induced
short-latency, fast rising, exponentially decaying inward currents in the postsynaptic
GCs (Figure 21).
The short latency of the responses (1.0±0.4 ms, coefficient of variation (CV) of the
latencies: 0.18±0.8, n=7) indicate the monosynaptic nature of the unitary IPSCs
(uIPSCs). These results offer functional evidence for our EM predictions that
GABAergic interneurons are the postsynaptic targets of dSACs. The specific GABAAR
antagonist SR95531 completely and reversibly blocked uIPSCs in all of the 6 pairs
tested (Figure 21), functionally validating our immunohistochemical results that dSACs
are GABAergic. The amplitude of the uIPSCs showed large within-cell (CV=1.5±0.8,
n=7) and between-cell (CV=1.7) variability. Unitary IPSCs with small amplitudes had
slow rise times (RT), indicating severe dendritic filtering and distal dendritic locations
of the synapses on the postsynaptic GC. When examining the kinetics of uIPSCs, I
restricted my analysis to uIPSCs with a 10-90% RT of < 0.55 ms. For the 4 pairs
meeting this criterion, the 10-90% RT was 0.42±0.1 ms and the weighted decay time
constant was 6.6±1.6 ms, which is 2.5-fold slower than that of mIPSCs recorded from
dSACs (2.6±0.6 ms, see Figure 17C). In two pairs, 1 µM zolpidem, a benzodiazepine
site agonist, prolonged the decay of uIPSCs.
62
Figure 21. Unitary postsynaptic responses between an EPL-dSAC and a granule cell are mediated by GABAA receptors. A. Neurolucida reconstruction of a presynaptic EPL-dSAC (soma, dendrites: black; axon: red) and its postsynaptic granule cell (blue; MA1050). Note the high axon density in the IPL and GCL. Inset demonstrates the positions of the potential contacts sites at a higher magnification. Scale bars: 50 m. B. Pairs of action potentials (50 Hz; 25 Hz in bottom panel) in the presynaptic dSAC (red traces) evoked fast rising (10-90% RT=0.33 ms) and exponential decaying (τw=6.1 ms) inward currents (individual traces: blue; averaged traces: light blue) in a granule cell (MA1050). The granule cell was held at -80 mV and was recorded with an intracellular solution containing high [Cl-], yielding an ECl~30mV. The unitary IPSCs displayed large amplitude variability (CV=1.1). The averaged postsynaptic response showed slight paired-pulse depression. Bath application of the specific GABAA receptor antagonist SR95531 (20 M) abolished the inward currents. This effect could be partially recovered following the wash-out of the drug (lower panels). Scales: voltage traces: 10 ms/20 mV; current traces: 10 ms/50 pA. EPL, MCL, IPL, GCL: external plexiform, mitral cell, internal plexiform and granule cell layer, respectively; dSAC: deep short axon cell; IPSC: inhibitory postsynaptic current. Next, I investigated the short-term plasticity of the postsynaptic responses. Two action
potentials in the presynaptic dSACs were evoked at 50 or 25Hz and their effects on
uIPSC amplitudes were analyzed. The short-term plasticity showed large variability;
63
some responses showed depression (Figure 21B), some facilitation and in one pair no
plasticity was observed (Figure 22B).
Figure 22. Unitary IPSCs between a GCL-dSAC (MA1066) and a granule cell are mediated by a single release site. A. Pairs (25 Hz) of presynaptic action potentials evoked postsynaptic responses with a very low probability when the [Ca2+]e was 1 mM. Under this low release probability (Pr) condition, the averaged postsynaptic response showed paired-pulse facilitation, which was accompanied by a corresponding decrease in the failure rate. B. When the [Ca2+]e was increased to 2 mM, the failure rate decreased and the mean postsynaptic responses increased. There was no paired-pulse depression or facilitation under this Pr condition and the failure rate was similar for both action potentials. C. Elevating the [Ca2+]e to 3 mM further decreased the failure rate and increased the mean postsynaptic response to the 1st action potential. Under this Pr condition, the mean postsynaptic response showed paired-pulse depression. Despite the 9-fold increase in the success rate from [Ca2+]e of 1 mM to 3 mM, the potency (amplitude of successes without failures) did not change (50.9±8.6 pA vs. 51.3±11.3 pA), indicating that the connection was mediated by a single functional release site. A-C. middle panels: 25 consecutive traces (black) and their superimposed averages (red); lower panels: all successful release events (black) within a 100 trial epoch and their superimposed averages (red). Scales: voltage traces: 10 ms/20 mV; current traces: 5 ms/10 pA
In this pair, however, changing the [Ca2+]e revealed short-term facilitation and
depression, and demonstrated that the plasticity depends on the initial release
64
probability (Pr). Changing the [Ca2+]e from 1 mM to 3 mM resulted in a 9-fold increase
in the success rate (from 0.05 to 0.45), but did not affect the mean postsynaptic response
amplitude excluding failures (potency at low Pr=50.9±8.6 pA; high Pr=51.3±11.3 pA;
Figure 22), demonstrating the presence of a single functional release site. At this site,
the Pr at 2 mM [Ca2+]e and 2 mM [Mg2+]e was 0.25 and the quantal size was 51 pA. The
variance in the peak current of the successful events was remarkably small (CV~0.2),
indicating high postsynaptic receptor occupancy.
For post hoc identification of the recorded cells, biocytin was included in the
intracellular solutions of both pre- and postsynaptic cells. In 6 out of the 7 pairs, the
presynaptic cell was successfully recovered, yielding 5 EPL-dSACs and one GCL-
dSAC (MA1066, electrophysiology shown in figure 22). In four cases, the postsynaptic
GC was also sufficiently filled for morphological identification. Unfortunately, the
postsynaptic GC of the pair shown in figure 22 did not recover, precluding the
anatomical determination of the number of synapses between the recorded cells. Figure
21A however, shows a Neurolucida reconstruction of a presynaptic EPL-dSAC and its
postsynaptic GC, and the positions and number of contact sites as determined at the
light microscopy level. The four putative synapses are consistent with the impression
that this connection is mediated by multiple functional release sites, as implicated from
the mean amplitude, its variability, failure rate and the largest uIPSC recorded from this
pair (Figure 21B).
Despite my repeated efforts I could not record GL-dSAC - PGC pairs, which is
extremely challenging due to the enormous number of potential PGC targets within the
area innervated by a single GL-dSAC. However, to provide a somewhat less direct
functional evidence for the deep to superficial GABAergic connection in the main
olfactory bulb, I carried out whole-cell recordings from PGCs and evoked IPSCs by
extracellular stimulation in the IPL. In the presence of ionotropic glutamate receptor
antagonists, extracellular stimulation in the IPL evoked short latency (1.9±0.5 ms)
inward currents of variable amplitudes (49.4±34.4 pA; Figure 23).
65
Figure 23. Internal plexiform layer stimulation-evoked IPSCs in a periglomerular cell. A. Schematic representation of the recording and stimulating configuration. B. The amplitude of the evoked IPSCs vs. the stimulus intensity plot shows that the responses appeared in an all-or-none manner, suggesting that the responses are mediated by a single fiber. C. Two stimuli at 50Hz evoked inward currents of variable amplitudes with short latencies. The mean postsynaptic response (light blue) showed paired-pulse depression. 20 M picrotoxin completely and reversibly blocked the inward currents, demonstrating that they were mediated by GABAA receptors. Black dots above the current traces indicate the timing of the stimuli. The stimulus artifacts have been digitally removed from the traces. eIPSC: evoked inhibitory postsynaptic current. Rec, Stim: recording and stimulating electrode, respectively.
The presence of glutamate receptor antagonists in the bath, the short and uniform
latencies, and the monotonous rise indicate the monosynaptic nature of these IPSCs.
The GABAA receptor blocker picrotoxin (20 M) completely and reversibly eliminated
the inward currents, providing a functional demonstration of a GABAA receptor-
mediated deep to superficial layer connection in the main olfactory bulb.
66
VI.2.8. Summary of the results and conclusions
In the second part of my work, employing a combined in vitro electrophysiological and
anatomical approach I made the following observations:
1. Provided evidence for the existence of 3 distinct dSAC subtypes in the main
olfactory bulb, which are the GL-, EPL and GCL-dSACs.
2. Demonstrated subtype-specific differences in their
- axo-somato-dendritic morphologies,
- expression of the GABAAR α1 subunit content,
- intrinsic electrical properties, and
- their postsynaptic target cells.
3. GL-dSACs establish a novel intrabulbar GABAergic connection from deep to
superficial layers, whereas
4. GCL-dSACs directly signal the activity of the main olfactory bulb to higher
olfactory areas.
5. All dSAC subtypes are GABAergic, and they
6. Selectively innervate GABAergic periglomerular and granule cells.
7. EPL- and GCL-dSACs innervate granule cells through the activation of α2 and
γ2 subunit-containing GABAARs.
67
VII. DISCUSSION
In the present work I utilized a toolbox of in vitro electrophysiological, anatomical and
statistical techniques to address how the heterogeneity in structural and functional
properties as well as synaptic connectivity of certain nerve cell populations in the rat
main olfactory bulb correlate with each other, by describing two nerve cell populations,
the external tufted and deep short-axon cells. The morphological analysis was carried
out by my long-standing collaborator Dr. Mark D. Eyre Ph.D.
VII.1. Correlation of functional and structural characteristics predicts two
subpopulations of external tufted cells.
In the first part of my work I demonstrated the presence of two subpopulations of
external tufted cells (ETCs) of the rat main olfactory bulb based on their active and
passive intrinsic electrical properties and their dendritic morphologies. Although 24 out
of the 30 measured parameters significantly differed between the two ETC
subpopulations, qualitatively the most prominent differences between them were the
presence and absence of basal dendrites and the lack and presence of action potential
bursting, respectively. Although our quantitative analysis indicated the existence of
only two ETC subpopulations, a large heterogeneity in both physiological and
morphological properties within each subpopulation was apparent. I propose that the
two ETC populations serve very different roles in the main olfactory bulb circuit, and
the within-group heterogeneity is the reflection of further specialization evolved to
fulfill less prominent functional requirements.
VII.1.1. Our results are in agreement with classical morphological studies.
The morphological heterogeneity of ETCs has long been described and the existence of
3 subtypes has been proposed. The first detailed investigation of the dendritic
arborizations of ETCs was carried out by Macrides and Schneider (1982) using the
Golgi impregnation technique. They concluded that ETCs are comprised of 3
subpopulations; the first group of ETCs lack secondary dendrites; ETCs in the second
group have extensively branched, spatially restricted secondary dendrites, and the third
group have sparsely branched secondary dendrites, which extend tangentially in one
68
direction from the soma. Our morphological results are in perfect agreement with the
presence of these morphological features, tempting the division of ETCs into these 3
categories. However, unsupervised cluster analysis revealed only two subpopulations
of ETCs; differences between ETCs with extensively or sparsely branched secondary
dendrites were not significant. Macrides and Schneider (1982) have also suggested that
ETCs that lack secondary dendrites have a larger glomerular arbor than those with
secondary dendrites. Their conclusion was based on the measured area of the two-
dimensional projection of the apical dendrites. The results of our quantitative analysis
are in disagreement with their conclusion, because detailed three-dimensional
measurements of the total dendritic length, the number of segments and the largest
extent (sholl max) of the dendrites in the glomerular layer have revealed significantly
smaller values for cells in cluster 1 (without basal dendrites) than in cluster 2.
Differences in basal dendrites and in the sizes of their glomerular dendritic arbors might
impart different functional characteristics to the two ETC subpopulations.
VII.1.2. The molecular heterogeneity of external tufted cells
External tufted cells are not only heterogeneous based on their dendritic and axonal
distributions, but they express distinct sets of ion channels. The ionotropic GABAA
receptor 1 and 3 subunits are differentially expressed by ETCs (Panzanelli et al.,
2005). Some cells express only the 1, some others only the 3 and approximately 40%
of the cells contain both of these subunits. Interestingly, ETCs with secondary
dendrites predominantly express the 3 subunit, resulting in a strongly immunoreactive
dendritic plexus in the outer one third of the external plexiform layer (EPL). A previous
report from my supervisor, Dr. Zoltan Nusser’s laboratory also described that ETCs are
heterogeneous with respect to their expression of the hyperpolarization activated and
cyclic nucleotide-gated mixed cation channel 1 (HCN1; (Holderith et al., 2003)). Most
of the HCN1 immunopositive ETCs do not seem to have basal dendrites, and are likely
to belong to cluster 1.
69
VII.1.3. Basal dendrites – morphological predictors of bursting behavior in
external tufted cells?
In a recent study, Hayar et al. (2004a) have investigated the morphological and
electrophysiological properties of ETCs. Several of our findings are in perfect
agreement, including 1) approximately one third of the ETCs possess basal dendrites; 2)
basal dendrites show variable ramification patterns; 3) the apical tuft of most ETCs
arborizes in a single glomerulus, but a few percent of the ETCs project their apical
dendrites into two glomeruli; 4) the extent of the intra-glomerular arborization of the
apical dendrites varies considerably (5-fold) from small fan-like tufts to extensive
globular tufts; 5) some cells project their axons towards the mitral cell and granule cell
layer without extensive ramification; 6) whereas some other ETCs had extensive local
axon collaterals. Interestingly, despite the observed morphological heterogeneity of
ETCs, Hayar et al. (2004a) described rather uniform electrophysiological properties of
the ETCs. Most notably, they reported only burst firing behaviors irrespective of
whether spontaneous activity was monitored in cell-attached mode or firing was evoked
by current injections in the whole-cell configuration. Because they reported that one
third of their recorded cells had basal dendrites, but all cells showed bursting behavior,
it may be appropriate to designate cells with basal dendrites as also possessing bursting
behavior. This is in contrast with my results demonstrating that the majority of cells in
cluster 2 (which all have basal dendrites) did not fire bursts of action potentials (APs).
This conclusion is consistent with the results of my cell-attached recordings,
demonstrating that the majority of the cells with basal dendrites lack spontaneous
bursting, and thus the differences cannot be the consequence of dialysis of the cells
during whole-cell recordings. A possible reason for this discrepancy could be due to a
sub-selection of ETCs recorded by Hayar et al. (2004a). As discussed above, I have
taken utmost care to avoid any bias in my sampling of juxtaglomerular cells with
diameter >10 m. Another possible reason could be the different strain and age of the
animals (Hayar: P21-P29 Sprague Dawley vs. our study: P26-P78 Wistar). Some of the
morphological features of cluster 2 cells are similar to some of the superficially located
middle tufted cells (Macrides and Schneider, 1982), or as another study calls them
‘superficial‘ tufted cells (Hamilton et al., 2005). However, one obvious difference
between these cells and the ETCs in our study is that the somata of these cells are
70
located in the EPL, whereas all cells of our study were in a juxtaglomerular position.
Despite the different names, their functional roles could be very similar in olfactory
processing. It is interesting to note that Hamilton et al. (2005) have described both
bursting and non-bursting firing properties for ‘superficial’ tufted cells, whereas in my
work, only a single cell in cluster 2 showed bursting behavior; the rest displayed regular
or irregular-accommodating firing patterns.
VII.1.4. What could be the major functional differences between the two types of
external tufted cells?
As already discussed by Macrides and Schneider (1982), the main difference between
ETCs with and without basal dendrites is their potential innervation and lack of
innervation by granule cells, respectively. External tufted cells without secondary
dendrites (cluster 1 in our work) are likely to receive GABAergic inputs only from
periglomerular and short-axon cells onto their apical tufts. These cells could still
receive feed-forward and feed-back inhibition, and could also sense the activity of some
neighboring glomeruli. However, ETCs with extensive secondary dendrites will also
integrate feed-back GABAergic inputs from granule cells and sample the neuronal
activity from a much larger area of the bulb. Our results also revealed that these cells
have significantly larger glomerular dendritic trees. If the two types of ETCs have
similar synaptic densities per unit dendritic length, this would predict a more robust
sensory innervation of ETCs with secondary dendrites. Our qualitative observation that
ETCs with basal dendrites possess a much larger and more extensively ramifying local
axonal arbor predicts an additional functional difference between the two types of
ETCs. In summary, ETCs in cluster 2 are predicted to receive much more sensory
input, form connections with a higher number of cells in the glomerular layer (GL) and
EPL and sample the network activity through interacting with granule cells from a much
larger area of the bulb. It has also been suggested that a different ETC populations may
be responsible for the commissural innervation of the contralateral main olfactory bulb
through the anterior olfactory nucleus pars externa and for the latero-medial intrabulbar
associational connection on the opposite side of the same bulb (Schoenfeld et al., 1985).
These pathways allow communication among principal cells via granule cells,
suggesting a key role for ETCs in processing olfactory sensory information. Whether
71
the two ETC subpopulations are responsible for this functional difference or whether
cells within each subgroup participate in both commissural and associational projections
remains to be determined. However, these authors also noted that most if not all ETCs
in the superficial two-thirds of the GL have neither intrabulbar nor bulbofugal axonal
projections. Interestingly, I found that most cells lacking basal dendrites (cluster 1)
were recorded from such locations.
VII.1.5. Subthreshold resonance properties show correlation with structural
attributes.
Another important feature of the ETCs with bursting firing pattern is that they show
different subthreshold resonant behaviors than cells with basal dendrites. A larger
proportion of the bursting cells have active resonance at the theta frequency range. In
addition, a very significant proportion of these cells are spontaneously active at the theta
frequency range even in in vitro slices, indicating that their activity could be associated
with the theta rhythm (Adrian, 1950; Freeman, 1975; Laurent and Davidowitz, 1994).
ETCs with basal dendrites have an intrinsic resonant frequency below 1 Hz, a frequency
range which is below the frequency of local field potential oscillations observed in vivo
(Adrian, 1950; Freeman, 1975; Laurent and Davidowitz, 1994). Thus, I predict that
these ETCs may not participate in the theta frequency oscillation. Whether they are
entrained to gamma frequency oscillations like mitral and middle/internal tufted cells
(Desmaisons et al., 1999) or do not fire rhythmically at all, remains to be determined.
VII.2. Novel intra- and extrabulbar GABAergic connections in the main olfactory
bulb are provided by distinct subtypes of deep short-axon cells.
In the second part of my dissertation, I provided evidence for the existence of 3 distinct
deep short-axon cell subtypes in the main olfactory bulb, which are the glomerular layer