Functional Coe ffi cient Estimation with Both Categorical and Continuous Data ∗ Liangjun Su, a Ye Chen, b Aman Ullah c a School of Economics, Singapore Management University, Singapore b Department of Economics, Princeton University, NJ, USA c Department of Economics, University of California at Riverside, CA, USA July, 2008 Abstract We propose a local linear functional coefficient estimator that admits a mix of discrete and contin- uous data for stationary time series. Under weak conditions our estimator is asymptotically normally distributed. A small set of simulation studies is carried out to illustrate the finite sample performance of our estimator. As an application, we estimate a wage determination function that explicitly allows the return to education to depend on other variables. We find evidence of the complex interacting patterns among the regressors in the wage equation, such as increasing returns to education when experience is very low, high return to education for workers with several years of experience, and diminishing returns to education when experience is high. Compared with the commonly used para- metric and semi-parametric methods, our estimator performs better in both goodness-of-fit and in yielding economically interesting interpretation. Key words: Discrete variables, Functional coefficient estimation, Local linear estimation, Cross- validation. JEL Classification: C13, C14. ∗ We thank Zongwu Cai for his helpful comment on an early version of this paper. Correspondence: Liangjun Su, School of Economics, Singapore Management University, 90 Stamford Road, Singapore, 178903 (E-mail: [email protected]), Phone: +65 6828- 0386. Ye Chen, Departement of Economics, Princeton University, Princeton, NJ 08544-1021 (E-mail: [email protected]). Aman Ullah, Department of Economics, UCR, Riverside, CA 92521- 0427 (E-mail: [email protected]; Phone: 951-827-1591). The first author gratefully acknowledges financial support from the NSFC (Project 70501001 and 70601001). The third author gratefully acknowledges the financial support from the Academic Senate, UCR.
Transcript
Functional Coefficient Estimation with Both Categorical and
Continuous Data∗
Liangjun Su,a Ye Chen,b Aman Ullahc
aSchool of Economics, Singapore Management University, SingaporebDepartment of Economics, Princeton University, NJ, USA
cDepartment of Economics, University of California at Riverside, CA, USA
July, 2008
Abstract
We propose a local linear functional coefficient estimator that admits a mix of discrete and contin-
uous data for stationary time series. Under weak conditions our estimator is asymptotically normally
distributed. A small set of simulation studies is carried out to illustrate the finite sample performance
of our estimator. As an application, we estimate a wage determination function that explicitly allows
the return to education to depend on other variables. We find evidence of the complex interacting
patterns among the regressors in the wage equation, such as increasing returns to education when
experience is very low, high return to education for workers with several years of experience, and
diminishing returns to education when experience is high. Compared with the commonly used para-
metric and semi-parametric methods, our estimator performs better in both goodness-of-fit and in
yielding economically interesting interpretation.
Key words: Discrete variables, Functional coefficient estimation, Local linear estimation, Cross-
validation.
JEL Classification: C13, C14.
∗We thank Zongwu Cai for his helpful comment on an early version of this paper. Correspondence: Liangjun
Su, School of Economics, Singapore Management University, 90 Stamford Road, Singapore, 178903 (E-mail:
[email protected]), Phone: +65 6828- 0386. Ye Chen, Departement of Economics, Princeton University, Princeton,
NJ 08544-1021 (E-mail: [email protected]). Aman Ullah, Department of Economics, UCR, Riverside, CA 92521-
0427 (E-mail: [email protected]; Phone: 951-827-1591). The first author gratefully acknowledges financial support
from the NSFC (Project 70501001 and 70601001). The third author gratefully acknowledges the financial support from
the Academic Senate, UCR.
1 Introduction
In this paper we extend the work of Racine and Li (2004) to estimating functional coefficient models
with both continuous and categorical data:
Y =dX
j=1
aj (U)Xj + ε, (1.1)
where ε is the disturbance term, Xj is a scalar random variable, U is a (p+ q) × 1 random vector,
and aj (.) , j = 1, ..., d, are unknown smooth functions. As Cai, Fan and Yao (2000) remark, the
idea for this kind of model is not new, but the potential of this modeling techniques had not been
fully explored until the seminal work of Cleveland et al. (1992), Chen and Tsay (1993), and Hastie
and Tibshirani (1993), in which nonparametric techniques were proposed to estimate the unknown
functions aj (.) . An important feature of these early works is to assume that the random variable U
is continuous, which limits the model’s potential applications.
Drawing upon the work of Aitchison and Aitken (1976), Racine and Li (2004) propose a novel
approach to estimate nonparametric regression mean functions with both categorical and continuous
data in the iid setup. They apply their new estimation method to some publicly available data and
demonstrate the superb performance of their estimators in comparison with some traditional ones.
In this paper, we consider extending the work of Racine and Li (2004) to the estimation of the
functional coefficient model (1.1) when U contains both continuous and categorical variables. This
is important since categorical variables may be present in the functional coefficients. For example,
in the study of the output functions for individual firms, firms that belong to different industries
may exhibit different output elasticities with respect to labor and capital. So we should allow the
categorical variable ‘industry’ to enter U.We will demonstrate that this modelling strategy outperforms
the traditional dummy-variable approach widely used in the literature.
Another distinguishing feature of our approach is that we allow for weak data dependence. One of
the key applications of nonparametric function estimation is the construction of prediction intervals
for stationary time series. The iid setup of Racine and Li (2004) cannot meet this purpose.
To demonstrate the usefulness of our proposed estimator in empirical applications, we estimate a
wage determination equation based on recent CPS data. While in the literature of labor economics,
the return to education has already been extensively investigated from various aspects, in this paper,
we explicitly allow the return to education to be dependent on other variables, both continuous and
discrete, including experience, gender, age, industry and so forth. Our findings are clearly against the
parametric functional form assumption of the most widely used linear separable Mincerian equation,
and the return to education does vary substantially with the other regressors. Therefore, our model
can help to uncover economically interesting interacting effects among the regressors, and so should
have high potential for applications.
The paper is structured as follows. In Section 2 we introduce our functional coefficient estimators
and their asymptotic properties. We conduct a small set of Monte Carlo studies to check the relative
performance of the proposed estimator in Section 3. Section 4 provides empirical data analysis. Final
1
remarks are contained in Section 5. All technical details are relegated to the Appendix.
2 Functional Coefficient Estimation with Mixed Data
2.1 Local linear estimator
In this paper, we study estimation of model (1.1) when U is comprised of a mix of discrete and
continuous variables. Let (Yi,Xi, Ui) , i = 1, 2, ..., be jointly strictly stationary processes, where(Yi,Xi, Ui) has the same distribution as (Y,X,U) . Let Ui =
¡U ci , U
di
¢, where Uc
i and Udi denote a
p×1 vector of continuous regressors and a q×1 vector of discrete regressors, respectively. Like Racineand Li (2004), we will use Ud
it to denote the tth component of Udi , and assume that U
dit can take ct ≥ 2
different values, i.e., Udit ∈ 0, 1, ..., ct − 1 for t = 1, ..., q. Denote u =
¡uc, ud
¢∈ Rp × Rq. We use
fu (u) = f¡uc, ud
¢to denote the joint density function of
¡Uci , U
di
¢and D =Πqt=1 0, 1, ..., ct − 1 to
denote the range assumed by Udi .With a little abuse of notation, we also use (Yi,Xi, Ui) , i = 1, ..., n
to denote the data.
To define the kernel weight function, we focus on the case for which there is no natural ordering
in Udi . Define
l¡Udit, u
dt , λt
¢=
(1 if Ud
it = udt ,
λt if Udit 6= udt ,
(2.1)
where λt is a bandwidth that lies on the interval [0, 1]. Clearly, when λt = 0, l¡Udit, u
dt , 0¢becomes
an indicator function, and λt = 1, l¡Udit, u
dt , 1¢becomes an uniform weight function. We define the
product kernel for the discrete random variables by
L¡Udi , u
d, λ¢=
qYt=1
l¡Udit, u
dt , λt
¢. (2.2)
For the continuous random variables, we use w (.) to denote a univariate kernel function and
define the product kernel function by Wh,iu = Πpt=1w ((U
cit − uct) /ht) , where h = (h1, ..., hp) denotes
the smoothing parameters and Ucit (u
ct) is the tth component of U
ci (u
c). We then define the kernel
weight function Kiu by
Kiu = Lλ,iuWh,iu (2.3)
where Lλ,iu = L¡Udi , u
d, λ¢.
We now estimate the unknown functional coefficient functions in model (1.1) by using a local
linear regression technique. Suppose that aj (.) assumes a second order derivative. Denote by.aj (u) =
∂aj (u) /∂uc the p × 1 first order derivative of aj (u) with respect to its continuous-valued argument
uc. Denote by..aj (u) = ∂2aj (u) / (∂u
c∂uc0) the p × p second order derivative matrix of aj (u) with
respect to uc. We use aj,ss (u) to denote the sth diagonal element of..aj (u) .
For any given u and eu in a neighborhood of u, it follows from a first order Taylor expansion that
Letn(baj ,bbj)o be the local linear estimator. Then the local linear regression estimator for the func-
tional coefficient is given by baj (u) = baj , j = 1, ..., d. (2.6)
The local linear regression estimator for the functional coefficient can be easily obtained. To do
so, let ej,d(p+1) be the d (1 + p)× 1 unit vector of with 1 at the jth position and 0 elsewhere. Let eXdenote an n× d (1 + p) matrix with
eXi =¡X 0i,X
0i ⊗ (Ui − u)0
¢as its ith row. Let Y = (Y1, ..., Yn)
0 . SetW =diagK1u, ...,Knu . Then (2.5) can be written as³Y−eXθ
´0W³Y−eXθ´ ,
where θ = (a1, ..., ad, b01, ...., b0d)0. So the local linear estimator is simply
bθ = ³eX0WeX´−1 eX0WY, (2.7)
which entails that baj (u) = baj = e0j,d(1+p)bθ, j = 1, ..., d. (2.8)
We will study the asymptotic properties of bθ.2.2 Assumptions
To facilitate the presentation, let Ω (u) = E³XiX
0
i |Ui = u´, σ2 (u, x) = E
£ε2i |Ui = u,Xi = x
¤,
Ω∗ (u) = E£XiX
0iσ2 (Ui,Xi) |Ui = u
¤. Let f (u, x)denote the joint density of (Ui,Xi) and fu (u) be
the marginal density of Ui. Also, let fu|x (u|x) be the conditional density of Ui given Xi = x. Let
fi (u, eu|x, ex) be the conditional density of (U1, Ui) given (X1,Xi) = (x, ex) .We now list the assumptions that will be used to establish the asymptotic distribution of our
estimator.
AssumptionA1. (i) The process (Yi, Ui,Xi), i ≥ 1 is a strictly stationary α-mixing process with coefficients
α (n) satisfyingP
j≥1 jc [α (j)]
γ/(2+γ)<∞ for some γ > 0 and c > γ/ (2 + γ) .
(ii) fu|x (u|x) ≤M <∞ and fi (u, eu|x, ex) ≤M <∞ for all i ≥ 2 and u, eu, x, ex.(iii) Ω∗ (u) and Ω (u) are positive definite.
(iv) The functions fu¡·, ud
¢, σ2
¡·, ud, x
¢, Ω
¡·, ud
¢, and Ω∗
¡·, ud
¢are continuous for all ud ∈ D,
and fu (u) > 0.
3
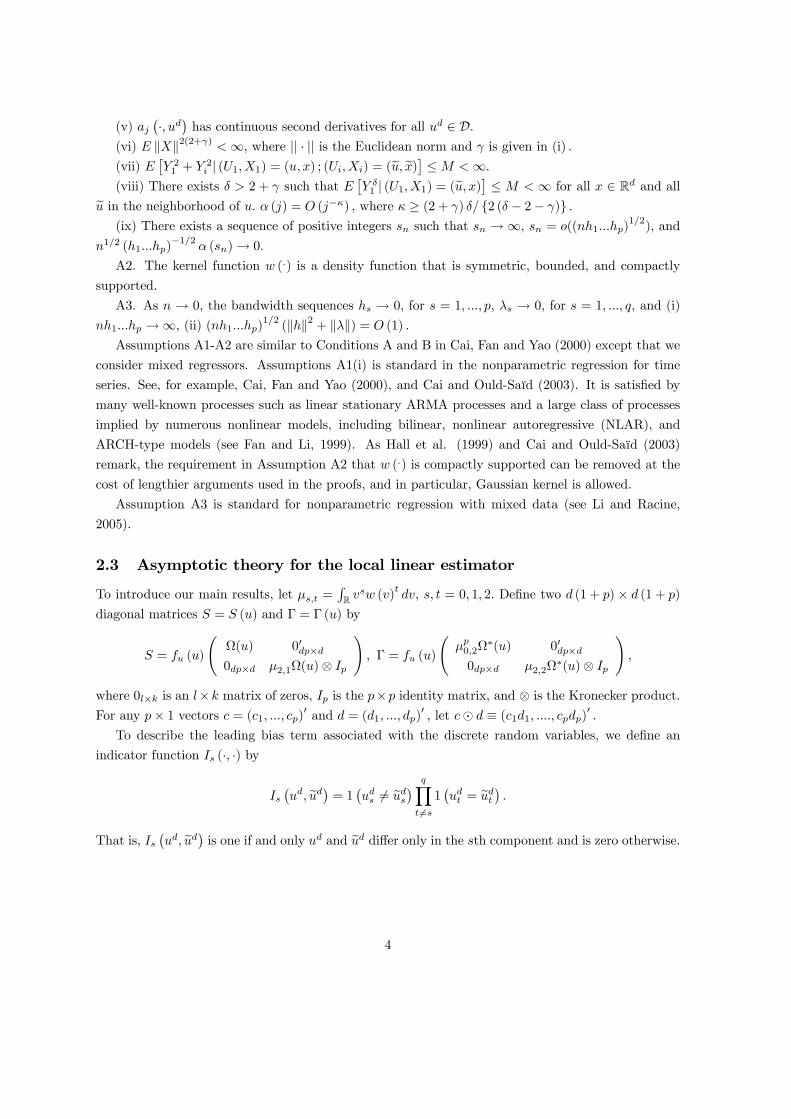
(v) aj¡·, ud
¢has continuous second derivatives for all ud ∈ D.
(vi) E kXk2(2+γ) <∞, where || · || is the Euclidean norm and γ is given in (i) .
(vii) E£Y 21 + Y 2
i | (U1,X1) = (u, x) ; (Ui,Xi) = (eu, ex)¤ ≤M <∞.
(viii) There exists δ > 2 + γ such that E£Y δ1 | (U1,X1) = (eu, x)¤ ≤ M < ∞ for all x ∈ Rd and alleu in the neighborhood of u. α (j) = O (j−κ) , where κ ≥ (2 + γ) δ/ 2 (δ − 2− γ) .
(ix) There exists a sequence of positive integers sn such that sn →∞, sn = o((nh1...hp)1/2), and
n1/2 (h1...hp)−1/2
α (sn)→ 0.
A2. The kernel function w (.) is a density function that is symmetric, bounded, and compactly
supported.
A3. As n → 0, the bandwidth sequences hs → 0, for s = 1, ..., p, λs → 0, for s = 1, ..., q, and (i)
nh1...hp →∞, (ii) (nh1...hp)1/2 (khk2 + kλk) = O (1) .
Assumptions A1-A2 are similar to Conditions A and B in Cai, Fan and Yao (2000) except that we
consider mixed regressors. Assumptions A1(i) is standard in the nonparametric regression for time
series. See, for example, Cai, Fan and Yao (2000), and Cai and Ould-Saïd (2003). It is satisfied by
many well-known processes such as linear stationary ARMA processes and a large class of processes
implied by numerous nonlinear models, including bilinear, nonlinear autoregressive (NLAR), and
ARCH-type models (see Fan and Li, 1999). As Hall et al. (1999) and Cai and Ould-Saïd (2003)
remark, the requirement in Assumption A2 that w (.) is compactly supported can be removed at the
cost of lengthier arguments used in the proofs, and in particular, Gaussian kernel is allowed.
Assumption A3 is standard for nonparametric regression with mixed data (see Li and Racine,
2005).
2.3 Asymptotic theory for the local linear estimator
To introduce our main results, let μs,t =RR v
sw (v)tdv, s, t = 0, 1, 2. Define two d (1 + p) × d (1 + p)
diagonal matrices S = S (u) and Γ = Γ (u) by
S = fu (u)
ÃΩ(u) 00dp×d0dp×d μ2,1Ω(u)⊗ Ip
!, Γ = fu (u)
Ãμp0,2Ω
∗(u) 00dp×d0dp×d μ2,2Ω
∗(u)⊗ Ip
!,
where 0l×k is an l×k matrix of zeros, Ip is the p×p identity matrix, and ⊗ is the Kronecker product.For any p× 1 vectors c = (c1, ..., cp)0 and d = (d1, ..., dp)
0 , let c¯ d ≡ (c1d1, ...., cpdp)0 .To describe the leading bias term associated with the discrete random variables, we define an
indicator function Is (·, ·) by
Is¡ud, eud¢ = 1 ¡uds 6= euds¢ qY
t6=s1¡udt = eudt ¢ .
That is, Is¡ud, eud¢ is one if and only ud and eud differ only in the sth component and is zero otherwise.
4
Let
b (h, λ) = H
(Ã12μ2,1fu (u)Ω (u)A
0dp×1
!
+
qXs=1
λsIs¡ud, eud¢ fu ¡uc, eud¢Ã Ω ¡uc, eud¢ ¡a ¡uc, eud¢− a (u)¢−μ2,1
¡Ω¡uc, eud¢⊗ Ip
¢b (u)
!), (2.9)
where H =pnh1...hp, A = (
Pps=1 h
2sa1,ss (u) , ...,
Pps=1 h
2sad,ss (u))
0, a (u) = (a1 (u) , ...., ad (u))0, and
b (u) =¡ .a1 (u)
0, ....,
.ad (u)
0¢0. Define Bj,1s (u) =¡μ2,1/2
¢aj,ss (u) and
Bj,2s (u) = μ2fu (u)−1
⎧⎨⎩Xud∈D
Is¡ud, eud¢ f ¡uc, eud¢ ¡aj ¡uc, eud¢− aj (u)
¢⎫⎬⎭ .
Now we state our main theorem.
Theorem 2.1 Assume that Assumptions A1-A3 hold. Then
HH1
³bθ − θ´− S−1b (h, λ)
d→ N¡0, S−1ΓS−1
¢.
where H1 =diag(1, ..., 1, h0, ..., h0) is a d (p+ 1)× 1 diagonal matrix with d diagonal elements of 1 andd diagonal elements of h. In particular, for j = 1, ..., d,
pnh1...hp
Ãbaj − aj (u)−pX
s=1
h2sBj,1s (u)−qX
s=1
λsBj,2s (u)
!d→ N
Ã0,
μp0,2e0
j,dΩ−1 (u)Ω∗ (u)Ω−1 (u) ej,d
fu (u)
!.
Remark. Noting that S and Γ are both block diagonal matrices, we have asymptotic independencebetween the estimator for a (u) and that for b (u) . Under Assumption A3, the asymptotic bias of bajis comprised of two components,
Pps=1 h
2sBj,1s (u) and
Pqs=1 λsBj,2s (u) , which are associated with
the continuous and discrete variables, respectively.
2.4 Selection of smoothing parameters
In this subsection we focus on how to choose the smoothing parameters for baj . It is well known thatthe choice of smoothing parameters is crucial in nonparametric kernel estimation.
Theorem 2.1 implies that the leading term for the mean squared error (MSE) of baj isMSE (baj) = " pX
s=1
h2sBj,1s (u) +
qXs=1
λsBj,2s (u)
#2+
1
nh1...hp
μp0,2e0
j,dΩ−1 (u)Ω∗ (u)Ω−1 (u) ej,d
fu (u).
By symmetry, all hj should have the same order and all λs should also have the same order but with
λj ˜ h2j . By an argument similar to Li and Racine (2005), it is easy to obtain the optimal rate of
5
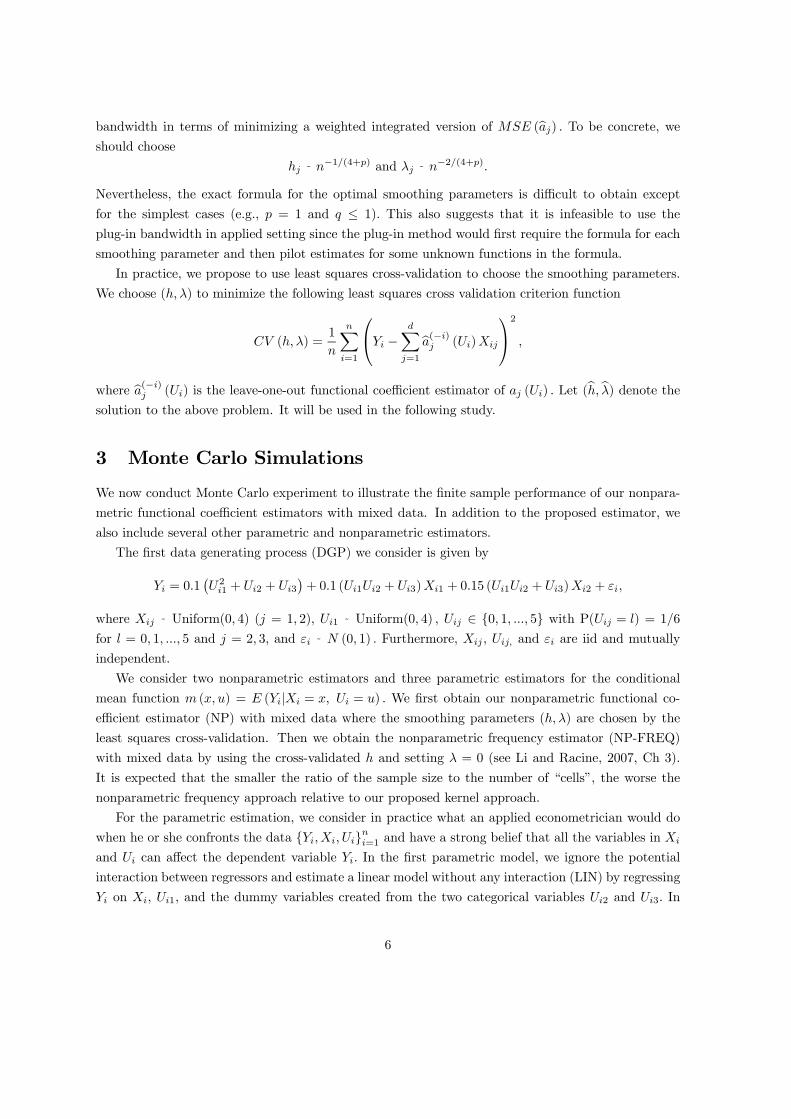
bandwidth in terms of minimizing a weighted integrated version of MSE (baj) . To be concrete, weshould choose
hj ˜ n−1/(4+p) and λj ˜ n
−2/(4+p).
Nevertheless, the exact formula for the optimal smoothing parameters is difficult to obtain except
for the simplest cases (e.g., p = 1 and q ≤ 1). This also suggests that it is infeasible to use the
plug-in bandwidth in applied setting since the plug-in method would first require the formula for each
smoothing parameter and then pilot estimates for some unknown functions in the formula.
In practice, we propose to use least squares cross-validation to choose the smoothing parameters.
We choose (h, λ) to minimize the following least squares cross validation criterion function
CV (h, λ) =1
n
nXi=1
⎛⎝Yi −dX
j=1
ba(−i)j (Ui)Xij
⎞⎠2
,
where ba(−i)j (Ui) is the leave-one-out functional coefficient estimator of aj (Ui) . Let (bh, bλ) denote thesolution to the above problem. It will be used in the following study.
3 Monte Carlo Simulations
We now conduct Monte Carlo experiment to illustrate the finite sample performance of our nonpara-
metric functional coefficient estimators with mixed data. In addition to the proposed estimator, we
also include several other parametric and nonparametric estimators.
The first data generating process (DGP) we consider is given by
Note: 1) Heteroskedasticity-robust standard errors in parentheses.
2) a, b and c stand for 1%, 5% and 10% significant levels, respectively.
3) 3 region indicators, 9 industry indicators and a constant in all specifications.
4) The estimate of m(Schooling,Experience) is plotted in Figure 1.
In all the above specifications, we use dummy variables to allow different intercepts for different
regions and industries, and the majority of them have a significant estimated coefficient. The large
number of categories makes it difficult to study their interaction effects with other regressors. In
contrast, in the nonparametric framework of mixed regressors, only one categorical variable is necessary
to describe such characteristic as industry or location. And this advantage has made our proposed
model further suitable for the application.
For a comprehensive presentation of the regression results of model (4.2), we plot the wage-
experience profiles of different cells defined by a discrete characteristic averaged over other cate-
gorical covariates. We use the second order Epanechnikov kernel in our nonparametric estimation:
w (v) = 34
¡1− v2
¢1 (|v| ≤ 1) , and choose the bandwidth by the least-squares cross-validation. The
R20s of the model have been increased up to 0.66, 0.65, 0.62, 0.68, respectively for the four years.
Figure 2 reports the estimated a1(Experience, Region, :) and a2(Experience, Region, :) of model
(4.2) for different regions averaged across all other categorical variables. a1(Experience, Region, :)
can be viewed as the direct effects of experience on wage for the particular region (averaged across all
other categorical variables), and a2(Experience, Region, :) represents the marginal return to schooling
as a function of experience for the particular region. We summarize some interesting findings from
figure 2. First, while there are considerable variations between regions, we find the direct effects
of experience on wage are usually positive (upward sloping) but not necessarily concave, whichis in sharp contrast with the results of the parametric model. Notably, the experience-wage profile
estimated here are from cross-sections and cannot be taken as individuals life-cycle earning trend.
Second, if the standard Mincer equation holds, we expect the estimated a2(Experience, Region, :)
to be a horizontal line. But clearly, this is far from reality. The effects of experience on return to
schooling are mainly negative, which agrees with our previous results from the parametric setting,
presented in Table 4. The findings here have interesting econometric interpretation. On the one hand,
12
we may wonder if higher education causes higher return to seniority, or similarly, longer experience
leads to higher return to education. On the other hand, it is possible that the young cohorts (implied
by shorter experience) have higher return to education, due to cohort supply effects, technological
changes or some other reasons. And we need to resort to empirical results to evaluate the overall
influence. In the sample studied here, the later force has been found to dominate the former in their
direction of impacts. Admittedly, the interacting patterns of the regressors in the wage equation
uncovered by this functional coefficient model require further careful investigation.
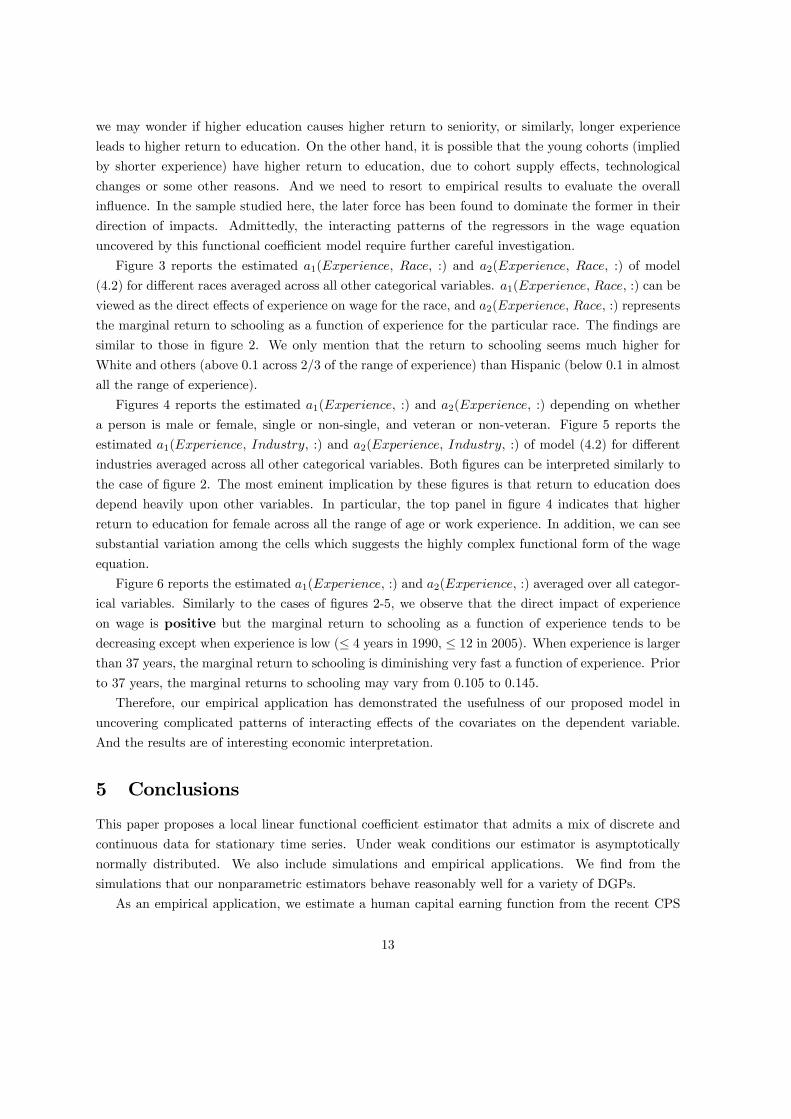
Figure 3 reports the estimated a1(Experience, Race, :) and a2(Experience, Race, :) of model
(4.2) for different races averaged across all other categorical variables. a1(Experience, Race, :) can be
viewed as the direct effects of experience on wage for the race, and a2(Experience, Race, :) represents
the marginal return to schooling as a function of experience for the particular race. The findings are
similar to those in figure 2. We only mention that the return to schooling seems much higher for
White and others (above 0.1 across 2/3 of the range of experience) than Hispanic (below 0.1 in almost
all the range of experience).
Figures 4 reports the estimated a1(Experience, :) and a2(Experience, :) depending on whether
a person is male or female, single or non-single, and veteran or non-veteran. Figure 5 reports the
estimated a1(Experience, Industry, :) and a2(Experience, Industry, :) of model (4.2) for different
industries averaged across all other categorical variables. Both figures can be interpreted similarly to
the case of figure 2. The most eminent implication by these figures is that return to education does
depend heavily upon other variables. In particular, the top panel in figure 4 indicates that higher
return to education for female across all the range of age or work experience. In addition, we can see
substantial variation among the cells which suggests the highly complex functional form of the wage
equation.
Figure 6 reports the estimated a1(Experience, :) and a2(Experience, :) averaged over all categor-
ical variables. Similarly to the cases of figures 2-5, we observe that the direct impact of experience
on wage is positive but the marginal return to schooling as a function of experience tends to bedecreasing except when experience is low (≤ 4 years in 1990, ≤ 12 in 2005). When experience is largerthan 37 years, the marginal return to schooling is diminishing very fast a function of experience. Prior
to 37 years, the marginal returns to schooling may vary from 0.105 to 0.145.
Therefore, our empirical application has demonstrated the usefulness of our proposed model in
uncovering complicated patterns of interacting effects of the covariates on the dependent variable.
And the results are of interesting economic interpretation.
5 Conclusions
This paper proposes a local linear functional coefficient estimator that admits a mix of discrete and
continuous data for stationary time series. Under weak conditions our estimator is asymptotically
normally distributed. We also include simulations and empirical applications. We find from the
simulations that our nonparametric estimators behave reasonably well for a variety of DGPs.
As an empirical application, we estimate a human capital earning function from the recent CPS
13
data. Unlike the widely used linear separable model, or the frequency approach that conducts esti-
mation in splitted samples, the proposed model enables us to utilize the entire dataset and allows
the return to education to vary with the other categorical and continuous variables. The empirical
findings show considerable interacting effects among the regressors in the wage equation. For in-
stance, the younger cohorts are found to have higher return to education. While these patterns need
further explanation from labor economic theory, the application demonstrates the usefulness of our
proposed functional coefficient model due to its flexibility and clear economic interpretation. And
thus the model has good potential for applied research. Our future research will address some related
problems such as the optimal selection of smoothing parameters. Another extensions is to study the
estimation of functional coefficient model with both endogeneity and mixed regressors.
6 Appendix: Proof of Theorem 2.1
We use k·k to denote the Euclidean norm of ·, C to signify a generic constant whose exact value may
vary from case to case, and a0 to denote the transpose of a. Let duiu =Pq
t=1 1¡Udit 6= udt
¢, where
1¡Udit 6= udt
¢is an indicator function that takes value 1 if Ud
it 6= udt and 0 otherwise. So duiu indicates
the number of disagreeing components between Udit and udt .
We first define some notation. For any p × 1 vectors c = (c1, ..., cp)0 and d = (d1, ..., dp)
0 , let
c¯ d = (c1d1, ...., cpdp)0 and c/d = (c1/d1, ...., cp/dp)
0 whenever applicable. Let
Sn = Sn(u) =
ÃSn,0 Sn,1
S0n,1 Sn,2
!, Tn = Tn(u) = Tn,1 + Tn,2,
with
Sn,0 = Sn,0 (u) = n−1nXi=1
XiX0
iKiu,
Sn,1 = Sn,1 (u) = n−1nXi=1
³XiX
0
i
´⊗ ((Uc
i − uc) /h)0Kiu,
Sn,2 = Sn,2 (u) = n−1nXi=1
³XiX
0
i
´⊗¡((Uc
i − uc) /h) ((Uci − uc) /h)
0¢Kiu,
Tn,1 = Tn,1 (u) = n−1nXi=1
ÃXiεi
(Xiεi)⊗ ((Uci − uc) /h)
!Kiu, and
Tn,2 = Tn,2 (u) = n−1nXi=1
Ã(XiX
0ia (Ui))
(XiX0ia (Ui))⊗ ((Uc
i − uc) /h)
!Kiu,
where recall a (Ui) = (a1 (Ui) , ..., ad (Ui))0 . Then
bθ = H−11 S−1n Tn,
where H1 =diag(1, ..., 1, h0, ..., h0) is a d (p+ 1) × d (p+ 1) diagonal matrix with d diagonal elements
14
of 1 and d diagonal elements of h. Let H =pnh1...hp. Then
HH1
³bθ − θ´
= HS−1n (Tn − Snθ)
= HS−1n Tn,1 +HS−1n (Tn,2 − Snθ) .
We first prove several lemmas.
Lemma 6.1 (a) Sn,0 = Ω (u) fu (u) + op (1) ,
(b) Sn,1 = Op
³khk2 + khk kλk
´= op (1) ,
(c) Sn,2 = μ2,1 (Ω (u) fu (u))⊗ Ip + op (1) .
Proof. We only prove (a) since the proofs of (b) and (c) are similar. First by the stationarity ofXi, Ui ,
E (Sn,0) = E³XiX
0
iKiu
´= E
³XiX
0
iWh,iu|duiu = 0´p¡ud¢+
qXs=1
E³XiX
0
iWh,iuLλ,iu|duiu = s´p (duiu = s)
= E (Ω (Ui)Wh,iu|duiu = 0) p¡ud¢+O (kλk)
=
ZΩ¡uc + h¯ v, ud
¢fu¡uc + h¯ v, ud
¢W (v) dv +O (kλk)
= Ω (u) fu (u) +O³khk2 + kλk
´. (6.1)
Since a typical element of Sn,0 is
sn,st = n−1nXi=1
XisXitKiu, s, t = 1, ..., d,
by the Chebyshev’s inequality, it suffices to show that
var (sn,st) = o (1) . (6.2)
Let ξi = XisXitKiu. By the stationarity of Xi, Ui , we have
var (sn,st) =1
nvar (ξ1) +
2
n
n−1Xj=1
µ1− j
n
¶cov
¡ξ1, ξj
¢. (6.3)
Clearly,
var (ξ1) ≤ E¡X21sX
21tK
21,u
¢= O
³(h1...hn)
−1´. (6.4)
To obtain an upper bound for the second term on the right hand side of (6.3), we split it into two
terms as follows
n−1Xj=1
¯cov
¡ξ1, ξj
¢¯=
dnXj=1
¯cov
¡ξ1, ξj
¢¯+
n−1Xj=dn+1
¯cov
¡ξ1, ξj
¢¯≡ J1 + J2,
15
where dn is a sequence of positive integers such that dnh1...hp → 0 as n→∞. Since for any j > 1,¯E¡ξ1ξj
¢¯= |E (X1sX1tK1,uXjsXjtKj,u)| = O (1) ,
J1 = O (dn) . For J2, by the Davydov’s inequality (e.g., Hall and Heyde, 1980, p. 278; or Bosq, 1996,
p. 19), we have
cov¡ξ1, ξj
¢≤ C [α (j − 1)]γ/(2+γ)
³E |ξ1|
2+γ´2/(2+γ)
= C [α (j − 1)]γ/(2+γ)nE¯(X1sX1t)
(2+γ)K2+γ1,u
¯o2/(2+γ)= O
³(h1....hp)
−(2+2γ)/(2+γ)´[α (j − 1)]γ/(2+γ) . (6.5)
So
J2 ≤ C (h1....hp)−(2+2γ)/(2+γ)
n−1Xj=dn
[α (j)]γ/(2+γ)
≤ C (h1....hp)−(2+2γ)/(2+γ)
d−αn
∞Xj=dn
jα [α (j)]γ/(2+γ)
= o³(h1....hp)
−1´, (6.6)
by choosing dn such that d−αn (h1....hp)−γ/(2+γ)
= o (1) . This, in conjunction with (6.3)-(6.4), implies,
var(sn,st) = O³(nh1....hp)
−1´= o (1) .
Lemma 6.2
HTn,1 = n−1/2 (h1...hp)1/2
nXi=1
ÃXiεi
(Xiεi)⊗ ((Uci − uc) /h)
!Kiu
d→ N (0,Γ) ,
where H =pnh1...hp, σ
2 (u, x) = E£ε2i |Ui = u,Xi = x
¤, Ω∗ (u) = E
£XiX
0iσ2 (Ui,Xi) |Ui = u
¤, and
Γ = Γ (u) = fu (u)
Ãμp0,2Ω
∗(u) 00
0 μ2,2Ω∗(u)⊗ Ip
!.
Proof. Let c be a unit vector on Rd(p+1). Let
ζi = (h1...hp)1/2 c0
ÃXiεi
(Xiεi)⊗ ((Uci − uc) /h)
!Kiu.
By the Cramer-Wold device, it suffices to prove
In = n−1/2nXi=1
ζid→ N (0, c0Γc) . (6.7)
Clearly, by the law of iterated expectation, E (ζi) = 0. Now
var (In) = var (ζ1) + 2n−1Xj=1
µ1− j
n
¶cov
¡ζ1, ζj
¢.
16
By arguments similar to those used in the proof of Lemma 6.1,
var (ζ1)
= h1...hpc0E
(ÃΩ∗(Ui) Ω∗(Ui)⊗ ((Uc
i − uc) /h)0
Ω∗(Ui)⊗ ((Uci − uc) /h) Ω∗(Ui)⊗
¡((Uc
i − uc) /h) ((Uci − uc) /h)
0¢!Kiu
)c
= c0Γc+ o (1) ,
andn−1Xj=1
¯cov
¡ζ1, ζj
¢¯= o (1) ,
which implies that
var (In)→ c0Γc as n→∞.
Using the standard Doob’s small-block and large-block technique, we can finish the rest of the
proof by following the arguments of Cai, Fan and Yao (2000, pp.954-955) or Cai and Ould-Saïd (2003,
pp.446-448).
Lemma 6.3 Let Bn = H (Tn,2 − Snθ) . Then Bn = b (h, λ)+op (1) , where b (h, λ) is defined in (2.9).
λsIs¡ud, eud¢ fu ¡uc, eud¢Ã Ω ¡uc, eud¢ ¡a ¡uc, eud¢− a (u)¢−μ2,1
¡Ω¡uc, eud¢⊗ Ip
¢b (u)
!+ o (1) .
Consequently, E (Bn) = b (h, λ) + o (1) , where b (h, λ) is defined in (2.9).
To show var(Bn) = o (1) elementwise, we focus on the first d elements ς(1)i of ςi since the other
cases are similar, where
ς(1)i = H
£XiX
0i (a (Ui)− a (u))−
¡XiX
0i ⊗ ((Uc
i − uc) /h)0¢b (u)
¤Kiu.
A typical element of ς(1)i is
ς(1)i,t = H
"Xit
dXs=1
Xis (as (Ui)− as (u))−Xit
dXs=1
Xis ((Uci − uc) /h)0 bj (u)
#Kiu,
t = 1, ...., d.
var
Ã1
n
nXi=1
ς(1)i,t
!=1
nvar
³ς(1)1,t
´+2
n
n−1Xj=1
µ1− j
n
¶cov
³ς(1)1,t , ς
(1)j,t
´.
By arguments similar to those used in the proof of Lemma 6.1,
1
nvar
³ς(1)1,t
´= O
³khk4 + kλk2
´= o (1) ,
andn−1Xj=1
¯cov
³ς(1)1,t , ς
(1)j,t
´¯= o (1) ,
which implies that var³1n
Pni=1 ς
(1)i,t
´= o (1) . Similarly, one can show that the variance of the other
elements in Bn is o (1) . The conclusion then follows by the Chebyshev’s inequality.
By Lemmas 6.1-6.3,
HH1
³bθ − θ´−B−1b (h, λ)
d→ N¡0, B−1ΓB−1
¢.
This completes the proof.
References
Aitchison, J., and C. G. G. Aitken (1976), Multivariate binary discrimination by the kernel method.
Biometrika 63, 413-420.
18
Altonji, J.G., and R.M. Blank (1999), Race and gender in the labor market, in O. C. Ashenfelter and
D. Card, eds, Handbook of Labor Economics 3C, Chapter 48, pp. 3143-3259, Elsevier: North
Holland.
Beaudry, P., and D. A. Green (2004), Changes in US wages, 1976-2000: ongoing skill bias or major
technological change? Journal of Labor Economics 23, 491-526.
Bosq, D. (1996), Nonparametric Statistics for Stochastic Processes: Estimation and Prediction.
Springer, New York.
Cai, Z., M. Das, H. Xiong, and X. Wu (2006), Functional coefficient instrumental variables models,
Journal of Econometrics 133, 207-241.
Cai, Z., J. Fan, and Q. Yao (2000), Functional-coefficient regression models for nonlinear time series,
Journal of American Statistical Association 95, 941—956.
Cai, Z., and E. Ould-Saïd (2003), Local M-estimator for nonparametric time series, Statistics and
Probability Letters 65, 433-449.
Card, D. (1999), Casual effect of education on earnings, in O. C. Ashenfelter and D. Card, eds,
Handbook of Labor Economics 3A, Chapter 48, pp. 1802-1864, Elsevier: North Holland.
Card, D., and J. DiNardo (2002), Skill biased technological change and rising wage inequality: some
problems and puzzles, Journal of Labor Economics 20, 733-783.
Card, D., and T. Lemieux (2001), Can falling supply explain the rising return to college for younger
men? A cohort-based analysis, The Quarterly Journal of Economics 116, 705-746.
Chen, R. and R. S. Tsay (1993), Functional-coefficient autoregressive models, Journal of American
Statistical Association 88, 298-308.
Cleveland, W. S., E. Grosse, and W. M. Shyu (1992), Local regression models, in J. M. Chambers
and T. J. Hastie, eds, Statistical Models in S, pp. 309-376, Pacific Grove, CA: Wadsworth &
Brooks/Cole.
Fan, Y. and Q. Li (1999), Root-n-consistent estimation of partially linear time series models. Journal
of Nonparametric Statistics 11, 251-269.
Hall, P. and C. C. Heyde (1980), Martingale Limit Theory and Its Applications. Academic Press,
New York.
Hall, P., R. C. L. Wolf, and Q. Yao (1999), Methods of estimating a conditional distribution function,
Journal of the American Statistical Association 94, 154-163.
Hastie, T. J., and R . J. Tibshirani (1993), Varying-coefficient models (with discussion), Journal of
the Royal Statistical Society, Series B. 55, 757-796.
19
Li, Q., and J. Racine (2005), Nonparametric estimation of conditional CDF and quantile functions
with mixed categorical and continuous data. Forthcoming in Journal of Business and Economic
Statistics.
Li, Q., and J. Racine (2007), Nonparametric Econometrics: Theory and Practice. Princeton Univer-
sity Press, Princeton and Oxford.
Mincer, J. (1974), Schooling, Experience and Earnings, New York: National Bureau of Economic
Research.
Murphy, K,. and F. Welch (1990), Empirical age-earnings profiles, Journal of Labor Economics 8,
202-229.
Racine, J. and Q. Li (2004), Nonparametric estimation of regression functions with both categorical
and continuous data, Journal of Econometrics 119, 99-130.
Ullah, A. (1985), Specification analysis of econometric models. Journal of Quantitative Economics
1, 187-209.
Zheng, J. (2000), Specification testing and nonparametric estimation of the human capital model, in
T. B. Fomby & R. C. Hill, eds, Advances in Econometrics 14: Applying Kernel and Nonpara-
metric Estimation to Economic Topics, 129-154. JAI Press Inc.
20
Figure 1: Education-Experience-Wage proflie resulting from the partially linear models
21
0 10 20 30 40 502
3
4
5
6
0 10 20 30 40 503
3.5
4
4.5
5
5.5
6
0 10 20 30 40 503
3.5
4
4.5
5
5.5
0 10 20 30 40 503
3.5
4
4.5
5
5.5
6
0 10 20 30 40 500
0.05
0.1
0.15
0.2
0.25
0 10 20 30 40 50−0.1
−0.05
0
0.05
0.1
0.15
0 10 20 30 40 50−0.05
0
0.05
0.1
0.15
0.2
0 10 20 30 40 50−0.05
0
0.05
0.1
0.15
0.2
Figure 2: Plots of a1 (Experience,Region, :) and a2 (Experience,Region, :) averaging over other cat-egorical variables. Horizontal axis: Experience. Vertical axis: a1 or a2. The two rows correspond to a1and a2 respectively from the top to the bottom. The four columns correspond to Region =Northeast,Midwest, South and West from the left to the right column. 1990: solid line, 1995: dotted line, 2000:
dashdot line, 2005: dashed line.
22
0 10 20 30 40 502
3
4
5
6
0 10 20 30 40 503
3.5
4
4.5
5
5.5
6
0 10 20 30 40 503
3.5
4
4.5
5
5.5
6
0 10 20 30 40 500
0.05
0.1
0.15
0.2
0 10 20 30 40 500
0.05
0.1
0.15
0.2
0 10 20 30 40 50−0.05
0
0.05
0.1
0.15
0.2
Figure 3: Plots of a1 (Experience,Race, :) and a2 (Experience,Race, :) averaging over other categor-ical variables. Horizontal axis: Experience. Vertical axis: a1 or a2. The two rows correspond to a1
and a2 from the top to the bottom. The three columns correspond to Race = Otherwise, Hispanic,and White from the left to the right column. 1990: solid line, 1995: dotted line, 2000: dashdot line,2005: dashed line.
23
0 10 20 30 40 503.5
4
4.5
5
5.5
6
0 10 20 30 40 502
3
4
5
6
0 10 20 30 40 50−0.05
0
0.05
0.1
0.15
0.2
0 10 20 30 40 500
0.05
0.1
0.15
0.2
0 10 20 30 40 503
3.5
4
4.5
5
5.5
6
0 10 20 30 40 503
3.5
4
4.5
5
5.5
6
0 10 20 30 40 50−0.05
0
0.05
0.1
0.15
0.2
0 10 20 30 40 50−0.05
0
0.05
0.1
0.15
0.2
0 10 20 30 40 503
3.5
4
4.5
5
5.5
0 10 20 30 40 502
3
4
5
6
0 10 20 30 40 500
0.05
0.1
0.15
0.2
0 10 20 30 40 50−0.05
0
0.05
0.1
0.15
0.2
Figure 4: Plots of a1 (Experience,Gender, :) and a2 (Experience,Gender, :) (1st row), a1(Experience,Single, :) and a2 (Experience, Single, :) (2nd row), a1 (Experience, V eteran, :) and a2(Experience,
V eteran, :) (3rd row), averaging over other categorical variables. Horizontal axis: Experience. Verticalaxis: a1 or a2. First row: the four columns from the left to the right correspond to a1 for male, a1 forfemale, a2 for male, and a2 for female, respectively. Second row: the four columns from the left to theright correspond to a1 for non-single, a1 for single, a2 for non-single, and a2 for single, respectively.Third row: the four columns from the left to the right correspond to a1 for non-veteran, a1 for veteran,a2 for non-veteran, and a2 for veteran, respectively. 1990: solid line, 1995: dotted line, 2000: dashdotline, 2005: dashed line.
24
0 10 20 30 40 503
4
5
6
0 10 20 30 40 503
4
5
6
0 10 20 30 40 503
4
5
6
0 10 20 30 40 503
4
5
6
0 10 20 30 40 502
3
4
5
6
0 10 20 30 40 503
4
5
6
0 10 20 30 40 503
4
5
6
0 10 20 30 40 503
4
5
6
0 10 20 30 40 503
4
5
6
0 10 20 30 40 503
4
5
6
0 10 20 30 40 50−0.05
0
0.05
0.1
0.15
0.2
0 10 20 30 40 50−0.05
0
0.05
0.1
0.15
0.2
0 10 20 30 40 50−0.05
0
0.05
0.1
0.15
0.2
0 10 20 30 40 50−0.05
0
0.05
0.1
0.15
0.2
0 10 20 30 40 50−0.05
0
0.05
0.1
0.15
0.2
0 10 20 30 40 50−0.05
0
0.05
0.1
0.15
0.2
0 10 20 30 40 50−0.05
0
0.05
0.1
0.15
0.2
0 10 20 30 40 50−0.05
0
0.05
0.1
0.15
0.2
0 10 20 30 40 500
0.05
0.1
0.15
0.2
0 10 20 30 40 50−0.05
0
0.05
0.1
0.15
0.2
Figure 5: Plots of a1 (Experience, Industry, :) and a2 (Experience, Industry, :) averaging over othercategorical variables. Horizontal axis: Experience. Vertical axis: a1 or a2. The first two rows cor-respond to a1, and the last two rows correspond to a2. For rows 1 and 3, the five columns from theleft to the right correspond respectively to Industry = Agriculture, Mining, Construction, Manufac-turing, and Transportation. For rows 2 and 4, the five columns from the left to the right correspondrespectively to Industry = Wholesale and return, Finance, Personal services, Professional services,and Public administration. 1990: solid line, 1995: dotted line, 2000: dashdot line, 2005: dashed line.
25
0 10 20 30 40 503
3.5
4
4.5
5
5.5
0 10 20 30 40 50−0.02
0
0.02
0.04
0.06
0.08
0.1
0.12
0.14
0.16
Figure 6: Plots of a1 (Experience, :) and a2 (Experience, :) averaging over all categorical variables.Horizontal axis: Experience. Vertical axis: a1 or a2. The two columns from the left to the rightcorrespond to a1 and a2, respectively. 1990: solid line, 1995: dotted line, 2000: dashdot line, 2005:dashed line.