Background and Purpose Early-onset Alzheimer’s disease (EOAD) and late-onset Al-zheimer’s disease (LOAD) have different clinical and neuroimaging characteristics, but mem-ory decline is usually present in both types. However, there have been few functional studies focused on the hippocampus in Alzheimer’s disease. We therefore investigated the functional connectivity between the hippocampus and other brain regions using resting-state fMRI and compared the findings between EOAD and LOAD.Methods We recruited 13 patients with EOAD and 19 patients with LOAD at the early disease stage. Twenty-one young controls and ten old controls were also recruited. Each participant completed a standardized neuropsychological battery of tests and underwent T1-weighted structural MRI. fMRI data were acquired during the resting state using 3-T MRI. The function-al connectivity to the hippocampus was calculated based on automated anatomical labeling templates.Results The functional connectivity from the hippocampus to other brain regions differed between patients with EOAD and LOAD. The LOAD patients showed decreased hippocampal connectivity to cortical regions, such as to the middle temporal cortex, orbitofrontal cortex, post-central cortex, supramarginal cortex, and rolandic operculum. In contrast, EOAD patients showed smaller functional changes of the cortical regions connected to the hippocampus, such as the middle frontal cortex.Conclusions EOAD and LOAD patients exhibited different hippocampal connectivity. The memory decline in EOAD may be due to brain areas other than the hippocampus.Key Words early-onset Alzheimer’s disease, late-onset Alzheimer’s disease,
functional connectivity, hippocampus.
Functional Connectivity of the Hippocampus in Early- and vs. Late-Onset Alzheimer’s Disease
INTRODUCTION
Alzheimer’s disease (AD) is the main cause of dementia. This disease typically presents with episodic memory impairment, which reflects previous degradation of the medial temporal lobe. The hippocampus is one of the earliest affected brain regions in AD,1 and its degrada-tion has been found to be a hallmark of AD in many structural and functional imaging stud-ies. Hippocampal volume loss and atrophy rates were found to differ significantly between AD patients and controls, and are probably good candidates for predicting the progression to AD.2,3 The loss of synapses in the hippocampus in AD has been consistently found in histo-logical studies4 and diffusion-tensor imaging studies.5,6 Functional connectivity as revealed using resting-state fMRI has received particular attention in brain imaging research, and has also been researched in AD. Alterations in functional connectivity between AD and control groups have been reported,7,8 with decreased hippocampal connectivity found in patients with AD.9
Kee Hyung Parka* Young Noha,b Eun-Jung Choib Hyungsik Kimc Sohyun Chund Young-Don Sonb,e*a Departments of Neurology,c Family Medicine, and dRadiology, Gachon University Gil Medical Center, Incheon, Korea
b Neuroscience Research Institute, Gachon University, Incheon, Korea
e Department of Biomedical Engineering, College of Health Science, Gachon University, Incheon, Korea
Received August 24, 2016Revised June 17, 2017Accepted June 20, 2017
CorrespondenceYoung-Don Son, PhDDepartment of Biomedical Engineering, College of Health Science, Gachon University, 191 Hambakmoe-ro, Yeonsu-gu, Incheon 21936, KoreaTel +82-32-820-4416Fax +82-32-820-4449E-mail [email protected]
Kee Hyung Park, MD, PhDDepartment of Neurology, Gachon University Gil Medical Center, 21 Namdong-daero 774beon-gil, Namdong-gu, Incheon 21565, KoreaTel +82-32-460-3346Fax +82-32-460-3344E-mail [email protected]
*These authors contributed equally to this work.
cc This is an Open Access article distributed under the terms of the Creative Commons Attribution Non-Com-mercial License (http://creativecommons.org/licenses/by-nc/4.0) which permits unrestricted non-commercial use, distribution, and reproduction in any medium, provided the original work is properly cited.
Functional Connectivity between EOAD and LOADJCNAttention has recently been paid to two specific classifica-
tions of AD based on the age at the appearance of disease symptoms: early-onset Alzheimer’s disease (EOAD) and late-onset Alzheimer’s disease (LOAD). Previous studies have shown that EOAD and LOAD patients exhibit differences in both clinical characteristics and neuroimaging findings. EOAD shows more diverse cognitive impairments than LOAD, such as reduced attention, decreases in lingual, visuospatial, and frontal-executive function, impaired memory, and apraxia. This functional degradation in EOAD progresses more rapid-ly than that in LOAD.10,11 Structural imaging studies of the cortical thickness11,12 and shape13,14 and using [18F]fluorode-oxyglucose positron-emission tomography15,16 and [11C]Pitts-burgh compound-B positron-emission tomography17 have also demonstrated significant differences between EOAD and LOAD.
A particularly interesting finding was that the hippocampal sparing occurred at a younger age in AD groups in both path-ological18 and structural imaging19 studies. We therefore hy-pothesized that different functional mechanisms underlie EOAD and LOAD, and that the functional connectivity be-tween the hippocampus and other brain regions can be differ-entiated according to the age at the onset of AD. In this study, we investigated changes in functional connectivity in the bi-lateral hippocampus between patients with EOAD and LOAD using resting-state fMRI.
METHODs
Participants
Patients According to the age at the disease onset, we prospectively
recruited 13 patients with EOAD (onset at younger than 65 years) and 19 patients with LOAD (onset at 65 years of age or older) from the Memory Disorder Clinic at Gachon Universi-ty Gil Medical Center. The patients met the criteria for proba-ble AD as proposed by the National Institute of Neurological and Communicative Disorders and Stroke, and the Alzheim-er’s Disease and Related Disorders Association.20 None of the patients had a family history suggestive of an autosomal dom-inant disease. We excluded patients with other structural le-sions found in brain MRI, such as a brain tumor, hydrocepha-lus, territorial infarction, intracranial hemorrhage, or severe white-matter hyperintensities (defined as a cap or band with a maximum diameter measured perpendicular to the ventricle of ≤10 mm, or a deep white-matter lesion with a maximum diameter of ≤25 mm, as modified from the Fazekas ischemia criteria).21 To ensure a clear distinction between EOAD and LOAD, patients between 65 and 70 years old were excluded. The demographic characteristics of the participating subjects are summarized in Table 1.
Controls We recruited 31 healthy volunteers to serve as normal con-trols (NCs). These subjects had no history of neurological or psychiatric illnesses and no abnormalities in a neurological examination. The NC group exhibited normal cognition in the Mini Mental State Examination and detailed neuropsy-chological tests. To compare AD groups with their age-matched control groups, the NC group was divided into two subgroups, young controls (YCs) and old controls (OCs), based on wheth-er the subjects were younger or older than 65 years, respective-ly. Among 31 NCs, 21 were designated as YCs10 were desig-nated as OCs.
This study was approved by the Institutional Review Board
Table 1. Demographic characteristics of the participating subjects
EOAD (n=13)
YCs (n=21)
EOAD vs YCs(p)
LOAD (n=19)
OCs (n=10)
LOAD vs OCs(p)
LOAD vs EOAD (p)
Age, years*58.10±4.44
(53–63)56.80±4.55
(51–64)0.431
75.90±3.25(72–85)
75.20±4.27(70–83)
0.627 <0.001
Sex (F/M)† 8/5 13/8 0.999 16/3 7/3 0.633 0.219
Education, years*8.27±4.27(0.5–16)
10.0±5.59(0.5–16)
0.3475.42±4.21(0.5–12)
7.70±4.47(3–16)
0.186 0.071
K-MMSE score*20.80±3.90
(12–25)27.70±1.79
(24–30)<0.001
16.60±3.30(12–28)
26.40±1.71(24–30)
<0.001 0.003
CDR*0.58±0.18(0.5–1.0)
0.24±0.26(0.0–0.5)
<0.0010.63±0.23(0.5–1.0)
0.20±0.26(0.0–0.5)
<0.001 0.479
CDR-SB*2.88±1.40(1.0–5.0)
0.31±0.37(0.0–1.0)
<0.0013.11±1.29(1.5–5.0)
0.20±0.26(0.0–0.5)
<0.001 0.649
Data are mean±SD (range) values. *Student’s t-test was used to compare continuous variables, †The chi-square test was used to compare categorical variables.CDR: Clinical Dementia Rating, CDR-SB: Clinical Dementia Rating Sum of Boxes, EOAD: early-onset Alzheimer’s disease, K-MMSE: Korean version of the Mini Mental State Examination (scored out of 30), LOAD: late-onset Alzheimer’s disease, OCs: old controls, YCs: young controls.
www.thejcn.com 389
Park KH et al. JCNof Gachon University Gil Medical Center (approval no. GIRB D0003-2012). We obtained informed consent from all of the patients and control subjects.
Neuropsychological tests The patients and NCs underwent a standardized neuropsy-chological battery of tests called the Seoul Neuropsychologi-cal Screening Battery (SNSB).22 This battery contains tests for attention, language, praxis, four elements of Gerstmann syn-drome, visuoconstructive function, verbal and visual memo-ry, and frontal/executive function. Among these subtests, the tests with quantitative scores used in the current study in-cluded digit span (forward and backward), the Korean ver-sion of the Boston Naming Test, the Rey-Osterrieth Complex Figure Test (copying, immediate and 20-minute delayed re-call, and recognition), the Seoul Verbal Learning Test (SVLT; 3 learning free-recall trials of 12 words, a 20-minute delayed-recall trial for those 12 items, and a recognition test), the phonemic and semantic Controlled Oral Word Association Test, and the Stroop Test (word and color reading of 112 items during a 2-minute period). The resultant SNSB scores for each subject were converted into standard scores (z-scores) derived using adjusted norms for age and education level.
We also performed evaluations using the Korean version of the Mini Mental State Examination (K-MMSE), Clinical Dementia Rating (CDR), Clinical Dementia Rating Sum of Boxes, and the Geriatric Depression Scale.
scan protocolT1-weighted structural MRI and fMRI data were acquired us-ing 3-T MRI (Verio, Siemens, Germany). A T1-weighted scan with an MPRAGE3D pulse sequence was performed using the following parameters: repetition time (TR)=1,900 ms, echo time (TE)=3.3 ms, flip angle=9°, and voxel size=1.0×1.0× 1.0 mm3. For functional connectivity, patients were scanned for 9 minutes using gradient-echo echo planar imaging (EPI) with the following parameters: TR=3,000 ms, TE=30 ms, and voxel size=3.5×3.5×3.5 mm3. The participants were instructed to open their eyes and to not move their head during fMRI data acquisition.
Image analysisThe Resting-State fMRI Data Analysis Toolkit (Beijing Nor-mal University, Beijing, China) was used to assess functional connectivity. T1-weighted MPRAGE3D images were coregis-tered to the EPI images and segmented using Diffeomorphic Anatomical Registration Through Exponentiated Lie algebra (DARTEL) algorithm implemented. The EPI data were re-aligned to remove head motion that had occurred during data acquisition. Structural and functional images were normalized
to the Montreal Neurological Institute template based on the segmented T1-weighted structural MRI images. Detrend and bandpass filters (0.01–0.08 Hz) were applied to remove linear drift and physiological noise, respectively. An isotropic three-dimensional Gaussian smoothing filter with a 6-mm full width at half maximum was applied to suppress spatial noise. Based on a region defined in the automated anatomical labeling, the left and right hippocampi were selected as the seed regions; Pearson’s product-moment correlation coefficients were cal-culated for the correlations of the averaged signals within the selected region of interest with the other signals in the other voxels. The correlation-coefficient maps were converted into z-maps using Fisher’s r-to-z transform in order to improve con-sistency with normality.
statistical analysisCommercial statistics software (SPSS Statistics version 18, SPSS Inc., Chicago, IL, USA) was used to assess group differ-ences in demographic variables and cognitive test results be-tween patients with EOAD or LOAD and each age-matched NC group. Student’s t-test was used when analyzing continuous variables, while the chi-square test was used when analyzing categorical variables.
SPM8 (Wellcome Trust Centre for Neuroimaging, Univer-sity College London, London, UK) was used to statistically analyze the correlation-coefficient map of the resting fMRI data. A two-by-two factorial design was adopted for the sec-ondary analysis of the correlation map in order to identify group differences in hippocampal connectivity. The two factors were onset age and presence of the disease, while the number of years of education, sex, and age of subjects were adjusted as the covariates. Each AD group was compared with the corre-sponding control group using the (EOAD-YCs) and (LOAD-OCs) contrast. The interaction effect between the onset age and presence of the disease was analyzed using the (LOAD-OCs)-(EOAD-YCs) contrast. The significance cutoff was set to p<0.005 in this analysis.
REsULTs
Neuropsychological testsAs indicated in Table 1, age differed significantly between the EOAD and LOAD groups (p<0.001). As expected, the K-MMSE score and CDR differed significantly between con-trols and patients, both in the EOAD and LOAD groups (p< 0.001), with the mean K-MMSE score being significantly high-er in the EOAD group than the LOAD group (p=0.003).
The SNSB was applied to evaluate the impacts of AD on various cognitive functions. As expected, the scores were sig-nificantly lower in patient groups than the corresponding con-
390 J Clin Neurol 2017;13(4):387-393
Functional Connectivity between EOAD and LOADJCNtrol groups in each SNSB test. SVLT delayed recall and SVLT recognition were worse for EOAD than for LOAD (Table 2).
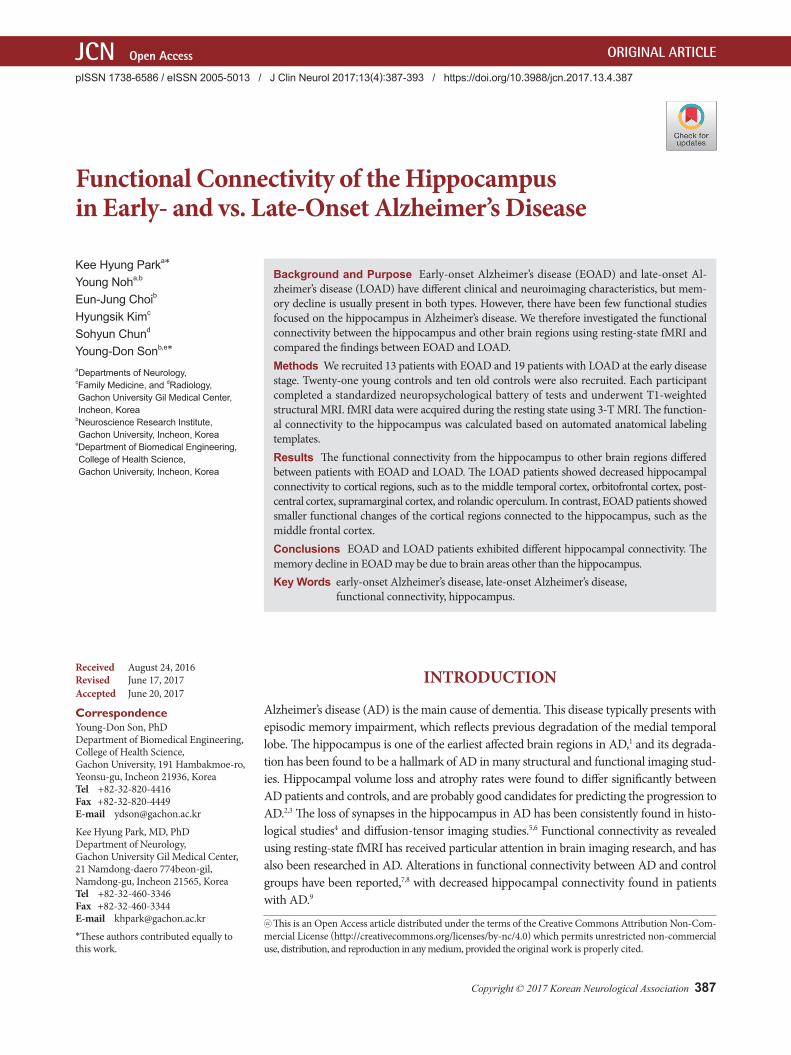
Voxel-wised hippocampal connectivity between EOAD and LOADHippocampal connectivity in the EOAD and LOAD groups was compared to that in the corresponding age-matched con-trol groups, as shown in Fig. 1. Left hippocampal connectivity to the right middle frontal cortex was decreased in the EOAD group compared to the YCs. No significant difference was observed in right hippocampal connectivity in the EOAD group. In the LOAD group, the left hippocampal connectiv-ity to the left middle temporal cortex was decreased while that to the left caudate nucleus was increased. The right hip-pocampal connectivity to the left orbitofrontal cortex, left postcentral cortex, left supramarginal cortex, and right rolan-dic operculum was decreased in the LOAD group compared to the OCs, while that to the bilateral caudate nucleus was in-creased.
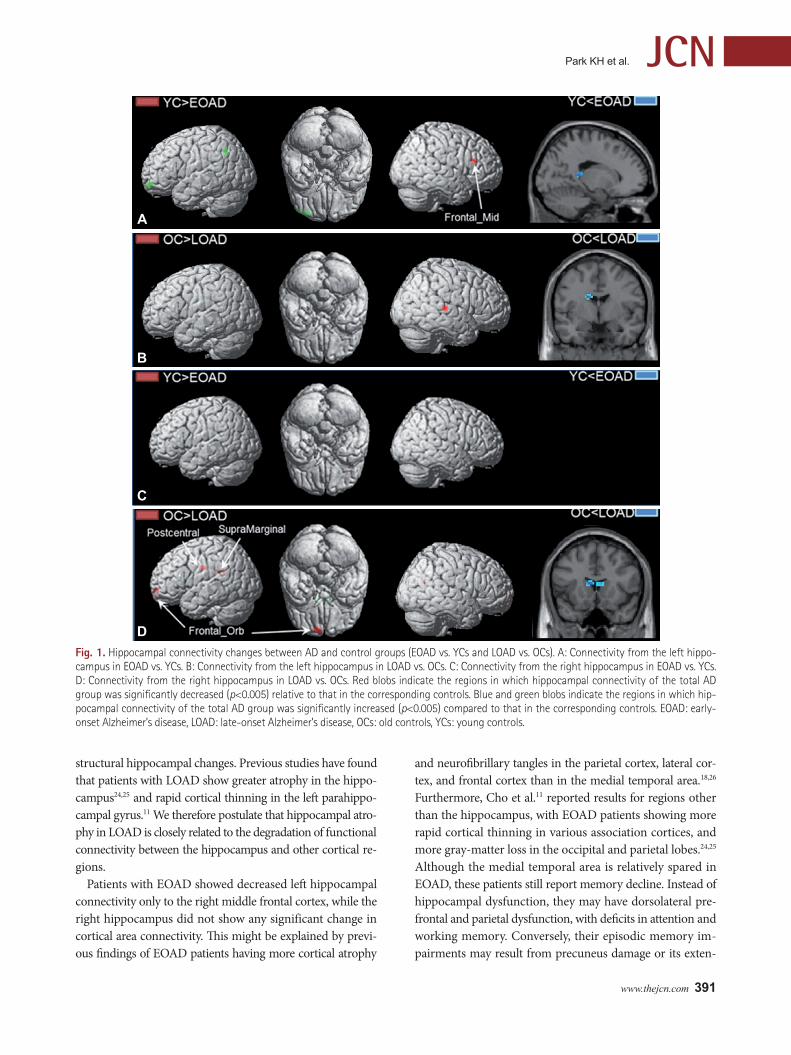
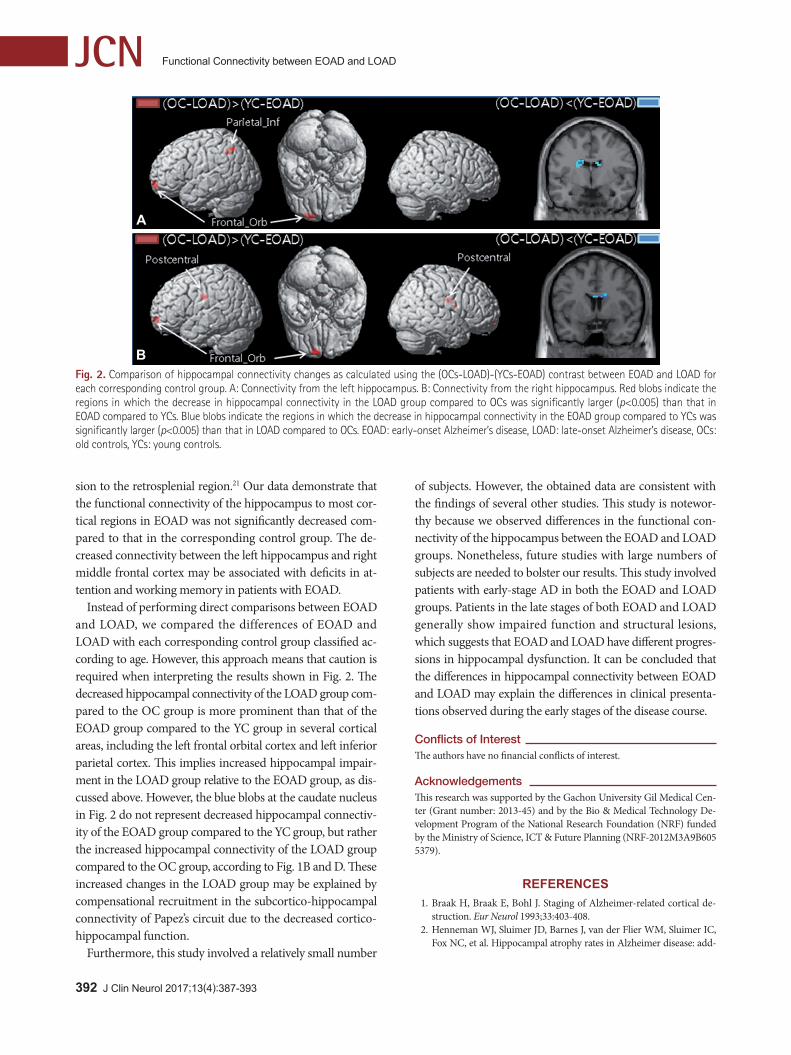
In order to detect the interaction effect between the disease presence and onset age, hippocampal connectivity changes were calculated using the (OCs-LOAD)-(YCs-EOAD) con-trast, as shown in Fig. 2. The difference in left hippocampal connectivity in the left inferior parietal cortex and the left orbitofrontal cortex was greater in the LOAD group than the EOAD group, relative to the corresponding control groups, while the EOAD group showed a greater difference than the LOAD group in the left caudate nucleus, relative to the cor-responding NC. The LOAD group showed a greater differ-ence in right hippocampal connectivity in the bilateral post-central cortex and the left orbitofrontal cortex than the EOAD
group, relative to the corresponding control groups, while the EOAD group showed a greater difference than the LOAD group in the right caudate nucleus, relative to the corresponding con-trol groups. The difference in the right caudate nucleus seems to be caused by the hippocampal connectivity being increased in the LOAD group compared to the OC group.
DIsCUssION
This study found that the hippocampal connectivity differed between EOAD and LOAD patients. Patients with LOAD showed decreased hippocampal connectivity with broad cor-tical areas compared to the corresponding control group, such as from the left hippocampus to the middle temporal cortex, and from the right hippocampus to the left orbitofron-tal cortex, left postcentral cortex, supramarginal cortex, and right rolandic operculum. Conversely, functional connectivi-ty in the bilateral hippocampus of patients with EOAD was relatively preserved, with only a decrease in the left hippo-campal connectivity to the right middle frontal cortex.
The present LOAD results are consistent with the findings of previous studies involving patients with AD.9,23 Wang et al.9 reported that patients with mild AD showed decreased functional connectivity between the hippocampus and the medial prefrontal cortex, ventral anterior cingulate cortex, inferior temporal cortex, middle temporal cortex, and poste-rior cingulate cortex. Direct correlation analysis of the hippo-campus showed a significant decrease in its functional con-nectivity with the posterior cingulate cortex and lateral parietal areas.23 In patients with LOAD, the functional hippocampal changes in the early stages of the disease may correspond to
Data are mean±SD values. Student’s t-test was used to compare continuous variables.COWAT: Controlled Oral Word Association Test, EOAD: early-onset Alzheimer’s disease, K-BNT: Korean version of the Boston Naming Test, LOAD: late-onset Alzheimer’s disease, OCs: old controls, RCFT: Rey-Osterrieth Complex Figure Test, SVLT: Seoul Verbal Learning Test, YCs: young controls.
www.thejcn.com 391
Park KH et al. JCN
structural hippocampal changes. Previous studies have found that patients with LOAD show greater atrophy in the hippo-campus24,25 and rapid cortical thinning in the left parahippo-campal gyrus.11 We therefore postulate that hippocampal atro-phy in LOAD is closely related to the degradation of functional connectivity between the hippocampus and other cortical re-gions.
Patients with EOAD showed decreased left hippocampal connectivity only to the right middle frontal cortex, while the right hippocampus did not show any significant change in cortical area connectivity. This might be explained by previ-ous findings of EOAD patients having more cortical atrophy
and neurofibrillary tangles in the parietal cortex, lateral cor-tex, and frontal cortex than in the medial temporal area.18,26 Furthermore, Cho et al.11 reported results for regions other than the hippocampus, with EOAD patients showing more rapid cortical thinning in various association cortices, and more gray-matter loss in the occipital and parietal lobes.24,25 Although the medial temporal area is relatively spared in EOAD, these patients still report memory decline. Instead of hippocampal dysfunction, they may have dorsolateral pre-frontal and parietal dysfunction, with deficits in attention and working memory. Conversely, their episodic memory im-pairments may result from precuneus damage or its exten-
Fig. 1. Hippocampal connectivity changes between AD and control groups (EOAD vs. YCs and LOAD vs. OCs). A: Connectivity from the left hippo-campus in EOAD vs. YCs. B: Connectivity from the left hippocampus in LOAD vs. OCs. C: Connectivity from the right hippocampus in EOAD vs. YCs. D: Connectivity from the right hippocampus in LOAD vs. OCs. Red blobs indicate the regions in which hippocampal connectivity of the total AD group was significantly decreased (p<0.005) relative to that in the corresponding controls. Blue and green blobs indicate the regions in which hip-pocampal connectivity of the total AD group was significantly increased (p<0.005) compared to that in the corresponding controls. EOAD: early-onset Alzheimer’s disease, LOAD: late-onset Alzheimer’s disease, OCs: old controls, YCs: young controls.
A
B
C
D
392 J Clin Neurol 2017;13(4):387-393
Functional Connectivity between EOAD and LOADJCN
sion to the retrosplenial region.21 Our data demonstrate that the functional connectivity of the hippocampus to most cor-tical regions in EOAD was not significantly decreased com-pared to that in the corresponding control group. The de-creased connectivity between the left hippocampus and right middle frontal cortex may be associated with deficits in at-tention and working memory in patients with EOAD.
Instead of performing direct comparisons between EOAD and LOAD, we compared the differences of EOAD and LOAD with each corresponding control group classified ac-cording to age. However, this approach means that caution is required when interpreting the results shown in Fig. 2. The decreased hippocampal connectivity of the LOAD group com-pared to the OC group is more prominent than that of the EOAD group compared to the YC group in several cortical areas, including the left frontal orbital cortex and left inferior parietal cortex. This implies increased hippocampal impair-ment in the LOAD group relative to the EOAD group, as dis-cussed above. However, the blue blobs at the caudate nucleus in Fig. 2 do not represent decreased hippocampal connectiv-ity of the EOAD group compared to the YC group, but rather the increased hippocampal connectivity of the LOAD group compared to the OC group, according to Fig. 1B and D. These increased changes in the LOAD group may be explained by compensational recruitment in the subcortico-hippocampal connectivity of Papez’s circuit due to the decreased cortico-hippocampal function.
Furthermore, this study involved a relatively small number
of subjects. However, the obtained data are consistent with the findings of several other studies. This study is notewor-thy because we observed differences in the functional con-nectivity of the hippocampus between the EOAD and LOAD groups. Nonetheless, future studies with large numbers of subjects are needed to bolster our results. This study involved patients with early-stage AD in both the EOAD and LOAD groups. Patients in the late stages of both EOAD and LOAD generally show impaired function and structural lesions, which suggests that EOAD and LOAD have different progres-sions in hippocampal dysfunction. It can be concluded that the differences in hippocampal connectivity between EOAD and LOAD may explain the differences in clinical presenta-tions observed during the early stages of the disease course.
Conflicts of InterestThe authors have no financial conflicts of interest.
AcknowledgementsThis research was supported by the Gachon University Gil Medical Cen-ter (Grant number: 2013-45) and by the Bio & Medical Technology De-velopment Program of the National Research Foundation (NRF) funded by the Ministry of Science, ICT & Future Planning (NRF-2012M3A9B605 5379).
REFERENCES1. Braak H, Braak E, Bohl J. Staging of Alzheimer-related cortical de-
struction. Eur Neurol 1993;33:403-408.2. Henneman WJ, Sluimer JD, Barnes J, van der Flier WM, Sluimer IC,
Fox NC, et al. Hippocampal atrophy rates in Alzheimer disease: add-
A
B Fig. 2. Comparison of hippocampal connectivity changes as calculated using the (OCs-LOAD)-(YCs-EOAD) contrast between EOAD and LOAD for each corresponding control group. A: Connectivity from the left hippocampus. B: Connectivity from the right hippocampus. Red blobs indicate the regions in which the decrease in hippocampal connectivity in the LOAD group compared to OCs was significantly larger (p<0.005) than that in EOAD compared to YCs. Blue blobs indicate the regions in which the decrease in hippocampal connectivity in the EOAD group compared to YCs was significantly larger (p<0.005) than that in LOAD compared to OCs. EOAD: early-onset Alzheimer’s disease, LOAD: late-onset Alzheimer’s disease, OCs: old controls, YCs: young controls.
www.thejcn.com 393
Park KH et al. JCNed value over whole brain volume measures. Neurology 2009;72:999-1007.
3. Barnes J, Bartlett JW, van de Pol LA, Loy CT, Scahill RI, Frost C, et al. A meta-analysis of hippocampal atrophy rates in Alzheimer’s dis-ease. Neurobiol Aging 2009;30:1711-1723.
4. Scheff SW, Price DA, Schmitt FA, Mufson EJ. Hippocampal synaptic loss in early Alzheimer’s disease and mild cognitive impairment. Neu-robiol Aging 2006;27:1372-1384.
5. Fellgiebel A, Yakushev I. Diffusion tensor imaging of the hippocam-pus in MCI and early Alzheimer’s disease. J Alzheimers Dis 2011;26 Suppl 3:257-262.
6. Hong YJ, Yoon B, Lim SC, Shim YS, Kim JY, Ahn KJ, et al. Microstruc-tural changes in the hippocampus and posterior cingulate in mild cog-nitive impairment and Alzheimer’s disease: a diffusion tensor imaging study. Neurol Sci 2013;34:1215-1221.
7. Rombouts S, Scheltens P. Functional connectivity in elderly controls and AD patients using resting state fMRI: a pilot study. Curr Alzheimer Res 2005;2:115-116.
8. Wang K, Liang M, Wang L, Tian L, Zhang X, Li K, et al. Altered func-tional connectivity in early Alzheimer’s disease: a resting-state fMRI study. Hum Brain Mapp 2007;28:967-978.
9. Wang L, Zang Y, He Y, Liang M, Zhang X, Tian L, et al. Changes in hippocampal connectivity in the early stages of Alzheimer’s disease: evidence from resting state fMRI. Neuroimage 2006;31:496-504.
10. van der Flier WM, Pijnenburg YA, Fox NC, Scheltens P. Early-onset versus late-onset Alzheimer’s disease: the case of the missing APOE ε4 allele. Lancet Neurol 2011;10:280-288.
11. Cho H, Jeon S, Kang SJ, Lee JM, Lee JH, Kim GH, et al. Longitudinal changes of cortical thickness in early-versus late-onset Alzheimer’s disease. Neurobiol Aging 2013;34:1921.e9-1921.e15.
12. Ridgway GR, Lehmann M, Barnes J, Rohrer JD, Warren JD, Crutch SJ, et al. Early-onset Alzheimer disease clinical variants: multivariate anal-yses of cortical thickness. Neurology 2012;79:80-84.
13. Cho H, Seo SW, Kim JH, Kim C, Ye BS, Kim GH, et al. Changes in subcortical structures in early-versus late-onset Alzheimer’s disease. Neurobiol Aging 2013;34:1740-1747.
14. Moon SW, Dinov ID, Hobel S, Zamanyan A, Choi YC, Shi R, et al. Structural brain changes in early-onset Alzheimer’s disease subjects us-ing the LONI pipeline environment. J Neuroimaging 2015;25:728-737.
15. Kim EJ, Cho SS, Jeong Y, Park KC, Kang SJ, Kang E, et al. Glucose me-tabolism in early onset versus late onset Alzheimer’s disease: an SPM
analysis of 120 patients. Brain 2005;128:1790-1801.16. Kaiser NC, Melrose RJ, Liu C, Sultzer DL, Jimenez E, Su M, et al.
Neuropsychological and neuroimaging markers in early vs. late-on-set Alzheimer’s disease. Am J Alzheimers Dis Other Demen 2012;27: 520-529.
17. Cho H, Seo SW, Kim JH, Suh MK, Lee JH, Choe YS, et al. Amyloid deposition in early onset versus late onset Alzheimer’s disease. J Al-zheimers Dis 2013;35:813-821.
18. Murray ME, Graff-Radford NR, Ross OA, Petersen RC, Duara R, Dickson DW. Neuropathologically defined subtypes of Alzheimer’s disease with distinct clinical characteristics: a retrospective study. Lan-cet Neurol 2011;10:785-796.
19. Noh Y, Jeon S, Lee JM, Seo SW, Kim GH, Cho H, et al. Anatomical heterogeneity of Alzheimer disease: based on cortical thickness on MRIs. Neurology 2014;83:1936-1944.
20. McKhann G, Drachman D, Folstein M, Katzman R, Price D, Stadlan EM. Clinical diagnosis of Alzheimer’s disease: report of the NINCDS-ADRDA work group under the auspices of Department of Health and Human Services task force on Alzheimer’s disease. Neurology 1984;34: 939-944.
21. Noh Y, Seo SW, Jeon S, Lee JM, Kim JH, Kim GH, et al. White matter hyperintensities are associated with amyloid burden in APOE4 non-carriers. J Alzheimers Dis 2014;40:877-886.
22. Ahn HJ, Chin J, Park A, Lee BH, Suh MK, Seo SW, et al. Seoul Neuro-psychological Screening Battery-dementia version (SNSB-D): a useful tool for assessing and monitoring cognitive impairments in dementia patients. J Korean Med Sci 2010;25:1071-1076.
23. Sohn WS, Yoo K, Na DL, Jeong Y. Progressive changes in hippocampal resting-state connectivity across cognitive impairment: a cross-sec-tional study from normal to Alzheimer disease. Alzheimer Dis Assoc Disord 2014;28:239-246.
24. Frisoni GB, Pievani M, Testa C, Sabattoli F, Bresciani L, Bonetti M, et al. The topography of grey matter involvement in early and late onset Alzheimer’s disease. Brain 2007;130:720-730.
25. Cavedo E, Pievani M, Boccardi M, Galluzzi S, Bocchetta M, Bonetti M, et al. Medial temporal atrophy in early and late-onset Alzheimer’s disease. Neurobiol Aging 2014;35:2004-2012.
26. Whitwell JL, Dickson DW, Murray ME, Weigand SD, Tosakulwong N, Senjem ML, et al. Neuroimaging correlates of pathologically defined subtypes of Alzheimer’s disease: a case-control study. Lancet Neurol 2012;11:868-877.