38
FUNCTIONAL EVALUATION OF FLAG-STAT1 IN U3A CELLS by TEY LEE HUNG ADVANCED MEDICAL AND DENTAL INSTITUTE (AMDI) UNIVERSITI SAINS MALAYSIA 2017

FUNCTIONAL EVALUATION OF
FLAG-STAT1 IN U3A CELLS
by
TEY LEE HUNG
ADVANCED MEDICAL AND DENTAL INSTITUTE
(AMDI)
UNIVERSITI SAINS MALAYSIA
2017
FUNCTIONAL EVALUATION OF FLAG-STAT1 IN U3A CELLS
by
TEY LEE HUNG
Dissertation Submitted in Partial Fulfillments Of The Requirements
For The Degree Of Master Of Science (Transfusion Science)
ADVANCED MEDICAL AND DENTAL INSTITUTE (AMDI)
UNIVERSITI SAINS MALAYSIA
2017

iii
ACKNOWLEDGEMENTS
First of all, I would like to express gratitude to my supervisor Dr. Ng Siew Kit for his
patience, guidance and invaluable advices throughout my project. I would like to thank
Mr. Alvin Paul for his willingness in helping and teaching me the lab techniques.
My appreciation goes to all my Master of Science (Transfusion Science) colleagues for
their accompany, support and encouragement along this tough but fruitful year. I wish to
thank Prof. George Stark (Cleveland clinic, USA) for giving the 2fTGH and U3A cell lines
used in my study. I would also like to thank all ADMI Infectomic Lab members for the
great and enjoyable environment during work.
Finally, my upmost thank to my parents, my siblings and my boyfriend for their
unconditionally love, understanding and encouragement.
iv
TABLE OF CONTENTS
PAGE
ACKNOWLEDGEMENTS…………………………………………………… iii
TABLE OF CONTENTS……………………………………………………… iv
LIST OF TABLES…………………………………………………………….. viii
LIST OF FIGURES……………………………………………………………. ix
LIST OF ABBREVIATIONS……….………………………………………… xi
ABSTRAK…………………………………………………………………….. xv
ABSTRACT…………………………………………………………………… xvii
CHAPTER 1: INTRODUCTION……………………………………………… 1
1.1 Background……………………………………………………………... 1
1.2 Innate Immunity………………………………………………………… 2
1.3 Interferon………………………………………………………………... 3
1.3.1 Induced expression of Type I interferon…………………………. 3
1.3.2 Type I interferon response……………………………………….. 5
1.4 JAK-STAT signaling …………………………………………………… 7
1.4.1 JAKs……………………………………………………………… 7
1.4.2 STATs……………………………………………………………. 8
1.5 STAT1………………………………………………………………….. 10
1.5.1 STAT1 in innate and adaptive immunity………………………… 11
1.5.2 STAT1 in haematopoiesis………………………………………... 12
1.5.3 STAT1 in myeloproliferative neoplasms………………………… 13
1.5.4 STAT1 in cancer…………………………………………………. 14
v
1.6 Aim of study…………………………………………………………….. 15
1.6.1 General objective…………………………………………………. 15
1.6.2 Specific objectives………………………………………………... 15
CHAPTER 2: MATERIALS AND METHODS……………………………….. 16
2.1 Preparation of expression plasmids………………………………………… 16
2.1.1 Escherichia coli……………………………………………………….. 16
2.1.1.1 Escherichia coli strain………………………………………….. 16
2.1.1.2 Bacteria growth medium……………………………………….. 16
2.1.1.3 Preparation of Escherichia coli glycerol stock. ……………….. 17
2.1.1.4 Preparation of competent Escherichia coli. ………..…………. 17
2.1.2 Primer Design…………………………………………………………. 18
2.1.2.1 Oligonucleotides for sub-cloning………………………………. 18
2.1.2.2 Oligonucleotides for sequencing……………………………….. 19
2.1.3 Polymerase chain reaction (PCR)……………………………………... 19
2.1.3.1 Gradient PCR…………………………………………………... 20
2.1.3.2 Optimized PCR………………………………………………… 21
2.1.4 TAE Agarose Gel Electrophoresis……………………………………. 22
2.1.5 Purification of PCR product…………………………………………... 23
2.1.6 DNA Quantification………………………………………………....... 23
2.1.7 Restriction Digestion………………………………………………..... 24
2.1.7.1 Insert DNA…………………………………………………….. 24
2.1.7.2 Vector DNA………………………………………………….... 24
2.1.7.3 Gel Purification of Double Digested Vector…………………... 25
2.1.8 Ligation……………………………………………………………….. 26
2.1.9 Heat shock transformation……………………………………………. 27
vi
2.1.10 Expression plasmid extraction and verification……………………... 28
2.1.10.1 Colony PCR…………………………………..………………. 28
2.1.10.2 Miniprep of expression plasmid…………………………….... 29
2.1.10.3 DNA sequencing for miniprep plasmid……………………..... 30
2.2 Cell culture………………………………………………………………..... 31
2.2.1 Revival of 2fTGH and U3A…………………………………………... 31
2.2.2 Maintenance of 2fTGH and U3A……………………………………... 33
2.2.3 Cryopreservation of 2fTGH and U3A cells………………………….... 33
2.2.4 Cell seeding………………………………………………………….... 34
2.2.5 Plasmid transfection…………………………………………………... 35
2.2.6 Interferon-beta treatment……………………………………………… 35
2.2.7 Protein extraction…………………………………………………….... 36
2.2.8 Bradford assay……………………………………………………….... 37
2.3 Immunoblotting…………………………………………………………...... 38
2.3.1 Sodium dodecyl sulfate-polyacrylamide gel electrophoresis…………. 38
2.3.2 Transfer blotting……………………………………………………… 40
2.3.3 Probing…………….…………………………………………………. 42
2.3.3.1 Primary antibodies…….………………………………………. 43
2.3.3.2 Secondary antibodies………………………………………….. 43
2.3.3.3 Dilutions of primary and secondary antibodies……………….. 44
2.3.4 Enzymatic chemiluminescence………………………………………. 44
2.3.5 Quantification of western blot with ImageJ…………………………. 45
CHAPTER 3: RESULTS……………………………………………………... 47
3.1 Construction of p3xFlag-STAT1B plasmid………………………………. 47
3.1.1 Sub-cloning scheme p3xFlag-STAT1B……………………………... 47
vii
3.1.2 Primer Design ………………………………………………………. 48
3.1.3 Optimizing annealing temperature of STAT1B PCR ……………….. 50
3.1.4 Restriction digestion of STAT1B amplicon………………………… 52
3.1.5 Restriction digestion of vector DNA………………………………... 54
3.1.6 Ligation transformation of p3xFlag-STAT1B ……………………… 57
3.1.7 Verification of p3xFlag-STAT1B sub cloning by colony PCR…….. 58
3.1.8 Verification of sub-clone verification using DNA sequencing……... 60
3.2 Complementation of U3A cells with Flag-STAT1B…………………….. 62
3.2.1 Optimization of transfection conditions: amount of plasmids and
IFN-β concentration………………………………………………... 62
3.2.1.1 Experimental designation………………………………........ 62
3.2.1.2 Immunoblotting and protein analysis……………………….. 64
3.2.2 Investigating the compensation of Flag-STAT1B over longer period. 68
3.2.2.1 Experimental designation………………………………....... 68
3.2.2.2 Immunoblotting and protein analysis………………………. 69
CHAPTER 4: DISCUSSION………………………………………………. . 72
4.1 Constructing expression plasmid for Flag-STAT1B……………………. 72
4.2 Evaluating functionality of Flag-STAT1B in U3A cells………………. . 73
4.3 Future research………………………………………………………….. 77
CHAPTER 5: CONCLUSION…………………………………………........ 78
REFERENCES…………………………………………………………….... 79
APPENDICES………………………………………………………………. 86
Appendix A: DNA sequence for p3xFlag-STAT1B………………………… 86
Appendix B: ImageJ data analysis for Section 3.2.1………………………... 95
Appendix C: ImageJ data analysis for Section 3.2.2……………………....... 98
viii
LIST OF TABLES
PAGE
Table 2.1 Master mix preparation in gradient PCR……………………. 20
Table 2.2 Master mix preparation in optimized PCR………………….. 21
Table 2.3 Digestion mixture………………………………………….... 25
Table 2.4 Mixture of ligation components…………………………….. 27
Table 2.5 Colony PCR reaction mixture………………………………. 28
Table 2.6 Preparation of IFN-β (per well in 6-well plate)…………….. 36
Table 2.7 Components for resolving and stacking gel preparation….… 39
Table 6.1 ACTIN ImageJ data analysis for Section 3.2.1……………. . 95
Table 6.2 STAT2 ImageJ data analysis for Section 3.2.1……………... 96
Table 6.3 ADAR1 ImageJ data analysis for Section 3.2.1…………….. 97
Table 6.4 ACTIN ImageJ data analysis for Section 3.2.2……………… 98
Table 6.5 STAT1 ImageJ data analysis for Section 3.2.2……………… 99
Table 6.6 STAT2 ImageJ data analysis for Section 3.2.2……………… 100
Table 6.7 PKR ImageJ data analysis for Section 3.2.2………………… 101
Table 6.8 ADAR1 ImageJ data analysis for Section 3.2.2…………….. 102
ix
LIST OF FIGURES
PAGE
Figure 1.1 A schematic diagram of viral nucleic acids recognition by
pattern recognition receptors………………………………….. . 4
Figure 1.2 Schematic diagram depicting Type I IFN response through
JAK-STAT signaling pathway ………………………………... 6
Figure 1.3 JAK-STAT signaling pathway………………………………… 9
Figure 1.4 Conserved domain for JAKs and STATs……………………… 9
Figure 1.5 Schematic diagram depicting of STAT1A and STAT1B……… 11
Figure 2.1 Observation of 2fTGH and U3A under microscope………….. 32
Figure 2.2 Apparatus for SDS-PAGE…………………………………….. 40
Figure 2.3 Sandwich assembly of foam pads, filter papers, resolving gel
and PVDF membrane in gel holder…………………………… 41
Figure 2.4 Apparatus for Western blot Blotting………………………….. 42
Figure 2.5 Software ImageJ……………………………………………..... 46
Figure 3.1 Schematic representation of sub-cloning for p3xFlag-STAT1B
vector……………………………….……………………….. 47
Figure 3.2 Multiple cloning site of p3xFlag-CMVTM-7.1………….…… 48
Figure 3.3 PCR primers and amplicon sequence…………………..…… 49
Figure 3.4 Agarose gel analysis of STAT1B gradient PCR product…… . 51
Figure 3.5 STAT1B PCR amplification for restriction digestion………. . 53
Figure 3.6 Schematic representation of p3xFlag-CMVTM-7.1 restriction
digestion………………………………………...................... 55
Figure 3.7 Purification of linearized p3xFlag-CMVTM-7.1…………….. 56
x
Figure 3.8 Transformation of ligated p3xFlag-STAT1B ……………… 58
Figure 3.9 Agarose gel analysis for colony PCR………………………. 59
Figure 3.10 DNA sequencing to verify p3xFlag-STAT1B……………… 61
Figure 3.11 Template designation for optimization of concentration of
plasmid and IFN-β…………… ………………………….. 63
Figure 3.12 Protein expression of cells treated with 1000 IU/ml IFN-β.... 66
Figure 3.13 Protein expression of cells treated with 5000 IU/ml IFN-β.... 67
Figure 3.14 Template designation for optimization of protein extraction
time and concentration of plasmid………………………...... 68
Figure 3.15 Protein expression of cells treated with 1000 IU/ml IFN-β
at different time points……………………………………… 70
Figure 3.16 Quantification of relative amount of protein to ACTIN by
ImageJ software, protein extracted at 18, 30 and 42 hours…. 71

xi
LIST OF ABBREVIATIONS
µg Micro gram
µl Microliter
ADAR1 Adenosine deaminase that act on RNA
APS Ammonium persulfate
BME Beta-mercaptoethanol
bp Base pair
BSA bovine serum albumin
CaCl2 Calcium chloride
cAMP Cyclic adenosine monophosphate
CO2 Carbon dioxide
DBD DNA binding domain
DMSO Dimethyl suloxide
DNA Deoxyribonucleic acid
dNTP Deoxynucleotide
dsRNA double-stranded RNA
EDTA Ethylenediaminetetra acetic acid
ET Essential thrombocythemia
FD Fast Digest
g gram
g gravity
GAS IFN-gamma-activated sequence
xii
HSV-1 Herpes simplex virus type 1
IFN Interferon
IFNAR Type I IFN to interferon alpha receptors
IL-12 Interleukin 12
IL-6 Interleukin 6
IRF IFN regulatory factor
IRF9 Interferon regulatory factor 9
ISG Interferon stimulated genes
IU International units
JAK Janus kinase
JH JAK homology
kb Kilo base
KCl Potassium chloride
l Liter
LB Luria Bertani media
M Molarity
MDA5 Melanoma differentiated-associated protein 5
MERS Middle East respiratory syndrome
MKH2HPO4 Monopotassium phosphate
ml Mililiter
mM Milimolar
MyD88 Myeloid differentiation primary response 88
Na2HPO4 Sodium phosphate
NaCl Sodium chloride
ng Nano gram
xiii
NOD Nucleotide-binding oligomerization domain
OD Optical density
p300-CBP E1A binding protein p300-CREB binding protein
PAGE polyacrylamide gel electrophoresis
PAMP Pathogen-associated molecular patterns
PBS Phosphate buffered saline
PCR Polymerase chain reaction
PKR Interferon-induces, dsRNA-activated protein kinase
PMF Primary myelofibrosis
PRRs Pattern-recognition receptors
PV Polycythemia vera
PVDF Polyvinylidene difluoride
RIG Retinoic acid-inducible gene
RNA Ribonucleic acid
SARS Severe acute respiratory syndrome
SDS Sodium dodecyl sulfate
ssRNA Single-stranded RNA
STAT Signal transducer and activator of transcription
TAD Transcription activation domain
TAE Tris-Acetate-EDTA
TBST Tris-buffered Saline with Tween
TEMED Tetramethylethylenediamine
TLR Toll-like receptors
TRIF TIR-domain-containing adapter-inducing interferon-β
TYK2 Tyrosine kinase 2

xiv
UV Ultraviolet
V Volt
v/v Volume per volume
VSV Vesicular stomatitis virus
xv
PENILAIAN FUNGSI FLAG-STAT1B DI SEL U3A
ABSTRAK
Wabak penyakit seperti SARS, Ebola dan Zika bukan sahaja membawa kesan negatif
kepada ekonomi dan sosial global, juga kesihatan manusia dan nyawa yang berharga.
Peranan imuniti adalah penting untuk perlindungan kesihatan. Interferon (IFN) jenis I yang
terdiri daripada IFN-α dan IFN-β dihasilkan oleh imuniti semula jadi semasa jangkitan
virus melalui interaksi host-patogen. IFN mencetuskan respons IFN yang menyumbang
kepada akitivi antivirus melalui laluan isyarat intraselular Janus kinase-signal transducer
and activator of transcription (JAK-STAT) termasuk komponen utamanya, STAT1.
Manusia STAT1 terdapat dua isoform iaitu STAT1A yang panjang sepenuh dan variasi
split STAT1B yang kekurangan sebahagian domain pengaktifan transkripsi. Kepentingan
STAT1 dalam imuniti telah terbukti oleh tikus fenotip Stat1-/- yang lebih terdedah kepada
jangkitan virus. Permahaman yang lebih lanjut terhadap laluan intraselular JAK-STAT dan
STAT1 dengan respons interferon mampu menambah pengetahuan mengenai interaksi
host-patogen dalam imuniti semula jadi. Ini mendorong projek kami sebagai kajian awal
yang bertujuan menyiasat keupayaan rekombinan Flag-STAT1B di sel U3A dalam
mengembalikan respons IFN melalui laluan JAK-STAT. Plasmid rekombinan
p3xFlag-STAT1B yang dihasilkan telah menghantar kepada sel U3A.
xvi
IFN-β telah digunakan untuk mengekspresikan sel-sel. Penyelidikan ekspresi STAT1 dan
interferon stimulated genes (ISGs) di sel U3A dilengkapi Flag-STAT1B telah dilaksanakan
melalui immunoblot dan ImageJ digunakan untuk analisis kuantitatif. Kawalan posited
adalah sel 2fTGH (STAT1A dan STAT1B) yang mendapat laluan JAK-STAT yang
sempurna. Ekspresi ISGs dalam kajian ini menunjukkan pembaikan laluan isyarat JAK-
STAT. Tetapi, eskspresi ISGs tidak dikompensasikan sepenuhnya kalau berbanding dengan
sel 2fTGH. Hasil kajian ini adalah sel U3A dilengkapi STAT1B boleh memulihkan laluan
isyarat JAK-STAT dengan sebahagian ekspresi ISGs semasa IFN-β dibagikan. Kajian ini
mampu membawa kepada kemungkinan baharu untuk mekanisme STAT1 isoforms dalam
laluan isyarat JAK-STAT dan respons IFN.
xvii
FUNCTIONAL EVALUATION OF FLAG-STAT1 IN U3A CELLS
ABSTRACT
Viral infections have had massive socio-economic impact, at the costs of human health and
invaluable lives. However, effective and broad spectrum protection against viruses is still
lacking despite best efforts. Antiviral immune defense is crucial for host protection in the
event of viral infections. Type I interferons (IFN), are key mediators for antiviral immunity,
and are induced following recognition of viral-associated molecular patterns. Type I IFNs
released to the extracellular matrix then help establish antiviral state at the cellular level in
autocrine and paracrine manner. Signaling by Type I IFNs is transduced via Janus kinase-
signal transducer and activator of transcription (JAK-STAT) pathway, leading to
upregulation of interferon stimulated genes. STAT1 is a key component of the JAK-STAT
signaling pathway, where two major isoforms: STAT1A and STAT1B are naturally
expressed during Type I IFN response. STAT1 is essential in antiviral immunity as Stat1-/-
mice are more susceptible to virus infection. However, the possibly of distinct roles of
STAT1 isoforms in antiviral immunity warrants further investigation for more
comprehensive understanding of the JAK-STAT pathway towards developing protection
against viruses. This project thereby serves as groundwork in preparation for future
research on STAT1 isoforms and their cellular functions. We aim to establish an essay
xviii
involving the expression of a functional recombinant Flag-STAT1B in U3A cells, a cell
line lacking endogenous STAT1 that is derived from 2fTGH cells. Therefore, expression
plasmid for recombinant Flag-STAT1B was constructed by sub-cloning. The expression
plasmid was transfected into U3A cells and Flag-STAT1B was successfully expressed.
When the transfected cells were challenged with IFN-β, recombinant Flag-STAT1B
partially restored the previously dysfunctional JAK-STAT signaling pathway in U3A cells.
Protein expression levels of several interferon stimulated genes were semi-quantitatively
analyzed through immunoblotting and ImageJ. From our results, overexpression of
STAT1B without STAT1A in U3A cells could not fully restore the JAK-STAT signaling
pathway. While more research is necessary, our work suggest that the different STAT1
isoforms may have overlapping but yet distinct roles at the cellular level during Type I
interferon response. Further investigation may lead to novel understanding about the
mechanism of STAT1 isoforms and their impact on host antiviral immunity.
1
CHAPTER 1: INTRODUCTION
1.1 Background
Over the past two decade, viral outbreaks such as Zika, Ebola, Middle East respiratory
syndrome (MERS), severe acute respiratory syndrome (SARS), avian flu virus has
dominated headlines and captured the public attention. SARS epidemic outbreak origin
from southern China have spread globally and over 8000 cases had reported in 37 countries
from 2002-2013. Avian influenza virus have transmit from Asia to Africa and Europe since
2003 and re-emerging in China in 2017 involving avian influenza A(H7N9) virus. MERS
cause by MERS coronavirus first reported in Saudi Arabia at 2012 had spread to several
countries included Malaysia. Recent Ebola virus outbreak in West Africa and Zika virus
disease outbreak that causes fetal neurological disease (World Health Organization, 2017;
Centers for Disease Control and Prevention, 2017).
On the other hand, despite concerted effort from the biomedical community, proper cure
from disease chronic viral infections like acquired immune deficiency syndrome and
Hepatitis has not been found, though disease management has been improved. All of these
showed the inadequate understanding of viral-host interaction. To prevent future emerging
viral outbreaks and to manage persistent virus infections, it is necessary for further research
on both viruses and human immune system, and their interactions.
Immunity system in human can be generally divided into innate and adaptive immunity.
Innate immune response is less specific against pathogens. Cellular components of innate
immunity are ready prior to infection and can be activated rapidly for onset of immune
defense. On the other hand, adaptive immune response is slower but more specific, as
2
lymphocytes activation and antibody production are driven by encountered antigen. Both
innate and adaptive immune system are communicative and heavily interlinked (Koyama et
al., 2008).
1.2 Innate Immunity
Host innate immunity plays a vital role as rapid first line defense against viral infection
before the slow onset of adaptive immune system. Host innate immunity on self can
distinguish between “self” and “non-self” biomolecules. Immune cells involved innate
immunity including natural killer cells, phagocytic cells and inflammatory cells. An innate
immunity response is elicited upon recognition of pathogen-associated molecular patterns
(PAMPs) by pattern-recognition receptors (PRRs) (Noakes and Michaelis, 2013). Toll-like
receptors (TLRs) are either expressed on cell membrane or associated with intracellular
vesicles that enable both extracellular and cytoplasmic recognition of the PAMPs. Retinoic
acid-inducible gene I-like receptors (RIG-I-like receptors) and nucleotide-binding
oligomerization domain-like receptors (NOD-like receptors) are involved in cytoplasmic
PAMPs detection (Nakhaei et al., 2009). Distinct PAMPs derived from viruses, bacteria,
mycobacteria, fungi and parasites are detected by specific PRRs. For example, viral DNA
is recognized by TLR9 whereas viral RNA cache detected by TLR3, TLR7 and TLR8.
Activation of PRRs will then leads to signaling cascade adaptor proteins and induce Type I
Interferon (IFN) or pro-inflammatory cytokines production (Kawai and Akira, 2010,
Nguyen et al., 2016). Type I IFN then induce IFN response via Janus kinase-signal
transducer and activator of transcription (JAK-STAT) signaling pathway.
3
1.3 Interferon (IFN)
IFN was first discovered in 1957, based on its ability to interfere with the life cycle and
replication of influenza virus in chick embryo cells (Isaacs and Lindenmann, 1957). After
that, subsequent studies revealed many different types of IFNs. IFNs have antiviral
properties, plays a role in bridging innate and adaptive immunity and regulate cell cycle
(Mossman, 2011). Human IFN could be classified into 3 classes: Type I, Type II and Type
III. Type I IFN comprised of IFN-α and IFN-β are the principle cytokines mediating
antiviral response and can be expressed by all nucleated cells upon viral infection (Koyama
et al., 2008). IFN-γ is the only Type II IFN, secreted by natural killer cells and T cells
responsible for immunoregulatory in innate and adaptive immunity (Saha et al., 2010).
Type III IFNs, such as IFN-λ1, IFN-λ2 and IFN-λ3 has been discovery recently to possess
antiviral properties as well. Induction of IFN-λ are independent on IFN regulatory factor
(IRF) and nuclear factor-kappaβ (Iversen and Paludan, 2010). IFNs induce interferon
stimulated genes (ISGs) via JAK-STAT signaling pathway.
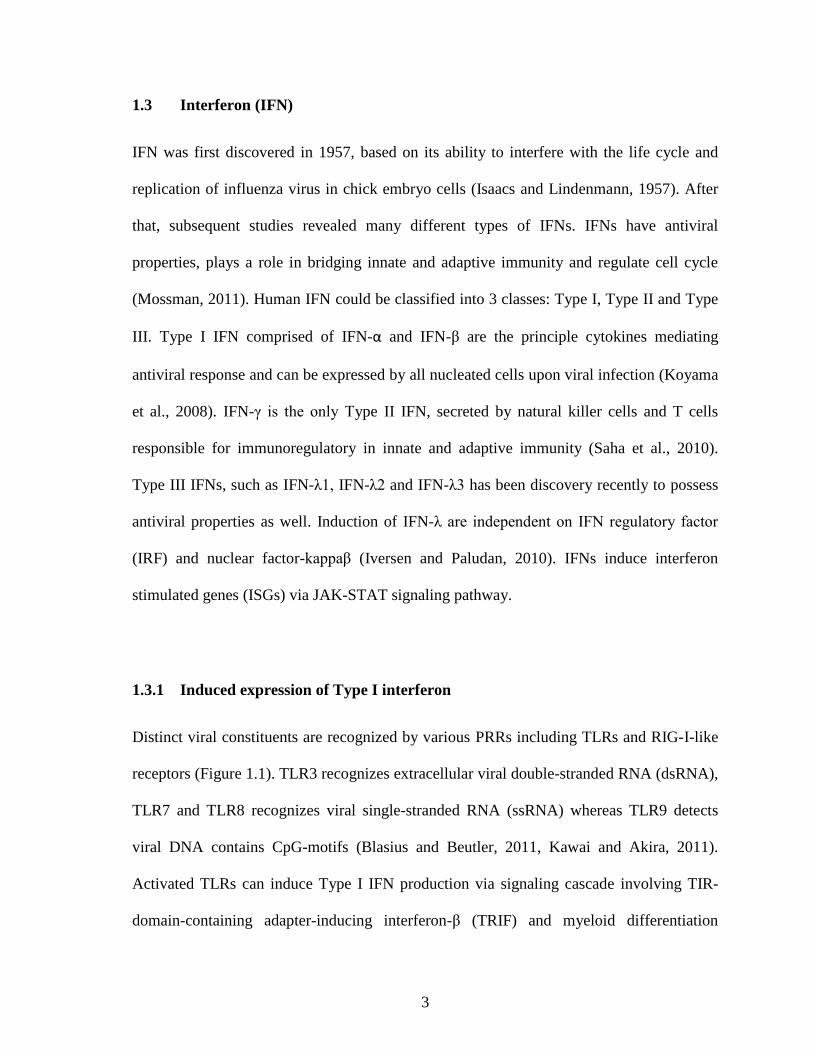
1.3.1 Induced expression of Type I interferon
Distinct viral constituents are recognized by various PRRs including TLRs and RIG-I-like
receptors (Figure 1.1). TLR3 recognizes extracellular viral double-stranded RNA (dsRNA),
TLR7 and TLR8 recognizes viral single-stranded RNA (ssRNA) whereas TLR9 detects
viral DNA contains CpG-motifs (Blasius and Beutler, 2011, Kawai and Akira, 2011).
Activated TLRs can induce Type I IFN production via signaling cascade involving TIR-
domain-containing adapter-inducing interferon-β (TRIF) and myeloid differentiation
4
primary response 88 (MyD88) (Piras and Selvarajoo, 2014). Cytoplasmic viral ssRNA and
dsRNA can also be recognized by RIG-I-like receptors such as retinoic acid-inducible gene
I receptors (RIG-I) and melanoma differentiated-associated protein 5 (MDA5), eventually
leading to IFN-α/β expression via downstream cascade involving mitochondrial antiviral
signaling protein (Dixit and Kagan, 2013).
Figure 1.1: A schematic diagram of viral nucleic acids recognition by pattern
recognition receptors. Viral nucleic acid can be detected by Toll-like receptors, RIG-I like
receptors, NOD-like receptors and intracellular DNA receptors. Detection of viral
constituents induces Type I IFN production and response to viral infection. [Figure is from
(Crouse et al., 2015)].
5
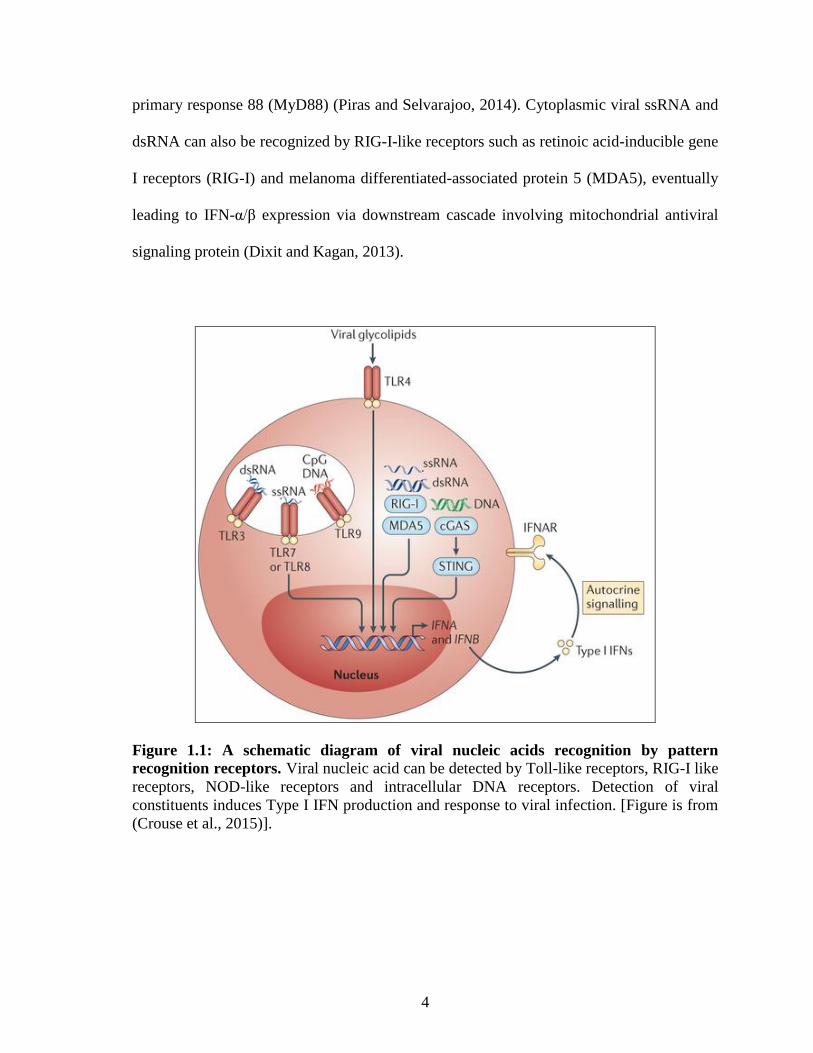
1.3.2 Type I interferon response
ISGs is quiescent and has low basal expression in general for unstimulated cells.
Expression of ISGs can be induced by Type I IFN via JAK-STAT intracellular signaling
pathway (Figure 1.2). Collectively, expression of ISGs with establish antiviral response in
host cells (Leaman et al., 1998). Type I IFN to interferon alpha receptors (IFNARs)
receptors for Type I IFN ligand composed of IFNAR1 and IFNAR2 subunits, associated
with kinases tyrosine kinase 2 (TYK2) and Janus kinase 1 (JAK1) respectively. Binding of
IFNARs will trigger dimerization of receptors that further activates JAK1 and TYK2.
Activated JAK1 and TYK2 then phosphorylate tyrosine residue on IFNARs and in turn
mediate the recruitment of signal transducer and activator of transcriptions 1 (STAT1) and
signal transducer and activator of transcriptions 2 (STAT2) via their SH2 domains
(Schindler et al., 1992, Darnell et al., 1994). Next, phosphorylation of the recruited STAT1
and STAT2 will lead to formation of STAT1/STAT2 heterodimers. STAT1/STAT2 dimers
associated with interferon regulatory factor 9 (IRF9) to form interferon stimulatory gene
factor 3 (ISGF-3), a potent transcription factor that translocates into the nucleus. ISGFs
binds to IFN-stimulated response elements (ISRE; AGTTTNNNTTTCC) in the promoter
region of many ISGs, promoting transcription of those ISG (Schindler et al., 1992,
Schindler et al., 2007). ISGs included ADAR1, PKR, MX1, OAS1 and also gene involved in
JAK-STAT signaling pathway such as STAT2 and IRF9.
6
Figure 1.2: Schematic diagram depicting Type I IFN response through JAK-STAT
signaling pathway. (1) Binding of Type I IFN stimulates dimerization of IFNAR1 and
IFNAR2. (2) Activated IFNAR transphosphorylate TYK2 and JAK1. (3) Phosphorylated
Janus kinases (JAKs) in turn phosphorylate tyrosine residues on IFNARs, (4) which
provide docking site to STAT2. (5) STAT2 subsequently phosphorylated by JAKs. It
recruits and activates STAT1 leading to STAT1/STAT2 dimerization. (6) STAT1/STAT2
dimers together with IRF9 formed ISGF3, translocate into nucleus and bind to IFN-
stimulated response elements (ISRE) for ISGs expression. [Figure is from (Suprunenko and
Hofer, 2016)].
7
1.4 JAK-STAT signaling
The JAK-STAT is an important intracellular signaling pathway in response to various
cytokines. Different combination of JAKs and signal transducer and activator of
transcriptions (STATs) are activated in response to different ligands (Figure 1.3). For
example, IFN-R family activates STAT1, STAT2, STAT3 and STAT5 whereas IL-3R
family only activates STAT5 (Figure 1.3). The pathway transduces information from the
extracellular environment to the nucleus by STATs dimer translocation and stimulates
corresponding gene expression in accordance to the extracellular signal. As such, JAK-
STAT signaling is vital for fundamental cellular process such as cell proliferation,
differentiation, apoptosis, immunity development, hematopoiesis and homeostasis
(Rawlings et al., 2004, Pfitzner et al., 2004, Song et al., 2011, Coskun et al., 2013).
1.4.1 JAKs
The four members of JAKs family, JAK1, JAK2, JAK3 and TYK2 range in sizes between
120-140 kDa. JAKs are composed of seven conserved JAK homology (JH) domains
(Figure 1.4A), where JH1 and JH2 are kinase domains responsible for phosphorylation of
receptors and STATs. Meanwhile, the N-terminal domains (JH4-JH7) mediates interaction
with receptors and JH3 binding to phosphorylated tyrosine (Schindler et al., 2007, Coskun
et al., 2013).
8
1.4.2 STATs
STATs family comprised of seven members: STAT1, STAT2, STAT3, STAT4, STAT5A,
STAT5B and STAT6. Sizes of STATs range from 750-900 amino acids and consist of
seven conserved domains (Figure 1.4B). All the conserved STAT1 domains are known for
distinct functions, where: the N-terminal (NH2) domain is important in STATs dimerization
at inactive state; the hydrophilic surface of coiled-coil domain is critical for regulators
binding; the DNA-binding domain determines the DNA binding specificity in the nucleus;
the SH2 domain crucial in STAT recruitment to the activated receptors and dimerization;
the tyrosine activation domain at around 700 amino acid residues; and C-terminal
transcription activation domain (TAD) involved in driving transcription through
association with transcriptional regulators (Hoey and Schindler, 1998, Schindler et al.,
2007).
9
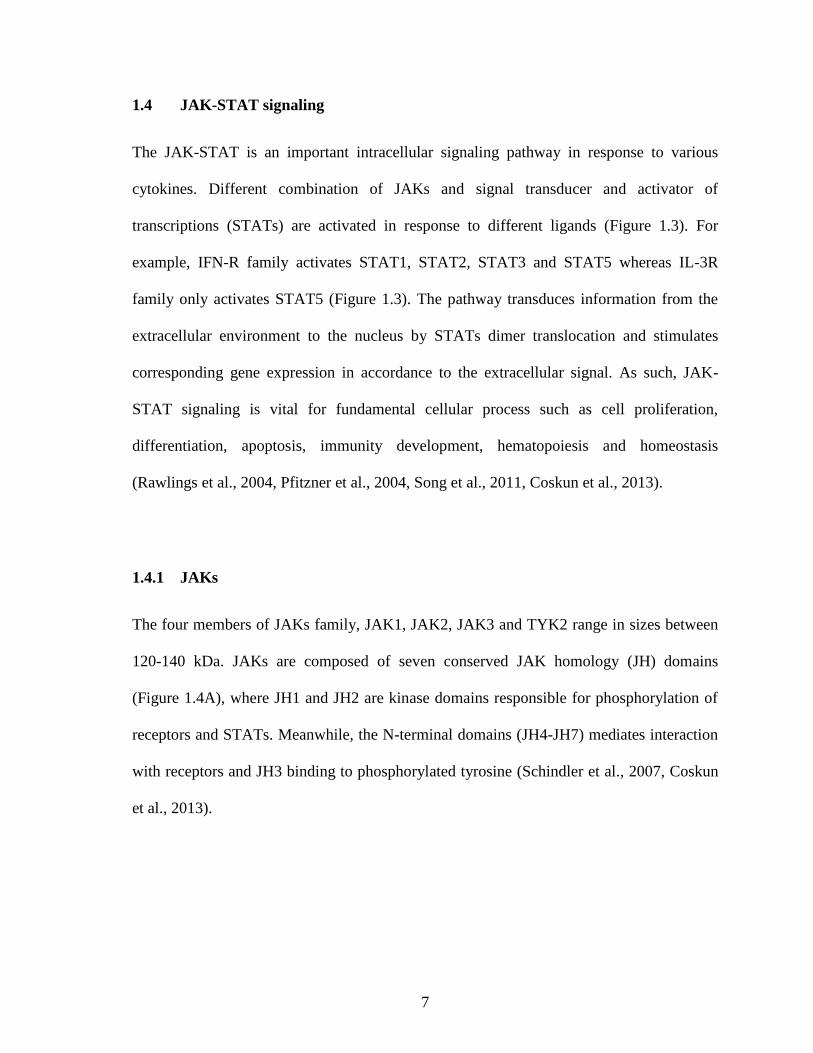
Figure 1.3: JAK-STAT signaling pathway. Different JAKs and STATs are involved in
mediating signals from different cytokines. STATs dimer or associated with regulator
translocate into nucleus, binds to IFN-stimulated response elements (ISRE) and simulate
interferon stimulated genes (ISGs) transcription. [Figure is from (Coskun et al., 2013)].
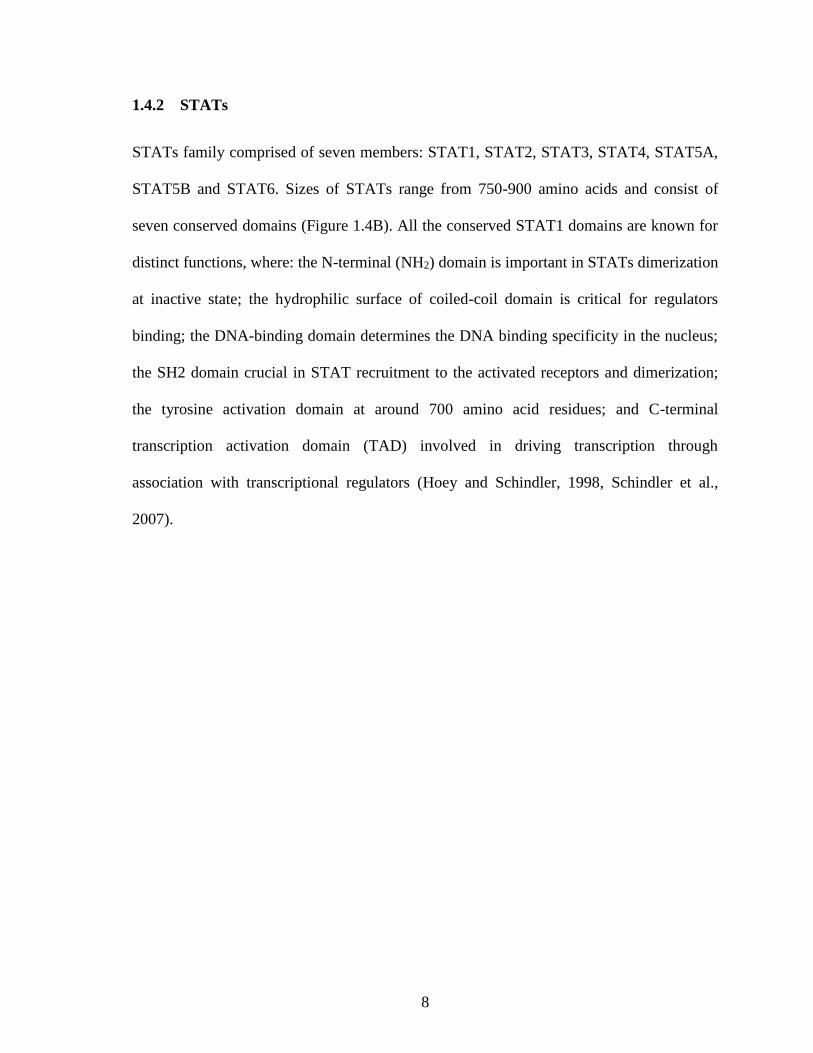
Figure 1.4: Conserved domain for JAKs and STATs. (A) General structure of JAKs,
consists of seven JH domains, JH1-7. (B) Structure of STAT with seven conserved
domains including amino-terminal (NH2) domain, coiled-coil domain, DNA binding
domain (DBD), linker domain (LK), SH2 domain, tyrosine activation domain and
transcription activation domain (TAD). [Figure is from (Schindler et al., 2007)].
10
1.5 STAT1
Transcriptional activation studies following exposure to IFN established a multitude of
expressed genes (ISGs). A consensus sequence (ISRE) was discovered at the promoter
region of ISGs, and the corresponding transcriptional factor was identified as ISGF-3.
Protein purification revealed that ISGF-3 is a protein complex with four proteins with sizes
113, 91, 84, 48 kDa, respectively. The proteins were named subsequently STAT1A (p91),
STAT1B (p84) and STAT2 (p113) due to their dual function as signal transducers and
activators of transcription, whereas p48 was later identified as IRF9. STAT1 and STAT2
were the first identified STAT proteins (Shuai et al., 1992, Schindler et al., 1992).
STAT1 activation by phosphorylation at tyrosine 701 can be induced by various ligands
such as IFN, platelet-derived growth factor, IL-6 and IL-12. Activated STAT1 will then
form heterodimer under most circumstances, except in response to IFN-γ that leads to
STAT1 homodimerisation in turn binding to IFN-gamma-activated sequence (GAS) in the
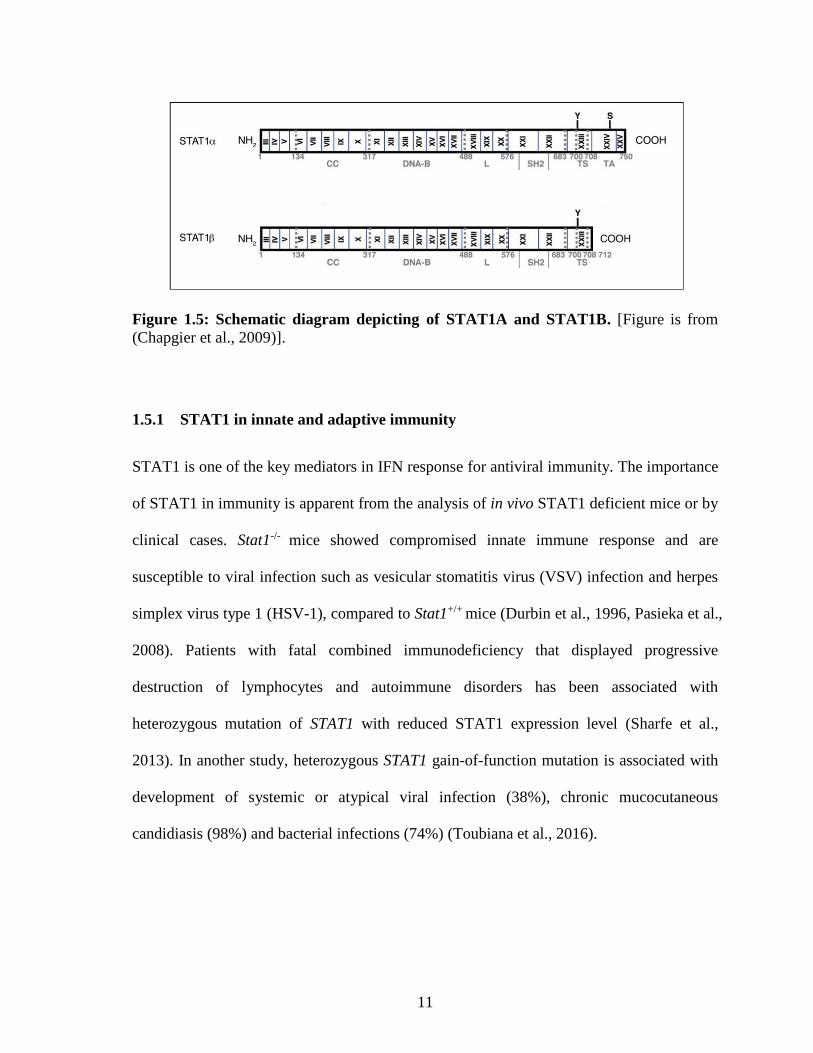
nucleus (Wegenka et al., 1994). There are two natural isoforms of STAT1, the full length
STAT1A (750 amino acids) and smaller split variant STAT1B (712 amino acids). STAT1B
lacks the last 38 residues within the TAD, compared to STAT1A (Figure 1.5). The
variation arise from alternative splicing event, where STAT1A mRNA has 25 exons while
STAT1B mRNA only has 23 spliced exons (Darnell et al., 1994, Chapgier et al., 2009).
STAT1B that lacks part of the TAD is unable to bind to E1A binding protein p300-CREB
binding protein (p300-CBP) coactivator family (Zhang et al., 1996).
11
Figure 1.5: Schematic diagram depicting of STAT1A and STAT1B. [Figure is from
(Chapgier et al., 2009)].
1.5.1 STAT1 in innate and adaptive immunity
STAT1 is one of the key mediators in IFN response for antiviral immunity. The importance
of STAT1 in immunity is apparent from the analysis of in vivo STAT1 deficient mice or by
clinical cases. Stat1-/- mice showed compromised innate immune response and are
susceptible to viral infection such as vesicular stomatitis virus (VSV) infection and herpes
simplex virus type 1 (HSV-1), compared to Stat1+/+ mice (Durbin et al., 1996, Pasieka et al.,
2008). Patients with fatal combined immunodeficiency that displayed progressive
destruction of lymphocytes and autoimmune disorders has been associated with
heterozygous mutation of STAT1 with reduced STAT1 expression level (Sharfe et al.,
2013). In another study, heterozygous STAT1 gain-of-function mutation is associated with
development of systemic or atypical viral infection (38%), chronic mucocutaneous
candidiasis (98%) and bacterial infections (74%) (Toubiana et al., 2016).
12
1.5.2 STAT1 in haematopoiesis
Haematopoiesis or haemopoiesis describe the formation of blood cells, including formation
of erythrocytes (erythropoiesis), platelet (thrombocytosis), lymphocytes (lymphocytosis)
and granulocytes and monocytes (myelopoiesis). Site of haematopoiesis varies at different
stage of growth, including yolk sac, liver, spleen and bone marrow at fetal state; all bone
marrows during infancy; and at bone marrow of only central bones during adulthood.
Besides, thymus, spleen and lymph nodes are also involve in maturation and proliferation
of blood cells. All blood cells are derived from pluripotent haematopoietic stem cell (HSC).
Differentiation, maturation and proliferation of different lineage progenitor cells and
mature blood cells are regulated by haematopoietic growth factors (Hoffbrand and Moss,
2011).
STAT1 in hematopoiesis regulation have been demonstrated in various STAT1 deficient
models. STAT1 deficient mice showed 1.6 fold reduction in of total body colony forming
unit-erythroid, delayed differentiation and increased apoptosis of early erythroblasts in
bone marrow (Halupa et al., 2005). The importance of STAT1A and STAT1B in zebrafish
embryonic hematopoiesis was studied by Song, et al. (2011), which revealed distinct roles
for the isoforms in hematopoiesis. Knockdown of stat1b in zebrafish embryo led to
increased scl (hematopoietic progenitor marker), denser gata1 (erythrocyte marker) and
increased hemoglobin-producing cells compared to stat1a knockdown and control without
stat1 knockdown (Song et al., 2011).
13
1.5.3 STAT1 in myeloproliferative neoplasms (MPNs)
Myeloproliferative neoplasms (MPNs) are hematological malignancies characterized with
overproduction of blood cells either erythrocyte, leukocyte, thrombocyte or granulocyte
which can brings significant morbidity and mortality (Tefferi and Vardiman, 2008). MPN
patient suffer from fatigue, pruritus, night sweats and bone pain (Mesa et al., 2007).
Hematopoietic tumor disorders classified under MPNs include chronic myelogenous
leukemia (BCR-ABL1-positive), chronic neutrophilic leukemia, polycythemia vera (PV),
primary myelofibrosis (PMF), essential thrombocythemia (ET), chronic eosinophilic
leukemia (not otherwise specified), myeloproliferative neoplasms (unclassifiable) and
mastocytosis (Vardiman et al., 2009). Mutation or genetic changes in hematopoietic stem
cell is the main reason for MPNs, by causing gain of multilineage differentiation ability
and myelopoiesis. JAK2, MPL, TET2, ASCL1, IDH1, IDH2, CBL, IKZF1, LNK and EZH2
are known mutation associated with MPNs (Tefferi and Vainchenker, 2011). In PV, ET and
PMF, the most prevalent mutation recognized in these three MPNs is JAK2V617F, found in
about 96% of PV and 55% of ET and 65% of PMF (Tefferi, 2010).
High IFN and STAT1 plays a role in promoting ET phenotype in JAK2V617F positive
MPNs. JAK2V617F mice displayed higher IFN level than non-transgenic mice (Chen et al.,
2010), and JAK2V617F/Stat1+/+ mice had higher megakaryopoiesis and reduced
erythropoiesis compared to JAK2V617F/Stat1-/- mice (Duek et al., 2014). However, the
molecular mechanism of IFN/STAT1 in promoting ET phenotype is not well understood.

14
1.5.4 STAT1 in cancer
Majority of the studies on the role of STAT1 in cancer was done using animal models.
STAT1 is thought to be tumour suppressive, but recent a study revealed that STAT1 may
promote tumourigenesis (Meissl et al., 2015). The expression of STAT1 leads to favorable
prognosis in several cancers, such as hepatocellular carcinoma, breast cancer, colorectal
carcinoma and pancreatic cancer (Gordziel et al., 2013, Sun et al., 2014). Overexpression
of STAT1 was found to inhibit proliferation of HepG2 cells (human hepatocellular cancer
cells) (Chen et al., 2013) while Stat1-/- female mice develop spontaneous mammary
adenocarcinomas . Furthermore, STAT1-/- mammary cancer cells underwent apoptosis after
introduction of functional STAT1 (Chan et al., 2012).
However, STAT1 may also confer promotion to tumour cells. CD95 stimulation of cancer
cells leads to increased production of Type I IFN, which causes STAT1 activation and
results in cancer therapy resistance. STAT1 knockdown or knockout cells have reduced
capability in sustaining the stemness of cancer cells by CD95 ligand and Type I IFN (Qadir
et al., 2017). In addition, overexpression of STAT1 was found to impair apoptosis via IL-6
and IL-8 production (Efimova et al., 2009); whereas increased STAT1 and CD74 in triple-
negative breast cancer was shown to promote tumour invasion and metastasis (Greenwood
et al., 2012).
15
1.6 Aim of study
Our lab is interested in the JAK-STAT signaling pathway during Type I IFN response. For
that, we have acquired 2fTGH cells and its derivative U2A, U3A, U5A, U6A cells lines
(deficient in IRF9, STAT1, STAT2 and IFNAR, respectively from Prof. George Stark
(Cleveland clinic, USA). My project is a preliminary study aiming to determine the
feasibility of using U3A cells and restored recombinant STAT1 as a model system for
STAT1 research. In particular, I need to determine if recombinant STAT1 protein functions
similarly to endogenous STAT1 protein during Type I IFN response.
1.6.1 General objective
Plasmid construction and to characterize the function of overexpressed Flag-STAT1B in
restoring the JAK-STAT signaling pathway in response to Type I IFN, using U3A cells.
1.6.2 Specific objectives
1) To construct recombinant plasmid expressing Flag-STAT1B by sub-cloning
STAT1B into p3xFlag-CMVTM-7.1 vector plasmid.
2) To induce Flag-STAT1B overexpression in U3A cells.
3) To evaluate the restoration of JAK-STAT signaling pathway in U3A cells,
expressing Flag-STAT1B when induced by IFN-β.
16
CHAPTER 2: MATERIALS AND METHODS
2.1 Preparation of expression plasmids
2.1.1 Escherichia coli
2.1.1.1 Escherichia coli strain
Genotype of TOP 10 Escherichia coli: F- mcrA Δ( mrr-hsdRMS-mcrBC) Φ80lacZΔM15
Δ lacX74 recA1 araD139 Δ( araleu)7697 galU galK rpsL (StrR) endA1 nupG
2.1.1.2 Bacteria growth medium
* Ampicillin (Roscillin®, Ranbaxy Laboratories Limited)
* LB AGAR (LENNOX) (Laboratories CONDA; pH 7.0 ± 0.2 at 25 ºC; 15 g
Bacteriological Agar, 5 g NaCl, 10 g Tryptone, 5 g Yeast Extract)
* LB BROTH (LENNOX) (Laboratories CONDA; pH 7.0 ± 0.2 at 25 ºC; 5 g NaCl,
10 g Tryptone, 5 g Yeast Extract)
Preparation of LB broth:
For 1 liter of LB broth, 20 g of LB BROTH (LENNOX) was dissolved in distilled water to
make up to 1 liter. The LB broth was autoclaved before use. It was kept in room
temperature for further use.
Preparation of LB agar plate with Ampicillin:
A total 5.25 g of LB AGAR (LENNOX) was dissolved in 150 ml of distilled water, and
then autoclaved. The LB agar solution was allowed to cool down before 150 µl of 100 mg/l
Ampicillin was added to a final concentration of 100 µg/ml. The LB agar (with Ampicillin)
was then poured into petri dish (8- 9 plates) for solidification at room temperature. The
17
process normally took around 40 minutes. Solidified LB agar/Ampicillin plates were sealed
with parafilm and kept at – 42 ºC until further use.
2.1.1.3 Preparation of Escherichia coli glycerol stock
One ml of cryopreserved Escherichia coli was inoculated into 9 ml of LB broth and
incubated overnight at 37 ºC in shaking incubator (INFORS HT Minton) at 200 rpm.
Overnight bacteria culture, every 200 µl of the Escherichia coli culture was mixed well
with 100 µl of glycerol and froze in dry ice before stored at – 80 ºC. They were kept as
cryopreserve Escherichia coli stock.
2.1.1.4 Preparation of competent Escherichia coli
* CaCl2 (R&M Chemicals)
* Glycerol (R&M Chemicals)
One ml from the overnight bacteria culture (Section 2.1.1.3) was transferred into fresh 100
ml LB broth to make chemical competent cells. OD of the bacteria culture was measured
using spectrophotometer (Eppendorf) at wavelength 600 nm until the OD600 reached
approximately 0.5. At 2 hours incubation in shaking incubator (INFORS HT Minton) at
37 ºC, the OD600 reading was 0.5598. The 100 ml bacteria culture was splitted into two 50
ml volume in centrifuge tubes and centrifuged at 4 ºC, 2400 x g for 10 minutes.
Supernatant was discarded and the pellet was resuspended with pre-chilled 15 ml of 0.1M
CaCl2. The resuspended bacteria was incubated in ice for 15 minutes before centrifuged
again at 4 ºC, 2400 x g for 10 minutes were repeated two more times. After the third
18
centrifugation, the bacteria pellet was resuspended in 2 ml of 0.1 M of CaCl2 with 20% (v/v)
glycerol. Two hundred µl of chemical competent Escherichia coli was aliquoted into each
pre-chilled microcentrifuge tube and quickly frozen in dry ice. The chemical competent
cells were stored at – 80 ºC.
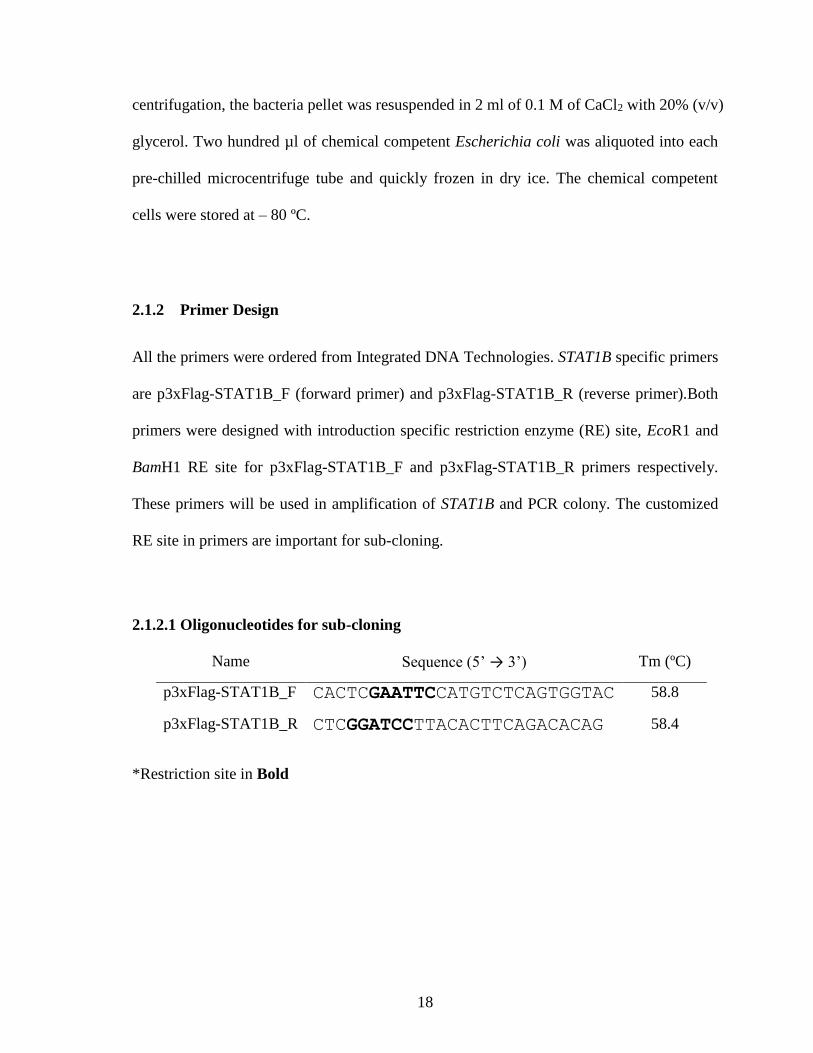
2.1.2 Primer Design
All the primers were ordered from Integrated DNA Technologies. STAT1B specific primers
are p3xFlag-STAT1B_F (forward primer) and p3xFlag-STAT1B_R (reverse primer).Both
primers were designed with introduction specific restriction enzyme (RE) site, EcoR1 and
BamH1 RE site for p3xFlag-STAT1B_F and p3xFlag-STAT1B_R primers respectively.
These primers will be used in amplification of STAT1B and PCR colony. The customized
RE site in primers are important for sub-cloning.
2.1.2.1 Oligonucleotides for sub-cloning
Name Sequence (5’ → 3’) Tm (ºC)
p3xFlag-STAT1B_F CACTCGAATTCCATGTCTCAGTGGTAC 58.8
p3xFlag-STAT1B_R CTCGGATCCTTACACTTCAGACACAG 58.4
*Restriction site in Bold
19
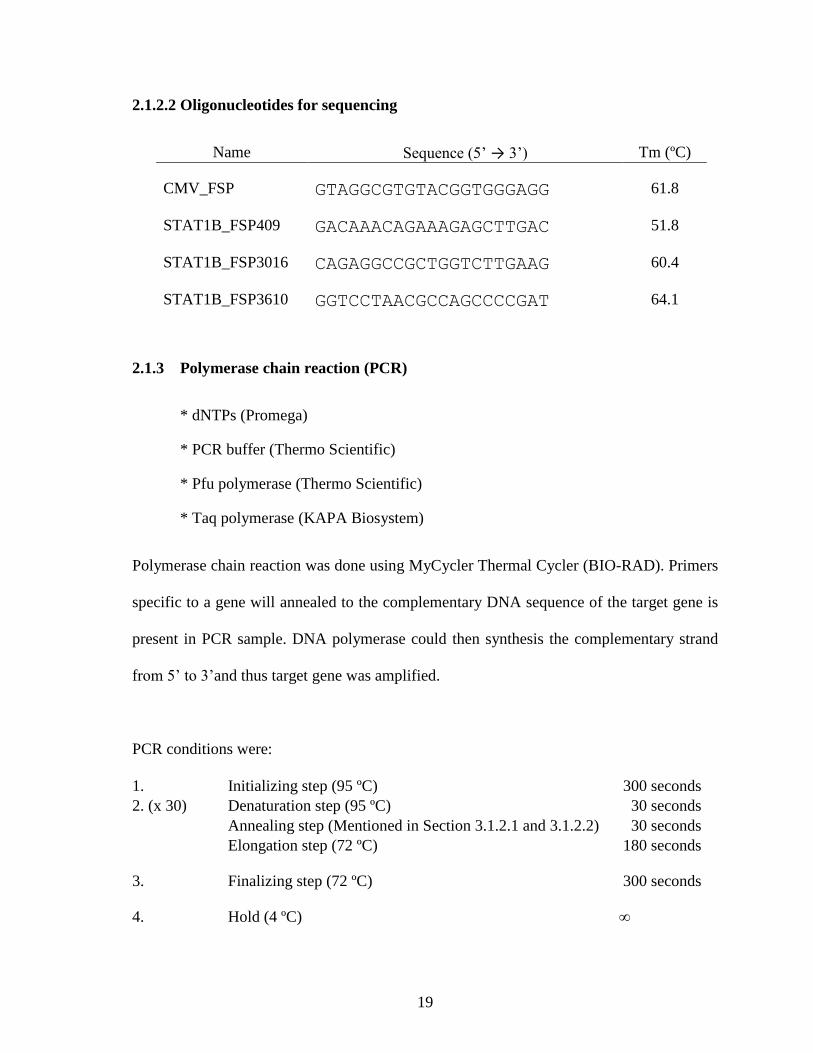
2.1.2.2 Oligonucleotides for sequencing
Name Sequence (5’ → 3’) Tm (ºC)
CMV_FSP GTAGGCGTGTACGGTGGGAGG 61.8
STAT1B_FSP409 GACAAACAGAAAGAGCTTGAC 51.8
STAT1B_FSP3016 CAGAGGCCGCTGGTCTTGAAG 60.4
STAT1B_FSP3610 GGTCCTAACGCCAGCCCCGAT 64.1
2.1.3 Polymerase chain reaction (PCR)
* dNTPs (Promega)
* PCR buffer (Thermo Scientific)
* Pfu polymerase (Thermo Scientific)
* Taq polymerase (KAPA Biosystem)
Polymerase chain reaction was done using MyCycler Thermal Cycler (BIO-RAD). Primers
specific to a gene will annealed to the complementary DNA sequence of the target gene is
present in PCR sample. DNA polymerase could then synthesis the complementary strand
from 5’ to 3’and thus target gene was amplified.
PCR conditions were:
1. Initializing step (95 ºC) 300 seconds
2. (x 30) Denaturation step (95 ºC) 30 seconds
Annealing step (Mentioned in Section 3.1.2.1 and 3.1.2.2) 30 seconds
Elongation step (72 ºC) 180 seconds
3. Finalizing step (72 ºC) 300 seconds
4. Hold (4 ºC) ∞
20
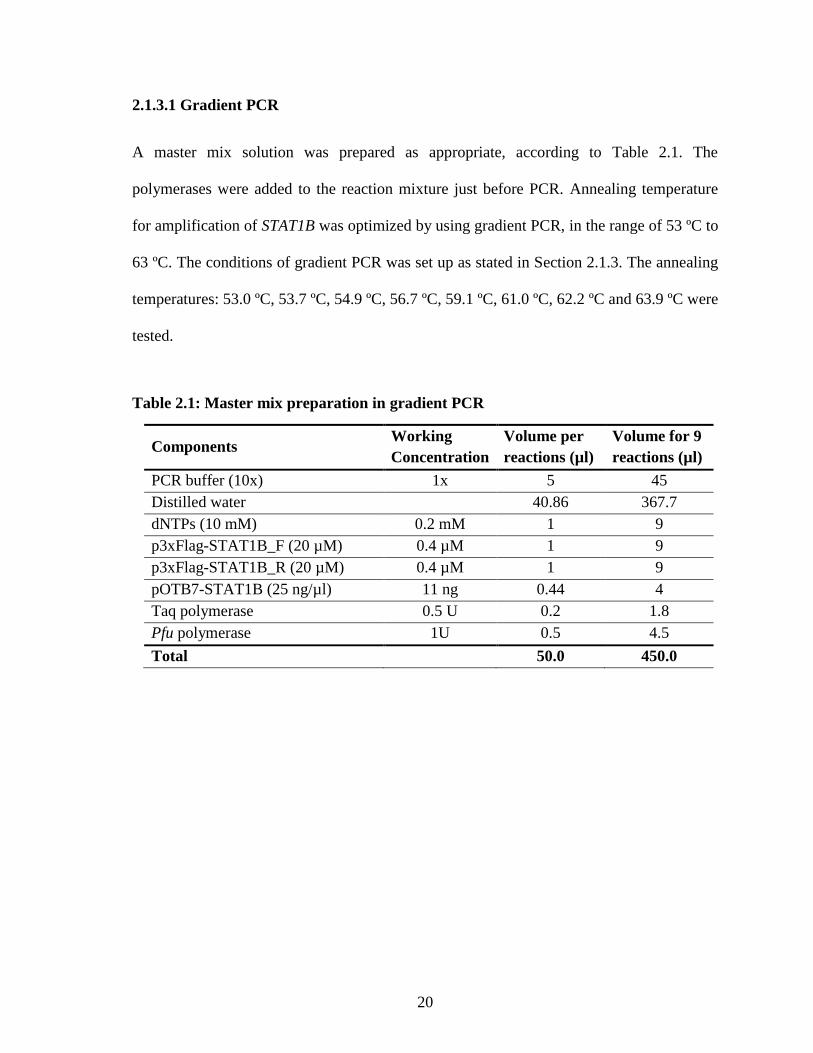
2.1.3.1 Gradient PCR
A master mix solution was prepared as appropriate, according to Table 2.1. The
polymerases were added to the reaction mixture just before PCR. Annealing temperature
for amplification of STAT1B was optimized by using gradient PCR, in the range of 53 ºC to
63 ºC. The conditions of gradient PCR was set up as stated in Section 2.1.3. The annealing
temperatures: 53.0 ºC, 53.7 ºC, 54.9 ºC, 56.7 ºC, 59.1 ºC, 61.0 ºC, 62.2 ºC and 63.9 ºC were
tested.
Table 2.1: Master mix preparation in gradient PCR
Components Working
Concentration
Volume per
reactions (µl)
Volume for 9
reactions (µl)
PCR buffer (10x) 1x 5 45
Distilled water
40.86 367.7
dNTPs (10 mM) 0.2 mM 1 9
p3xFlag-STAT1B_F (20 µM) 0.4 µM 1 9
p3xFlag-STAT1B_R (20 µM) 0.4 µM 1 9
pOTB7-STAT1B (25 ng/µl) 11 ng 0.44 4
Taq polymerase 0.5 U 0.2 1.8
Pfu polymerase 1U 0.5 4.5
Total 50.0 450.0


