Functional Genomics Vol. 405, No. 6788 (15 June 2000). Feeding from the flood of data be produced by genome sequencing projects, functional genomics is helping us make sense of all those A’s, C’s, G’s and T’s. This collection of reviews examines the role of computers in this work, microarray technology, proteomics and the emerging field of pharmacogenetics. Functional genomics | Full text | PDF (202 K) | 819 Exploring genome space OGNJENKA GOGA VUKMIROVIC AND SHIRLEY M. TILGHMAN The completion of entire genome sequences of many experimental organisms, and the promise that the human genome will be completed in the next year, find biology suddenly awash in genome-based data. Scientists are scrambling to develop new technologies that exploit genome data to ask entirely new kinds of questions about the complex nature of living cells. | First paragraph | Full text | PDF (208 K) | 820 Protein function in the post- genomic era DAVID EISENBERG, EDWARD M. MARCOTTE, IOANNIS XENARIOS & TODD O. YEATES | Summary | Full text | PDF (222 K) | 823
Transcript
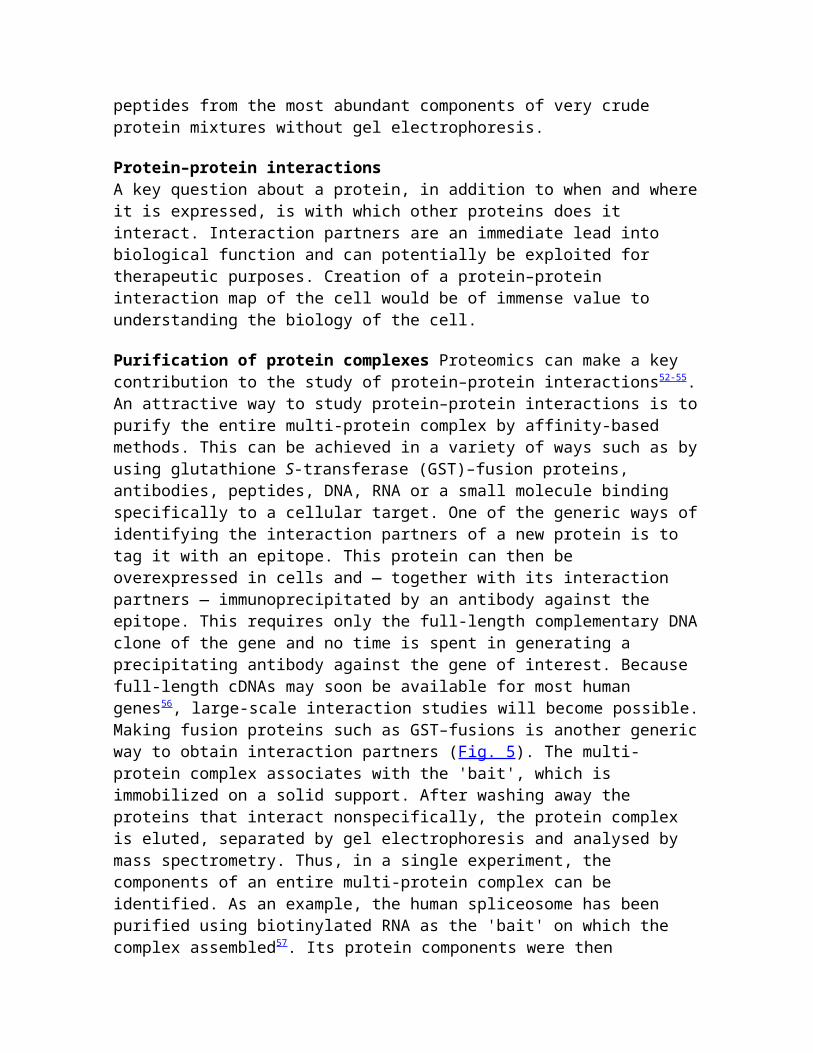
Functional Genomics
Vol. 405, No. 6788 (15 June 2000).
Feeding from the flood of data be produced by genome sequencing projects, functional genomics is helping us make sense of all those A’s, C’s, G’s and T’s. This collection of reviews examines the role of computers in this work, microarray technology, proteomics and the emerging field of pharmacogenetics.
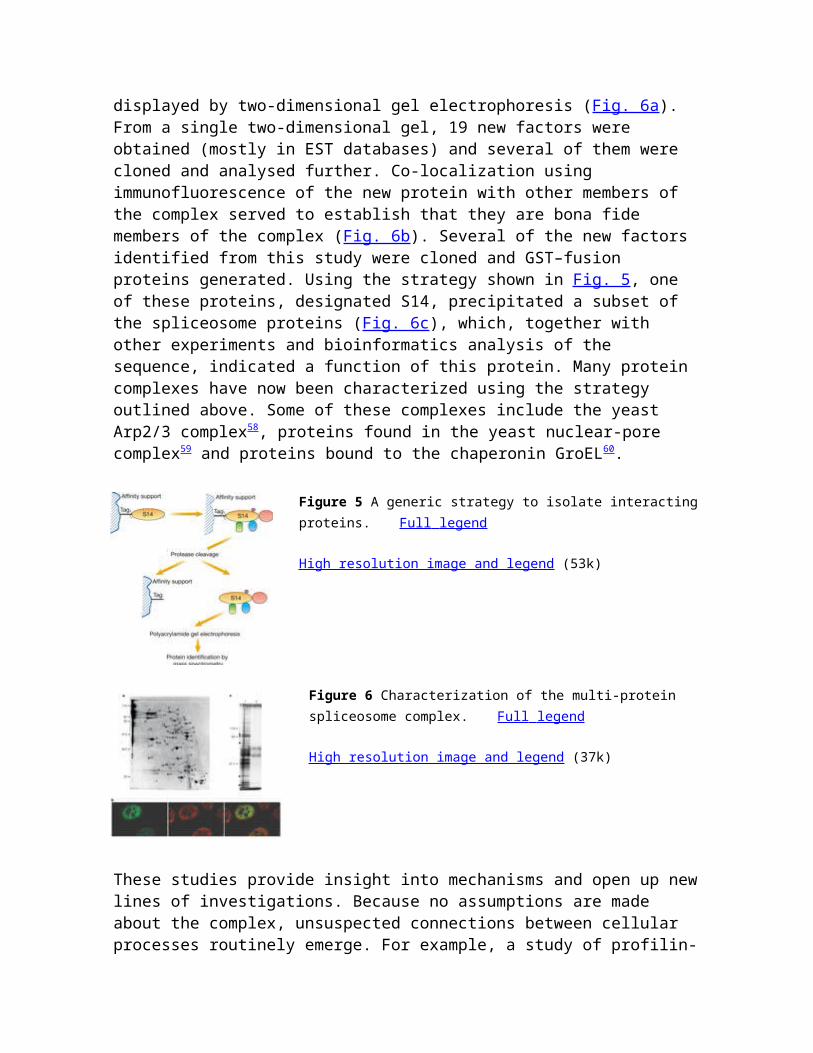
Functional genomics | Full text | PDF (202 K) |
819
Exploring genome space OGNJENKA GOGA VUKMIROVIC AND SHIRLEY M. TILGHMANThe completion of entire genome sequences of many experimental organisms, and the promise that the human genome will be completed in the next year, find biology suddenly awash in genome-based data. Scientists are scrambling to develop new technologies that exploit genome data to ask entirely new kinds of questions about the complex nature of living cells.
| First paragraph | Full text | PDF (208 K) |
820
Protein function in the post-genomic era DAVID EISENBERG, EDWARD M. MARCOTTE, IOANNIS XENARIOS & TODD O. YEATES
| Summary | Full text | PDF (222 K) |
823
Genomics, gene expression and DNA arrays DAVID J. LOCKHART AND ELIZABETH A. WINZELER
| Summary |Full text | PDF (841 K) |
827
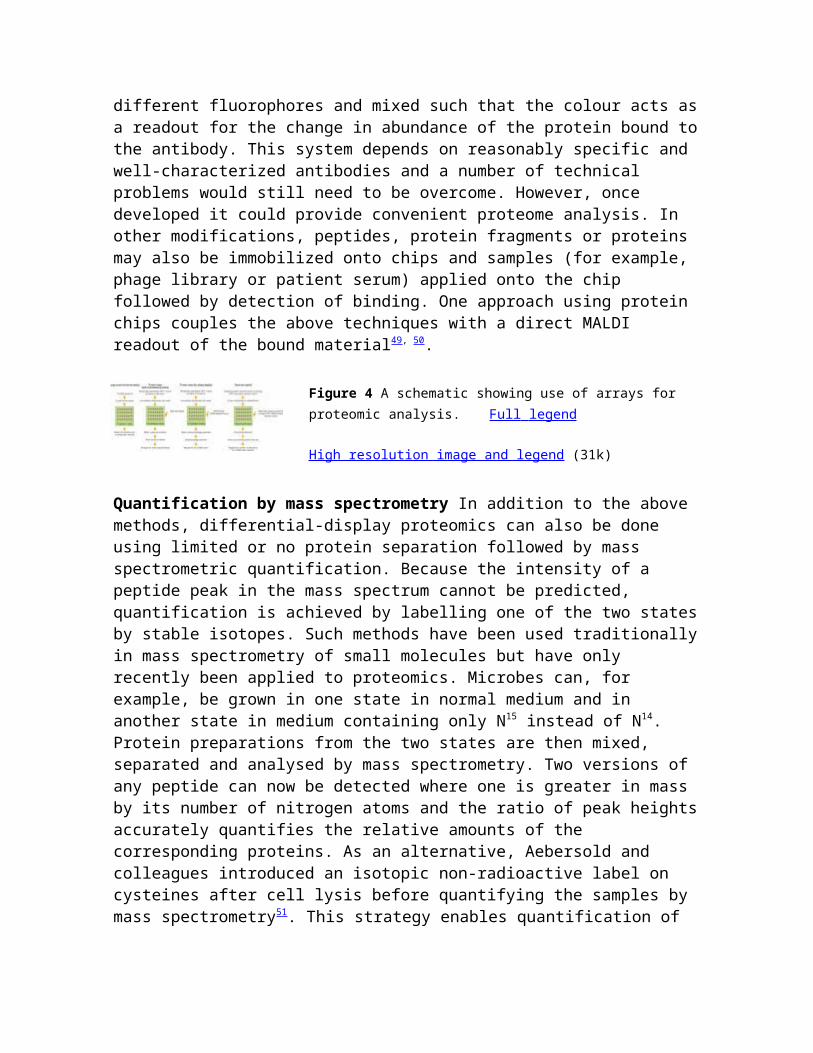
Proteomics to study genes and genomes AKHILESH PANDEY AND MATTHIAS MANN
Functional genomics has leapt from being a surrealistic, or at least futuristic, concept in the 1980s to an accepted (if not yet everyday) part of science in the year 2000. How has this transformation come about? Since worldwide efforts to sequence genomes began formally in 1990, astounding technological advances have been introduced. Among the eukaryotes, yeast, worm and fly sequences have been completed, alongside more than 20 prokaryotic genomes. The expected date for completion of the entire human genome is 2003, with a first draft due this autumn.
But what is the value of all this sequence data? An inventory of genes will impact molecular medicine the greatest, leading to improved diagnosis of disease. Sequencing of prokaryotic genomes will aid vaccine design and allow exploration of new microbial energy sources, while knowledge of other animal and plant genomes should enhance agriculture. Gaining the DNA sequences heralds the end of the beginning. The next step in this biological revolution is 'functional genomics', not simply the assignation of function to the identified genes but the organization and control of genetic pathways that come together to make up the physiology of an organism. This month's Nature Insight focuses on the challenges to biology brought about by the avalanche of DNA sequence information.
Vukmirovic and Tilghman provide an overview to the genomic revolution on page 820 and discuss what it will mean to scientists interested in the fundamentals of life. The progression of biology into a data-rich science has been orchestrated by computational biologists. On page 823, David Eisenberg and colleagues look at the role computers will play in predicting the function of a gene and even modelling signalling pathways in which it may act. At the molecular level, functional information can be acquired through the analysis of DNA and RNA expression arrays and on page 827Lockhart and Winzeler examine the current status of this technology. On page 837, Pandey and Mann discuss the sophisticated machinery being used in proteomics — the large-scale analysis of proteins and their interactions. The past couple of decades have witnessed an explosion in the identification of genes for several inherited human disorders. But successes have been limited mainly to diseases caused by mutations in a single gene. Neil Risch discusses on Page 847how having the human genome at our fingertips will present new opportunities for geneticists studying complex human disorders. Finally, on page 857 Allen Roses introduces pharmacogenetics — the study of how genetic differences influence the variability in patient response to drugs and allow custom-drug design.
We are pleased to acknowledge the financial support of Aventis in producing this Insight. Of course, Nature carries the sole responsibility for all editorial content and rigorous peer-review. In 1953, Nature published the structure of the DNA helix. Today, as the first human chromosome sequences appear in our pages, we stand at the brink of the next biological revolution. We hope that our readers will find the following reviews enlightening as well as thought provoking. The sequence for the human chromosomes and published genomes can be accessed online through Nature's Genome Gateway at http://www.nature.com/genomics.
Ritu Dhand Insight Editor
Publisher and liaison for corporate support Liz Allen ([email protected])
Howard Hughes Medical Institute and Department of Molecular Biology, Princeton University, Princeton New Jersey 08544, USA
The completion of entire genome sequences of many experimental organisms, and the promise that the human genome will be completed in the next year, find biology
suddenly awash in genome-based data. Scientists are scrambling to develop new technologies that exploit genome data to ask entirely new kinds of questions about the complex nature of living cells.
Biology is in the midst of an intellectual and experimental sea change. Essentially the discipline is moving from being largely a data-poor science to becoming a data-rich science. The data are coming from the fortuitous confluence of technological advances in protein and DNA analysis as well as imaging advances in cell biology. Improvements in mass spectrometry have revolutionized the number and kind of proteins that can be identified in a cell, and the powerful tools of nuclear magnetic resonance spectroscopy and X-ray crystallography have been managing to keep pace with far more efficient methods for acquiring angstrom-level structural knowledge for individual proteins, as well as multi-protein complexes. Reports of the structure of the nucleosome1 and the RNA polymerase complex2 and the promise of a complete picture of the ribosome in the near future3, 4 are landmark events in biology, and whet our appetite for more. At the same time, entire genome sequences of a large number of prokaryotes and a rapidly growing number of eukaryotes are now in hand. The exciting prospect of having a 90% draft of the human genome is almost at hand. The review articles that follow in this Nature Insight highlight some of the challenges that biologists face as they acclimatize themselves to this change in the data landscape.
Data drives innovationThat data are inherently good was not a central philosophical tenet for all biologists. This was evident in the late 1980s when the wisdom of embarking on the Human Genome Project was being debated in the community. At that time, many argued that investing in genome sequencing was unwise until we had the tools in hand to understand the sequence. Funds spent acquiring the sequence would be better spent developing tools to first understand it. To physicists and engineers, in disciplines where data are very often acquired well before their utility is apparent, this seemed illogical. The past ten years has provided ample evidence for the value of large-scale data acquisitiveness in biology. In fact, by thinking boldly, and by setting ambitious goals for itself, the international Human Genome Project stimulated developments both in high-throughput DNA sequencing, which were essential for the success of the project, and in powerful computational tools for sequence analysis. Without the project, it is very unlikely that these improvements would have been developed. The data were the catalyst.
Assembling the parts listThis avalanche of data is changing the kinds of questions that biologists can ask. Until recently, scientists have studied the form and function of organisms primarily by narrowing their focus from the entire animal to increasingly smaller parts — first organs, then cells, and finally individual molecules. Essentially the enormous complexity of a living organism overwhelmed existing analytical tools, and real progress came from approaches that ignored the complexity and focused on the component parts. This was a powerful strategy, and one that will continue to be important. A metaphor that captures the reductionist approach is that of a child trying to understand the function of a mysterious black box by gradually taking it apart, and examining each part individually. Today the parts, the individual genes and proteins, are now on the table for a growing number of organisms. As
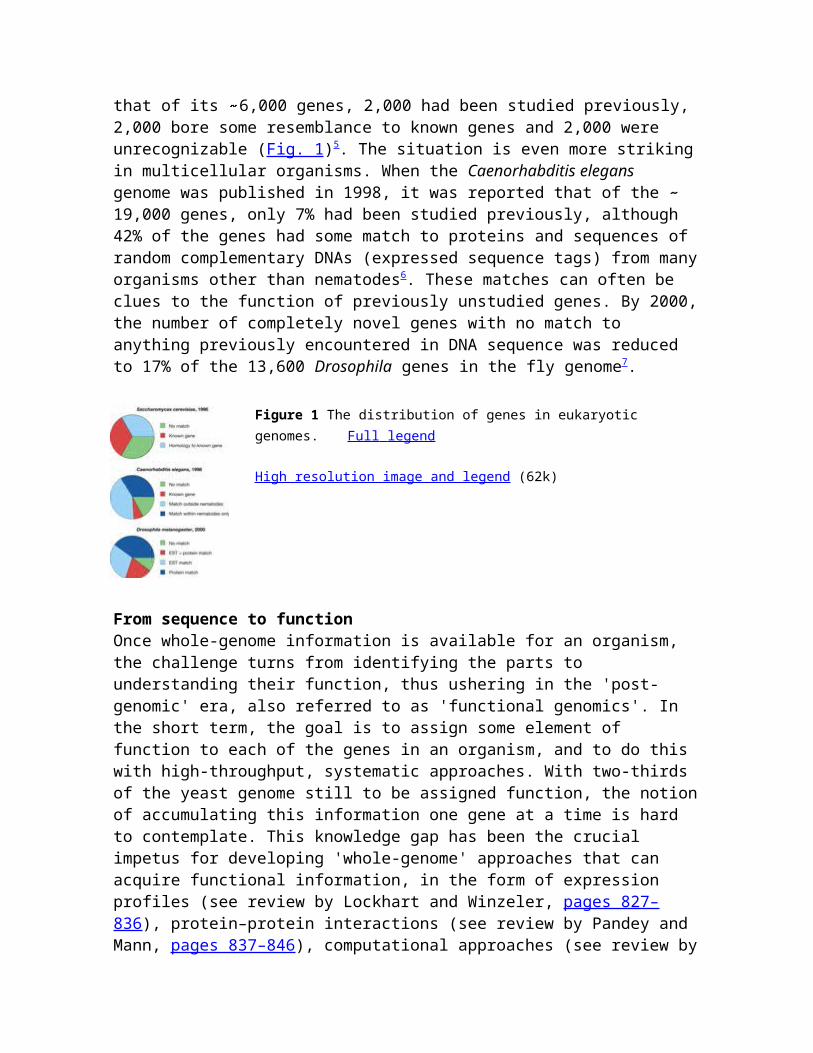
in the case of the black box, some parts are immediately recognizable because they have been encountered before, some can elicit an educated guess as to their function because of their similarity to another gene, and the rest are complete mysteries. When the Saccharomyces cerevisiae genome was published, it was estimated that of its 6,000 genes, 2,000 had been studied previously, 2,000 bore some resemblance to known genes and 2,000 were unrecognizable (Fig. 1)5. The situation is even more striking in multicellular organisms. When the Caenorhabditis elegans genome was published in 1998, it was reported that of the 19,000 genes, only 7% had been studied previously, although 42% of the genes had some match to proteins and sequences of random complementary DNAs (expressed sequence tags) from many organisms other than nematodes6. These matches can often be clues to the function of previously unstudied genes. By 2000, the number of completely novel genes with no match to anything previously encountered in DNA sequence was reduced to 17% of the 13,600 Drosophila genes in the fly genome7.
Figure 1 The distribution of genes in eukaryotic genomes. Full legend High resolution image and legend (62k)
From sequence to functionOnce whole-genome information is available for an organism, the challenge turns from identifying the parts to understanding their function, thus ushering in the 'post-genomic' era, also referred to as 'functional genomics'. In the short term, the goal is to assign some element of function to each of the genes in an organism, and to do this with high-throughput, systematic approaches. With two-thirds of the yeast genome still to be assigned function, the notion of accumulating this information one gene at a time is hard to contemplate. This knowledge gap has been the crucial impetus for developing 'whole-genome' approaches that can acquire functional information, in the form of expression profiles (see review by Lockhart and Winzeler, pages 827–836), protein–protein interactions (see review by Pandey and Mann, pages 837–846), computational approaches (see review by Eisenberg et al., pages 823–826 ) and the response to loss of function by mutation, sometimes called genetic fingerprinting8, 9.
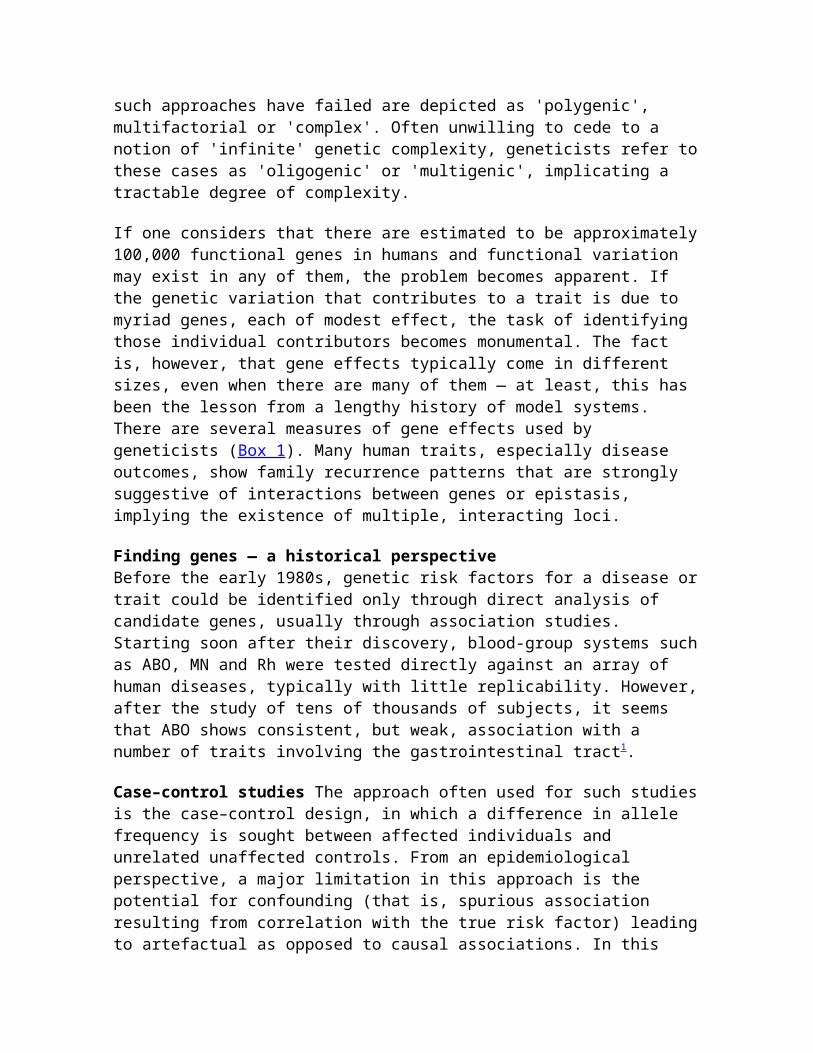
Function is understood on many different levels in biology. A computational biologist might be content to identify an unknown gene as encoding a kinase, but the biochemist would want to know its substrate specificity, the cell biologist would want to know its intracellular localization and its targets, the geneticist would want to know the pathway it affects and the physiologist would want to know what organs it affects (Fig. 2). All of this information contributes to the sum of our understanding of function, and there is a critical
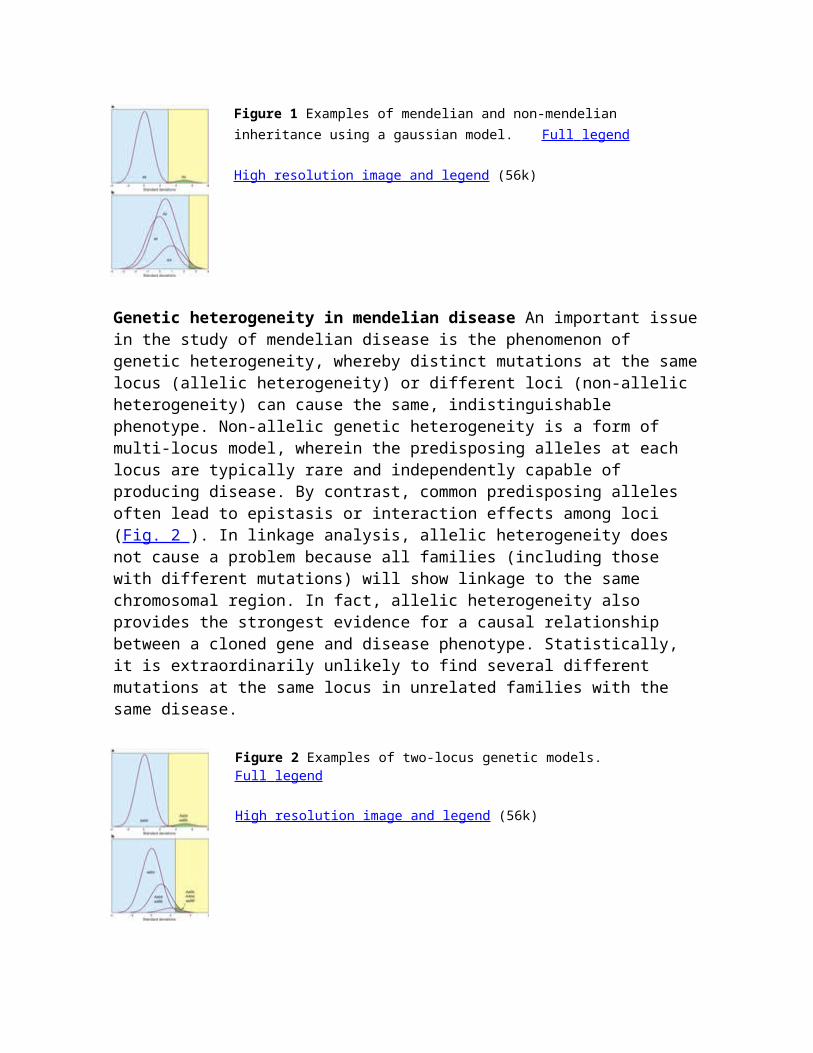
demand for algorithms (for example, see ref. 10) and relational databases that can integrate the information that will be obtained using very different tools.
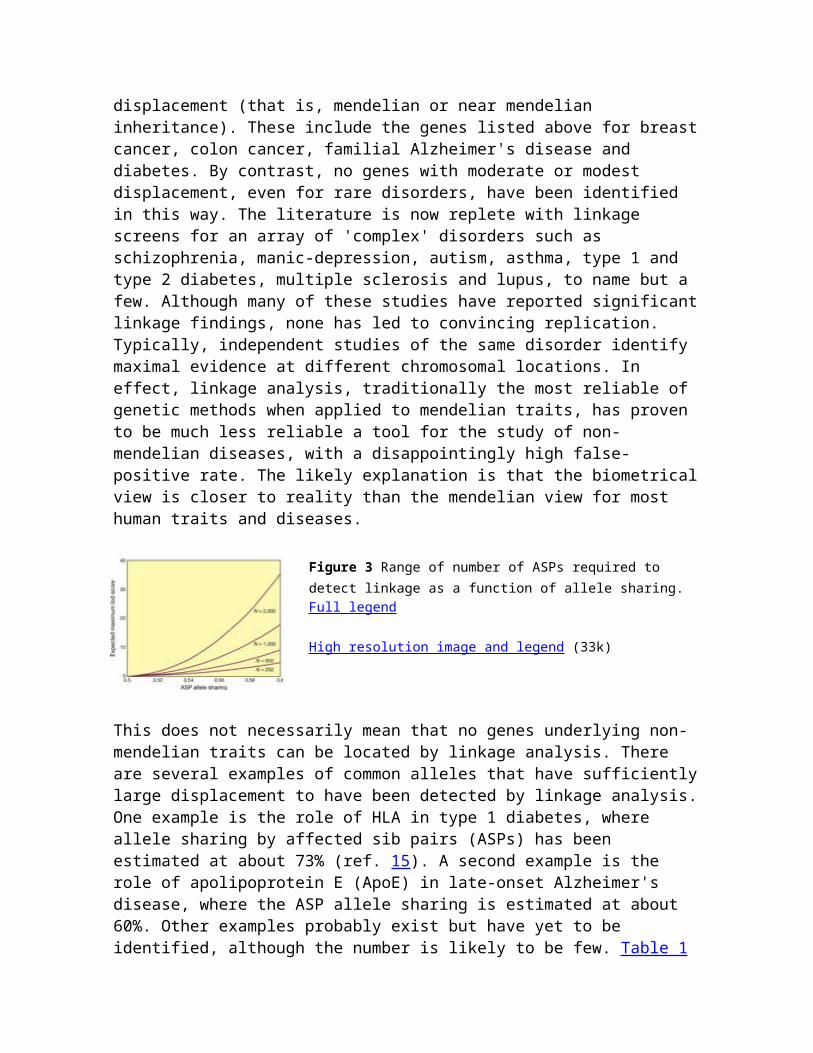
Figure 2 Understanding gene function. Full legend High resolution image and legend (61k)
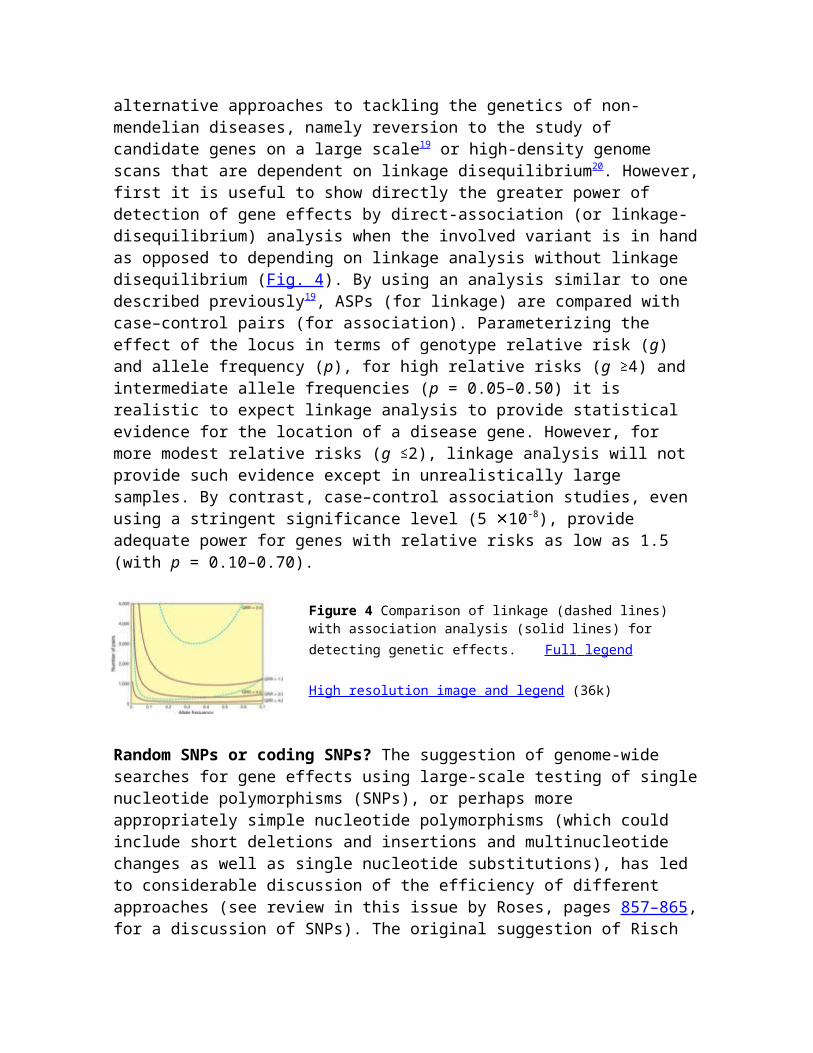
Several of the articles in this Insight discuss new technologies that are being developed to understand function on a genome-wide scale. Are these approaches conceptually different from what biologists have been doing for many years, or is it just the scale on which experiments can be done that is different? One could argue, for example, that geneticists who have been conducting screens to identify all genes in a pathway for 80 years are conducting a 'whole-genome' experiment. The major difference between the pre- and post-genome era is that one can now potentially account for and keep track of all the components at once. Theoretically there are no unknowns, with respect to genes and proteins. For example, Eisenberg et al., in their review on pages 823–826, describe a comparative genomic study by Pellegrini et al.11 to identify genes that are conserved en bloc in a variety of prokaryotes. From this analysis, they deduced the functions of unknown genes by the fact that they co-evolved with genes of known function — essentially guilt by association. It was the comprehensive nature of whole-genome sequences that made this a feasible approach to identifying function.
Thus the unique aspect of functional genomics in an organism whose genome in known completely is the ability to monitor simultaneously potentially all events, whether it be the expression of genes at the RNA or protein level, all possible protein–protein interactions, all alleles of all genes that affect a particular trait, or all protein-binding sites in a genome. The potential to learn entirely new things by taking such an approach is enormous, but it is important to recognize that these are early days for genomics. The recent developments in simultaneous monitoring of the expression of all RNAs using oligonucleotide and cDNA arrays, reviewed comprehensively by Lockhart and Winzeler (pages 827–836), is a case in point. Although few would question the power of this technology to describe the transcriptional profile of a cell, critics point out that the computational tools to maximally extract new insights into biology are not yet in hand. This is no different from the situation at the beginning of genome sequencing described above, and its resolution will undoubtedly be the same. The very existence of these large data sets will stimulate the development of better analytical tools. The array technologies suggest hypotheses about gene function that will stimulate new experiments that will use a reductionist approach. Thus there will be constant cross-fertilization and interplay between genome-wide and focused studies.
The technological and conceptual bottlenecks are not restricted to gene expression arrays. If parallel developments in proteomics are to make their mark, they must be able to monitor
the protein modifications that are critical for cellular regulation on a proteome-wide scale, an issue that is raised in the review by Pandey and Mann (pages 837–846 ). Risch has laid out in his review (pages 847–856) the considerable challenge that faces human geneticists who are trying to take whole-genome approaches to identifying genes that underlie multi-genic human traits. Although the completion of the human genome sequence holds the promise of identifying all genes associated with disease, the successes to date have been restricted primarily to genes that are responsible for diseases caused by mutations in a single gene. Solving this problem will have a considerable impact on the success of pharmacogenetics, a new field reviewed by Roses (pages 857–865 ), whose goal is to tailor drugs to individuals' genomic makeup.
From function to integrationThese are indeed exciting times, not unlike the early days of recombinant DNA in the 1970s, in which a revolutionary new technology permitted entirely new questions about the nature of genes to be raised. Although the current research is focused on assigning function to genes and proteins, the long-term goal is just as it is for the child and the black box — that is, to be able to understand sufficiently well how the pieces work together that you could, in principle, put them back together and get a functional organism. The challenge is to describe the collective properties of whole organisms in a precise and quantitative way. This challenge is new to biology, and its resolution will require, in addition to existing paradigms of molecular biology, new sets of analytical tools. It is hardly a coincidence that many universities and research institutes, including our own, are making major investments in multidisciplinary life-science initiatives to explore the complexity of living things. Organisms are networks of genes, which make networks of proteins, which regulate genes, and so on ad infinitum. The amount of complex data that will be generated, and the need for modelling to understand the way networks function, will ensure that disciplines outside of biology will be required to collaborate on this problem, if the ultimate goal to deconstruct such networks is to come to fruition.
References
1. Luger, K., Mader, A. W., Richmond, R. K., Sargent, D. F. & Richmond, T.J. Crystal structure of the nucleosome core particle at 2.8 Å resolution. Nature 389, 251-260 (1997). | Article | PubMed | ISI |
2. Zhang, G. et al. Crystal structure of Thermus aquaticus core RNA polymerase at 3.3 Å resolution. Cell 98, 811-824 (1999). | PubMed | ISI |
3. Ban, N. et al. Placement of protein and RNA structures into a 5 Å-resolution map of the 50S ribosomal subunit. Nature 400, 841-847 (1999). | Article | PubMed | ISI |
4. Cate, J. H., Yusupov, M. M., Yusupova, G. Z., Earnest, T. N. & Noller, H. F. X-ray crystal structures of 70S ribosome functional complexes. Science 285, 2095-2104 (1999). | Article | PubMed | ISI |
5. Goffeau, A. et al. Life with 6000 genes. Science 274, 546, 563-547 (1996).6. The C. elegans Sequencing Consortium. Genome sequence of the nematode C. elegans: a
platform for investigating biology. Science 282, 2012-2018 (1998). | PubMed |7. Adams, M. D. et al. The genome sequence of Drosophila melanogaster. Science 287, 2185-
8. Liu, L. X., et al. High-throughput isolation of Caenorhabditis elegans deletion mutants. Genome Res. 9, 859-867 (1999). | Article | PubMed | ISI |
9. Smith, V., Chou, K. N., Lashkari, D., Botstein, D. & Brown, P. O. Functional analysis of the genes of yeast chromosome V by genetic footprinting. Science 274, 2069-2074 (1996). | Article | PubMed | ISI |
10. Marcotte, E. M., Pellegrini, M., Thompson, M. J., Yeates, T. O. & Eisenberg, D. A combined algorithm for genome-wide prediction of protein function. Nature 402, 83-86 (1999). | Article | PubMed | ISI |
11. Pellegrini, M., Marcotte, E. M., Thompson, M. J., Eisenberg, D. & Yeates, T. O. Assigning protein functions by comparative genome analysis: protein phylogenetic profiles. Proc. Natl Acad. Sci. USA 96, 4285-4288 (1999). | Article | PubMed | ISI |
Figure 1 The distribution of genes in eukaryotic genomes. Shown for three organisms are the relative number of genes that were previously identified, the number that had some homology to known genes, and the number that had no match in any sequence database at the time of completion of the genome sequence
Figure 2 Understanding gene function. The function of a specific gene can be approached from many scientific perspectives with a variety of tools.
DAVID EISENBERG, EDWARD M. MARCOTTE, IOANNIS XENARIOS & TODD O. YEATES
Molecular Biology Institute and UCLA-DOE Laboratory of Structural Biology and Molecular Medicine, Box 951570, University of California at Los Angeles, Los Angeles, California 90095-1570, USA
Faced with the avalanche of genomic sequences and data on messenger RNA expression, biological scientists are confronting a frightening prospect: piles of information but only flakes of knowledge. How can the thousands of sequences being determined and deposited, and the thousands of expression profiles being generated by the new array methods, be synthesized into useful knowledge? What form will this knowledge take? These are questions being addressed by scientists in the field known as 'functional genomics'.
Inherent in the growing collections of genome sequences and expression profiles is knowledge about functional linkages between proteins. This knowledge can be extracted both by experimental and by computational means, as outlined below. New computational methods go beyond the traditional method of sequence homology, which seeks correlations between amino-acid sequences. Instead, correlations are sought for the inheritance of pairs of proteins into various species (for the phylogenetic profile method), for protein domains that exist both as fusions to each other and as free-standing polypeptides (for the Rosetta Stone method), or for the position of genes on chromosomes (for the gene neighbour method). Analysis of genomic and expression data by such methods produces networks of functional linkages between proteins in cells, and alters fundamentally the notion of what is meant by 'the function of a protein'.
Proteins are the main catalysts, structural elements, signalling messengers and molecular machines of biological tissues. Until recently, there have been two principal ways to learn more about the functions of protein molecules. All primary knowledge of function has come from some biochemical, genetic or structural experiment on an individual protein. But once a function has been assigned to an individual protein, one can search for other proteins with related functions by seeking proteins whose amino-acid sequences are similar to the original protein. This 'homology method' is used widely to extend knowledge of protein function from one protein to its cousins, which are presumably descended from the same common ancestral protein. The powerful BLAST programs1 are used to extend experimental knowledge of protein function to new sequences in this way. By using such homology methods, roughly 40–70% of new genome sequences can be assigned to some function, the larger percentage being for well-studied prokaryotes2-4. The functional assignments by homology usually involve identification of some molecular function of the protein, but they do not place the protein in its context of cellular function, as do the methods described below.
New methods have been devised to supply functional information for many proteins at once. In some cases, assignments can be made to most of the proteins encoded by the genome of an organism. These methods often detect a functional linkage between proteins. If the function of one of the proteins is known, then it can be inferred that the linked proteins act in the same pathway or complex as the first protein. Even if none of the linked proteins has a known function, knowledge of the linkages is valuable in focusing future experiments and adding to the infrastructure of cellular function.
One of the most powerful of the new methods extends the two-hybrid screen to a genome-wide assay and has detected over 1,000 putative protein–protein interactions in yeast cells (see review in this issue by Pandey and Mann, pp. 837–846, and refs 5, 6). Another powerful class of methods is the analysis of correlated mRNA expression levels (see review by Lockhart and Winzeler, pp. 827–836, and refs 7–9). These methods detect changes in mRNA expression in different cell types, such a B-cell lymphoma compared with normal cells, or in yeast cells challenged by metabolic or environmental conditions (for instance, starvation or heat). By correlating those mRNAs whose expression levels are changed, one can establish functional linkages between the proteins encoded by the correlated mRNAs10,
11.
Computational detection of functional linkagesThe advent of fully sequenced genomes has facilitated the development of computational methods for establishing functional linkages between proteins. One of these computational methods is the phylogenetic profile ( Box 1). A phylogenetic profile describes the pattern of presence or absence of a particular protein across a set of organisms whose genomes have been sequenced. If two proteins have the same phylogenetic profile (that is, the same pattern of presence or absence) in all surveyed genomes, it is inferred that the two proteins have a functional link. That is, why would two proteins always both be inherited into a new species, or neither inherited, unless the two function together? The power of the method to detect functional linkage can be appreciated when the number of possible phylogenetic profiles is considered: because each protein can be either present or absent in each genome, if there are n fully sequenced genomes, there are up to 2n phylogenetic profiles. Currently there are about 30 fully sequenced genomes in the public domain, meaning there are 230 (10 9) possible phylogenetic profiles. This number far exceeds the number of protein families, so that a protein's phylogenetic profile is a nearly unique characterization of its pattern of distribution among genomes. Hence any two proteins having identical or similar phylogenetic profiles are likely to be engaged in a common pathway or complex.
Functional linkages between proteins have also been detected by analysing fusion patterns of protein domains (Box 2). Not infrequently, separate proteins A and B in one organism are expressed as a fused protein in some other species. When expressed as a fused protein, the two domains A and B are almost certainly linked in function. Thus a successful search through other genome sequences for the corresponding fused protein is powerful evidence that A and B are linked functionally. Because A and B have unrelated sequences, this type of functional linkage cannot be detected by a homology search. Also, because the fused protein has similarity to both A and B, it is termed a Rosetta Stone sequence12.
A third computational method that reveals functional linkages from genome sequences is the gene neighbour method13, 14. If in several genomes the genes that encode two proteins are neighbours on the chromosome, the proteins tend to be functionally linked. This method can be powerful in uncovering functional linkages in prokaryotes, where operons are common, but also shows promise for analysing interacting proteins in eukaryotes (Box 3).
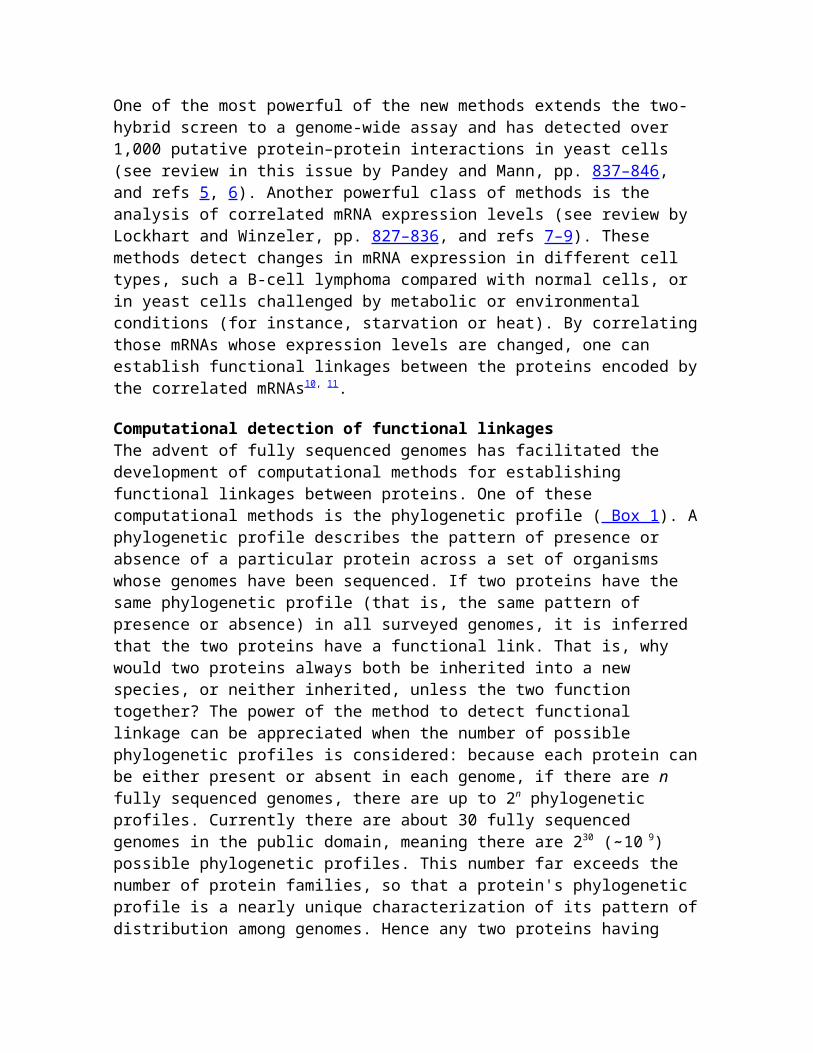
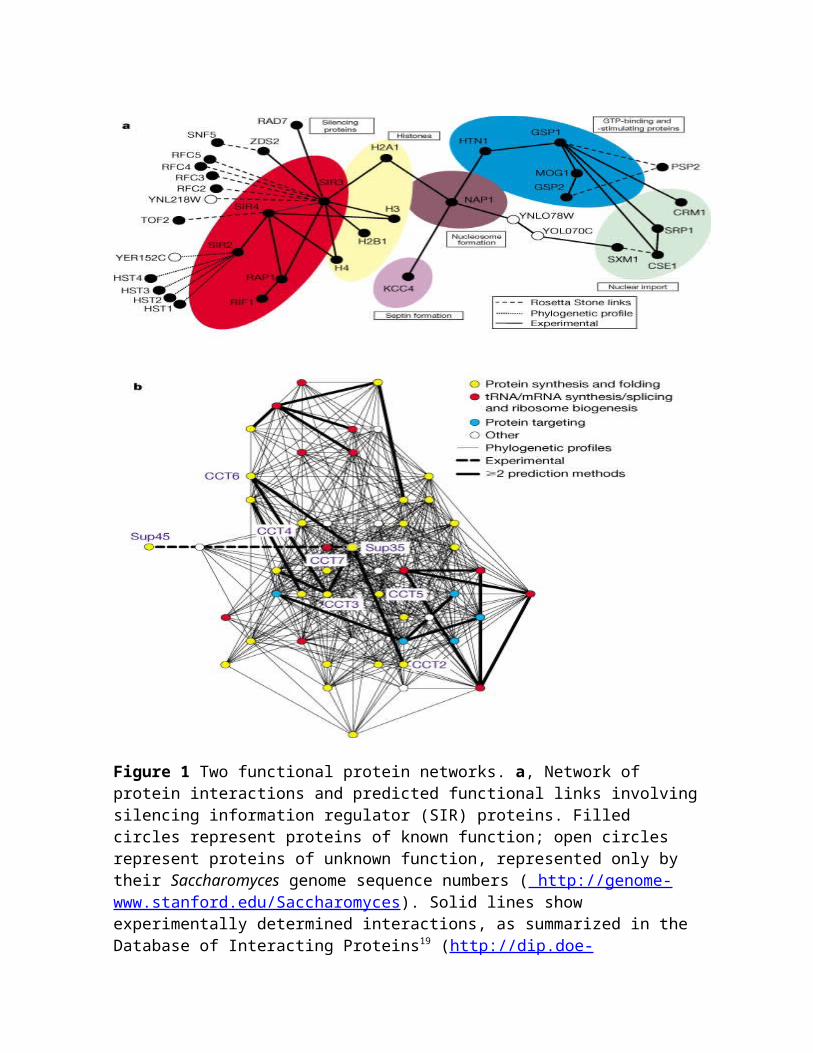
Functional networksWhen methods for detecting functional linkages are applied to all the proteins of an organism11, 15, networks of interacting, functionally linked proteins can be traced out. Two examples from yeast are given in Fig. 1. Figure 1a shows interactions among histones and related proteins such as silencing proteins. These were determined mostly by experiments, but some links were predicted by the Rosetta Stone method and by phylogenetic profiles. Some of the links are to proteins known only from their genome sequences, and without other functional information; their linkage to this network indicates an intimate functional interaction among proteins involved in gene silencing, DNA packaging and nuclear transport.
Figure 1 Two functional protein networks. Full legend High resolution image and legend (131k)
Figure 1b shows a second network of functionally linked proteins from yeast, centred on the yeast prion protein Sup35. In this network, most of the links are predicted by phylogenetic profiles, the Rosetta stone method and mRNA expression patterns. Sup35 is known to regulate translation, and it is therefore of interest that most of the predicted linkages are to other proteins involved in protein synthesis, folding and targeting. This indicates that at least some of the predicted links are meaningful. As methods improve for detecting protein linkages, it seems likely that most yeast proteins will be included in expanded versions of the networks of Fig. 1. A central feature of these networks is that most proteins interact with several other proteins.
Validation of functional linkagesWhat evidence is there that functional linkages predicted by phylogenetic profiles, Rosetta stone and related methods are valid? At first glance, there is the reassurance that these methods link many proteins that are already known to function together on the basis of experiments. Examples include ribosomal proteins, proteins from the flagellar motor apparatus, and proteins in known metabolic pathways11, 16. A more quantitative validation is offered by the check of 'keyword recovery'11. This simple assay compares the keyword annotations17 for both members of each pair of proteins linked by one of the methods. This
is possible in those cases where both members of the pair have known functions. When the keywords for both members agree, there is said to be 'keyword recovery'. When keyword recovery was examined for the predicted functional linkages between yeast proteins, it was found that the individual methods showed an average signal-to-noise ratio for keyword recovery ranging between 2, for correlated mRNA expression, to 5, for the phylogenetic profiles. These values can be compared with that of 8 for direct experimental measurements of linkage. It was also found that when two of the predictive methods gave the same linkage, the signal-to-noise value was 8, the same as for direct experiments. In short, the computer-based methods for inferring function have fair reliability in general, and excellent reliability when two or more of them agree on a link.
The post-genomic view of functionThe classical view of protein function focuses on the action of a single protein molecule. This action may be the catalysis of a given reaction or the binding of a small or large molecule. Today this local function is sometimes termed the 'molecular function' of the protein to distinguish it from an expanded view of function (Fig. 2). In the expanded view of protein function, a protein is defined as an element in the network of its interactions. Various terms have been coined for this expanded notion of function, such as 'contextual function' or 'cellular function' (see, for example, ref. 18). Whatever the term, the idea is that each protein in living matter functions as part of an extended web of interacting molecules.
Figure 2 The evolution of the meaning of protein function. Full legend High resolution image and legend (20k)
In conclusion, the availability of fully sequenced genomes and the enormous amount of data on the co-expression of mRNAs opens new ways to analyse protein function. The new methods establish functional links between pairs of proteins, and interconnecting links form networks of functionally interacting proteins. Some of the functional linkages reflect metabolic or signalling pathways; other linkages reflect the formation of complexes of macromolecules such as ribosomes. Often it is possible to understand the cellular functions of uncharacterized proteins through their linkages to characterized proteins. In broader terms, the networks of linkages offer a new view of the meaning of protein function, and in time should offer a deepened understanding of the functioning of cells.
References
1. Altschul, S. F. et al. Gapped BLAST and PSI-BLAST: a new generation of protein database search programs. Nucleic Acids Res. 25, 3389-3402 (1997). | Article | PubMed | ISI |
2. The C. elegans Sequencing Consortium. Genome sequence of the nematode C. elegans: a platform for investigating biology. Science 282, 2012-2018 (1998). | PubMed |
3. Chervitz, S. A. et al. Comparison of the complete protein sets of worm and yeast: orthology and divergence. Science 282, 2022-2028 (1998). | Article | PubMed | ISI |
4. Tatusov, R. L., Galperin, M. Y., Natale, D. A. & Koonin, E. V. The COG database: a tool for genome-scale analysis of protein functions and evolution. Nucleic Acids Res. 28, 33-36 (2000). | Article | PubMed | ISI |
5. Uetz, P. et al. A comprehensive analysis of protein-protein interactions in Saccharomyces cerevisiae. Nature 403, 623-627 (2000). | Article | PubMed | ISI |
6. Ito, T. et al. Toward a protein-protein interaction map of the budding yeast: a comprehensive system to examine two-hybrid interactions in all possible combinations between the yeast proteins. Proc. Natl Acad. Sci. USA 97, 1143-1147 (2000). | Article | PubMed | ISI |
7. Alizadeh, A. A. et al. Distinct types of diffuse large B-cell lymphoma identified by gene expression profiling. Nature 403, 503-511 (2000). | Article | PubMed | ISI |
8. Lashkari, D. A. et al. Yeast microarrays for genome wide parallel genetic and gene expression analysis. Proc. Natl Acad. Sci. USA 94, 13057-13062 (1997). | Article | PubMed | ISI |
9. Brown, P. O. & Botstein, D. Exploring the new world of the genome with DNA microarrays. Nature Genet. 21, 33-37 (1999). | Article | PubMed | ISI |
10. Eisen, M. B., Spellman, P. T., Brown, P. O. & Botstein, D. Cluster analysis and display of genome-wide expression patterns. Proc. Natl Acad. Sci. USA 95, 14863-14868 (1998). | Article | PubMed | ISI |
11. Marcotte, E. M., Pellegrini, M., Thompson, M. J., Yeates, T. O. & Eisenberg, D. A combined algorithm for genome-wide prediction of protein function. Nature 402, 83-86 (1999). | Article | PubMed | ISI |
12. Marcotte, E. M. et al. Detecting protein function and protein-protein interactions from genome sequences. Science 285, 751-753 (1999). | Article | PubMed | ISI |
13. Dandekar, T., Snel, B., Huynen, M. & Bork, P. Conservation of gene order: a fingerprint of proteins that physically interact. Trends Biochem. Sci. 23, 324-328 (1998). | Article | PubMed | ISI |
14. Overbeek, R., Fonstein, M., D'Souza, M., Pusch, G. D. & Maltsev, N. The use of gene clusters to infer functional coupling. Proc. Natl Acad. Sci. USA 96, 2896-2901 (1999). | Article | PubMed | ISI |
15. Enright, A. J., Iliopoulos, I., Kyrpides, N. C. & Ouzounis, C. A. Protein interaction maps for complete genomes based on gene fusion events. Nature 402, 86-90 (1999). | Article | PubMed | ISI |
16. Pellegrini, M., Marcotte, E. M., Thompson, M. J., Eisenberg, D. & Yeates, T. O. Assigning protein functions by comparative genome analysis: protein phylogenetic profiles. Proc. Natl Acad. Sci. USA 96, 4285-4288 (1999). | Article | PubMed | ISI |
17. Andrade, M. A. & Valencia, A. Automatic extraction of keywords from scientific text: application to the knowledge domain of protein families. Bioinformatics 14, 600-607 (1998). | Article | PubMed | ISI |
18. Kim, S. H. Structural genomics of microbes: an objective. Curr. Opin. Struct. Biol. (in the press).19. Xenarios, I. et al. DIP: the Database of Interacting Proteins. Nucleic Acids Res. 28, 289-291
(2000). | Article | PubMed | ISI |20. Wickner, R. B. [URE3] as an altered URE2 protein: evidence for a prion analog in
Saccharomyces cerevisiae. Science 264, 566-569 (1994). | PubMed | ISI |21. Bork, P. et al. Predicting function: from genes to genomes and back. J. Mol. Biol. 283, 707-725
(1998). | Article | PubMed | ISI |22. Huynen, M., Dandekar, T. & Bork, P. Differential genome analysis applied to the species-specific
features of Helicobacter pylori. FEBS Lett. 426, 1-5 (1998). | Article | PubMed | ISI |23. Hegyi, H. & Gerstein, M. The relationship between protein structure and function: a
comprehensive survey with application to the yeast genome. J. Mol. Biol. 288, 147-164 (1999). | Article | PubMed | ISI |
24. Ouzounis, C. & Kyrpides, N. The emergence of major cellular processes in evolution. FEBS Lett. 390, 119-123 (1996). | Article | PubMed | ISI |
25. Gaasterland, T. & Ragan, M. A. Constructing multigenome views of whole microbial genomes. Microb. Comp. Genomics 3, 177-192 (1998). | PubMed |
26. Wu, Q. & Maniatis, T. A striking organization of a large family of human neural cadherin-like cell adhesion genes. Cell 97, 779-790 (1999). | PubMed | ISI |
Figure 1 Two functional protein networks. a, Network of protein interactions and predicted functional links involving silencing information regulator (SIR) proteins. Filled circles represent proteins of known function; open circles represent proteins of unknown function, represented only by their Saccharomyces genome sequence numbers ( http://genome-www.stanford.edu/Saccharomyces). Solid lines show experimentally determined interactions, as summarized in the Database of Interacting Proteins19 (http://dip.doe-mbi.ucla.edu). Dashed lines show functional links predicted by the Rosetta Stone method12.
Dotted lines show functional links predicted by phylogenetic profiles16. Some predicted links are omitted for clarity. b, Network of predicted functional linkages involving the yeast prion protein20 Sup35. The dashed line shows the only experimentally determined interaction. The other functional links were calculated from genome and expression data11 by a combination of methods, including phylogenetic profiles, Rosetta stone linkages and mRNA expression. Linkages predicted by more than one method, and hence particularly reliable, are shown by heavy lines. Adapted from ref. 11.
Figure 2 The evolution of the meaning of protein function. The traditional view is illustrated on the left, and the post-genomic view on the right.
Genomics Institute of the Novartis Research Foundation , 3115 Merryfield Row, San Diego, California 92121, USA
Experimental genomics in combination with the growing body of sequence information promise to revolutionize the way cells and cellular processes are studied.
Information on genomic sequence can be used experimentally with high-density DNA arrays that allow complex mixtures of RNA and DNA to be interrogated in a parallel and quantitative fashion. DNA arrays can be used for many different purposes, most prominently to measure levels of gene expression (messenger RNA abundance) for tens of thousands of genes simultaneously. Measurements of gene expression and other applications of arrays embody much of what is implied by the term 'genomics'; they are broad in scope, large in scale, and take advantage of all available sequence information for experimental design and data interpretation in pursuit of biological understanding.
Biological and biomedical research is in the midst of a significant transition that is being driven by two primary factors: the massive increase in the amount of DNA sequence information and the development of technologies to exploit its use. Consequently, we find ourselves at a time when new types of experiments are possible, and observations, analyses and discoveries are being made on an unprecedented scale. Over the past few years, more than 30 organisms have had their genomes completely sequenced, with another 100 or so in progress (see http://www.tigr.org or [email protected] for a list). At least partial sequence has been obtained for tens of thousands of mouse, rat and human genes, and the sequence of two entire human chromosomes (chromosomes 21 and 22) has been determined1, 2. Within the year, a large proportion of the human genome will be deciphered, in both public and private efforts, and the complete sequence of the mouse and other animal and plant genomes will undoubtedly follow close behind. Unfortunately, the billions of bases of DNA sequence do not tell us what all the genes do, how cells work, how cells form organisms, what goes wrong in disease, how we age or how to develop a drug. This is where functional genomics comes into play. The purpose of genomics is to understand biology, not simply to identify the component parts, and the experimental and computational methods take advantage of as much sequence information as possible. In this sense, functional genomics is less a specific project or programme than it is a mindset and general approach to problems. The goal is not simply to provide a catalogue of all the genes and information about their functions, but to understand how the components work together to comprise functioning cells and organisms.
To take full advantage of the large and rapidly increasing body of sequence information, new technologies are required. Among the most powerful and versatile tools for genomics are high-density arrays of oligonucleotides or complementary DNAs. Nucleic acid arrays work by hybridization of labelled RNA or DNA in solution to DNA molecules attached at specific locations on a surface. The hybridization of a sample to an array is, in effect, a highly parallel search by each molecule for a matching partner on an 'affinity matrix', with the eventual pairings of molecules on the surface determined by the rules of molecular recognition. Arrays of nucleic acids have been used for biological experiments for many years3-8. Traditionally, the arrays consisted of fragments of DNA, often with unknown sequence, spotted on a porous membrane (usually nylon). The arrayed DNA fragments often came from cDNA, genomic DNA or plasmid libraries, and the hybridized material was often labelled with a radioactive group. Recently, the use of glass as a substrate and fluorescence for detection, together with the development of new technologies for synthesizing or depositing nucleic acids on glass slides at very high densities, have allowed
the miniaturization of nucleic acid arrays with concomitant increases in experimental efficiency and information content9-14 (Fig. 1).
Figure 1 Principal types of arrays used in gene expression monitoring. Full legend High resolution image and legend (65k)
While making arrays with more than several hundred elements was until recently a significant technical achievement, arrays with more than 250,000 different oligonucleotide probes or 10,000 different cDNAs per square centimetre can now be produced in significant numbers15, 16. Although it is possible to synthesize or deposit DNA fragments of unknown sequence, the most common implementation is to design arrays based on specific sequence information, a process sometimes referred to as 'downloading the genome onto a chip' (Fig. 1). There are several variations on this basic technical theme: the hybridization reaction may be driven (for example, by an electric field)17, 18; other detection methods19 besides fluorescence can be used; and the surface may be made of materials other than glass such as plastic, silicon, gold, a gel or membrane, or may even be comprised of beads at the ends of fibre-optic bundles20-22. Nonetheless, the key elements of parallel hybridization to localized, surface-bound nucleic acid probes and subsequent counting of bound molecules are ubiquitous, and high-density arrays of nucleic acids on glass (often called DNA microarrays, oligonucleotide arrays, GeneChip arrays, or simply 'chips') and their biological uses will be the focus of this review.
Global gene expression experimentsOne of the most important applications for arrays so far is the monitoring of gene expression (mRNA abundance). The collection of genes that are expressed or transcribed from genomic DNA, sometimes referred to as the expression profile or the 'transcriptome', is a major determinant of cellular phenotype and function. The transcription of genomic DNA to produce mRNA is the first step in the process of protein synthesis, and differences in gene expression are responsible for both morphological and phenotypic differences as well as indicative of cellular responses to environmental stimuli and perturbations. Unlike the genome, the transcriptome is highly dynamic and changes rapidly and dramatically in response to perturbations or even during normal cellular events such as DNA replication and cell division23, 24. In terms of understanding the function of genes, knowing when, where and to what extent a gene is expressed is central to understanding the activity and biological roles of its encoded protein. In addition, changes in the multi-gene patterns of expression can provide clues about regulatory mechanisms and broader cellular functions and biochemical pathways. In the context of human health and treatment, the knowledge gained from these types of measurements can help determine the causes and consequences of disease, how drugs and drug candidates work in cells and organisms, and what gene
products might have therapeutic uses themselves or may be appropriate targets for therapeutic intervention.
Past discussions of arrays have often centred on technical issues and specific performance characteristics25. Now that nucleic acid arrays have been constructed for many different organisms14, 26-29 and used successfully to measure transcript abundance in a host of different experiments, the focus of interest has thankfully shifted. Investigators are now more concerned with questions concerning experimental design, data analysis, the use of small amounts of mRNA from limited sources, the best ways to extract biological meaning from the results, pathway and cell-circuitry modelling, and medical uses of expression patterns.
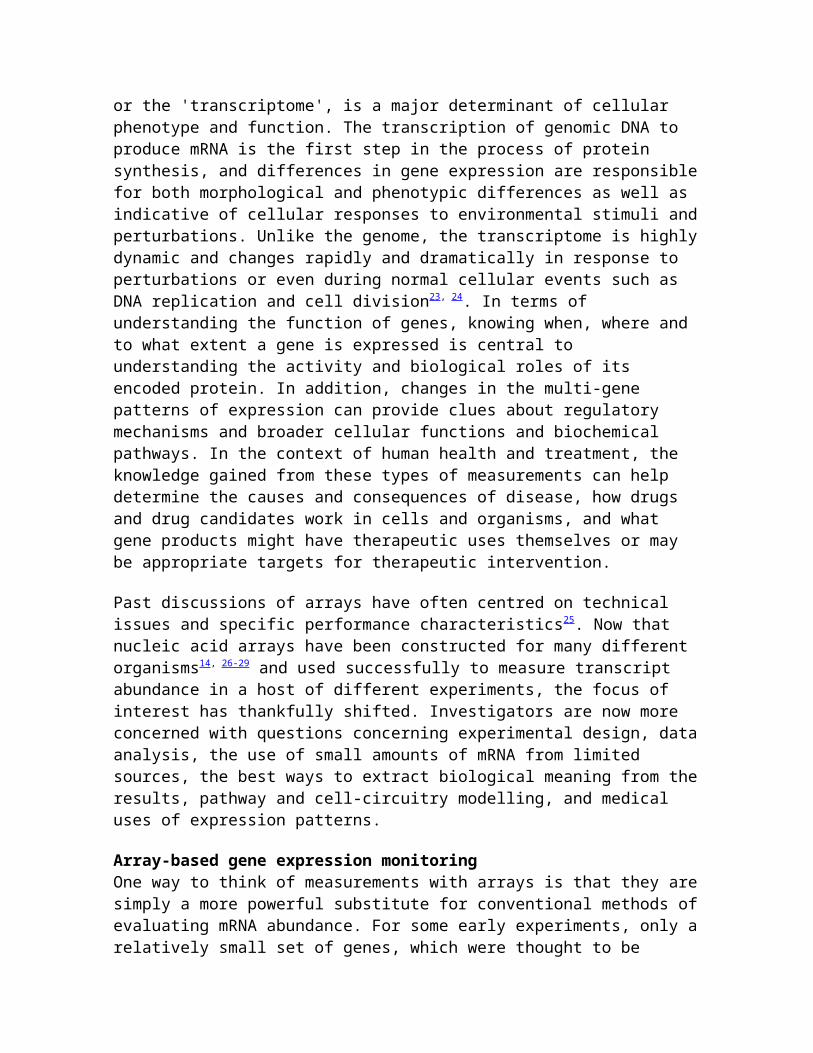
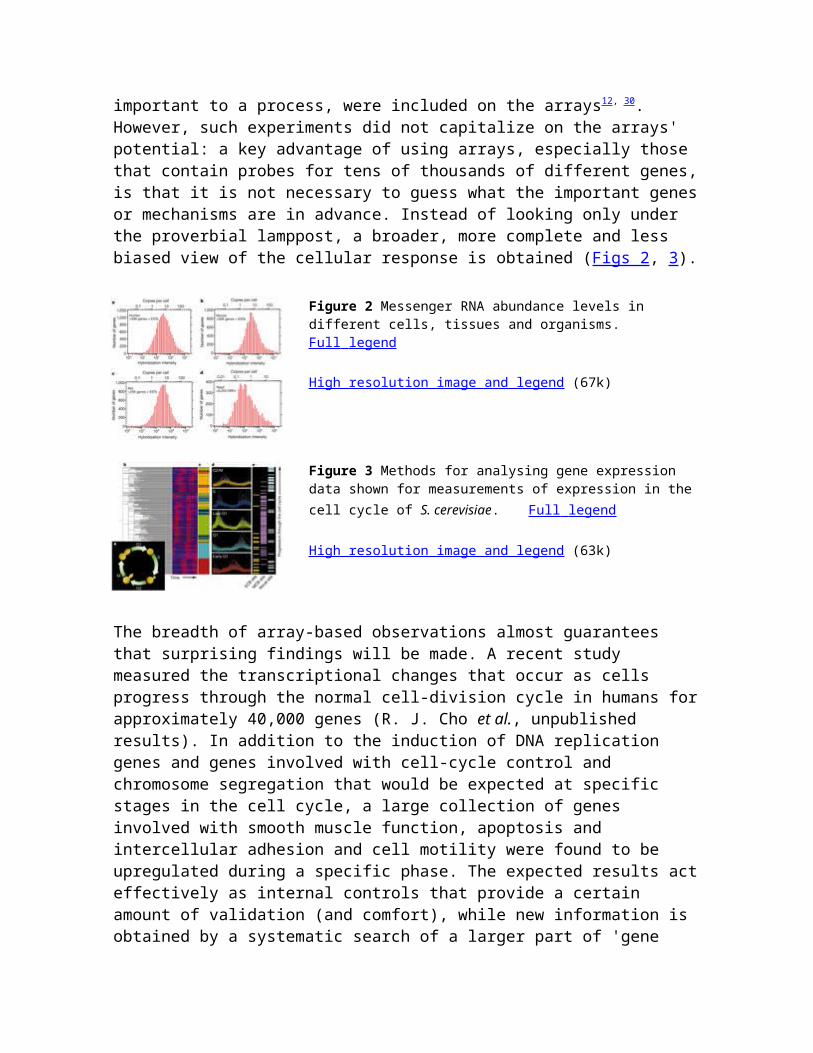
Array-based gene expression monitoringOne way to think of measurements with arrays is that they are simply a more powerful substitute for conventional methods of evaluating mRNA abundance. For some early experiments, only a relatively small set of genes, which were thought to be important to a process, were included on the arrays12, 30. However, such experiments did not capitalize on the arrays' potential: a key advantage of using arrays, especially those that contain probes for tens of thousands of different genes, is that it is not necessary to guess what the important genes or mechanisms are in advance. Instead of looking only under the proverbial lamppost, a broader, more complete and less biased view of the cellular response is obtained (Figs 2, 3).
Figure 2 Messenger RNA abundance levels in different cells, tissues and organisms. Full legend High resolution image and legend (67k)
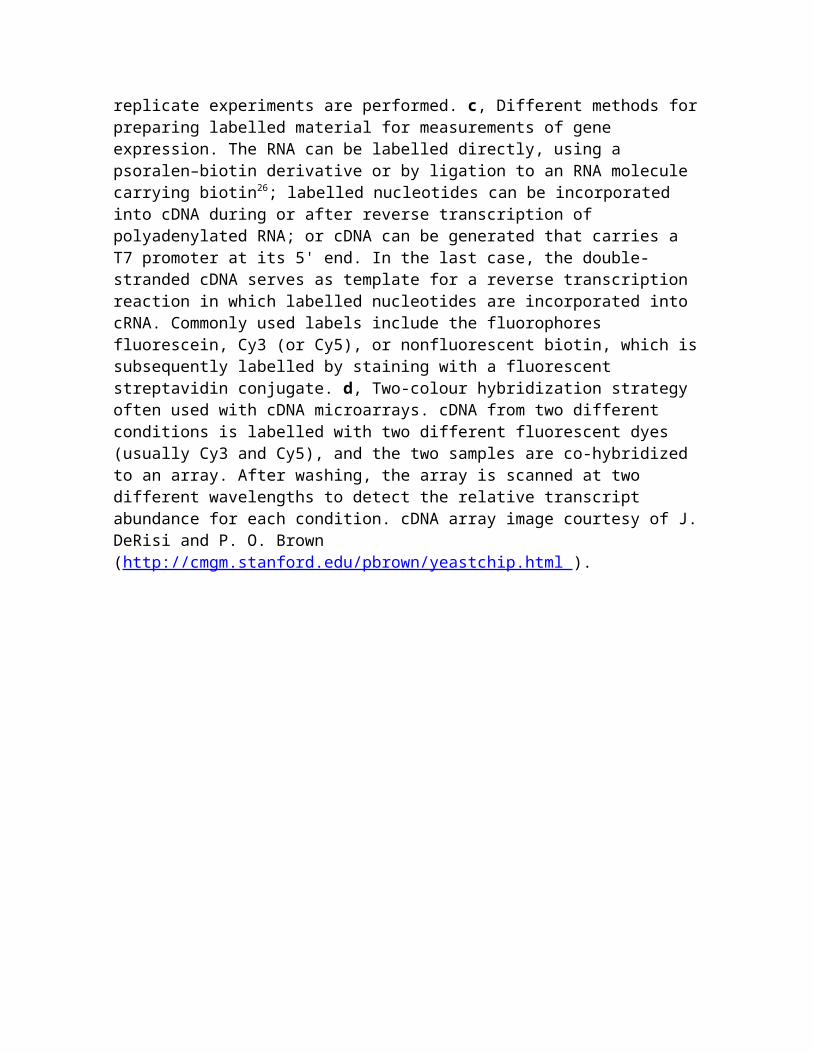
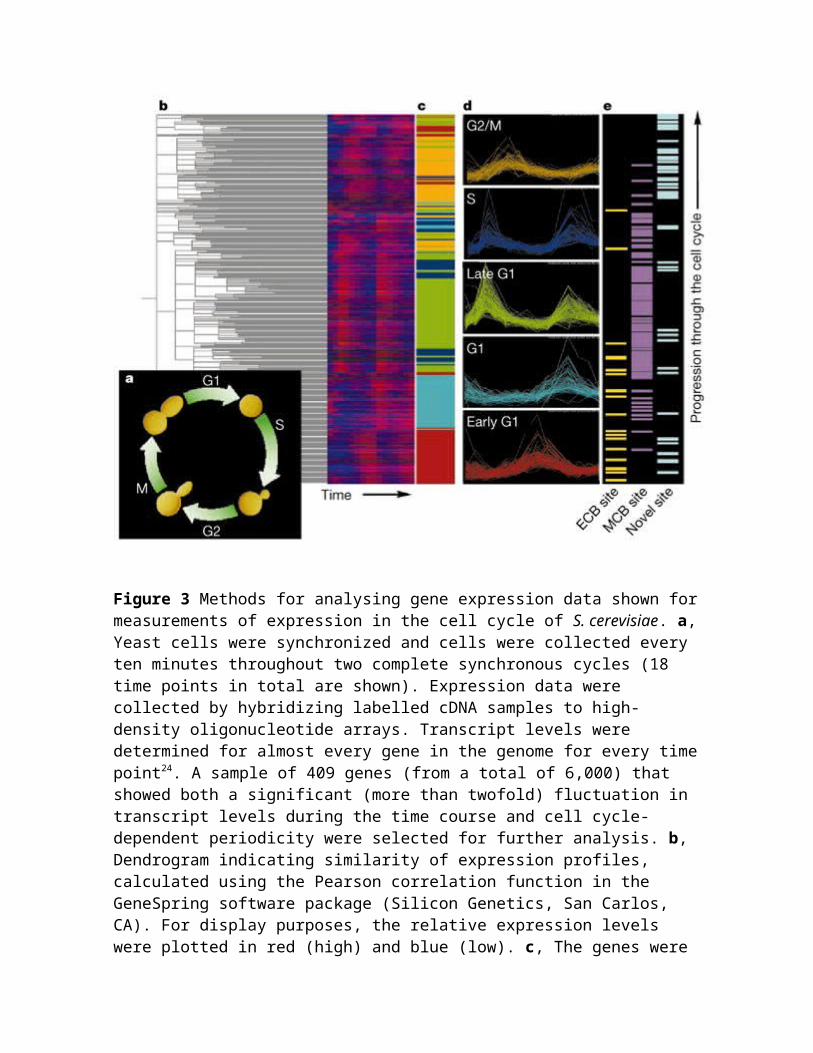
Figure 3 Methods for analysing gene expression data shown for measurements of expression in the cell cycle of S. cerevisiae. Full legend High resolution image and legend (63k)
The breadth of array-based observations almost guarantees that surprising findings will be made. A recent study measured the transcriptional changes that occur as cells progress through the normal cell-division cycle in humans for approximately 40,000 genes (R. J. Cho et al., unpublished results). In addition to the induction of DNA replication genes and genes involved with cell-cycle control and chromosome segregation that would be expected at specific stages in the cell cycle, a large collection of genes involved with smooth muscle
function, apoptosis and intercellular adhesion and cell motility were found to be upregulated during a specific phase. The expected results act effectively as internal controls that provide a certain amount of validation (and comfort), while new information is obtained by a systematic search of a larger part of 'gene space'. In addition, because arrays often contain probes for genes of unknown function (and often with only partial sequence information), any outcome for these could be considered, in some sense, both surprising and novel (although clearly requiring further characterization).
Other gene expression methodsNot surprisingly, there are other ways to measure mRNA abundance, gene expression and changes in gene expression. For measuring gene expression at the level of mRNA, northern blots, polymerase chain reaction after reverse transcription of RNA (RT-PCR), nuclease protection, cDNA sequencing, clone hybridization, differential display31, subtractive hybridization, cDNA fragment fingerprinting32-35 and serial analysis of gene expression (SAGE)36 have all been put to good use to measure the expression levels of specific genes, characterize global expression profiles or to screen for significant differences in mRNA abundance. But if messenger RNA is only an intermediate on the way to production of the functional protein products, why measure mRNA at all? One reason is simply that protein-based approaches are generally more difficult, less sensitive and have a lower throughput than RNA-based ones. But more importantly, mRNA levels are immensely informative about cell state and the activity of genes, and for most genes, changes in mRNA abundance are related to changes in protein abundance. Because of its importance, however, many methods have been developed for monitoring protein levels either directly or indirectly (see review in this issue by Pandey and Mann, pages 837–846). These include western blots, two-dimensional gels, methods based on protein or peptide chromatographic separation and mass spectrometric detection37-40, methods that use specific protein-fusion reporter constructs and colorimetric readouts41-44, and methods based on characterization of actively translated, polysomal mRNA45-47.
The importance of the protein-based methods is that they measure the final expression product rather than an intermediate. In addition, some of them enable the detection of post-translational protein modifications (for example, phosphorylation and glycosylation) and protein complexes, and in some cases, yield information about protein localization, none of which are obtained directly by measurements of mRNA. There is no question that protein- and RNA-based measurements are complementary, and that protein-based methods are important as they measure observables that are not readily detected in other ways.
Human disease, gene expression and discoveryGenomics and gene expression experiments are sometimes derided as 'fishing expeditions'. Our view is that there is nothing wrong with a fishing expedition48 if what you are after is 'fish', such as new genes involved in a pathway, potential drug targets or expression markers that can be used in a predictive or diagnostic fashion. Because the arrays can be designed and made on the basis of only partial sequence information, it is possible to include genes in a survey that are completely uncharacterized. In many ways, the spirit of this approach is more akin to that of classical genetics in which mutations are made broadly and at random (not only in specific genes), and screens or selections are set up to discover
mutants with an interesting phenotype, which then leads to further characterization of specific genes.
Such broad discovery experiments are probably better described as 'question-driven' rather than hypothesis-driven in the conventional sense. But that is not to diminish their value for understanding basic biological processes and even for understanding and treating human disease. For example, by analysing multiple samples obtained from individuals with and without acute leukaemia or diffuse large B-cell lymphoma, gene expression (mRNA) markers were discovered that could be used in the classification of these cancers49, 50. The importance of monitoring a large number of genes was well illustrated in these studies. Golub et al.49 found that reliable predictions could not be made based on any single gene, but that predictions based on the expression levels of 50 genes (selected from the more than 6,000 monitored on the arrays) were highly accurate. The results of both of these studies indicate that measurements with more individuals and more genes will be needed to identify robust expression markers that are predictive of clinical outcome. But even with the limited initial data it was possible to help clarify an unusual case (classic leukaemia presentation but atypical morphology) and to use this information to guide the patient's clinical care.
It is also possible to take a related approach to help understand what goes wrong in cancerous, transformed cells and to identify the genes responsible for disease. Causative effects and potential therapeutic targets can be identified by determining which genes are upregulated in different tumour types51-55, and specific candidate genes can be intentionally overexpressed in cell lines or cells treated with growth factors in order to identify downstream target genes and to explore signalling pathways56-58. Tumorigenesis is often accompanied by changes in chromosomal DNA, such as genetic rearrangements, amplifications or losses of particular chromosomal loci, and developmental abnormalities, such as Down's or Turner's syndrome, may arise from aberrations in DNA copy number. Because genomic DNA can be interrogated in much the same way as mRNA, comparisons of the copy number of genomic regions or the genotype of genetic markers can be used to detect chromosomal regions and genes that are amplified or deleted in cancerous or pre-cancerous cells. By using arrays containing probes for a large number of genes or polymorphic markers, changes in DNA copy number have been detected in both breast cancer cell lines and in tumours59-61. The identification of when and where changes in copy number or chromosomal rearrangements have occurred can be used in both the classification of cancer types and the identification of regions that may harbour tumour-suppressor genes.
Whole-genome hypothesesThe use of genomics tools such as arrays does not, of course, preclude hypothesis-driven research. For fully sequenced organisms, arrays containing probes for every annotated gene in the genome have been produced14, 26. With these one can ask, for example, whether a transcription factor has a global role in transcription (affecting all genes) or a specific role (affecting only some). Holstege et al.62 used this type of application in a genome-wide expression analysis in yeast to functionally dissect the machinery of transcription initiation. Similarly, genes located near the ends of chromosomes in yeast (as well as genes at the mating-type locus) are known to be transcriptionally 'silent'. Full genome arrays allow the
chromosomal landscape of silencing to be mapped, and make it possible to test whether what is true for a handful of well-studied genes near the telomeres is true for all telomeric genes, and whether any centromere-proximal genes are also transcriptionally silenced63.
It is important to emphasize that these new, parallel approaches do not replace conventional methods. Standard methods such as northern blots, western blots or RT-PCR are simply used in a more targeted fashion to complement the broader measurements and to follow-up on the genes, pathways and mechanisms implicated by the array results. Because the incidence of false-positive results can be made sufficiently low (see Fig. 2), it is not necessary to independently confirm every change for the results to be valid and trustworthy, especially if conclusions are based on changes in sets of genes rather than individual genes. More detailed follow-up is recommended if a gene is being chosen, for example, as a drug target, as a candidate for population genetics studies, or as the target for the construction of a knockout mouse.
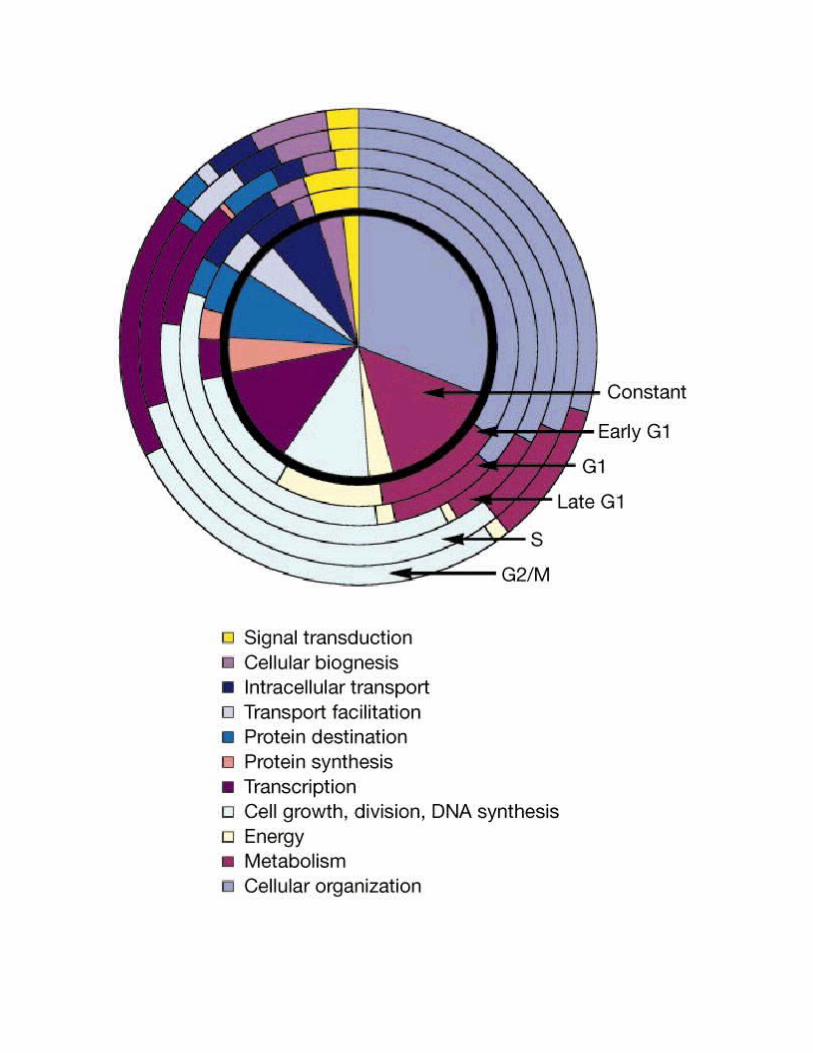
Does gene expression indicate function?As additional, uncharacterized open reading frames (ORFs) are identified in different organisms by the various genome sequencing projects, researchers have begun to ask whether the expression pattern for a gene can be used to predict the functional role of its protein product. An increasingly common approach involves using the gene expression behaviour observed over multiple experiments to first cluster genes together into groups (see Fig. 3), either by manual examination of the data24, or by using statistical methods such as self-organizing maps64, K-tuple means clustering or hierarchical clustering23, 65, 66. The basic assumption underlying this approach is that genes with similar expression behaviour (for example, increasing and decreasing together under similar circumstances) are likely to be related functionally. In this way, genes without previous functional assignments can be given tentative assignments or assigned a role in a biological process based on the known functions of genes in the same expression cluster (that is, the concept of 'guilt-by-association'). The validity of this approach has been demonstrated for many genes in Saccharomyces cerevisiae, a simple organism for which the entire genomic sequence and the functional roles of approximately 60% of the genes are known24, 65, 67 (Fig. 4). Although not logically rigorous, the utility of the guilt-by-association approach has been demonstrated, as genes already known to be related do, in fact, tend to cluster together based on their experimentally determined expression patterns ( Fig. 4). The approach is made more systematic and statistically sound by calculating the probability that the observed functional distribution of differentially expressed genes could have happened by chance. The application of statistical rigour is essential to avoid overly subjective interpretations of the results based on the predispositions, prior knowledge and interests of the individual researcher.
Figure 4 The 'guilt-by-association' method for assigning gene function. Full legend High resolution image and legend (93k)
A tentative functional assignment may not be much more than a low-resolution description or general classification. Descriptions of this type are similar to those that come out of more classical genetic screens and selections, which have provided the vast majority of functional annotations to date — they indicate that genes are involved with a particular cellular phenotype and that they are likely to be involved with a certain set of other genes and processes. This allows researchers to focus attention on a smaller subset of genes, many of which may not have been obvious candidates in the absence of the global expression observations. This overall approach highlights the importance of functional annotation and careful curation of existing sequence, function and knowledge databases (see below). Expression results covering thousands or even tens of thousands of genes and expressed sequence tags (ESTs) will be only partly interpretable given the functional and biological information available at the time they are initially generated. Our ability to extract knowledge from measurements of global gene expression tends to increase with time as additional information becomes available, and results can be subjected to further interrogation in the light of new information, observations, questions and hypotheses.
Gene expression and the regulation of transcriptionWhen information on the complete genome sequence is available, as is the case for increasing numbers of small and even larger genomes, gene expression data can be used to identify new cis-regulatory elements (genomic sequence motifs that are over-represented in the genomic DNA in the vicinity of similarly behaving genes) and 'regulons' (sets of co-regulated genes), the basic units of the underlying cellular circuitry (Fig. 3d). In fact, the correlation between the presence of specific sequence motifs in promoter regions and gene expression patterns may be stronger than the correlation between functional categories and gene expression patterns. In yeast studies, more than 50% of the genes that are transcribed in a cell cycle-specific manner and whose transcript abundance peaks in the G1 phase of the cell cycle have an MCB (Mlu cell-cycle box) within 500 base pairs (bp) of their translational start site24, 68, 69. Similar observations have been made for yeast genes whose transcription is induced during sporulation67. In addition, new cis-regulatory elements may be revealed by examining classes of co-regulated genes (Fig. 3d). With sufficiently large numbers of experimental observations of expression behaviour, the boundaries and all functioning sequence variants of cis-regulatory elements might be predicted without the need for the more conventional approach using site-directed mutagenesis ('promoter bashing'). The expression-based method will be especially valuable in exotic organisms,
such as Plasmodium falciparum , the causative agent for malaria, for which experimental identification or verification of transcription factor binding sites is difficult.
Gene expression profiles as 'fingerprints'An often overlooked aspect of measurements of global gene expression is that the sequence or even the origin of the arrayed probes does not need to be known to make interesting observations — the complex profiles, consisting of thousands of individual observations, can serve as transcriptional 'fingerprints'. The fingerprints can be used for classification purposes or as tests for relatedness, in a similar manner to the way in which DNA fingerprints are used in paternity testing. In one example, transcriptional fingerprints have been used to determine the target of a drug70. The basic idea is that if a drug interacts with and inactivates a specific cellular protein, the phenotype of the drug-treated cell should be very similar to the phenotype of a cell in which the gene encoding the protein has been genetically inactivated, usually through mutation. Thus, by comparing the expression profile of a drug-treated cell to the profiles of cells in which single genes have been individually inactivated, specific mutants can be matched to specific drugs, and therefore, targets to drugs. In a demonstration of this concept, the gene product of the his3 gene was identified correctly as the target of 3-aminotriazole70. Similarly, profiles have been used in the classification of cancers and the classification schemes did not depend on any specific information about the genes involved49, 50, although that information can be used to draw further biological and mechanistic conclusions. Finally, expression profiles can be used to classify drugs and their mode of action. For example, the functional similarity and specificity of different purine analogues have been determined by comparing the genome-wide effects on treated yeast, murine and human cells71, 72.
Expression measurements from small amounts of RNAAn important frontier in the development of gene expression technology involves reduction of the required amount of starting material. Most array-based expression measurements are done using RNA from a million or more cells, and obtaining such a relatively large sample is not a problem in many types of studies (for example, litres of yeast cells can be grown easily). However, in some cases, it is important or even necessary to use fewer cells, as when using a small organ from a fly or worm, sorted cells that express a rare marker, or laser-capture microdissected73-75 tumour tissue. Efficient and reproducible mRNA amplification methods are required, and there are two primary approaches that show significant promise. The first is a PCR-based approach that has been used to make single-cell cDNA libraries76-78. We have found that the amplification is efficient and reproducible, but that the relative abundance of the cDNA products is not well correlated with the original mRNA levels (D. Giang and D. J. Lockhart, unpublished results), although normalization and referencing strategies can be used (D. de Graaf and E. Lander, personal communication).
The second approach avoids PCR altogether and uses multiple rounds of linear amplification based on cDNA synthesis and a template-directed in vitro transcription (IVT) reaction79-81. This method has been used to characterize mRNA from single live neurons81 and even subcellular regions, and more recently to amplify mRNA from 500 to 1,000 cells from microdissected brain tissues for hybridization to spotted cDNA arrays82. We have found that the multiple-round cDNA/IVT amplification method produces sufficient
quantities of labelled material starting with as little as 1–50 ng total RNA, is highly reproducible (correlation coefficients greater than 0.97), and introduces much less quantitative bias than PCR-based amplification (D. Giang and D. J. Lockhart, unpublished results). These amplification methods facilitate the possibility of monitoring large number of genes starting with very limited amounts of RNA and very few cells. The combination of arrays and powerful amplification strategies promises to be especially important for studies that use human biopsy material from inhomogeneous tissue, and in the areas of developmental biology, immunology and neurobiology.
Genome analysis using arraysAlthough nucleic acid arrays are often equated with gene expression analysis, they may be used to collect much of the data that are obtained presently by Southern or northern blot hybridization techniques, but in a more highly parallel fashion (Figs 5, 6). Their utility in polymorphism detection and genotyping is described elsewhere (see review in this issue by Roses, pages 857–865), but there are many additional uses for these versatile tools. For example, genomic DNA samples can be manipulated experimentally to select for particular regions before hybridization to obtain specific types of information. In yeast, the location of hundreds of chromosomal origins of replication can be determined in parallel by enriching for early-replicating regions using a variation of the Meselsohn–Stahl procedure and then hybridizing the resulting DNA to full genome arrays (E. A. Winzeler et al., unpublished results). Similarly, as probes for more intergenic regions are synthesized on arrays, it becomes possible to identify protein-binding sites: fragmented chromatin can be crosslinked to a protein and then immunoprecipitated with an antibody to that protein. The DNA fraction of the immunoprecipitate can be labelled and hybridized to identify the approximate location of the binding site. In addition, full genome arrays can be used in the analysis of plasmid libraries in genetic selections such as two-hybrid screens83 or, in principal, for any other type of experiment in which the information is contained in the form of RNA or DNA. Arrays also have applications in biophysical chemistry and biochemistry. For example, single-stranded DNA arrays were converted enzymatically into arrays of double-stranded DNA to characterize the interactions of proteins, and potentially other types of molecules, with double-stranded DNA84.
Figure 5 Generic oligonucleotide tag arrays for parallel phenotyping of mutant yeast strains. Full legend High resolution image and legend (69k)
Figure 6 Comparative genome hybridization using arrays26, 106, 107. Full legend High resolution image and legend (143k)
Gene expression and cell circuitryIs it reasonable to consider the cell as a complex analogue circuit, and to attempt to reverse-engineer the cell circuitry much like an electrical engineer would do by measuring currents and voltages at a variety of nodes and under a variety of input conditions? In the case of the cell, expression levels and expression changes might take the place of electrical measurements, and could be measured under many experimental conditions. Is it possible that a genetic or cellular circuit of reasonable complexity could be adequately decoded or modelled, and if so, how many and what types of measurements and perturbations (or 'inputs') would be required so that the problem was not hopelessly underdetermined85-89? Reasonably detailed circuit diagrams can be drawn and simulations of simple genetic circuits have been performed for systems of low complexity (for example, the lytic cycle of phage lambda, and simple control networks in Escherichia coli bacteria90). But the situation is considerably more complex in the case of a eukaryotic cell. Using yeast as an example, if we assume that the expression level for each gene can be one of only four levels (off, low, medium or high), then if the 6,200 yeast genes behave independently, there are 6,2004, or 1.5 1015 possible expression states. Of course, the expression levels of different genes are not all independent of one another, and there are some states that are physically unrealistic (for example, all genes 'off' or all genes 'high'), but the number of possible cellular configurations is very large. In addition, coupling between circuit components, the effects of nonlinear feedback, redundancy and even noise and stochastic events make simulating a circuit of this complexity a rather daunting task, and not all relationships and cellular events are reflected at the level of mRNA abundance.
Least clear may be what types of perturbations or inputs are likely to be the most informative in terms of defining the relationships between genes and pathways, and what might be a minimal set of 'orthogonal perturbations' (treatments, genetic manipulations or growth conditions that have minimal overlap in their direct cellular effects). Certainly it is possible to delete every yeast gene one at a time (or even several at a time) and measure the expression profile for each mutant strain under a set of different growth conditions70, 91. It is also possible to grow yeast on a matrix of thousands of different conditions and measure the resulting expression profiles for a range of mutated strains. It is clear that extensive experiments of this type, combined with information from other measurements such as yeast two-hybrid protein–protein interaction screens92, and measurements of protein levels, modification states and cellular localization will lead to useful groupings of genes in terms of function and regulation (that is, a genetic, molecular and functional taxonomy), and to supply some reasonably detailed information about the relationships between certain genes and pathways. In addition, sets of perturbations directed towards specific functions and
cellular processes will allow higher-resolution and even mechanistic information for significant parts of the overall circuitry62, 93. However, given the tremendous complexity of the system, it is unlikely that a complete and detailed cellular circuit diagram will result for even single-celled eukaryotes such as yeast any time in the near future. But that is not to say that construction of even first-order global models and semi-quantitative circuit diagrams is not extremely useful. Such models serve to organize current information, relationships and hypotheses, and can be tremendously helpful for testing new hypotheses, interpreting new observations, designing new experiments and predicting the likely effects of particular chemical, genetic or cellular perturbations. They also serve as a scaffold upon which to build higher-resolution, more quantitative and complete models.
Can we have too much data?Contrary to what is sometimes thought, the biggest problem for making sense of the extensive results from genomics experiments is not that there is too much data or that there are insufficiently sophisticated algorithms and software tools for querying and visualizing data on this scale. Larger problems of data management and analysis have been solved by airlines, financial institutions, global retailers, high-energy and plasma physicists, the military and global weather predictors, among others. It is often beneficial to have a large number of measurements94 and sometimes more data make it possible to analyse results that might otherwise have been too 'messy', and to detect patterns and relationships that would not have been obvious or have sufficient statistical significance with smaller data sets. In many types of studies, it is not possible to control completely all variables, and the individual differences between common sample types may be significant because of experimental difficulties (for example, tissue inhomogeneity or variations in sample procedures) or individual genetic variation (for example, different patients or different tumours). But such factors do not preclude the discovery of some genes that clearly 'cluster' or differentiate between the sample sets. For example, meaningful results can be extracted from the analysis of human tissue collected at different hospitals, by different surgeons and at different times. An essential requirement in these types of studies is that a sufficient number of experiments be performed across multiple individuals and multiple tissue or tumour samples to account for individual variation and possible tissue inhomogeneity. Furthermore, confidence in the results is increased as conclusions are based on sets of genes that show a consistent response and that are consistently different between two or more sets of results49, 50, 52, 53, 95.
Making sense of genomic resultsAlthough the difficulties of sample collection, data collection and experimental design should not be underestimated, one of the most challenging aspects of gene expression analysis is making sense of the vast quantities of data and extracting conclusions and hypotheses that are biologically meaningful. From experiments on global gene expression, we may obtain data for thousands of genes, often forcing us to consider processes, functions and mechanisms about which we know very little. Thus, there is a need for more sophisticated systems of knowledge representation (or 'knowledge bases') that organize the data, facts, observations, relationships and even hypotheses that form the basis of our current scientific understanding. This information needs to be more than just stored; it needs to be available in a way that helps scientists understand and interpret the often complex observations that are becoming increasingly easy to make. Unfortunately, the fact
is that the scientific literature has been somewhat haphazardly built, without the benefit of a controlled or restricted vocabulary and a well defined semantic and grammar. To take full advantage of the abilities of the new technologies and the rapidly increasing amount of sequence information it is absolutely essential to incorporate the facts, ideas, connections, observations and so forth, which exist in the scientific literature and in the minds of scientists, into a form that is systematic, organized, linked, visualized and searchable. This clearly requires a great deal of dedicated, systematic human effort, but progress has been made. Databases such as the Saccharomyces Genome Database (SGD: genome-http://genome-www.stanford.edu/Saccharomyces ), the Munich Information Center for Protein Sequences (MIPS: http://www.mips.biochem.mpg.de), WormBase (http://www.wormbase.org ), the Kyoto Encyclopedia of Genes and Genomes (KEGG: http://www.genome.ad.jp/kegg ), the Encyclopedia of E. coli Genes and Metabolism (EcoCyc: http://ecocyc.panbio.com/ecocyc) and FlyBase (http://flybase.bio.Indiana.edu/ ) incorporate sequence, genetics, gene expression, homology, regulation, function and phenotype information in an organized and useable form96-102. But a step beyond databases of this type are ones in which concepts as well as facts are more fully integrated and related, allowing connections to be made between initially disparate observations and information, and across organisms. It is conceivable that the next step will evolve to the level of a biological 'expert system', not unlike the expert system ('Big Blue') that IBM scientists and engineers built to play chess (successfully) against the world's best chess player. Despite the potential for advancement on this front, it seems unlikely that computational tools will ever replace the trained human brain when it comes to making biological sense of new results. However, the appropriate tools are needed to bring information and relationships to scientist's fingertips so that the most insightful questions can be asked and the most meaningful interpretations made.
ConclusionFor these array-based methods to become truly revolutionary, they must become an integral part of the daily activities of the typical molecular biology laboratory. Despite their impressive and rapidly growing résumé, these technologies are still in their infancy, with plenty of room for technical improvements, further development, and more widespread acceptance and accessibility. We expect that the pattern of development and use of arrays and other parallel genomic methodologies will be similar to that seen for computers and other high-tech electronic devices, which started out as exotic and expensive tools in the hands of the few developers and early adopters, and then moved quickly to become easier to use, more available, less expensive and more powerful, both individually and because of their ubiquity. In fact, nucleic acid array-based methods that previously seemed exotic, and too expensive, are becoming routine as indicated by the huge increase in the number of publications that incorporate data obtained in this way. Despite the relative youth of these approaches, the achievement of technical goals that would have seemed like science fiction only a few years ago is now clearly in view. For example, we expect that measuring the expression level of essentially every gene (including variant splice forms) on an array or two starting with RNA from a small number of cells, or even a single cell, will soon be possible owing to advances in single-cell handling and RNA amplification methods, the output of large-scale sequencing efforts and achievable advances in array technology. In the future, arrays of peptides, proteins, small molecules, mRNAs, clones, tissues, cells and even multicellular organisms such as the nematode worm Caenorhabditis elegans may also
become common. The combined use of all of these highly parallel methods, along with sequence information, computational tools, integrated knowledge databases, and the traditional approaches of biology, biochemistry, chemistry, physics, mathematics and genetics, increases the hopes of understanding the function and regulation of all genes and proteins, deciphering the underlying workings of the cell, determining the mechanisms of disease, and discovering ways to intervene with or prevent aberrant cellular processes in order to improve human health and well-being.
References
1. Dunham, I. et al. The DNA sequence of human chromosome 22. Nature 402, 489-495 (1999). | Article | PubMed | ISI |
2. Hattori, M. et al. The DNA sequence of human chromosome 21. Nature 405, 311-319 (2000). | Article | PubMed | ISI |
3. Lennon, G. G. & Lehrach, H. Hybridization analyses of arrayed cDNA libraries. Trends Genet. 7, 314-317 (1991). | PubMed | ISI |
4. Kafatos, F. C., Jones, C. W. & Efstratiadis, A. Determination of nucleic acid sequence homologies and relative concentrations by a dot hybridization procedure. Nucleic Acids Res. 7, 1541-1552 (1979). | PubMed | ISI |
5. Gillespie, D. & Spiegelman, S. A quantitative assay for DNA-RNA hybrids with DNA immobilized on a membrane. J. Mol. Biol. 12, 829-842 (1965). | PubMed | ISI |
6. Southern, E. M. et al. Arrays of complementary oligonucleotides for analysing the hybridisation behaviour of nucleic acids. Nucleic Acids Res. 22, 1368-1373 (1994). | PubMed | ISI |
7. Zhao, N., Hashida, H., Takahashi, N., Misumi, Y. & Sakaki, Y. High-density cDNA filter analysis: a novel approach for large-scale, quantitative analysis of gene expression. Gene 156, 207-213 (1995). | Article | PubMed | ISI |
8. Nguyen, C. et al. Differential gene expression in the murine thymus assayed by quantitative hybridization of arrayed cDNA clones. Genomics 29, 207-216 (1995). | Article | PubMed | ISI |
9. Fodor, S. P. A. et al. Light-directed, spatially addressable parallel chemical synthesis. Science 251, 767-773 (1991). | PubMed | ISI |
10. Fodor, S. P. et al. Multiplexed biochemical assays with biological chips. Nature 364, 555-556 (1993). | PubMed | ISI |
11. Pease, A. C. et al. Light-generated oligonucleotide arrays for rapid DNA sequence analysis. Proc. Natl Acad. Sci. USA 91, 5022-5026 (1994). | PubMed | ISI |
12. Schena, M., Shalon, D., Davis, R. W. & Brown, P. O. Quantitative monitoring of gene expression patterns with a complementary DNA microarray. Science 270, 467-470 (1995). | PubMed | ISI |
13. Shalon, D., Smith, S. J. & Brown, P. O. A DNA microarray system for analyzing complex DNA samples using two-color fluorescent probe hybridization. Genome Res. 6, 639-645 (1996). | PubMed | ISI |
14. DeRisi, J. L., Iyer, V. R. & Brown, P. O. Exploring the metabolic and genetic control of gene expression on a genomic scale. Science 278, 680-686 (1997). | Article | PubMed | ISI |
15. Lipshutz, R. J., Fodor, S. P., Gingeras, T. R. & Lockhart, D. J. High density synthetic oligonucleotide arrays. Nature Genet. 21, 20-24 (1999). | Article | PubMed | ISI |
16. Bowtell, D. D. Options available--from start to finish--for obtaining expression data by microarray. Nature Genet. 21, 25-32 (1999). | Article | PubMed | ISI |
17. Edman, C. F. et al. Electric field directed nucleic acid hybridization on microchips. Nucleic Acids Res. 25, 4907-4914 (1997). | Article | PubMed | ISI |
18. Sosnowski, R. G., Tu, E., Butler, W. F., O'Connell, J. P. & Heller, M. J. Rapid determination of
single base mismatch mutations in DNA hybrids by direct electric field control. Proc. Natl Acad. Sci. USA 94, 1119-1123 (1997). | Article | PubMed | ISI |
19. Gray, D. E., Case-Green, S. C., Fell, T. S., Dobson, P. J. & Southern, E. M. Ellipsometric and interferometric characterization of DNA probes immobilised on a combinatorial array. Langmuir 13, 2833-2842 (1997). | Article | ISI |
20. Walt, D. R. Bead-based fiber-optic arrays. Science 287, 451 (2000). | Article | PubMed | ISI |21. Michael, K. L., Taylor, L. C., Schultz, S. L. & Walt, D. R. Randomly ordered addressable high-
density optical sensor arrays. Anal. Chem. 70, 1242-1248 (1998). | Article | PubMed | ISI |22. Ferguson, J. A., Boles, T. C., Adams, C. P. & Walt, D. R. A fiber-optic DNA biosensor
microarray for the analysis of gene expression. Nature Biotechnol. 14, 1681-1684 (1996). | PubMed | ISI |
23. Spellman, P. T. et al. Comprehensive identification of cell cycle-regulated genes of the yeast Saccharomyces cerevisiae by microarray hybridization. Mol. Biol. Cell 9, 3273-3297 (1998). | PubMed | ISI |
24. Cho, R. J. et al. A genome-wide transcriptional analysis of the mitotic cell cycle. Mol. Cell 2, 65-73 (1998). | PubMed | ISI |
25. The Chipping forecast. Nature Genet. 21(Suppl.), 1-60 (1999).26. Wodicka, L., Dong, H., Mittmann, M., Ho, M.-H & Lockhart, D. J. Genome-wide expression
27. White, K. P., Rifkin, S. A., Hurban, P. & Hogness, D. S. Microarray analysis of Drosophila development during metamorphosis. Science 286, 2179-2184 (1999). | Article | PubMed | ISI |
28. Chambers, J. et al. DNA microarrays of the complex human cytomegalovirus genome: profiling kinetic class with drug sensitivity of viral gene expression. J. Virol. 73, 5757-5766 (1999). | PubMed | ISI |
29. Gingeras, T. R. et al. Simultaneous genotyping and species identification using hybridization pattern recognition analysis of generic mycobacterium DNA arrays. Genome Res. 8, 435-448 (1998). | PubMed | ISI |
30. Lockhart, D. J. et al. Expression monitoring by hybridization to high-density oligonucleotide arrays. Nature Biotechnol. 14, 1675-1680 (1996). | PubMed | ISI |
31. Liang, P. & Pardee, A. B. Differential display of eukaryotic messenger RNA by means of the polymerase chain reaction. Science 257, 967-971 (1992). | PubMed | ISI |
32. Shimkets, R. A. et al. Gene expression analysis by transcript profiling coupled to a gene database query. Nature Biotechnol. 17, 798-803 (1999). | Article | PubMed | ISI |
33. Ivanova, N. B. & Belyavsky, A. V. Identification of differentially expressed genes by restriction endonuclease-based gene expression fingerprinting. Nucleic Acids Res. 23, 2954-2958 (1995). | PubMed | ISI |
34. Kato, K. Description of the entire mRNA population by a 3' end cDNA fragment generated by class IIS restriction enzymes. Nucleic Acids Res. 23, 3685-3690 (1995). | PubMed | ISI |
35. Bachem, C. W. et al. Visualization of differential gene expression using a novel method of RNA fingerprinting based on AFLP: analysis of gene expression during potato tuber development. Plant J. 9, 745-753 (1996). | PubMed | ISI |
36. Velculescu, V. E., Zhang, L., Vogelstein, B. & Kinzler, K. W. Serial analysis of gene expression. Science 270, 484-487 (1995). | PubMed | ISI |
37. Boucherie, H. et al. Two-dimensional protein map of Saccharomyces cerevisiae: construction of a gene-protein index. Yeast 11, 601-613 (1995). | PubMed | ISI |
38. Gygi, S. P. et al. Quantitative analysis of complex protein mixtures using isotope-coded affinity tags. Nature Biotechnol. 17, 994-999 (1999). | Article | PubMed | ISI |
40. Oda, Y., Huang, K., Cross, F. R., Cowburn, D. & Chait, B. T. Accurate quantitation of protein expression and site-specific phosphorylation. Proc. Natl Acad. Sci. USA 96, 6591-6596 (1999). | Article | PubMed | ISI |
41. Burns, N. et al. Large-scale analysis of gene expression, protein localization, and gene disruption in Saccharomyces cerevisiae. Genes Dev. 8, 1087-1105 (1994). | PubMed | ISI |
42. Ross-Macdonald, P., Sheehan, A., Roeder, G. S. & Snyder, M. A multipurpose transposon system for analyzing protein production, localization, and function in Saccharomyces cerevisiae. Proc. Natl Acad. Sci. USA 94, 190-195 (1997). | Article | PubMed | ISI |
43. Ross-Macdonald, P. et al. Large-scale analysis of the yeast genome by transposon tagging and gene disruption. Nature 402, 413-418 (1999). | Article | PubMed | ISI |
44. Niedenthal, R. K., Riles, L., Johnston, M. & Hegemann, J. H. Green fluorescent protein as a marker for gene expression and subcellular localization in budding yeast. Yeast 12, 773-786 (1996). | Article | PubMed | ISI |
45. Zong, Q., Schummer, M., Hood, L. & Morris, D. R. Messenger RNA translation state: the second dimension of high-throughput expression screening. Proc. Natl Acad. Sci. USA 96, 10632-10636 (1999). | Article | PubMed | ISI |
46. Johannes, G., Carter, M. S., Eisen, M. B., Brown, P. O. & Sarnow, P. Identification of eukaryotic mRNAs that are translated at reduced cap binding complex eIF4F concentrations using a cDNA microarray. Proc. Natl Acad. Sci. USA 96, 13118-13123 (1999). | Article | PubMed | ISI |
47. Diehn, M., Eisen, M. B., Botstein, D. & Brown, P. O. Large-scale identification of secreted and membrane-associated gene products using DNA microarrays. Nature Genet. 25, 58-62 (2000). | Article | PubMed | ISI |
48. Weinstein, J. N. Fishing expeditions. Science 282, 628-629 (1998). | PubMed | ISI |49. Golub, T. R. et al. Molecular classification of cancer: class discovery and class prediction by
gene expression monitoring. Science 286, 531-537 (1999). | Article | PubMed | ISI |50. Alizadeh, A. A. et al. Distinct types of diffuse large B-cell lymphoma identified by gene
expression profiling. Nature 403, 503-510 (2000). | Article | PubMed | ISI |51. Mack, D. H. et al. in Deciphering Molecular Circuitry Using High-Density DNA Arrays (eds
Hihich, E. & Croce, E.) 85-108 (Plenum, New York, 1998).52. Alon, U. et al. Broad patterns of gene expression revealed by clustering analysis of tumor and
normal colon tissues probed by oligonucleotide arrays. Proc. Natl Acad. Sci. USA 96, 6745-6750 (1999). | Article | PubMed | ISI |
53. Perou, C. M. et al. Distinctive gene expression patterns in human mammary epithelial cells and breast cancers. Proc. Natl Acad. Sci. USA 96, 9212-9217 (1999). | Article | PubMed | ISI |
54. Ross, D. T. et al. Systematic variation in gene expression patterns in human cancer cell lines. Nature Genet. 24, 227-235 (2000). | Article | PubMed | ISI |
55. Scherf, U. et al. A gene expression database for the molecular pharmacology of cancer. Nature Genet. 24, 236-244 (2000). | Article | PubMed | ISI |
56. Fambrough, D., McClure, K., Kazlauskas, A. & Lander, E. S. Diverse signaling pathways activated by growth factor receptors induce broadly overlapping, rather than independent, sets of genes. Cell 97, 727-741 (1999). | PubMed | ISI |
57. Lee, S. B. et al. The Wilms tumor suppressor WT1 encodes a transcriptional activator of amphiregulin. Cell 98, 663-673 (1999). | PubMed | ISI |
58. Harkin, D. P. et al. Induction of GADD45 and JNK/SAPK-dependent apoptosis following inducible expression of BRCA1. Cell 97, 575-586 (1999). | PubMed | ISI |
59. Mei, R. et al. Genome-wide detection of allelic imbalance using human SNPs and high density DNA arrays. Genome Res. (in the press). | PubMed |
60. Pollack, J. R. et al. Genome-wide analysis of DNA copy-number changes using cDNA microarrays. Nature Genet. 23, 41-46 (1999). | Article | PubMed | ISI |
61. Pinkel, D. et al. High resolution analysis of DNA copy number variation using comparative genomic hybridization to microarrays. Nature Genet. 20, 207-211 (1998). | Article | PubMed | ISI |
62. Holstege, F. C. et al. Dissecting the regulatory circuitry of a eukaryotic genome. Cell 95, 717-728 (1998). | PubMed | ISI |
63. Wyrick, J. J. et al. Chromosomal landscape of nucleosome-dependent gene expression and
silencing in yeast. Nature 402, 418-421 (1999). | Article | PubMed | ISI |64. Tamayo, P. et al. Interpreting patterns of gene expression with self-organizing maps: methods
and application to hematopoietic differentiation. Proc. Natl Acad. Sci. USA 96, 2907-2912 (1999). | Article | PubMed | ISI |
65. Eisen, M. B., Spellman, P. T., Brown, P. O. & Botstein, D. Cluster analysis and display of genome-wide expression patterns. Proc. Natl Acad. Sci. USA 95, 14863-14868 (1998). | Article | PubMed | ISI |
66. Wen, X. et al. Large-scale temporal gene expression mapping of central nervous system development. Proc. Natl Acad. Sci. USA 95, 334-339 (1998). | Article | PubMed | ISI |
67. Chu, S. et al. The transcriptional program of sporulation in budding yeast. Science 282, 699-705 (1998). | Article | PubMed | ISI |
68. Tavazoie, S., Hughes, J. D., Campbell, M. J., Cho, R. J. & Church, G. M. Systematic determination of genetic network architecture. Nature Genet. 22, 281-285 (1999). | Article | PubMed | ISI |
69. Wolfsberg, T. G. et al. Candidate regulatory sequence elements for cell cycle-dependent transcription in Saccharomyces cerevisiae. Genome Res. 9, 775-792 (1999). | PubMed | ISI |
70. Marton, M. J. et al. Drug target validation and identification of secondary drug target effects using DNA microarrays. Nature Med. 4, 1293-1301 (1998). | Article | PubMed | ISI |
71. Gray, N. S. et al. Exploiting chemical libraries, structure, and genomics in the search for kinase inhibitors. Science 281, 533-538 (1998). | Article | PubMed | ISI |
72. Rosania, G. R. et al. Myoseverin: a microtubule binding molecule with novel cellular effects. Nature Biotechnol. 18, 304-308 (2000). | Article | PubMed | ISI |
73. Emmert-Buck, M. R. et al. Laser capture microdissection. Science 274, 998-1001 (1996). | Article | PubMed | ISI |
74. Bonner, R. F. et al. Laser capture microdissection: molecular analysis of tissue. Science 278, 1481-1483 (1997). | Article | PubMed | ISI |
75. Simone, N. L., Bonner, R. F., Gillespie, J. W., Emmert-Buck, M. R. & Liotta, L. A. Laser-capture microdissection: opening the microscopic frontier to molecular analysis. Trends Genet. 14, 272-276 (1998). | Article | PubMed | ISI |
76. Wang, A. M., Doyle, M. V. & Mark, D. F. Quantitation of mRNA by the polymerase chain reaction. Proc. Natl Acad. Sci. USA 86, 9717-9721 (1989). | PubMed | ISI |
77. Dulac, C. Cloning of genes from single neurons. Curr. Top. Dev. Biol. 36, 245-258 (1998). | PubMed | ISI |
78. Jena, P. K., Liu, A. H., Smith, D. S. & Wysocki, L. J. Amplification of genes, single transcripts and cDNA libraries from one cell and direct sequence analysis of amplified products derived from one molecule. J. Immunol. Methods 190, 199-213 (1996). | Article | PubMed | ISI |
79. Kwoh, D. Y. et al. Transcription-based amplification system and detection of amplified human immunodeficiency virus type 1 with a bead-based sandwich hybridization format. Proc. Natl Acad. Sci. USA 86, 1173-1177 (1989). | PubMed | ISI |
80. Guatelli, J. C. et al. Isothermal, in vitro amplification of nucleic acids by a multienzyme reaction modeled after retroviral replication. Proc. Natl Acad. Sci. USA 87, 7797 (1990). | PubMed | ISI |
81. Eberwine, J. et al. Analysis of gene expression in single live neurons. Proc. Natl Acad. Sci. USA 89, 3010-3014 (1992). | PubMed | ISI |
82. Luo, L. et al. Gene expression profiles of laser-captured adjacent neuronal subtypes. Nature Med. 5, 117-122 (1999). | Article | PubMed | ISI |
83. Cho, R. J. et al. Parallel analysis of genetic selections using whole genome oligonucleotide arrays. Proc. Natl Acad. Sci. USA 95, 3752-3757 (1998). | Article | PubMed | ISI |
84. Bulyk, M. L., Gentalen, E., Lockhart, D. J. & Church, G. M. Quantifying DNA-protein interactions by double-stranded DNA arrays. Nature Biotechnol. 17, 573-577 (1999). | Article | PubMed | ISI |
85. Brent, R. Genomic biology. Cell 100, 169-183 (2000). | PubMed | ISI |86. McAdams, H. H. & Shapiro, L. Circuit simulation of genetic networks. Science 269, 650-656
87. McAdams, H. H. & Arkin, A. It's a noisy business! Genetic regulation at the nanomolar scale. Trends Genet. 15, 65-69 (1999). | Article | PubMed | ISI |
88. Bhalla, U. S. & Iyengar, R. Emergent properties of networks of biological signaling pathways. Science 283, 381-387 (1999). | Article | PubMed | ISI |
89. Weng, G., Bhalla, U. S. & Iyengar, R. Complexity in biological signaling systems. Science 284, 92-96 (1999). | Article | PubMed | ISI |
90. Arkin, A., Ross, J. & McAdams, H. H. Stochastic kinetic analysis of developmental pathway bifurcation in phage lambda-infected Escherichia coli cells. Genetics 149, 1633-1648 (1998). | PubMed | ISI |
91. Winzeler, E. et al. Functional characterization of the Saccharomyces cerevisiae genome by precise deletion and parallel analysis. Science 285, 901-906 (1999). | Article | PubMed | ISI |
92. Fields, S. & Song, O. A novel genetic system to detect protein-protein interactions. Nature 340, 245-246 (1989). | PubMed | ISI |
93. Roberts, C. J. et al. Signaling and circuitry of multiple MAPK pathways revealed by a matrix of global gene expression profiles. Science 287, 873-880 (2000). | Article | PubMed | ISI |
94. Brown, P. O. & Botstein, D. Exploring the new world of the genome with DNA microarrays. Nature Genet. 21, 33-37 (1999). | Article | PubMed | ISI |
95. Ly, D., Lockhart, D. J., Lerner, R. & Schultz, P. G. Mitotic misregulation and human aging. Science 287, 2486-22492 (2000). | Article | PubMed | ISI |
96. Cherry, J. M. et al. Genetic and physical maps of Saccharomyces cerevisiae. Nature 387, 67-73 (1997). | PubMed | ISI |
97. Ball, C. A. et al. Integrating functional genomic information into the Saccharomyces Genome Database. Nucleic Acids Res. 28, 77-80 (2000). | Article | PubMed | ISI |
98. Mewes, H. W. et al. MIPS: a database for genomes and protein sequences. Nucleic Acids Res. 28, 37-40 (2000). | Article | PubMed | ISI |
99. Walsh, S., Anderson, M. & Cartinhour, S. W. ACEDB: a database for genome information. Methods Biochem. Anal. 39, 299-318 (1998). | PubMed | ISI |
100. Kanehisa, M. & Goto, S. KEGG: Kyoto Encyclopedia of Genes and Genomes. Nucleic Acids Res. 28, 27-30 (2000). | Article | PubMed | ISI |
101. The FlyBase Consortium. The FlyBase Database of the Drosophila Genome Projects and community literature. Nucleic Acids Res. 27, 85-88 (1999). | PubMed |
102. Karp, P. D., Riley, M., Paley, S. M., Pellegrini-Toole, A. & Krummenacker, M. EcoCyc: encyclopedia of Escherichia coli genes and metabolism. Nucleic Acids Res. 27, 50-53 (1999).
103. Iyer, V. & Struhl, K. Absolute mRNA levels and transcriptional initiation rates in Saccharomyces cerevisiae. Proc. Natl Acad. Sci. USA 93, 5208-5212 (1996). | Article | PubMed | ISI |
104. Lee, C. K., Klopp, R. G., Weindruch, R. & Prolla, T. A. Gene expression profile of aging and its retardation by caloric restriction. Science 285, 1390-1393 (1999). | Article | PubMed | ISI |
105. Fan, J.-B et al. Parallel genotyping of human SNPs using generic oligonucleotide tag arrays. Genome Res. (in the press).
106. Lashkari, D. A. et al. Yeast microarrays for genome wide parallel genetic and gene expression analysis. Proc. Natl Acad. Sci. USA 94, 13057-13062 (1997). | Article | PubMed | ISI |
107. Winzeler, E., Lee, B., McCusker, J. & Davis, R. Whole genome genetic typing using high-density oligonucleotide arrays. Parasitology 118, S73-S80 (1999). | PubMed | ISI |
108. Winzeler, E. A. et al. Direct allelic variation scanning of the yeast genome. Science 281, 1194-1197 (1998). | Article | PubMed | ISI |
109. Troesch, A. et al. Mycobacterium species identification and rifampin resistance testing with high-density DNA probe arrays. J. Clin. Microbiol. 37, 49-55 (1999). | PubMed | ISI |
Acknowledgements. We thank S. Fodor, M. Chee, R. Davis, L. Stryer, E. Lander, H. Dong, L. Wodicka, R. Cho, D. Giang, P. Zarrinkar, C. Barlow, J. Gentry, P. Schultz and R. Abagyan for their on-going help and patience, and B. Geierstanger, G. Hampton and S. Kay for helpful comments and a critical reading of the manuscript.
Figure 1 Principal types of arrays used in gene expression monitoring. Nucleic acid arrays are generally produced in one of two ways: by robotic deposition of nucleic acids (PCR products, plasmids or oligonucleotides) onto a glass slide25 or in situ synthesis (using photolithography15) of oligonucleotides. Shown are pseudocolour images of a, an oligonucleotide array and b, a cDNA array after hybridization of labelled samples and fluorescence detection. In both cases the images have been coloured to indicate the relative number of yeast transcripts present under two different growth conditions (red, high in condition 1, low in condition 2; green, high in condition 2, low in condition 1; yellow, high under both conditions; black, low under both conditions). In the case of photolithographically synthesized arrays, 107 copies of each selected oligonucleotide (usually 20 to 25 nucleotides in length) are synthesized base by base in hundreds of thousands of different 24 m 24 m areas on a 1.28 cm 1.28 cm glass surface. For robotic deposition, approximately one nanogram of material is deposited at intervals of 100–300 m. Typically for oligonucleotide arrays, multiple probes per gene are placed on the array (20 pairs in the example shown here), while in the case of robotic deposition, a single, longer (up to 1,000 bp) double-stranded DNA probe is used for each gene or EST. In both cases, probes are usually designed from sequence located nearer to the 3' end of the gene (near the poly-A tail in eukaryotic mRNA), and different probes can be used for different exons. After hybridization of labelled samples (typically overnight), the arrays are
scanned and the quantitative fluorescence image along with the known identity of the probes is used to assess the 'presence' or 'absence' (more precisely, the detectability above thresholds based on background and noise levels) of a particular molecule (such as a transcript), and its relative abundance in one or more samples. Because the sequence of the oligonucleotide or cDNA at each physical location (or address) is generally known or can be determined, and because the recognition rules that govern hybridization are well understood, the signal intensity at each position gives not only a measure of the number of molecules bound, but also the likely identity of the molecules. Although oligonucleotide probes vary systematically in their hybridization efficiency, quantitative estimates of the number of transcripts per cell can be obtained directly by averaging the signal from multiple probes15, 26, 30. For technical reasons, the information obtained from spotted cDNA arrays gives the relative concentration (ratio) of a given transcript in two different samples (derived from competitive, two-colour hybridizations). Messenger RNAs present at a few copies (relative abundance of 1:100,000 or less) to thousands of copies per mammalian cell can be detected25, 26, 30, and changes as subtle as a factor of 1.3 to 2 can be reliably detected if replicate experiments are performed. c, Different methods for preparing labelled material for measurements of gene expression. The RNA can be labelled directly, using a psoralen–biotin derivative or by ligation to an RNA molecule carrying biotin26; labelled nucleotides can be incorporated into cDNA during or after reverse transcription of polyadenylated RNA; or cDNA can be generated that carries a T7 promoter at its 5' end. In the last case, the double-stranded cDNA serves as template for a reverse transcription reaction in which labelled nucleotides are incorporated into cRNA. Commonly used labels include the fluorophores fluorescein, Cy3 (or Cy5), or nonfluorescent biotin, which is subsequently labelled by staining with a fluorescent streptavidin conjugate. d, Two-colour hybridization strategy often used with cDNA microarrays. cDNA from two different conditions is labelled with two different fluorescent dyes (usually Cy3 and Cy5), and the two samples are co-hybridized to an array. After washing, the array is scanned at two different wavelengths to detect the relative transcript abundance for each condition. cDNA array image courtesy of J. DeRisi and P. O. Brown (http://cmgm.stanford.edu/pbrown/yeastchip.html ).
Figure 3 Methods for analysing gene expression data shown for measurements of expression in the cell cycle of S. cerevisiae. a, Yeast cells were synchronized and cells were collected every ten minutes throughout two complete synchronous cycles (18 time points in total are shown). Expression data were collected by hybridizing labelled cDNA samples to high-density oligonucleotide arrays. Transcript levels were determined for almost every gene in the genome for every time point24. A sample of 409 genes (from a total of 6,000) that showed both a significant (more than twofold) fluctuation in transcript levels during the time course and cell cycle-dependent periodicity were selected for further analysis. b, Dendrogram indicating similarity of expression profiles, calculated using the Pearson correlation function in the GeneSpring software package (Silicon Genetics, San Carlos, CA). For display purposes, the relative expression levels were plotted in red (high) and blue (low). c, The genes were divided into five different temporal expression classes (red, early G1; light blue, G1; green, late G1; dark blue, S; orange, G2/M) using K-tuple means clustering (also using GeneSpring software) and the clusters were named according to their time of peak expression within the cell cycle. d, Line graphs for all genes in the clusters defined in b. e, Location of cell cycle-regulated genes within the dendrogram in a that have cis-regulatory sequence elements in the 500 bp upstream of their promoter. Column 1, MCB sites (ACGCGT); column 2, ECB sites (TTWCCCNNNNAGGAA); column 3, a new sequence (GTAAACAA or TTGTTTAC) was identified that was statistically associated ( p
= 1.77 10-7 for the forward direction, p = 0.003 for the reverse) with the promoter regions of genes whose expression peaked in G2/M phase.
Figure 4 The 'guilt-by-association' method for assigning gene function. Functional distribution (using categories from MIPS: http://www.mips.biochem.mpg.de/proj/yeast/catalogues/funcat/index.html ) of yeast genes whose periodic expression peaked at different times in the yeast cell cycle (outer rings) or was constant throughout the cell cycle (inner circle)24. A much larger fraction of cell cycle-modulated genes is important in DNA synthesis, cell growth or cell division. Although there is a strong correlation between distinct expression profiles and functional assignments, specific expression behaviour should not be taken as sufficient evidence for functional assignment: not all genes involved in DNA replication are expressed periodically in the cell cycle, and some genes that do not need to be cell cycle-regulated are transcribed in a periodic fashion.
Figure 5 Generic oligonucleotide tag arrays for parallel phenotyping of mutant yeast strains. a, Many S. cerevisiae strains, each carrying a specific deletion of one of the more than 6,000 ORFs in the yeast genome, have been constructed91 by replacing individual genes with an antibiotic resistance cassette and a unique gene-specific 20-mer 'barcode',
represented by an X. b, The barcode for each deletion strain corresponds to a specific location on an array that contains oligonucleotide probes that are complementary to the barcode sequences. c, Pools of different yeast strains can be assembled and grown under different conditions. After competitive growth, PCR is used to amplify the barcodes from genomic DNA isolated from the pools; the PCR products are subsequently labelled. d, By comparing the hybridization patterns of two different pools (before and after treatment with a drug, for example), the fitness of the strains can be assessed quantitatively. In this case, yeast genes required for sporulation or germination are represented in red, whereas yeast genes that are unnecessary for the process are shown in yellow. These same 20-mer sequences and the accompanying arrays are generic in design, and can be used to read the results of different types of 'bar-coded' reactions, such as those used for genotyping of human polymorphic loci105. Images provided by R. M. Williams and R. W. Davis.
Figure 6 Comparative genome hybridization using arrays26, 106, 107. a, Two arrays containing probes to yeast (the complete genome sequence of S. cerevisiae strain S288c and some S. cerevisiae DNA not present in S288c) were hybridized with fragmented, labelled genomic DNA from two different yeast strains commonly used in genetic studies (W303 and SK1). Red indicates the location of probes that hybridize efficiently only to DNA from the W303 strain, green indicates probes that hybridize only to SK1 DNA, and yellow indicates probes
that hybridize equally to the DNA from both strains. b, Enlargement of the boxed region in a. c, Region of the array containing probes to relatively unique protein-coding regions of the genome. d, Probes to non-unique regions of the genome (transposable elements, telomeric sequences, transfer RNAs and ribosomal RNAs). Genome regions that are present, absent, or found at higher or lower copy numbers in the two strains are readily detected. The large amount of allelic variation between the strains can be used in mapping studies108. Related approaches can be used in typing microbial isolates29, 109 or to identify genetic abnormalities in tumours.
Whitehead Institute for Biomedical Research, Nine Cambridge Center, Cambridge, Massachusetts 02142, and Department of Pathology, Brigham and Women's Hospital, Boston, Massachusetts 02115, USA
Protein Interaction Laboratory (PIL), University of Southern Denmark, Campusvej 55, DK-5230 Odense M, and Denmark and Protana A/S, Staermosegaardsvej 16, DK-5230 Odense M, Denmark (e-mail: [email protected])
Proteomics, the large-scale analysis of proteins, will contribute greatly to our understanding of gene function in the post-genomic era. Proteomics can be divided into three main areas: (1) protein micro-characterization for large-scale identification of proteins and their post-translational modifications; (2) 'differential display' proteomics for comparison of protein levels with potential application in a wide range of diseases; and (3) studies of protein–protein interactions using techniques such as mass spectrometry or the yeast two-hybrid system. Because it is often difficult to predict the function of a protein based on homology to other proteins or even their three-dimensional structure, determination of components of a protein complex or of a cellular structure is central in functional analysis. This aspect of proteomic studies is perhaps the area of greatest promise. After the revolution in molecular biology exemplified by the ease of cloning by DNA methods, proteomics will add to our understanding of the biochemistry of proteins, processes and pathways for years to come.
Large-scale DNA sequencing has transformed biomedical research in a short span of time. With the discovery of most human genes, it is now apparent that a 'factory approach' to address biological problems is desirable if we are to gain a comprehensive understanding of complex biological processes. In this article we will review how proteomics is similarly
making a crucial contribution to our understanding of biology and medicine through the global analysis of gene products.
Defining proteomicsProteomics is the large-scale study of proteins, usually by biochemical methods. The word proteomics has been associated traditionally with displaying a large number of proteins from a given cell line or organism on two-dimensional polyacrylamide gels1-4. In this sense proteomics already dates back to the late 1970s when researchers started to build databases of proteins using the then newly developed technique of two-dimensional gel electrophoresis5 (Box 1). This resulted in extensive cataloguing of spots from two-dimensional gels to create databases of all expressed proteins. However, even when such gels could be run reproducibly between laboratories, determining the identity of the proteins was difficult because of a lack of sensitive and rapid analytical methods for protein characterization (such as the polymerase chain reaction and the automated sequencer for DNA analysis). In the 1990s, biological mass spectrometry emerged as a powerful analytical method that removed most of the limitations of protein analysis. This development, coupled with the availability of the entire human coding sequence in public databases, marks the beginning of a new era. Today, the term proteomics covers much of the functional analysis of gene products or 'functional genomics', including large-scale identification or localization studies of proteins and interaction studies using the yeast two-hybrid system. The more focused large-scale study of protein structure, however, is usually not included and designated 'structural genomics' instead6. Likewise, strategies that target only genes or messenger RNA, such as large-scale mutagenesis or antisense experiments, should not be considered part of proteomics.
Why is proteomics necessary?With the accumulation of vast amounts of DNA sequences in databases, researchers are realizing that merely having complete sequences of genomes is not sufficient to elucidate biological function. A cell is normally dependent upon a multitude of metabolic and regulatory pathways for its survival. There is no strict linear relationship between genes and the protein complement or 'proteome' of a cell. Proteomics is complementary to genomics because it focuses on the gene products, which are the active agents in cells. For this reason, proteomics directly contributes to drug development as almost all drugs are directed against proteins.
The existence of an open reading frame (ORF) in genomic data does not necessarily imply the existence of a functional gene. Despite the advances in bioinformatics, it is still difficult to predict genes accurately from genomic data (see review in this issue by Eisenberg et al., pages 823–826, and refs 7, 8). Although the sequencing of related organisms will ease the problem of gene prediction through comparative genomics, the success rate for correct prediction of the primary structure is still low9, 10. This is particularly true in the case of small genes (which can be missed entirely) or genes with little or no homology to other known genes. A recent study concluded that the error rate was as least 8% in the annotations for 340 genes from the Mycoplasma genitalium genome11. If such error rates are extrapolated to the human genome, the outcome and consequences can easily be imagined. Therefore, verification of a gene product by proteomic methods is an important first step in 'annotating the genome'. Modifications of the proteins that are not apparent
from the DNA sequence, such as isoforms and post-translational modifications, can be determined only by proteomic methodologies. Furthermore, it may be necessary to determine the protein expression level directly as mRNA levels may or may not correlate with the protein level12, 13. The localization of gene products, which is often difficult to predict from the sequence, can be determined experimentally. Mechanisms such as regulation of protein function by proteolysis, recycling and sequestration in cell compartments affect gene products and not genes. Finally, protein–protein interactions and the molecular composition of cellular structures such as organelles can be determined only at the protein level.
Identification and analysis of proteinsProtein preparation methods One of the most crucial steps in proteomics is obtaining and handling the protein sample. Out of the entire complement of the genome of about 100,000 genes, a given cell line may express about 10,000 genes and an even higher number is expressed in tissues. Furthermore, the dynamic range of abundance of proteins in biological samples can be as high as 106. Because even the best two-dimensional gels can routinely resolve no more than 1,000 proteins, it is obvious that only the most abundant proteins can be visualized by gel electrophoresis if a crude protein mixture is used. The ideal solution to reduce complexity and differences in abundance is to use affinity-based protein purification strategies using the whole protein complement. For example, the erythropoeitin receptor is of medium abundance, occurring in about 1,000 copies per cell, or less than two picomoles (100 ng) in one litre of cell culture. This protein would not be visualized from whole-cell extracts but can be enriched easily by antibody-based affinity purification to yield a silver-stained band. This fact has to be borne in mind if signalling and other regulatory molecules are being studied.
After obtaining the protein fraction, the method of choice for proteomic studies is one- or two-dimensional gel electrophoresis. The advantages of one-dimensional electrophoresis as a preparation method are that virtually all proteins are soluble in SDS, the range of relative molecular mass from 10,000 to 300,000 is readily covered, and extremely acidic and basic proteins are easily visualized.
Mass spectrometric identification of proteins The most significant breakthrough in proteomics has been the mass spectrometric identification of gel-separated proteins, which extends analysis far beyond the mere display of proteins. Mass spectrometry has essentially replaced the classical technique of Edman degradation even in traditional protein chemistry, because it is much more sensitive, can deal with protein mixtures and offers much higher throughput. It relies on digestion of gel-separated proteins into peptides by a sequence-specific protease such as trypsin. The reason for analysing peptides rather than proteins is that gel-separated proteins are difficult to elute and to analyse by mass spectrometry, and that the molecular weight of proteins is not usually sufficient for database identification. In contrast, peptides are easily eluted from gels and even a small set of peptides from a protein provides sufficient information for identification. The steps typically involved in the mass spectrometric analysis of a protein are illustrated by an example that shows analysis of a molecule involved in platelet-derived growth factor (PDGF) signalling (Fig. 1). A detailed protocol describing methods and strategies for the mass spectrometric identification of signalling molecules can be found in ref. 14.
Figure 1 A strategy for mass spectrometric identification of proteins and post-translational modifications. Full legend High resolution image and legend (63k)
There are two main approaches to mass spectrometric protein identification. In the 'peptide-mass mapping' approach, initially suggested by Henzel and co-workers15, the mass spectrum of the eluted peptide mixture is acquired, which results in a 'peptide-mass fingerprint' of the protein being studied. This mass spectrum is obtained by a relatively simple mass spectrometric method — matrix-assisted laser desorption/ionization (MALDI) — which results in a time-of-flight distribution of the peptides comprising the mixture (Box 2 and Fig. 1b). Advances have been made in automation of the MALDI identification procedure whereby hundreds of protein spots can be excised, digested enzymatically, their mass spectra obtained and automatically searched against databases16, 17. As more full-length human genes are represented in the database, the success rate of identification by MALDI will increase further.
In a two-step procedure for rapid and unambiguous protein identification, MALDI fingerprinting is the first step18. The second method for protein identification relies on fragmentation of individual peptides in the mixture to gain sequence information. In this method, the peptides are ionized by 'electrospray ionization' directly from the liquid phase. The peptide ions are sprayed into a 'tandem mass spectrometer' which has the ability to resolve peptides in a mixture, isolate one species at a time and dissociate it into amino- or carboxy-terminal-containing fragments (Fig. 1c). The tandem mass spectrometric method is technically more complex and less scalable than MALDI fingerprinting. Its main advantage is that sequence information derived from several peptides is much more specific for the identification of a protein than a list of peptide masses. The fragmentation data can not only be used to search protein sequence databases but also nucleotide databases such as expressed sequence tag (EST) databases and more recently even raw genomic sequence databases (B. Küster, P. Mortensen, J. S. Andersen and M. Mann, unpublished data).
New developments in mass spectrometry Biological mass spectrometry is still evolving rapidly owing to continued technological advances in various areas. For instance, a new type of mass spectrometer that combines a MALDI ion source with a highly efficient tandem mass spectrometer unit that can fragment the individual peptides has recently been developed19. If this 'MALDI quadruple time of flight' instrument proves to be sufficiently sensitive, it would combine the high throughput of the peptide mapping method with the specificity of the peptide sequencing method, allowing a one-step instead of a two-step mass spectrometric analysis strategy. In our experience, this instrument already significantly improves the analysis of small proteins and improves the throughput when analysing simple protein mixtures. There are also efforts at miniaturizing protein
preparation using microfabricated 'chips', which have obtained promising results20-22. However, these methods have not yet yielded the sensitivity or robustness of preparations using standard tube or microtitre plate formats. There are also longstanding efforts to scan one- or two-dimensional gels directly by MALDI mass spectrometry23, 24. A recent variation uses an intercalating membrane containing immobilized trypsin for digestion of proteins during electrophoretic transfer onto a collecting membrane. The membrane is then rasterized and analysed by MALDI yielding a peptide map for each position of the gel25, 26.
In the future, it would be desirable to analyse a protein sample directly by mass spectrometry, without gel separation or enzymatic digestion. Smith et al. have loaded crude protein extract into a capillary and performed capillary electrophoresis to separate the proteins by their isoelectric point27. The separated proteins were then infused directly into a specialized Fourier-transformed ion cyclotron resonance (FTICR) mass spectrometer (Fig. 2), and the precise molecular masses of hundreds of proteins were acquired during a single run. In this experiment, the mass distribution was biased towards small proteins and only the masses, not the identity of the proteins, were determined. But in the future it may become possible to use this strategy to identify proteins by on-line fragmentation of the proteins28, 29. This would enable researchers to perform the whole proteomic analysis in a single automated experiment at least for a subset of soluble proteins of medium abundance.
Figure 2 Cell lysate from Escherichia coli analysed by FTICR. Full legend High resolution image and legend (36k)
Post-translational modifications One of the unique features of proteomics studies is the ability to analyse the post-translational modifications of proteins. Phosphorylation, glycosylation and sulphation as well as many other modifications are extremely important for protein function as they can determine activity, stability, localization and turnover. These modifications are not generally apparent from genomic sequence or mRNA expression data. Whereas mass spectrometry is the proteomic method of choice to determine protein modifications, this task is much more difficult than the mere determination of protein identity. Minimal data is sufficient to identify the protein in sequence databases — often as few as one or two peptides need to be fragmented. However, for obtaining the nature and location of post-translational modifications, all the peptides that do not have the expected molecular mass need to be analysed further. Because of this and other reasons, much more material is needed to study post-translational modifications than is required for protein identification. Continuing progress is being made in this field, especially in the case of phosphorylation. Phosphorylation events can be studied by generic strategies, because phosphopeptides are 80 Da heavier than their unmodified counterparts, give rise to a specific fragment (PO3- , mass 79), bind to metal resins, are recognized by specific antibodies and the phosphate groups can be removed by
phosphatases30-34. As an example, Fig 1d shows the detection of phosphopeptides following metal resin-based affinity micropurification and phosphatase treatment.
Phosphorylation and signalling pathways Several receptor-mediated signalling pathways result in tyrosine phosphorylation of a large set of substrates. To identify these substrates, the lysates from unstimulated and growth factor-stimulated cells can be prepared and resolved by two-dimensional gels. The proteins of interest can be detected by 32P labelling or by western blotting with antibodies that recognize only the activated state of molecules (such as phosphotyrosine- or phosphoserine-specific antibodies). These spots can then be identified by mass spectrometry as demonstrated recently35. A better alternative, however, is to first enrich for these substrates by using anti-phosphotyrosine antibodies in an immunopreciptation step followed by mass spectrometric identification. Several known and new components were recently reported in one such study on the epidermal growth factor (EGF)-receptor pathway36.
Differential-display proteomicsThe two-dimensional gel approach Until recently, proteomics was almost synonymous with two-dimensional gel electrophoresis ( Fig. 3). In biomedical applications of the comparative two-dimensional gel approach, the objective is usually to identify proteins that are up- or downregulated in a disease-specific manner for use as diagnostic markers or therapeutic targets. There are several technical challenges in such experiments. First, hydrophobic and large proteins usually do not enter the second dimension of the gel. Second, the issue of dynamic range makes it difficult to visualize all but the most abundant proteins. Particularly in body fluids such as serum and cerebrospinal fluid, more than 99% of the protein complement consists of serum albumin and globulins. Third, because of the biological variation inherent in these samples, it is difficult to define normal protein-expression patterns that can be compared with the disease state. For several of these applications, methods of array-based mRNA expression profiling can not only be more comprehensive (as they provide data on all the genes applied to the chip), but also faster and more convenient, as shown by a number of studies (see review in this issue by Lockhart and Winzeler, pages 827–836, and refs 37–40).
Figure 3 A schematic showing the two-dimensional gel approach. Full legend High resolution image and legend (33k)
In spite of these difficulties of comparing two-dimensional gel patterns, several applications have appeared in the literature. For example, Celis and co-workers have found a putative urinary marker, psoriasin, which can be used for the follow-up of patients with bladder squamous cell carcinomas41. This marker was identified when they compared the profile of secreted proteins from normal tissue with that from cancerous tissue. A similar study compared the proteome of normal human luminal and myoepithelial breast cells using immunopurified cell populations. It detected 170 protein spots that were twofold
differentially expressed42, of which 51 were identified. However, almost all of these proteins were abundant cytoskeletal proteins such as actin and keratin. A recent study compared the protein complement from different fractions of brain extracts from two different strains of mice43, finding over 1,000 genetically variant protein spots. Such studies may be useful in other situations as well, for example, in comparing the proteome of wild-type with that of knockout mice. Toxicology studies frequently use proteomic analysis to understand the mechanism of action of a drug or to identify its targets. Aicher and colleagues discovered an association between decreased levels of a calcium-binding protein, calbindin-D 28K, and cyclosporine A-induced nephrotoxicity when kidney samples were compared from species that were either susceptible or resistant to nephrotoxicity44.
When two-dimensional gels are used as a method of separating a qualitative subset of proteins, as opposed to comparing whole-cell preparations, or when immunological methods are used to highlight a subset of proteins, biologically relevant answers can be more readily obtained. For example, many secreted proteins can be identified by two-dimensional gel analysis of supernatants of cell lines and explants from tumour tissues45. Several groups have probed two-dimensional gels of proteins from allergy-causing organisms using antibodies derived from allergic patients46, 47. Identification of the responsible allergen by mass spectrometry can be exploited in the rational design of preventive and therapeutic strategies.
We predict that protein expression analysis will be most useful in well-defined areas such as (1) analysis of samples that do not contain mRNA such as some body fluids; (2) cases where the protein abundance does not correlate with the mRNA abundance; (3) cases where the critical changes involve post-translational modifications of proteins such as glycosylation or phosphorylation, rather than changes in protein abundance; (4) cases where an overview of the most abundant proteins in a specialized source is itself of importance; and (5) cases where two-dimensional gels allow a relatively comprehensive overview of a simple proteome such as that of a microbe.
Protein chips In the protein chip approach, a variety of 'bait' proteins such as antibodies can be immobilized in an array format onto specially treated surfaces (Fig. 4). The surface is then probed with the sample of interest and only the proteins that bind to the relevant antibodies remain bound to the chip48. Such an approach is essentially a large-scale version of enzyme-linked immunosorbent assays that are already used in clinical diagnostics. In one version, the protein chip is probed with fluorescently labelled proteins from two different cell states. Cell lysates are labelled by different fluorophores and mixed such that the colour acts as a readout for the change in abundance of the protein bound to the antibody. This system depends on reasonably specific and well-characterized antibodies and a number of technical problems would still need to be overcome. However, once developed it could provide convenient proteome analysis. In other modifications, peptides, protein fragments or proteins may also be immobilized onto chips and samples (for example, phage library or patient serum) applied onto the chip followed by detection of binding. One approach using protein chips couples the above techniques with a direct MALDI readout of the bound material49, 50.
Figure 4 A schematic showing use of arrays for proteomic analysis. Full legend High resolution image and legend (31k)
Quantification by mass spectrometry In addition to the above methods, differential-display proteomics can also be done using limited or no protein separation followed by mass spectrometric quantification. Because the intensity of a peptide peak in the mass spectrum cannot be predicted, quantification is achieved by labelling one of the two states by stable isotopes. Such methods have been used traditionally in mass spectrometry of small molecules but have only recently been applied to proteomics. Microbes can, for example, be grown in one state in normal medium and in another state in medium containing only N15 instead of N14. Protein preparations from the two states are then mixed, separated and analysed by mass spectrometry. Two versions of any peptide can now be detected where one is greater in mass by its number of nitrogen atoms and the ratio of peak heights accurately quantifies the relative amounts of the corresponding proteins. As an alternative, Aebersold and colleagues introduced an isotopic non-radioactive label on cysteines after cell lysis before quantifying the samples by mass spectrometry51. This strategy enables quantification of peptides from the most abundant components of very crude protein mixtures without gel electrophoresis.
Protein–protein interactionsA key question about a protein, in addition to when and where it is expressed, is with which other proteins does it interact. Interaction partners are an immediate lead into biological function and can potentially be exploited for therapeutic purposes. Creation of a protein–protein interaction map of the cell would be of immense value to understanding the biology of the cell.
Purification of protein complexes Proteomics can make a key contribution to the study of protein–protein interactions52-55. An attractive way to study protein–protein interactions is to purify the entire multi-protein complex by affinity-based methods. This can be achieved in a variety of ways such as by using glutathione S-transferase (GST)–fusion proteins, antibodies, peptides, DNA, RNA or a small molecule binding specifically to a cellular target. One of the generic ways of identifying the interaction partners of a new protein is to tag it with an epitope. This protein can then be overexpressed in cells and — together with its interaction partners — immunoprecipitated by an antibody against the epitope. This requires only the full-length complementary DNA clone of the gene and no time is spent in generating a precipitating antibody against the gene of interest. Because full-length cDNAs may soon be available for most human genes56, large-scale interaction studies will become possible. Making fusion proteins such as GST–fusions is another generic way to obtain interaction partners (Fig. 5). The multi-protein complex associates with the 'bait', which is immobilized on a solid support. After washing away the proteins that interact nonspecifically, the protein complex is eluted, separated by gel electrophoresis and analysed by mass spectrometry. Thus, in a single experiment, the components of an entire multi-protein complex can be identified. As an example, the human spliceosome has been purified using biotinylated RNA as the 'bait' on which the complex assembled57. Its protein
components were then displayed by two-dimensional gel electrophoresis (Fig. 6a). From a single two-dimensional gel, 19 new factors were obtained (mostly in EST databases) and several of them were cloned and analysed further. Co-localization using immunofluorescence of the new protein with other members of the complex served to establish that they are bona fide members of the complex (Fig. 6b). Several of the new factors identified from this study were cloned and GST–fusion proteins generated. Using the strategy shown in Fig. 5, one of these proteins, designated S14, precipitated a subset of the spliceosome proteins (Fig. 6c), which, together with other experiments and bioinformatics analysis of the sequence, indicated a function of this protein. Many protein complexes have now been characterized using the strategy outlined above. Some of these complexes include the yeast Arp2/3 complex58, proteins found in the yeast nuclear-pore complex59 and proteins bound to the chaperonin GroEL60.
Figure 5 A generic strategy to isolate interacting proteins. Full legend High resolution image and legend (53k)
Figure 6 Characterization of the multi-protein spliceosome complex. Full legend High resolution image and legend (37k)
These studies provide insight into mechanisms and open up new lines of investigations. Because no assumptions are made about the complex, unsuspected connections between cellular processes routinely emerge. For example, a study of profilin-I and -II binding proteins in mouse brain resulted in the discovery of two sets of proteins, one consisted of signalling molecules that regulate actin cytoskeleton and the other was involved in endocytosis. This indicated a link between signal transduction pathways and microfilament assembly involving profilin61.
Once members of a multi-protein complex have been identified by mass spectrometry, their function is studied by pertinent assays. At this stage, proteomics can be used in an iterative fashion to define either direct interaction partners of a new protein in the complex and/or to connect to other complexes in the cell62.
The success of the above-mentioned strategies relies on sufficient affinity of the protein complex to the bait and on optimized conditions for purification steps. For example, use of a double-tagging strategy improves complex recovery and reduces nonspecific protein binding63. Lower-affinity interactions can potentially be captured by chemically crosslinking the protein complex before affinity purification because it relies on spatial proximity rather than affinity. Crosslinking can also help in elucidating the topological structure of a protein complex by the determination of nearest neighbours64.
Components of specific organelles have also begun to be analysed. The yeast Golgi apparatus has been catalogued and the components of the chloroplast of garden pea have been similarly investigated to identify proteins involved in the processing, targeting, insertion and assembly of photosynthetic complexes65, 66. The interchromatin granules have been examined by the analysis of the crude peptide mixture obtained after digestion in solution of the entire sample67.
Yeast two-hybrid system The yeast two-hybrid system has emerged as a powerful tool to study protein–protein interactions68. It is a genetic method based on the modular structure of transcription factors wherein close proximity of the DNA-binding domain to the activation domain induces increased transcription of a set of genes. The yeast hybrid system uses ORFs fused to the DNA-binding or -activation domain of GAL4 such that increased transcription of a reporter gene results when the proteins encoded by two ORFs interact in the nucleus of the yeast cell ( Fig. 7a, b). One of the main consequences of this is that once a positive interaction is detected, the ORF is identified simply by sequencing the relevant clones. For these reasons it is a generic method that is simple and amenable to high-throughput screening of protein–protein interactions.
Figure 7 The yeast two-hybrid system. Full legend High resolution image and legend (104k)
On a large scale, this strategy has been used in two formats. In the array method, yeast clones containing ORFs as fusions to DNA or activation domains are arrayed onto a grid and the ORFs to be tested (as reciprocal fusions) are screened against the entire grid to identify interacting clones (Fig. 4). In the library screening method, one set of ORFs are first pooled to generate a library and then the reciprocal ORF–fusions are mated with the library one by one or several at a time ( Fig. 7c).
Such analyses on a genome-wide scale have already been reported in Saccharomyces cerevisiae and to a more limited extent in Caenorhabditis elegans69-71. In yeast, the array
method was performed on 192 ORFs and the library screening method for 87% of the yeast genome. Together, this experiment resulted in 957 putative interactions70. Another group analysed the results of 10% of an exhaustive library screen in yeast, resulting in 183 putative interactions71. The vast majority of the interactions found in these two large-scale studies were new. Several of these interactions seem plausible based on previous genetic or biochemical studies, whereas the relevance of most others cannot easily be determined. Therefore, such studies provide only potential interactions that have to be confirmed or eliminated by further biological experimentation. The main advantage of these methods is that they can be performed with a high throughput and in an automated manner. A recently described modification of the yeast two-hybrid method, termed 'reverse' two hybrid, can be used for identification of compounds and peptides that disrupt protein–protein interactions72. This can lead to development of drugs that have activities in vivo as opposed to drug screens that are conventionally done in vitro.
Phage display Phage display is a method where bacteriophage particles are made to express either a peptide or protein of interest fused to a capsid or coat protein. It can be used to screen for peptide epitopes, peptide ligands, enzyme substrates or single-chain antibody fragments. Although combinatorial peptide libraries have generally been used in most phage display-based studies, more informative large-scale protein interaction studies can now be done if the products of cDNA libraries are displayed on phage particles. Any 'bait' protein can then be immobilized to capture phage particles displaying interacting proteins. This method is similar to the yeast two-hybrid system in that it is simple and can be performed with high throughput. Depending on the particular class of proteins being studied (such as cytoplasmic versus cell surface proteins), this method may be superior or inferior to the two-hybrid system because the interactions take place in solution as opposed to the nucleus of the yeast cell. Furthermore, this method is applicable in principle to transcription factors, which are not amenable to the yeast two-hybrid system. Methods have recently been optimized to display cDNA libraries on phages to isolate signalling molecules in the EGF-receptor signalling pathway as well as to identify antigens that react with certain antibodies73, 74.
ConclusionsProteomics provides a powerful set of tools for the large-scale study of gene function directly at the protein level. In particular, the mass spectrometric study of gel-separated proteins is leading to a renaissance in biochemical approaches to protein function. Protein characterization will continue to improve in throughput, sensitivity and completeness. Post-translational modifications cannot currently be studied at high throughput but certain categories such as phosphorylation are beginning to be amenable to generic approaches. We predict that proteomics will move away from the monitoring of protein expression using two-dimensional gels. Mass spectrometry-based methods that use affinity purification followed by only one-dimensional electrophoresis will continue to gain in importance. In the near future, proteomics will provide a wealth of protein–protein interaction data, which will probably be its most important and immediate impact on biological science. Because proteins are one step closer to function than are genes, these studies frequently lead directly to biological discoveries or hypotheses. The ready availability of many human genes as full-length clones is itself an extremely important extension of the genome projects that will make possible several proteomic strategies. Assays to determine protein function using
purified proteins will be automated and performed in miniaturized grid formats in parallel for thousands of proteins. Finally, advances in genomics will directly fuel large-scale protein assays that use genetics as a readout, such as the two-hybrid screen.
References
1. Wilkins, M. R., Williams, K. L., Apple, R. D. & Hochstrasser, D. F. Proteome Research: New Frontiers in Functional Genomics 1-243 (Springer, Berlin, 1997).
2. Wilkins, M. R. et al. From proteins to proteomes: large scale protein identification by two-dimensional electrophoresis and amino acid analysis. BioTechnology 14, 61-65 (1996). | PubMed | ISI |
3. Celis, J. et al. Human 2-D PAGE databases for proteome analysis in health and disease: http://biobase.dk/cgi-bin/celis. FEBS Lett. 398, 129-134 (1996). | Article | PubMed | ISI |
4. Anderson, N. G. & Anderson, N. L. Twenty years of two-dimensional electrophoresis: past, present and future. Electrophoresis 17, 443-453 (1996). | PubMed | ISI |
5. O'Farrell, P. H. High resolution two-dimensional electrophoresis of proteins. J. Biol. Chem. 250, 4007-4021 (1975). | PubMed | ISI |
6. Burley, S. K. et al. Structural genomics: beyond the human genome project. Nature Genet. 23, 151-157 (1999). | Article | PubMed | ISI |
7. Krogh, A. in Guide to Human Genome Computing (ed. Bishop, M. J.) 261-274 (Academic, San Diego, 1998).
8. Dunham, I. et al. The DNA sequence of human chromosome 22. Nature 402, 489-495 (1999). | Article | PubMed | ISI |
9. Claverie, J. M. Computational methods for the identification of genes in vertebrate genomic sequences. Hum. Mol. Genet. 6, 1735-1744 (1997). | Article | PubMed | ISI |
10. Pandey, A. & Lewitter, F. Nucleotide sequence databases: a gold mine for biologists. Trends Biochem. Sci. 24, 276-280 (1999). | Article | PubMed | ISI |
11. Brenner, S. E. Errors in genome annotation. Trends Genet. 15, 132-133 (1999). | Article | PubMed | ISI |
12. Gygi, S., Rochon, Y., Franza, B. R. & Aebersold, R. Correlation between protein and mRNA abundance in yeast. Mol. Cell. Biol. 19, 1720-1730 (1999). | PubMed | ISI |
13. Futcher, B. et al. A sampling of the yeast proteome. Mol. Cell. Biol. 19, 7357-7368 (1999). | PubMed | ISI |
14. Pandey, A., Andersen, J. S., & Mann, M. Use of mass spectrometry to study signaling pathways. Science's STKE (in the press). | PubMed |
15. Henzel, W. J., Billeci, T. M., Stults, J. T. & Wong, S. C. Identifying proteins from two-dimensional gels by molecular mass searching of peptide fragments in protein sequence databases. Proc. Natl Acad. Sci. USA 90, 5011-5015 (1993). | PubMed | ISI |
16. Jensen, O. N., Mortensen, P., Vorm, O. & Mann, M. Automation of matrix assisted laser desorption/ionization mass spectrometry using fuzzy logic feedback control. Anal. Chem. 69, 1706-1714 (1997). | Article | PubMed | ISI |
17. Berndt, P., Hobohm, U. & Langen, H. Reliable automatic protein identification from matrix-assisted laser desorption/ionization mass spectrometric peptide fingerprints. Electrophoresis 20, 3521-3526 (1999). | Article | PubMed | ISI |
18. Shevchenko, A. et al. Linking genome and proteome by mass spectrometry: large scale identification of yeast proteins from two dimensional gels. Proc. Natl Acad. Sci. USA 93, 14440-14445 (1996). | Article | PubMed | ISI |
19. Shevchenko, A. et al. MALDI quadruple time-of-flight mass spectrometry: powerful tool for proteomic research. Anal. Chem. 72, 2132-2141 (2000). | Article | PubMed | ISI |
20. Zhang, B., Liu, H., Karger, B. L. & Foret, F. Microfabricated devices for capillary electrophoresis-
electrospray mass spectrometry. Anal. Chem. 71, 3258-3264 (1999). | Article | PubMed | ISI |21. Figeys, D., Gygi, S. P., McKinnon, G. & Aebersold, R. An integrated microfluidics-tandem mass
spectrometry system for automated protein analysis. Anal. Chem. 70, 3728-3734 (1998). | Article | PubMed | ISI |
22. Li, J. et al. Integration of microfabricated devices to capillary electrophoresis--electrospray mass spectrometry using a low dead volume connection: application to rapid analyses of proteolytic digests. Anal. Chem. 71, 3036-3045 (1999). | Article | PubMed | ISI |
23. Eckerkorn, C. et al. Mass spectrometric analysis of blotted proteins after gel electrophoresis separation by matrix-assisted laser desorption/ionization. Electrophoresis 13, 664-665 (1992). | PubMed | ISI |
24. Strupat, K. et al. Matrix-assisted laser desorption ionization mass spectrometry of proteins electroblotted after polyacrylamide gel electrophoresis. Anal. Chem. 66, 464-470 (1994). | ISI |
25. Bienvenut, W. V. et al. Toward a clinical molecular scanner for proteome research: parallel protein chemical processing before and during western blot. Anal. Chem. 71, 4800-4807 (1999). | Article | PubMed | ISI |
26. Binz, P. A. et al. A molecular scanner to automate proteomic research and to display proteome images. Anal. Chem. 71, 4981-4988 (1999). | Article | PubMed | ISI |
27. Jensen, P. K. et al. Probing proteomes using capillary isoelectric focusing-electrospray ionization Fourier transform ion cyclotron resonance mass spectrometry. Anal. Chem. 71, 2076-2084 (1999). | Article | PubMed | ISI |
28. Mørtz, E. et al. Sequence tag identification of intact proteins by matching tandem mass spectral data against sequence data bases. Proc. Natl. Acad. Sci. USA 93, 8264-8267 (1996). | Article | PubMed | ISI |
29. Li, W., Hendrickson, C. L., Emmett, M. R. & Marshall, A. G. Identification of intact proteins in mixtures by alternated capillary liquid chromatography electrospray ionization and LC ESI infrared multiphoton dissociation Fourier transform ion cyclotron resonance mass spectrometry. Anal. Chem. 71, 4397-4402 (1999). | Article | PubMed | ISI |
30. Nuwaysir, L. & Stults, J. T. ESI mass spectrometry of phosphopeptides isolated by on-line immobilized metal affinity chromatography. J. Am. Soc. Mass Spectrom. 4, 662-669 (1993). | ISI |
31. Betts, J. C., Blackstock, W. P., Ward, M. A. & Anderton, B. H. Identification of phosphorylation sites on neurofilament proteins by nanoelectrospray mass spectrometry. J. Biol. Chem. 272, 12922-12927 (1997). | Article | PubMed | ISI |
32. Neubauer, G. & Mann, M. Mapping of phosphorylation sites of gel-isolated proteins by nanoelectrospray tandem mass spectrometry: potentials and limitations. Anal. Chem. 71, 235-242 (1999). | Article | PubMed | ISI |
33. Zhang, X. et al. Identification of phosphorylation sites in proteins separated by polyacrylamide gel electrophoresis. Anal. Chem. 70, 2050-2059 (1998). | Article | PubMed | ISI |
34. Cortez, D., Wang, Y., Qin, J. & Elledge, S. J. Requirement of ATM-dependent phosphorylation of brca1 in the DNA damage response to double-strand breaks. Science 286, 1162-1166 (1999). | Article | PubMed | ISI |
35. Soskic, V. et al. Functional proteomics analysis of signal transduction pathways of the platelet-derived growth factor beta receptor. Biochemistry 38, 1757-1764 (1999). | Article | PubMed | ISI |
36. Pandey, A. et al. Analysis of receptor signaling pathways by mass spectrometry: identification of Vav-2 as a substrate of the epidermal and platelet-derived growth factor receptors. Proc. Natl Acad. Sci. USA 97, 179-184 (2000). | Article | PubMed | ISI |
37. DeRisis, J., Iyer, V. R. & Brown, O. P. Exploring the metabolic and genetic control of gene expression on a genomic scale. Science 278, 680-686 (1997). | Article | PubMed | ISI |
38. Golub, T. R. et al. Molecular classification of cancer: class discovery and class prediction by gene expression monitoring. Science 286, 531-537 (1999). | Article | PubMed | ISI |
39. Roberts, C. J. et al. Signaling and circuitry of multiple MAPK pathways revealed by a matrix of global gene expression profiles. Science 287, 873-880 (2000). | Article | PubMed | ISI |
40. Alizadeh, A. A. et al. Distinct types of diffuse large B-cell lymphoma identified by gene
expression profiling. Nature 403, 503-511 (2000). | Article | PubMed | ISI |41. Ostergaard, M., Wolf, H., Orntoft, T. F. & Celis, J. E. Psoriasin (S100A7): a putative urinary
marker for the follow-up of patients with bladder squamous cell carcinomas. Electrophoresis 20, 349-354 (1999). | Article | PubMed | ISI |
42. Page, M. J. et al. Proteomic definition of normal human luminal and myoepithelial breast cells purified from reduction mammoplasties. Proc. Natl Acad. Sci. USA 96, 12589-12594 (1999). | Article | PubMed | ISI |
43. Gauss, C. et al. Analysis of the mouse proteome. (I) Brain proteins: separation by two-dimensional electrophoresis and identification by mass spectrometry and genetic variation. Electrophoresis 20, 575-600 (1999). | Article | PubMed | ISI |
44. Aicher, L. et al. New insights into cyclosporine A nephrotoxicity by proteome analysis. Electrophoresis 19, 1998-2003 (1998). | PubMed | ISI |
45. Celis, J. E. et al. A comprehensive protein resource for the study of bladder cancer: http://biobase.dk/cgi-bin/celis. Electrophoresis 20, 300-309 (1999). | Article | PubMed | ISI |
46. Breitenbach, M. et al. Biological and immunological importance of Bet v 1 isoforms. Adv. Exp. Med. Biol. 409, 117-126 (1996). | PubMed |
47. Sander, I. et al. Allergy to aspergillus-derived enzymes in the baking industry: identification of beta-xylosidase from aspergillus niger as a new allergen (Asp n 14). J. Allergy Clin. Immunol. 102, 256-264 (1998). | PubMed | ISI |
48. Lueking, A., Horn, M., Eickhoff, H., Lehrach, H. & Walter, G. Protein microarrays for gene expression and antibody screening. Anal. Biochem. 270, 103-111 (1999). | Article | PubMed | ISI |
49. Davies, H., Lomas, L. & Austen, B. Profiling of amyloid beta peptide variants using SELDI Protein Chip arrays. Biotechniques 27, 1258-1261 (1999). | PubMed | ISI |
50. Nelson, R. W. The use of bioreactive probes in protein characterization. Mass Spectrom. Rev. 16, 353-376 (1997). | Article | PubMed | ISI |
51. Gygi, S. P. et al. Quantitative analysis of complex protein mixtures using isotope-coded affinity tags. Nature Biotechnol. 17, 994-999 (1999). | Article | PubMed | ISI |
52. Neubauer, G. et al. Identification of the proteins of the yeast U1 small nuclear ribonucleoprotein complex by mass spectrometry. Proc. Natl Acad. Sci. USA 94, 385-390 (1997). | Article | PubMed | ISI |
53. Lamond, A. I. & Mann, M. Cell biology and the genome projects--a concerted strategy for characterizing multi-protein complexes using mass spectrometry. Trends Cell Biol. 7, 139-142 (1997). | Article | ISI |
54. Link, A. J. et al. Direct analysis of protein complexes using mass spectrometry. Nature Biotechnol. 17, 676-682 (1999). | Article | PubMed | ISI |
55. Blackstock, W. P. & Weir, M. P. Proteomics: quantitative and physical mapping of cellular proteins. Trends Biotechnol. 17, 121-127 (1999). | Article | PubMed | ISI |
56. Strausberg, R. L., Feingold, E. A., Klausner, R. D. & Collins, F. S. The mammalian gene collection. Science 286, 455-457 (1999). | Article | PubMed | ISI |
57. Neubauer, G. et al. Mass spectrometry and EST-database searching allows characterization of the multi-protein spliceosome complex. Nature Genet. 20, 46-50 (1998). | Article | PubMed | ISI |
58. Winter, D., Podtelejnikiov, A. V., Mann, M. & Li, R. The complex containing actin-related proteins Arp2 and Arp3 is required for the motility and integrity of yeast actin patches. Curr. Biol. 7, 519-529 (1997). | PubMed | ISI |
59. Rout, M. P. et al. The yeast nuclear pore complex: composition, architecture, and transport mechanism. J. Cell. Biol. 148, 635-651 (2000). | PubMed | ISI |
60. Houry, W. A. et al. Identification of in vivo substrates of the chaperonin GroEL. Nature 402, 147-154 (1999). | Article | PubMed | ISI |
61. Witke, W. et al. In mouse brain profilin I and profilin II associate with regulators of the endocytic pathway and actin assembly. EMBO J. 17, 967-976 (1998). | Article | PubMed | ISI |
62. Shevchenko, A. & Mann, M. in Mass Spectrometry in Biology and Medicine (eds Burlingame, A., Carr, C. A. & Baldwin, M. A.) 237-269 (Humana, Totowa, 1999).
63. Rigaut, G. et al. A generic protein purification method for protein complex characterization and proteome exploration. Nature Biotechnol. 17, 1030-1032 (1999). | Article | PubMed | ISI |
64. Rappsilber, J., Siniossoglou, S., Hurt, E. C. & Mann, M. A generic strategy to analyze the spatial organization of multi-protein complexes by cross-linking and mass spectrometry. Anal. Chem. 72, 267-275 (2000). | Article | PubMed | ISI |
65. Rowley, A. et al. Applications of protein mass spectrometry in cell biology. Methods 20, 383-397 (2000). | PubMed | ISI |
66. Peltier, J. B. et al. Proteomics of the chloroplast. Systematic identification and targeting analysis of lumenal and peripheral thylakoid proteins. Plant Cell 12, 319-342 (2000). | PubMed | ISI |
67. Mintz, P. J. et al. Purification and biochemical characterization of interchromatin granule clusters. EMBO J. 18, 4308-4320 (1999). | Article | PubMed | ISI |
68. Fields, S. & Song, O. K. A novel genetic system to detect protein-protein interactions. Nature 340, 245-246 (1989). | PubMed | ISI |
69. Walhout, A. J. et al. Protein interaction mapping in C. elegans using proteins involved in vulval development. Science 287, 116-122 (2000). | Article | PubMed | ISI |
70. Uetz, P. et al. A comprehensive analysis of protein-protein interactions in Saccharomyces cerevisiae. Nature 403, 623-627 (2000). | Article | PubMed | ISI |
71. Ito, T. et al. Toward a protein-protein interaction map of the budding yeast: a comprehensive system to examine two-hybrid interactions in all possible combinations between the yeast proteins. Proc. Natl Acad. Sci. USA 97, 1143-1147 (2000). | Article | PubMed | ISI |
72. Vidal, M. & Endoh, H. Prospects for drug screening using the reverse two-hybrid system. Trends Biotechnol. 17, 374-381 (1999). | Article | PubMed | ISI |
73. Zozulya, S. et al. Mapping signal transduction pathways by phage display. Nature Biotechnol. 17, 1193-1198 (1999). | Article | PubMed | ISI |
74. Hufton, S. E. et al. Phage display of cDNA repertoires: the pVI display system and its applications for the selection of immunogenic ligands. J. Immunol. Methods 231, 39-51 (1999). | Article | PubMed | ISI |
75. Martzen, M. R. et al. A biochemical genomics approach for identifying genes by the activity of their products. Science 286, 1153-1155 (1999). | Article | PubMed | ISI |
76. Zambrowicz, B. P. et al. Disruption and sequence identification of 2,000 genes in mouse embryonic stem cells. Nature 392, 608-611 (1998). | Article | PubMed | ISI |
77. Fire, A. et al. Potent and specific genetic interference by double-stranded RNA in Caenorhabditis elegans. Nature 391, 806-811 (1998). | Article | PubMed | ISI |
78. Winzeler, E. A. et al. Functional characterization of the S. cerevisiae genome by gene deletion and parallel analysis. Science 285, 901-906 (1999). | Article | PubMed | ISI |
79. Mattheakis, L. C., Bhatt, R. R. & Dower, W. J. An in vitro polysome display system for identifying ligands from very large peptide libraries. Proc. Natl Acad. Sci. USA 91, 9022-9026 (1994). | PubMed | ISI |
80. Roberts, R. W. & Szostak, J. W. RNA-peptide fusions for the in vitro selection of peptides and proteins. Proc. Natl Acad. Sci. USA 94, 12297-12302 (1997). | Article | PubMed | ISI |
81. Wilm, M. & Mann, M. Analytical properties of the nanoelectrospray ion source. Anal. Chem. 68, 1-8 (1996). | Article | PubMed | ISI |
82. Wilm, M. et al. Femtomole sequencing of proteins from polyacrylamide gels by nano electrospray mass spectrometry. Nature 379, 466-469 (1996). | PubMed | ISI |
83. Roepstorff, P. & Fohlman, J. Proposed nomenclature for sequence ions. Biomed. Mass Spectrom. 11, 601 (1984). | PubMed | ISI |
84. Yates, J. R. Mass spectrometry. From genomics to proteomics. Trends Genet. 16, 5-8 (2000). | Article | PubMed | ISI |
85. Mann, M. & Wilm, M. S. Error tolerant identification of peptides in sequence databases by peptide sequence tags. Anal. Chem. 66, 4390-4399 (1994). | PubMed | ISI |
86. Mann, M. A shortcut to interesting human genes: peptide sequence tags, ESTs and computers. Trends Biochem. Sci. 21, 494-495 (1996). | Article | PubMed | ISI |
87. Eng, J. K., McCormack, A. L. & J. R. Yates, I. An approach to correlate MS/MS data to amino
acid sequences in a protein database. J. Am. Soc. Mass Spectrom. 5, 976-989 (1994). | ISI |88. Yates, J. R. III Database searching using mass spectrometry data. Electrophoresis 19, 893-900
(1998). | PubMed | ISI |
Acknowledgements. We thank B. Blagoev and M. Fernandez for their expert assistance with cell culture and immunoprecipitation experiments. We thank all other members of the Protein Interaction Laboratory for valuable discussions and comments on the manuscript and A. King, Protana A/S, for obtaining the data for the new spliceosomal protein. O. N. Jensen and A. Stensballe are acknowledged for their contributions in the analysis of phosphopeptides. A.P. was supported by the Howard Temin Award from the National Cancer Institute. This work was funded in part by a grant from the Danish National Research Foundation to M.M.'s laboratory (http://www.pil.sdu.dk) at the Center for Experimental BioInformatics (CEBI).
Figure 1 A strategy for mass spectrometric identification of proteins and post-translational modifications. a, Responsive cells such as NIH 3T3 fibroblasts are treated with PDGF followed by immunoprecipitation of cell lysates with anti-phosphotyrosine antibodies. After one-dimensional gel electrophoresis, the gel is silver stained, the protein band excised as shown and subjected to digestion with trypsin. This results in peptides with arginine or lysine at their C termini as a result of the cleavage specificity of trypsin. b, An aliquot of the supernatant containing tryptic peptides is analysed by MALDI, which results in a peptide-mass fingerprint of the protein. c, The remainder of the supernatant is desalted and analysed by nanoelectrospray tandem mass spectrometry. The top panel shows the individual peptide peaks in the mass spectrum. The bottom panel shows how sequence can be derived by fragmentation of the chosen peptide (m2) by tandem mass spectrometry. d, The phosphopeptides may be enriched by purifying the peptide mixture over a metal resin microcolumn. The resulting peptides can then be analysed by MALDI as shown (and subsequently by nanoelectrospray) before and after treatment with alkaline phosphatase. The panel shows a singly phosphorylated (showing a shift of 80 Da) and a doubly phosphorylated (showing a shift of 160 Da) peptide in the MALDI spectrum. (Fig. 1d courtesy of O. N. Jensen and A. Stensballe.)
Figure 2 Cell lysate from Escherichia coli analysed by FTICR. Capillary isoelectric focusing was performed on 300 ng E. coli total cell lysate in a coated capillary of internal diameter 50 m. E. coli were grown in isotopically depleted medium. After isoelectric focusing, the proteins were eluted into the mass spectrometer and spectra acquired (bottom trace). a, High-resolution spectrum for charge states representing different molecular masses present in a single scan. b, Mass spectrum showing precise masses for more than ten co-eluting protein species. (Reprinted with permission by Analytical Chemistry.)
Figure 3 A schematic showing the two-dimensional gel approach. Cells (or tissue) derived from two different conditions, A and B, are harvested and the proteins solubilized. The crude protein mixture is then applied to a 'first dimension' gel strip that separates the proteins based on their isoelectric points. After this step, the strip is subjected to reduction and alkylation and applied to a 'second dimension' SDS–PAGE gel where proteins are denatured and separated on the basis of size. The gels are then fixed and the proteins visualized by silver staining. Silver staining is less quantitative than Coomassie blue but more sensitive and is also compatible with mass spectrometric analysis. After staining, the resulting protein spots are recorded and quantified. Image analysis requires sophisticated software and remains one of the most labour-intensive parts of the two-dimensional gel approach. The spots of interest are then excised and subjected to mass spectrometric analysis
Figure 4 A schematic showing use of arrays for proteomic analysis. Recombinant proteins can be expressed and purified in a large-scale format. These proteins are pooled into wells as shown and assayed for functions such as enzymatic activity. This approach has been termed biochemical genomics. A protein chip can be prepared in several ways. The surface can be immobilized with recombinant proteins or their domains (such as bacterially expressed GST–fusion proteins) and then cell lysates containing putative interaction partners are applied to the chip followed by washing to remove unbound material. The bound proteins can then be eluted and identified by mass spectrometry. Alternatively, instead of cell lysates, a phage cDNA display library can be applied to the chip followed by washing and amplification steps to isolate individual interacting phage particles. The inserts in these phage particles can then be sequenced to determine the identity of the interacting partners. The yeast two-hybrid system is also amenable to an array-based analysis. First, yeast cells can be transformed with individual ORF–activation domain fusions. These cells can be grown in an array format on plates or filters such that each element of the array contains a yeast clone with a unique ORF. Such an array can be probed in a mating assay with yeast cells containing a single ORF–DNA-binding domain fusion, one at a time. The nutritional selection ensures that only the yeast cells containing interacting partners survive. These interacting clones can be re-screened to reduce false positives or be sequenced directly.
Figure 5 A generic strategy to isolate interacting proteins. The protein of interest is expressed as a fusion protein with a cleavable affinity tag to identify interacting proteins. In this case, S14 protein (spot S14 identified from gel shown in Fig. 6a) is immobilized onto agarose beads using a GST tag. Nuclear cell extracts are incubated with the beads and the beads washed extensively. Thrombin is used to cleave between the GST and the S14 protein, which results in elution of all proteins that are specifically bound to S14. The advantage of this method is that the proteins that are nonspecifically bound to the matrix or the tag itself are not eluted. The eluted proteins are resolved by one- or two-dimensional gel
electrophoresis and compared to GST alone. The bands or spots corresponding to proteins specifically bound to the tagged proteins are excised and analysed by mass spectrometry. (Figure courtesy of A. King)
Figure 6 Characterization of the multi-protein spliceosome complex. a, A two-dimensional gel of spliceosome-associated factors. b, Expression of a green fluorescent protein (GFP)-tagged version of a protein, SPF45 (spot S28), identified from the gel shown in panel a. HeLa cells were transiently transfected with a plasmid encoding SPF45, which was tagged with GFP at its N terminus. The green fluorescence observed is due to localization of the GFP-tagged protein to the nucleus. Immunofluorescence using an antibody against a known nuclear protein, U1-specific snRNP protein or U1 (red signal), shows similar sub-nuclear localization as shown by the overlay (yellow signal). c, The strategy shown in Fig. 5 was used to isolate molecules interacting with S14. A one-dimensional gel showing proteins eluted from GST beads alone or GST–S14 is shown. The gel was silver stained and the bands indicated by arrowheads were excised and identified by mass spectrometry. These
were again found to be proteins in the spliceosome complex, confirming the presence of S14 in the complex and providing insight to S14's role. (Fig. 6c courtesy of A. King.)
Figure 7 The yeast two-hybrid system. a, Different ORFs are expressed as fusion proteins to either the GAL4 DNA-binding domain (GAL4-BD) or its activation domain (GAL4-AD). If the proteins encoded by the ORFs do not interact with each other, the fusion
proteins are not brought into close proximity and there is no activation of transcription of the reporter gene containing the upstream GAL4-binding sites. b, If the ORFs encode proteins that interact with each other, the fusion proteins are assembled at the GAL4-binding site of the reporter gene, which leads to activation of transcription. c, Library-based yeast two-hybrid screening method. In this strategy, two different yeast strains containing two different cDNA libraries are prepared. In one case, the ORFs are expressed as GAL4-BD fusions and in the other case, they are expressed as GAL4-AD fusions. The two yeast strains are then mated and diploids selected on deficient media. Thus, only the yeast cells expressing interacting proteins survive. The inserts from both the plasmids are then sequenced to obtain a pair of interacting genes.
Searching for genetic determinants in the new millennium
NEIL J. RISCH
Department of Genetics, Stanford University School of Medicine, Stanford, California 94305-5120 , USA
Human genetics is now at a critical juncture. The molecular methods used successfully to identify the genes underlying rare mendelian syndromes are failing to find the numerous genes causing more common, familial, non-mendelian diseases. With the human genome sequence nearing completion, new opportunities are being presented for unravelling the complex genetic basis of non-mendelian disorders based on large-scale genome-wide studies. Considerable debate has arisen regarding the best approach to take. In this review I discuss these issues, together with suggestions for optimal post-genome strategies.
It is now 135 years since the Bohemian monk Gregor Mendel published the results of his breeding experiments on the garden pea, which initiated the modern era of the study of genetics. In Mendel's time, the abounding theory of heredity postulated a 'blending' of the inherited contributions from the two parents. Mendel's work clearly showed that such blending did not occur, and led to his conclusion of particulate inheritance (the 'gene') and rules of segregation. The relevance of Mendel's work for human traits was first delineated around the turn of the century by Garrod, who reasoned correctly that similar types of transmission rules explained the 'inborn errors of metabolism' typically caused by enzyme deficiencies. At the same time, however, there was another school of thought, primarily emanating from statisticians such as Francis Galton and his student, Karl Pearson. They
observed family resemblance for a variety of traits such as anthropometric features and intellectual achievement but they could not discern patterns of inheritance in families that were consistent with mendelian laws. Rather, a 'blending'-type theory seemed more apt, as children's phenotypes tended to be, on average, midway between the parents, with some variability. The resolution of this dilemma did not appear until 1918, when Ronald Fisher published his seminal paper describing 'polygenic' inheritance. Fisher reconciled the two conflicting schools by recognizing that the critical difference lay in the genetic basis for the variation in the trait being studied.
For the traits Mendel studied, the observed variation was due to a simple difference at a single gene (or locus). On the other hand, for the traits studied by the biometrical school, individual differences were not attributable to different alleles at a single locus. Rather, many different genes, each with allelic variations, contributed to the total observed variability in a trait, with no particular gene having a singly large effect. Thus, an individual phenotype results from the sum total of the effects of all the numerous contributing loci. Furthermore, application of the central limit theorem from statistics implicates a continuous normal distribution in the population for such a trait, similar to what is observed. Thus, the lack of mendelian inheritance patterns for numerous human traits did not require the deconstruction of Mendel's theory, but rather an extension of it to a more complex scenario that related genes to phenotype. It is clear that Mendel's success hinged entirely on his selection of single-gene traits, for otherwise the simple rules of inheritance would not have revealed themselves.
The past two decades has witnessed an explosion in both molecular and computational technology, which has enabled the identification of genes for a number of inherited human disorders. These successes have been restricted largely to simple mendelian cases, which are by their nature rare, and although important to the individuals who carry these genes, of limited significance in terms of public health. The promise of the same technology solving the problem of more frequent, non-mendelian familial disorders has largely been unfulfilled. At the same time, at this turn of the millennium, we now find ourselves at the threshold of having the entire human DNA sequence on hand (or at least in silica). It is therefore timely to consider how this new information can best be used in future gene-finding studies, and prospects for success.
The genetic basis of human traits and diseaseCritical to the discussion of what approaches are best suited to unravel the genetic basis of traits or disease in the new millennium is a working model of what that basis is likely to entail. So far, we still have a view that primarily reflects the Mendelist–biometricist dialogue of nearly a century ago. Most human disorders that have been genetically characterized are mendelian, essentially because the extant molecular tools have enabled the identification of these genes by positional cloning (described later), a procedure now described as 'routine'. By contrast, those disorders or traits for which such approaches have failed are depicted as 'polygenic', multifactorial or 'complex'. Often unwilling to cede to a notion of 'infinite' genetic complexity, geneticists refer to these cases as 'oligogenic' or 'multigenic', implicating a tractable degree of complexity.
If one considers that there are estimated to be approximately 100,000 functional genes in humans and functional variation may exist in any of them, the problem becomes apparent. If the genetic variation that contributes to a trait is due to myriad genes, each of modest effect, the task of identifying those individual contributors becomes monumental. The fact is, however, that gene effects typically come in different sizes, even when there are many of them — at least, this has been the lesson from a lengthy history of model systems. There are several measures of gene effects used by geneticists (Box 1). Many human traits, especially disease outcomes, show family recurrence patterns that are strongly suggestive of interactions between genes or epistasis, implying the existence of multiple, interacting loci.
Finding genes — a historical perspectiveBefore the early 1980s, genetic risk factors for a disease or trait could be identified only through direct analysis of candidate genes, usually through association studies. Starting soon after their discovery, blood-group systems such as ABO, MN and Rh were tested directly against an array of human diseases, typically with little replicability. However, after the study of tens of thousands of subjects, it seems that ABO shows consistent, but weak, association with a number of traits involving the gastrointestinal tract1.
Case–control studies The approach often used for such studies is the case–control design, in which a difference in allele frequency is sought between affected individuals and unrelated unaffected controls. From an epidemiological perspective, a major limitation in this approach is the potential for confounding (that is, spurious association resulting from correlation with the true risk factor) leading to artefactual as opposed to causal associations. In this case, the most likely source of confounding is ethnicity, whereby allele frequencies vary by ethnicity and cases and controls are not adequately matched in terms of ethnicity. Although most investigators would at least attempt coarse matching by major demographic groupings (such as race), substratification within racial groups can still lead to bias. This drawback of traditional case–control designs was recognized early on by Lionel Penrose, who recommended the use of unaffected sibs as controls2. This paradigm, originally applied to ABO and duodenal ulcer3, has seen a resurgence in the past few years4-8. The disadvantage of this design is that sib controls are over-matched to the index cases, leading to a loss of power compared with a well-designed study involving unrelated controls7.
Conventional case–control gene-association studies have a long track record of false-positive results. The high false-positive rate has often been attributed to confounding due to stratification, although this has never been proven. It is more likely that the high false-positive rate results from a low prior probability that the few gene polymorphisms examined are in fact causally related to the disease outcomes studied. A case in point relates to another locus (or set of loci) for which the track record has been much better — the human leukocyte antigen (HLA) system on the short arm of chromosome 6 (chromosome 6p). Associations between specific HLA antigens and a variety of diseases (mostly autoimmune) have been reported and repeatedly confirmed — for example, with insulin-dependent diabetes mellitus, multiple sclerosis, rheumatoid arthritis, psoriasis, celiac disease, narcolepsy, haemochromatosis, and many others. The greater success rate in this case reflects the much higher prior probability of a causal relationship for this complex of loci than for other tested loci.
Linkage analysis and positional cloning The situation of gene discovery in humans changed markedly two decades ago when it was recognized that variations in human DNA could be assayed directly and used as genetic markers in linkage studies9. The evolution of the field since then has been nothing short of dramatic. Before this time, human geneticists performing linkage studies to identify the chromosomal location of disease genes relied on only a handful of blood group and serum protein markers with few successes. The identification of restriction-fragment length polymorphism (RLFP) markers9 and subsequently abundant highly polymorphic microsatellite (short tandemly repetitive DNA) loci10, 11 has led to the mapping of myriad mendelian disease loci. Development of more efficient molecular tools, especially high-throughput DNA sequencing, has enabled the identification of disease loci and their mutations by a process characterized as positional cloning. Naturally occurring mutations are identified on the basis of their chromosomal location by taking advantage of the meiotic process of recombination as manifest in families segregating for the disease. Markers closest to the disease gene show the strongest correlation with disease patterns in families, and typically the tracking of recombination events can narrow the region harbouring a disease gene to between 100 and several thousand kilobases.
The remarkable success of positional cloning rests not simply on the advances observed in molecular technology. It also reflects the enormous power of linkage analysis when applied to mendelian phenotypes — that is, those characterized by a (near) one-to-one correspondence between genotypes at a single locus and the observed phenotype (a glossary of terms is presented in Box 3). In terms of biometrical genetics, these are loci with very high displacement (Fig. 1). The observed phenotype corresponds precisely to the underlying genotype with little if any misclassification. The robustness of linkage analysis applied to mendelian traits can be seen by its historic low false-positive rate12 when the stringent lod-score threshold of 3 suggested by Morton13 is used (corresponding to a P value of 10-3 for a sequential test or 10-4 for a fixed sample-size test14). As I will discuss later, this conclusion is true only for the study of mendelian traits.
Figure 1 Examples of mendelian and non-mendelian inheritance using a gaussian model. Full legend High resolution image and legend (56k)
Genetic heterogeneity in mendelian disease An important issue in the study of mendelian disease is the phenomenon of genetic heterogeneity, whereby distinct mutations at the same locus (allelic heterogeneity) or different loci (non-allelic heterogeneity) can cause the same, indistinguishable phenotype. Non-allelic genetic heterogeneity is a form of multi-locus model, wherein the predisposing alleles at each locus are typically rare and independently
capable of producing disease. By contrast, common predisposing alleles often lead to epistasis or interaction effects among loci (Fig. 2 ). In linkage analysis, allelic heterogeneity does not cause a problem because all families (including those with different mutations) will show linkage to the same chromosomal region. In fact, allelic heterogeneity also provides the strongest evidence for a causal relationship between a cloned gene and disease phenotype. Statistically, it is extraordinarily unlikely to find several different mutations at the same locus in unrelated families with the same disease.
Figure 2 Examples of two-locus genetic models. Full legend High resolution image and legend (56k)
Non-allelic heterogeneity can cause a problem in linkage analysis, depending on its extent. In the extreme situation that any single gene accounts for a small proportion of segregating families, very large families would be required to obtain robust linkage evidence, and positional cloning would still be difficult. But for mendelian disease this has rarely, if ever, been the case. More typically, when non-allelic heterogeneity exists, it involves only a few distinct loci; this degree of heterogeneity usually is not a serious impediment either to linkage analysis or positional cloning, essentially because the relationship between phenotype and genotype within families remains strong.
Another important issue relating to mutational heterogeneity is the population under study. For mendelian disease, endogamous population isolates with a limited number of founders tend to have less mutational heterogeneity and an increased frequency of founder effects, which makes them particularly useful in studies of positional cloning. When most affected individuals in a population carry a mutation derived from a single ancestor, they effectively create a single large extended pedigree, although most of the distant relationships are missing. Historic recombination events around the disease mutation can still be inferred, however, by examining the extent of DNA shared on present-day disease chromosomes. This approach, referred to as linkage disequilibrium analysis, has been highly effective in leading to the cloning of numerous disease genes.
The challenge of non-mendelian inheritanceAs noted above, linkage analysis and positional cloning have had a remarkable track record in leading to the identification of the genes for many mendelian diseases, all within the time span of the past two decades. Several of these genes account for an uncommon subset of generally more common disorders such as breast cancer (BRCA-1 and -2), colon cancer (familial adenomatous polyposis (FAP) and hereditary non-polyposis colorectal cancer (HNPCC)), Alzheimer's disease ( -amyloid precursor protein (APP) and presenilin-1 and -
2) and diabetes (maturity-onset diabetes of youth (MODY)-1, -2 and -3). These successes have generated a strong sense of optimism in the genetics community that the same approach holds great promise for identifying genes for a range of common, familial disorders, including those without clear mendelian inheritance patterns. But so far the promise has largely been unfulfilled, as numerous such diseases have proven refractive to positional cloning.
The likely explanation for this is related to the century-old debate between Mendelists and biometricists. The gene mutations studied by Mendel, and those more recently discovered by positional cloning, are those with large effect and strong genotype–phenotype correlations. They are effectively the 'low-hanging fruit' that are easy to harvest. Now, however, we are left with the great majority of the fruit at the top of the tree with no obvious way to reach it. In genetics terms, these are the numerous genes of smaller effect that are likely to underlie most common, familial traits and diseases in humans — that is, the genes more closely related to the biometrical view of the world. Of course, this sharp distinction is artificial, in that in reality gene effects of all magnitudes exist and depend on the trait being studied, but it is also true that the larger the gene effect, the less frequent it is likely to be.
The problem can be given a quantitative interpretation by reverting to the model presented above (Fig. 1, Box 1). For complex diseases, linkage analysis is based on the sharing of alleles identical by descent at a marker locus or loci by affected relatives. For pairs of affected sibs, the most frequently used group, it is straightforward to predict the increase in allele sharing for a fully informative marker at or near the disease locus as a function of the genetic model ( Box 2).
The observations in Box 2, Table 1 and Fig. 3 provide perspective on results of linkage screens for numerous disorders over the past decade. So far, all genes first identified by linkage analysis and subsequently positionally cloned are those with low allele frequency and high displacement (that is, mendelian or near mendelian inheritance). These include the genes listed above for breast cancer, colon cancer, familial Alzheimer's disease and diabetes. By contrast, no genes with moderate or modest displacement, even for rare disorders, have been identified in this way. The literature is now replete with linkage screens for an array of 'complex' disorders such as schizophrenia, manic-depression, autism, asthma, type 1 and type 2 diabetes, multiple sclerosis and lupus, to name but a few. Although many of these studies have reported significant linkage findings, none has led to convincing replication. Typically, independent studies of the same disorder identify maximal evidence at different chromosomal locations. In effect, linkage analysis, traditionally the most reliable of genetic methods when applied to mendelian traits, has proven to be much less reliable a tool for the study of non-mendelian diseases, with a disappointingly high false-positive rate. The likely explanation is that the biometrical view is closer to reality than the mendelian view for most human traits and diseases.
Figure 3 Range of number of ASPs required to detect linkage as a function of allele sharing. Full legend High resolution image and legend (33k)
This does not necessarily mean that no genes underlying non-mendelian traits can be located by linkage analysis. There are several examples of common alleles that have sufficiently large displacement to have been detected by linkage analysis. One example is the role of HLA in type 1 diabetes, where allele sharing by affected sib pairs (ASPs) has been estimated at about 73% (ref. 15). A second example is the role of apolipoprotein E (ApoE) in late-onset Alzheimer's disease, where the ASP allele sharing is estimated at about 60%. Other examples probably exist but have yet to be identified, although the number is likely to be few. Table 1 and Fig. 3 indicate that increasing sample sizes may ultimately improve the odds, but there is clearly a limit. In addition, studying more extreme (and less frequent) phenotypes is helpful provided such cases are also genetically more extreme. However, gene effects with displacements of less than 1 standard deviation (s.d.), which are likely to represent most effects, will rarely be identified this way.
These comments apply equally to quantitative traits studied in humans. Designs that select individuals with extreme phenotypes, both concordant for high or low trait values and extremely discordant for high and low trait values, tend to be the most powerful. But again, only loci with high heritabilities or large displacements can be readily identified by linkage analysis16, 17.
Another question relates to whether larger families with many affected individuals would provide better power than smaller families, such as sib pairs. The answer depends on the frequency of the susceptibility allele. For high-frequency alleles, selection of dense families is likely to increase parental homozygosity at the disease locus and reduce linkage evidence. On the other hand, for rare alleles with large displacement, dense families are usually optimal, because the probability for such a family to be segregating the allele is increased, enhancing the linkage evidence. However, if genome screens of extended pedigrees have been conducted without success, it is reasonable to conclude that rare genes of large effect are unlikely to exist for the trait studied.
Linkage analysis in model systems has actually been far more successful in locating loci with moderate effects for either quantitative traits (quantitative trait loci or QTLs) or disease outcomes than has linkage analysis in humans. There are several reasons for this: (1) inbred strains are often used, which limit the number of loci involved to those that differ between the two strains; (2) rare alleles with large displacement can become fixed in inbred strains subjected to many generations of positive selection; (3) by design, all parents (in an intercross) or half the parents (in a backcross) are heterozygous and thus informative for linkage; and (4) all offspring come from matings of the same phase and thus can be
combined into a single large group for analysis. The lack of all of these features in studies of human linkage has probably led to reduced power, but at least some can be addressed by alternate study designs. For example, reducing human genetic variability (item (1) above) is not possible, although focus on certain populations with reduced genetic variation might be beneficial and has been recommended18. As described above, rare alleles with large displacement in humans can often be identified by studying dense, extended pedigrees (item (2)). Items (3) and (4) above are generally intractable in human linkage studies. The one situation when (3) and (4) apply in humans is when there is linkage disequilibrium (that is, population association) between a marker allele and trait allele. Indeed, when there is complete disequilibrium (or where the trait and marker allele are the same), the human situation becomes directly analogous to the experimental, as individuals from different families can be combined into single groups based on genotype. However, there is still an important difference. In the experimental situation, complete linkage disequilibrium spans the entire length of a chromosome and diminishes only by (1 – ) for a marker at recombination fraction away from the trait locus in a single experimental generation. In humans, the amount of disequilibrium between a trait allele and marker allele depends on trait allele homogeneity and is a function of the time since the allele first arose and population demographic history over that time. Typically, disequilibrium spans very short chromosome segments except for rare, recent mutations. Finally, it is important to note that, despite the initial success and power of linkage analysis to locate trait loci in model organisms, even in this case positional cloning of these genes has remained a significant challenge.
Back to the future-candidate genesThe disappointing results from linkage studies coupled with a biometrical view of the world has led to the suggestion of alternative approaches to tackling the genetics of non-mendelian diseases, namely reversion to the study of candidate genes on a large scale19 or high-density genome scans that are dependent on linkage disequilibrium20. However, first it is useful to show directly the greater power of detection of gene effects by direct-association (or linkage-disequilibrium) analysis when the involved variant is in hand as opposed to depending on linkage analysis without linkage disequilibrium (Fig. 4). By using an analysis similar to one described previously19, ASPs (for linkage) are compared with case–control pairs (for association). Parameterizing the effect of the locus in terms of genotype relative risk (g) and allele frequency (p), for high relative risks (g 4) and intermediate allele frequencies (p = 0.05–0.50) it is realistic to expect linkage analysis to provide statistical evidence for the location of a disease gene. However, for more modest relative risks (g 2), linkage analysis will not provide such evidence except in unrealistically large samples. By contrast, case–control association studies, even using a stringent significance level (5 10-8), provide adequate power for genes with relative risks as low as 1.5 (with p = 0.10–0.70).
Figure 4 Comparison of linkage (dashed lines) with association analysis (solid lines) for detecting genetic effects. Full legend High resolution image and legend (36k)
Random SNPs or coding SNPs? The suggestion of genome-wide searches for gene effects using large-scale testing of single nucleotide polymorphisms (SNPs), or perhaps more appropriately simple nucleotide polymorphisms (which could include short deletions and insertions and multinucleotide changes as well as single nucleotide substitutions), has led to considerable discussion of the efficiency of different approaches (see review in this issue by Roses, pages 857–865, for a discussion of SNPs). The original suggestion of Risch and Merikangas19 was to study coding or promoter variants with potential functional significance. Collins et al.20 subsequently suggested that non-coding or evenly spaced SNPs with high density could be used to track disease loci through linkage disequilibrium. The number of SNPs required for the latter strategy has been the subject of debate, primarily because the extent of linkage disequilibrium in the human genome has not been well studied on a large scale. As opposed to recombination — a biological phenomenon already measured extensively in humans — linkage disequilibrium is a property of populations, and thus depends heavily on their demographic and social histories. Population isolates such as Finns, Ashkenazi Jews and Mennonites have been shown to demonstrate extensive linkage disequilibrium (up to several percent recombination) around rare disease mutations. The degree to which the same will be true for higher-frequency variants is uncertain, although as a general rule the disequilibrium is likely to decline with increasing allele frequency owing to an older coalescence time.
Some researchers have argued that as many as 500,000 evenly spaced SNPs may be required to detect linkage disequilibrium of sufficient magnitude for mapping purposes21, even in population isolates, whereas others have argued that founder populations, especially those that have remained small over an extended time period, such as the Saami of Scandinavia22 or isolated Sardinian populations23, would require far fewer SNPs. Although such populations should improve the chances for detecting rare disease alleles (say less than 5% in frequency), owing to greater linkage disequilibrium per base pair, the same is unlikely to be the case for common alleles (greater than 5% in frequency)24. Furthermore, the power of association tests diminishes significantly with decrease in linkage disequilibrium, and as a result of discordance between the frequencies of disease and marker alleles7, 25, 26. Although increasing marker density greatly enhances the chance of including a marker in strong linkage disequilibrium with the disease allele, the same is not true for similarity of allele frequencies because correlations between SNP allele frequencies do not increase inversely with distance between SNPs27. Another complication is that, in contrast to linkage analysis, a negative linkage-disequilibrium result in a particular genomic region does not exclude a significant gene effect in that region. It may be that the SNPs used there are in modest or no disequilibrium with the disease allele, and/or the allele
frequencies are divergent. Thus, it seems that in a genome-wide random SNP approach, even at high density, many disease-causing genes would be missed.
Several arguments favour using SNPs in coding and promoter regions rather than random SNPs. First, it is these variants, a priori, that are most likely to be of functional significance and to influence directly the traits under study. In fact, these are the variants to which random SNP searches are likely to lead. Second, even if not the causative variant in a gene, such SNPs are as likely (or more likely) to be in linkage disequilibrium with the causative allele as are randomly placed SNPs.
Typology of SNPs If large-scale SNP searches are to become a useful tool for dissecting complex genetic disease, experimental efficiencies need to be brought to bear on the problem. One major efficiency that is possible with association studies but not linkage analysis is DNA pooling, where allele frequencies are examined and compared in a small number of pools rather than a large number of individuals7, 28-30. However, it will still be useful to reduce the number of SNPs studied in a systematic way. Although some have argued for an SNP every n kilobases (where n is between 3 and 100), an alternative approach is to prioritize SNPs based on likely functional significance. The past two decades of study of mendelian traits has provided a rational basis on which to classify genomic variation (for example, based on the type and frequency of mutations observed for mendelian traits). Two recent studies that have scanned genes for polymorphism31, 32 also enable estimation of the number of such SNPs in the human genome. The typology and estimated number of SNPs is provided in Table 2. Coding SNPs (or cSNPs) have been denoted as types I to III depending on whether they lead to non-conservative alterations (type I), conservative amino-acid substitutions (type II), or are synonymous (type III). Non-coding SNPs have been separated into 5' untranslated region (UTR) (type IV), 3' UTR (type V) and other non-coding SNPs (type VI). Ultimately, it may be useful to further fragment the last category into subcategories such as exon/intron boundaries and so on.
If we are limited in the number of SNPs to test, it would seem appropriate to give highest priority to type I SNPs (estimated to number between 60,000 and 100,000), as these types of changes are most often associated with functional effects and phenotypic outcomes. In support of this argument, both Cargill et al.31 and Halushka et al.32 found a relative deficiency of SNPs altering amino-acid sequence as compared with synonymous coding or non-coding SNPs, which is consistent with the former having functional and phenotypic significance (and hence subject to selection). Similarly, Halushka et al.32 found a relative deficit of allelic diversity in the 5' UTR region of genes, suggesting that type IV SNPs should receive priority (an additional 140,000 SNPs). The same would be true for any variants creating or deleting a splice site.
Another important observation made by Cargill et al.31 and Halushka et al.32 is that type I and II SNPs have lower heterozygosity than other types of SNPs, presumably as a result of selection pressure. For example, Cargill et al.31 find that about one-quarter of type I and type II SNPs have minor allele frequencies greater than 15%, whereas nearly 60% have minor allele frequencies less than 5%. As discussed below, this observation is important in designing studies to optimize discovery of associations between genes and disease.
The typology given above (and in Table 2) is based simply on change in DNA sequence. However, advances in functional genomics/proteomics can also bear on this problem. Discoveries relating to time and distribution of expression of genes, for example deriving from microarray studies, can influence our suspicion of their involvement in various disease processes. It is even conceivable that results of expression studies can be correlated with genotypic variation that exists at a locus. Thus, Table 2 could ultimately be refined to incorporate such information and influence the prioritization of SNPs for phenotype analyses.
Optimal study designs The recent resurgence of association studies using candidate genes has led to much discussion about design issues. The simplest such design is the epidemiological case–control study, contrasting allele frequencies in cases versus controls. As is true for case–control studies generally, confounding is a problem for inferring a causal relationship between a disease and measured risk factor. One approach to deal with confounding is the matched case–control design, where individual controls are matched to cases on potential confounding factors (for example, age and sex) and the matched pairs are then examined individually for the risk factor to see if it occurs more frequently in the case than in its matched control.
From the genetics perspective, the most serious potential confounder is ethnicity. If cases and controls are not ethnically comparable, then differences in allele frequency will emerge at all loci that differentiate these groups whether the alleles are causally related to disease or not (this phenomenon is sometimes known as stratification artefact). One solution to this problem is to use a matched case–control design, where controls are ethnically matched to cases. This can in theory be accomplished by focusing on homogenous and randomly mating populations, where cases and controls will presumably be ethnically comparable. However, such populations may be more of a theoretical ideal than a reality, as non-random mating patterns exist in nearly all groups. Nonetheless, association studies in Finland are less likely to be subject to confounding problems than in heterogeneous North American populations.
Another solution to this problem involves the use of relatives as controls for cases. The first such described design proposed the use of unaffected sibs as controls2, 3, and this design has recently seen a resurgence of interest4-8. Designs involving parents as controls have also been proposed33-36. Among these, perhaps the test most similar in spirit to the epidemiological matched case–control analysis is the transmission disequilibrium test35, in which an allele transmitted by a parent to an affected child is matched to the other allele not transmitted from the same parent; MacNemar's chi-square test of discordance is then applied to the resulting pairs34 (Fig. 5). The two alleles carried by a parent are of necessity ethnically matched, and thus the stratification artefact is eliminated. The same applies to sib controls, whose genotypes are ethnically matched to the cases.
Figure 5 Example of candidate-gene association analysis using different control groups. Full legend High resolution image and legend (15k)
But a significant result from a design using parent or sib controls still does not imply a causal relationship between the tested allele and the disease outcome, because linkage disequilibrium with a linked locus (but not an unlinked locus) will also create a positive result. Nevertheless, it does at least indicate a significant gene effect nearby, if not the tested allele itself. The main drawback of using parents or sibs as controls is either unavailability (for example, with parents for a late-onset disease) and loss of power, especially with sibs (as described below).
Whereas the simple case–control design is the mainstay of epidemiology, other family-based approaches are available that are more efficient. In particular, sampling multiplex families, where more than a single individual is affected, can be significantly more efficient than sampling singletons. The increase in efficiency is also a function of the disease allele frequency, and is most pronounced for rarer alleles. Using previously described methods7,
37, I have calculated the number of families and total individuals required to detect a gene effect with g = 4.0 (for the homozygote) and g = 2.0 (for the heterozygote), assuming a significance level = 5 10-8 and power 1 - = 80%. I evaluate two disease allele frequencies, 5% and 20%, and consider designs including one, two or three affected sibs, where the (two) control individuals are either the parents of the sibship, unaffected sibs, or unrelated.
For all designs except sibs, the efficiency is approximately the same when affected and control samples are pooled. For sibs, greater efficiency is possible with individual genotyping37, so those cases (pooled versus not pooled) are evaluated separately. The results are provided in Table 3. Rarer alleles (0.05 versus 0.20) are always more difficult to detect, but the number of subjects required can be reduced substantially by increasing the number affected in the sibship. Using unaffected sibs as controls leads to two to five times the required sample size as using unrelated subjects, depending on the number of affected sibs. Using parents leads to a 40–80% increase, again depending on number of affected sibs. The main conclusion is that if disease-susceptibility alleles are typically low frequency (say 20%), multiplex sibships are particularly advantageous; they are also advantageous for more frequent alleles, but the relative advantage is less7.
An important remaining question is whether to use parents or sibs as controls and suffer the loss in power (especially with sibs), or use unrelated controls and risk loss of robustness. Population stratification has been invoked numerous times as the cause for an observed high false-positive rate in association studies using candidate genes, yet it has rarely been demonstrated as the culprit38. More likely, it is the lack of a stringent significance level used in such studies that is the problem. If one assumes the prior probability for any particular gene variant to be associated with a disease outcome to be low, most reported significant associations will be false positives.
An attractive alternative to using family-based controls is to use random or unlinked genetic markers typed in the same cases and controls to determine the extent of possible confounding by ethnicity39. In fact, the same markers can also be used to assess the significance of any putative association40, or even used to adjust any candidate gene analysis for potential confounding by stratified analysis. Given the proposals for large-scale genotyping, it seems most likely that this approach will ultimately be most efficient.
Population variation and replication As discussed above, rare variants (<5% frequency) are most likely to be population specific. In some cases, they may be recent in origin and hence specific to a single founder population or less recent and generally found in one major ethnic group (for example, haemochromatosis mutation C282Y found only in Caucasians41). These are the variants that are most readily detected by a random SNP linkage-disequilibrium approach, but at the same time potentially least replicable by studying distinct populations. In this case it would be worthwhile to examine the same gene in other populations (or even the same population) for other functional variants that are associated with a similar phenotypic endpoint. Discovery of such alleles provides the strongest evidence for a causal link between the gene and the trait, as is the case with family-specific mutations in mendelian diseases.
Common alleles (>10% frequency) are more likely to be found globally. If so, a causal association between a candidate SNP and trait outcome should be reproducible in many ethnically diverse populations. However, whereas pan-ethnic replicability provides support for a causal relationship, its absence does not necessarily negate it. It is well known that the same mutation can cause a major disease phenotype in one strain of mouse but no phenotype in a genetically distinct strain. Thus, background factors (genetic and otherwise) differentiating populations can modify the expression of a gene and lead to different levels of association. For example, this seems to be the case for ApoE and Alzheimer's disease, where the association exists pan-ethnically but is strongest in Caucasians and Asians, and weaker in Hispanics and African Americans42.
Another advantage to having an ethnically diverse sample of individuals/families is that patterns of linkage disequilibrium may differ ethnically, helping to resolve causal from non-causal relationships. While populations with high linkage disequilibrium may be useful for initial detection of SNP associations, several different SNPs may be in strong or complete disequilibrium. Populations with lower levels of disequilibrium can help resolve which SNP effect is primary. Generally, Africans appear to have the lowest levels of linkage disequilibrium and hence are likely to be most useful for such analyses. An example is provided by the association of HLA and narcolepsy. In Caucasian and Asian populations, the alleles DR2 and DQ -0602 are equally associated with the disease (and in complete disequilibrium with each other), whereas in Africans there is incomplete disequilibrium between them and DQ -0602 shows the primary effect43.
ConclusionsAs we move into a new millennium, the association of computational and molecular technological developments, including the sequencing of the human genome, is opening up new and unprecedented opportunities for genetics research. It is appropriate to reflect on the accomplishments of the past century and where the new technology is likely to lead us.
As I have indicated, much of the current debate in human genetics regarding approaches to the study of complex diseases can be reflected back onto the century-long debate between the Mendelist view and the biometricist view of the world. Much of the difference in views can be attributed to the traits chosen for study, with Mendelists focusing on those dominated by single-gene effects and the biometricists focusing on continuous, 'polygenic'
variation. For most common diseases facing humanity, it is likely that the biometrical view is more apt.
The past two decades have witnessed numerous spectacular applications of positional cloning to identify mendelian human disease genes. But the fact is that the same approach is proving limited in identifying the multitude of genes underlying the more common, complex disorders. Even high-density genome scans with evenly spaced SNPs, depending on linkage disequilibrium, are simply an extension of the same reverse-genetics approach.
At this turn of the millennium, with the completion of the human genome project now in sight, we need to consider the full impact of having the entire human DNA sequence. Although the traditional reverse-genetics approaches (linkage and linkage-disequilibrium analysis) may identify a few of the genetic susceptibility agents we seek, I believe a far greater yield will occur by rethinking this problem from a forward-genetics perspective. Identifying all (or most) of the genes in the human genome, as well as identifying and cataloguing the functional variation lying within them, which occurs naturally in the human population, provides opportunities for studying the impact of those variants on phenotypic outcomes of interest. Functional genomics technology involving microarrays and proteomics will provide added insights regarding gene function on the cellular level, improving our ability to predict phenotypic effects of genes at the organismic level. Nevertheless, efficient study designs will still be required, and multiplex families, the mainstay of linkage-based studies, will still be optimal. However, instead of family-based controls, unrelated controls will emerge as a more powerful and efficient approach (especially for analyses based on pooled DNA samples), and robustness will be maintained by studying a large number of independent SNPs. Sampling families of varying ethnicity will also be advantageous from the perspective of enhancing evidence of causality as well as identifying genetic and/or environmental modifying factors.
Despite future developments, it will still be important to view the study of human disease from an epidemiological perspective. Both human genetics and epidemiology are observational as opposed to experimental sciences, and we will never be able to exert the degree of scientific control in studies of human disease that experimentalists can with model systems. Furthermore, we must not lose sight of the numerous non-genetic influences that influence disease risk, and how they interact with host (that is, genetic) factors.
References
1. Vogel, F. & Motulsky, A. G. Human Genetics: Problems and Approaches (Springer, Berlin, 1982).
2. Penrose, L. S. Some practical considerations in testing for genetic linkage in sib data. Ohio J. Sci. 39, 291-296 (1939).
3. Clarke, C. A. et al. ABO blood groups and secretor character in duodenal ulcer. Br. Med. J. 2, 725-731 (1956). | ISI |
4. Curtis, D. Use of siblings as controls in case-control association studies. Am. J. Hum. Genet. 61,
319-333 (1997). | ISI |5. Spielman, R. S. & Ewens, W. J. A sibship based test for linkage in the presence of association:
the sib transmission/disequilibrium test. Am. J. Hum. Genet. 62, 450-458 (1998). | Article | PubMed | ISI |
6. Boehnke, M. & Langefeld, C. D. Genetic association mapping based on discordant sib pairs: the discordant-alleles test. Am. J. Hum. Genet. 62, 950-961 (1998). | Article | PubMed | ISI |
7. Risch, N. & Teng, J. The relative poser of family-based and case-control designs for association studies of complex human diseases. I. DNA pooling. Genome Res. 8, 1273-1288 (1998). | PubMed | ISI |
8. Schaid, D. J. & Rowland, C. Use of parents, sibs and unrelated controls for detection of associations between genetic markers and disease. Am. J. Hum. Genet. 63, 1492-1506 (1998). | Article | PubMed | ISI |
9. Botstein, D., White, R. L., Skolnick, M. & Davis, R. W. Construction of a genetic linkage map in man using restriction fragment length polymorphisms. Am. J. Hum. Genet. 32, 314-331 (1980). | PubMed | ISI |
10. Weber, J. L. & May, P. E. Abundant class of human DNA polymorphisms which can be typed using the polymerase chain reaction. Am. J. Hum. Genet. 44, 388-396 (1989). | PubMed | ISI |
11. Litt, M. & Luty, J. A. A hypervariable microsatellite revealed by in vitro amplification of a dinucleotide repeat within the cardiac muscle actin gene. Am. J. Hum. Genet. 44, 397-401 (1989). | PubMed | ISI |
12. Rao, D. C., Keats, B. J. B., Morton, N. E., Yee, S. & Lew, R. Variability of human linkage data. Am. J. Hum. Genet. 30, 516-529 (1978). | PubMed | ISI |
13. Morton, N. E. Sequential tests for the detection of linkage. Am. J. Hum. Genet. 7, 277-318 (1955). | ISI |
14. Ott, J. Analysis of Human Genetic Linkage (Johns Hopkins University Press, Baltimore, 1991).15. Concannon, P. et al. A second-generation screen of the human genome for susceptibility to
insulin-dependent diabetes mellitus. Nature Genet. 19, 292 (1998). | Article | PubMed | ISI |16. Risch, N. & Zhang, H. Extreme discordant sib pairs for mapping quantitative trait loci in humans.
Science 268, 1584-1589 (1998).17. Eaves, L. & Meyer, J. Locating human quantitative trait loci: guidelines for the selection of sibling
pairs for genotyping. Behav. Genet. 24, 443-455 (1994). | PubMed | ISI |18. Terwilliger, J. D., Zollner, S., Laan, M. & Paabo, S. Mapping genes though the use of linkage
disequilibrium generated by genetic drift: 'drift mapping' in small populations with no demographic expansion. Hum. Hered. 48, 138-154 (1998). | PubMed | ISI |
19. Risch, N. & Merikangas, K. The future of genetic studies of complex human diseases. Science 273, 1516-1517 (1996). | PubMed | ISI |
20. Collins, F. S., Guyer, M. S. & Chakravarti, A. Variations on a theme: cataloging human DNA sequence variation. Science 278, 1580-1581 (1997). | Article | PubMed | ISI |
21. Kruglak, L. Prospects for whole-genome linkage disequilibrium mapping of common disease genes. Nature Genet. 22, 139-144 (1998). | Article |
22. Laan, M. & Paabo, S. Demographic history and linkage disequilibrium in human populations. Nature Genet. 17, 435-438 (1997). | PubMed | ISI |
23. Lonjou, C., Collins, A. & Morton, N.E. Allelic association between marker loci. Proc. Natl Acad. Sci. USA 96, 1621-1626 (1999). | Article | PubMed | ISI |
24. Wright, A. F., Carothers, A. D. & Pirastu, M. Population choice in mapping genes for complex diseases. Nature Genet. 23, 397-404 (1999). | Article | PubMed | ISI |
25. Muller-Myhsok, B. & Abel, L. Genetic analysis of complex diseases. Science 275, 1328-1329 (1997). | PubMed | ISI |
26. Tu, I.-P & Whittemore, A. S. Power of association and linkage tests when the disease alleles are unobserved. Am. J. Hum. Genet. 64, 641-649 (1999). | Article | PubMed | ISI |
27. Nickerson, D. A et al. DNA sequence diversity in a 9.7kb region of the human lipoprotein lipase gene. Nature Genet. 19, 233-240 (1998). | Article | PubMed | ISI |
28. Arnheim, N., Strange, C. & Erlich, H. Use of pooled DNA samples to detect linkage
disequilibrium of polymorphic restriction fragments and human disease: studies of the HLA class II loci. Proc. Natl Acad. Sci. USA 82, 6970-6974 (1985). | PubMed | ISI |
29. Carmi, R. et al. Use of DNA pooling strategy to identify a human obesity syndrome locus on chromosome 15. Hum. Mol. Genet. 3, 1331-1335 (1995).
30. Barcellos, L. F. et al. Association mapping of disease loci by use of a pooled DNA genomic screen. Am. J. Hum. Genet. 61, 734-747 (1997). | PubMed | ISI |
31. Cargill, M. et al. Characterization of single-nucleotide polymorphisms in coding regions of human genes. Nature Genet. 22, 231-238 (1999). | Article | PubMed | ISI |
32. Halushka, M. K. et al. Patterns of single-nucleotide polymorphisms in candidate genes for blood-pressure homeostasis. Nature Genet. 22, 239-247 (1999). | Article | PubMed | ISI |
33. Falk, C. T. & Rubinstein, P. Haplotype relative risks: an easy reliable way to construct a proper control sample for risk calculations. Ann. Hum. Genet. 51, 227-233 (1987). | PubMed | ISI |
34. Terwilliger, J. D. & Ott, J. A haplotype-based "haplotype-relative risk" approach to detecting allelic associations. Hum. Hered. 42, 337-346 (1992). | PubMed | ISI |
35. Spielman, R. S. McGinnis, R. E. & Ewens, W. J. Transmission test for linkage disequilibrium: The insulin gene region and insulin-dependent diabetes mellitus (IDDM). Am. J. Hum. Genet. 52, 506-516 (1993). | PubMed | ISI |
36. Thomson, G. Mapping disease genes: family-based association studies. Am. J. Hum. Genet. 57, 487-498 (1995). | PubMed | ISI |
37. Teng, J. & Risch, N. The relative power of family-based and case-control designs for linkage disequilibrium studies of complex human diseases. II. Individual genotyping. Genome Res. 9, 234-241 (1999). | PubMed | ISI |
38. Morton, N. E. & Collins, A. Tests and estimates of allelic association in complex inheritance. Proc. Natl Acad. Sci. USA 95, 11389-11393 (1998). | Article | PubMed | ISI |
39. Pritchard, J. K. & Rosenberg, N. A. Use of unlinked genetic markers to detect population stratification in association studies. Am. J. Hum. Genet. 65, 220-228 (1999). | Article | PubMed | ISI |
40. Devlin, B. & Roeder, K. Genomic control for association studies. Biometrics 55, 997-1004 (1999). | PubMed | ISI |
41. Feder, J. N. et al. A novel MHC class 1-like gene is mutated in patients with hereditary haemochromatosis. Nature Genet. 13, 399-408 (1996). | PubMed | ISI |
42. Farrer, L. A. et al. Effects of age, sex and ethnicity on the association between apolipoprotein E genotype and Alzheimer's disease. A meta-analysis. APOE and Alzheimer Disease Meta Analysis Consortium. J. Am. Med. Assoc. 278, 1349-1356 (1997). | ISI |
43. Mignot, E. et al. DZB1*0602 and DQA1*0102 (DQ1) are better markers than DR2 for narcolepsy in Caucasian and Black Americans. Sleep 17, S60-S67 (1994). | PubMed | ISI |
44. Kempthorne, O. An Introduction to Genetic Statistics (Iowa Univ. Press, Ames, 1969).45. Khoury, M. J., Beaty, T. H. & Cohen, B. H. Fundamentals of Genetic Epidemiology (Oxford
University Press, New York, 1993).46. Risch, N. Linkage strategies for genetically complex traits. I. Multi-locus models. Am. J. Hum.
Genet. 46, 222-228 (1990). | PubMed | ISI |47. Lander, E. & Kruglak, L. Genetic dissection of complex traits: guidelines for interpreting and
Figure 1 Examples of mendelian and non-mendelian inheritance using a gaussian model. Both loci have the same heritability HL = 12%. a, Dominant mendelian locus with allele frequency p = 0.00275 and displacement t = 5 s.d. Disease occurs above the threshold of 3 s.d. Disease risk for heterozygotes (Aa) is 98% and for homozygotes (aa) it is 0.13%. The population prevalence K = 0.67%. b, Non-mendelian additive locus with allele frequency p = 0.40 and displacement t = 0.5 s.d. for each A allele (or total displacement t = 1). Disease occurs above the threshold of 2.5 s.d. Disease risk for high-risk homozygotes (AA) is 6.7%, for heterozygotes (Aa) it is 2.3% and for low-risk homozygotes (aa) it is 0.62%. The population disease prevalence K = 2.4%. Even though the locus is additive on the liability scale, the disease risks are non-additive.
Figure 2 Examples of two-locus genetic models. a, Genetic heterogeneity with two rare dominant mendelian alleles (A and B) each with a frequency p = 0.01. The displacement t for each A and B allele is 5 s.d. Disease risk for each heterozygote is 98% whereas for normal homozygotes it is 0.13%. Other genotypes are extremely rare. Population disease prevalence K = 4%. b, Additive non-mendelian model. The A and B allele each have frequency p = 0.10. Displacement is 1 s.d. for each A or B allele, or total displacement t = 2 for each locus. Disease occurs above a threshold of 2.5 s.d. Disease risk for genotype aabb is 0.62%; for genotypes Aabb and aaBb it is 6.7%; for genotypes AaBb, AAbb, aaBB it is
31%; and for genotypes AABb, AaBB (rare, not shown) it is 69%. Population disease prevalence K = 4%. Although the two loci are additive on the liability scale, the disease risks are non-additive and show both dominance and epistasis effects.
Figure 3 Range of number of ASPs required to detect linkage as a function of allele sharing.
Figure 4 Comparison of linkage (dashed lines) with association analysis (solid lines) for detecting genetic effects. Linkage is based on ASPs with a completely linked and informative marker. Association is based on case–control pairs testing the causative locus. A multiplicative model is assumed, where the genotype relative risk (GRR or g) of the high-risk homozygote is the square of the value of g for the heterozygote, which is given in the figure. Loci with g > 1.5 can be detected by association analysis, but g > 4.0 is needed to detect a locus by linkage analysis.
Figure 5 Example of candidate-gene association analysis using different control groups. The case has two A alleles. The parental control (alleles not transmitted to the affected
child) is two a alleles. Analysing the frequency of A among transmitted versus non-transmitted alleles by a chi-square test gives rise to the haplotype relative risk test32, 33. Pairing each parent's transmitted allele with the non-transmitted allele and comparing the frequency of the two types of discordant pairs (A transmitted, a non-transmitted, compared with a transmitted, A non-transmitted) by MacNemar's chi-square test gives rise to the transmission disequilibrium test33, 34. The sib control alleles are A and a, and comparison with the affected sib gives rise to sibship-based tests3-8. The unrelated control (two a alleles) gives rise to a traditional matched case–control analysis
Genetics Directorate, Glaxo Wellcome plc, Greenford, Middlesex UB6 0HE, UK, and Duke University Medical Center, Durham, North Carolina 27710, USA
"If it were not for the great variability among individuals medicine might as well be a science and not an art." The thoughts of Sir William Osler in 1892 reflect the view of medicine over the past 100 years. The role of physicians in making the necessary judgements about the medicines that they prescribe is often referred to as an art, reflecting the lack of objective data available to make decisions that are tailored to individual patients. Just over a hundred years later we are on the verge of being able to identify inherited differences between individuals which can predict each patient's response to a medicine. This ability will have far-reaching benefits in the discovery, development and delivery of medicines. Sir William Osler, if he were alive today, would be re-considering his view of medicine as an art not a science.
Every individual is a product of the interaction of their genes and the environment. Pharmacogenetics is the study of how genetic differences influence the variability in patients' responses to drugs. Through the use of pharmacogenetics, we will soon be able to profile variations between individuals' DNA to predict responses to a particular medicine. The medical significance and economic value of a simple, predictive medicine response profile, which will provide information on the likelihood of efficacy and safety of a drug for an individual patient, will change the practice and economics of medicine. The ability to rapidly profile patients who are likely to benefit from a particular medicine will also streamline drug development and provide opportunities to develop discrete medicines concurrently for different patients with similar disease phenotypes. Other than relatively rare and highly penetrant diseases related to mutations of a single gene inherited in families
(Box 1 ), science has never before had the tools to characterize the nuances of inherited metabolic variations that interact over time and lead to common diseases. Powerful pharmacogenetic research tools are now becoming available to classify the heterogeneity of disease as well as individual responses to medicines.
An ongoing ethical debate concerning potential genetic applications and the impact on individuals and families accompanies scientific advances. Clearly defined terminology should form the basis for informative discussions so that the word 'genetics' is not demonized. For example, tests that are specific to disease genes can help diagnose disease, determine the carrier status of an individual or predict the occurrence of disease. These are quite distinct from profiles that, for example, are specific for genes involved in drug metabolism, which provide information on how a medicine will be metabolized in an individual. In the near future (1–3 years) there will be non-disease- and non-gene-specific pharmacogenetic profiles developed to determine whether an individual is likely to respond to a medicine and/or to not experience serious side effects. Language needs to be more precise so that there can be clarity, especially for public policy debates. Pharmacogenetics is not gene therapy, not genetically modified foods, not genetic engineering, and not cloning of humans or their organs. Ethical, legal and social implications for 'genetic tests' of single-gene mutational diseases should not automatically be assumed for other non-disease-specific applications simply because they are labelled imprecisely as 'genetic tests'. Use of inaccurate terminology may hinder and delay the significant health-care benefits that will accrue from pharmacogenetics.
It is important to discuss how the benefits of pharmacogenetics can be applied to drug development and the provision of better health care today — 3–5 years before the widespread application of pharmacogenetics. This will enable the maximum benefits for patients to be obtained as rapidly as possible. In this review I begin with a brief discussion of how genetics and genomics are used in the pharmaceutical industry to identify targets and discover new medicines that will stop or prevent disease processes and then discuss how pharmacogenetics will impact the pharmaceutical industry and the provision of health care.
Target selectionTarget validation that will predict a well-tolerated and effective medicine for a clinical indication in humans is a widely perceived problem; but the real challenge is target selection1-3. A limited number of molecular target families have been identified, including receptors and enzymes, for which high-throughput screening is currently possible. A good target is one against which many compounds can be screened rapidly to identify active molecules (hits). These hits can be developed into optimized molecules (leads), which have the properties of well-tolerated and effective medicines. Selection of targets that can be validated for a disease or clinical symptom is a major problem faced by the pharmaceutical industry. The best-validated targets are those that have already produced well-tolerated and effective medicines in humans (precedented targets). Many targets are chosen on the basis of scientific hypotheses and do not lead to effective medicines because the initial hypotheses are often subsequently disproved.
Two broad strategies are being used to identify genes and express their protein products for use as high-throughput targets. These approaches of genomics and genetics share technologies but represent distinct scientific tactics and investments. Discovery genetics uses human disease populations to identify disease-related susceptibility genes. Discovery genomics uses the increasing number of databases of DNA sequence information to identify genes and families of genes for tractable or screenable targets that are not known to be genetically related to disease.
The advantage of information on disease-susceptibility genes derived from patients is that, by definition, these genes are relevant to the patients' genetic contributions to the disease. However, most susceptibility genes will not be tractable targets or amenable to high-throughput screening methods to identify active compounds1, 3. The differential metabolism related to the relevant gene variants can be studied using focused functional genomic and proteomic technologies to discover mechanisms of disease development or progression. Critical enzymes or receptors associated with the altered metabolism can then be used as targets. Gene-to-function-to-target strategies that focus on the role of the specific susceptibility gene variants on appropriate cellular metabolism become important (Fig. 1).
Figure 1 Genetics and genomics to identify drug targets. Full legend High resolution image and legend (50k)
Data mining of sequences from the Human Genome Project and similar programmes with powerful bioinformatic tools has made it possible to identify gene families by locating domains that possess similar sequences. Genes identified by these genomic strategies generally require some sort of functional validation or relationship to a disease process. Technologies such as differential gene expression, transgenic animal models, proteomics, in situ hybridization and immunohistochemistry are used to imply relationships between a gene and a disease process. Over the next five years there will be many opportunities to identify the full complement of gene families. Some of these families can provide tractable targets for high-throughput screening of molecules.
The difference between the genomic approach and the genetic approach is that the former creates a need to functionally validate the tissue distribution and other aspects of each identified gene and find a relevant disease or clinical indication. In contrast, once the disease-related variants of susceptibility disease genes are identified, a single susceptibility gene is automatically validated in human disease. The major distinction between the genomic and genetic approaches is target selection, with genetically defined genes and variant-specific targets already known to be involved in the disease process. The current vogue of discovery genomics for nonspecific, wholesale gene identification, with each gene in search of a relationship to a disease, creates great opportunities for development of medicines. However, there are also enormous economical costs associated with searching
huge lists of genes for 'the right disease for the available gene'. It is correct to state that target validation is a major challenge to the pharmaceutical industry, but it is also critical to realize that the core problem for drug development is poor target selection. The screening use of unproven technologies to imply disease-related validation, and the huge investment necessary to progress each selected gene to proof of concept in humans, is based on an unproven and cavalier use of the word 'validation'. Each failure is very expensive in lost time and money.
For example, differential gene expression (DGE) and proteomics are screening technologies that are widely used for target validation. They detect different levels and/or patterns of gene and protein expression in tissues, which may be used to imply a relationship to a disease affecting that tissue4-6. Screening with these powerful tools has yet to lead to a specific target for a drug candidate with proven efficacy in humans or to a marketed drug. In fact, the proof-of-concept experiments to demonstrate that differences in the tissue expression of a particular gene are related to disease expression (two very different meanings to 'expression') have not been performed in any common disease with known susceptibility genes. Neither have functional genomic screening methods yet been applied to rare mutational diseases for proof of principle. Rather there has been a tacit and widespread assumption that differentially expressed genes will be related causally to disease progression, rather than as a consequence of disease-related processes. Selecting the right gene using large-scale screening technologies is a significant and expensive problem.
There at least are two common disease examples in which the expression of genetic differences identified by DGE technologies would not have led to target definition. The gene encoding apolipoprotein E (ApoE) is a known susceptibility gene for common, late-onset Alzheimer's disease. Specific allelic variants that are inherited determine the risk and age of onset distribution of the disease7, 8. Traditional tissue immunohistochemical and in situ hybridization studies of the distribution of ApoE have been more revealing than functional genomic screening methods, showing that ApoE is expressed in human neurons under normal conditions, but not in rodent neurons, which are used to model characteristics of Alzheimer's disease9-12. Differential expression of total brain ApoE in patients with Alzheimer's disease has not led to the identification of tractable targets. It is highly unlikely (and to date untested as a proof of principle) that -amyloid precursor protein (APP) or presenilin mutations, each causing rare, early-onset, dominantly inherited Alzheimer's disease, would have been identified using these methods. Yet DGE and proteomic screening methods are currently major investments in several research programmes that work on Alzheimer's disease.
The converse experiment was published recently for an already validated target. Peroxisome proliferator-activated receptor- (PPAR- ) is a nuclear receptor with documented involvement in glucose metabolism and homeostasis13, 14. PPAR- can be considered a precedented target molecule, which can be screened using high-throughput methods for molecules that are effective in treating diabetes mellitus. In this case, there was no previous evidence for PPAR- as a susceptibility gene for diabetes mellitus, nor was there any abnormality in differential PPAR- expression. But a rare and severe form of diabetes mellitus has now been shown to be related to specific mutations of the PPAR- molecule15, thus providing further validation of PPAR- as a target. There is, however, no
indication that DGE screening or proteomic analyses of comparative tissues from common diabetic patients would have identified the precedented molecular target, PPAR- . In this case, the genetic data followed validation of a target in humans, and not from differential genomic screening techniques.
The identification of disease-susceptibility genes and study of the function of the susceptibility gene variants will lead to targets that, by definition, will be related to the disease in patients and will therefore be validated. This process identifies few targets compared with the approach used in discovery genomics of data-mining human sequence information. It is therefore practical to use both genetic and genomic strategies and to focus screening technologies to 'pick the winners'.
Pharmacogenetics and medical practiceDiagnosis When we go to see our doctor, our symptoms and physical signs are evaluated, and appropriate tests (for example, blood, urine, X-ray and magnetic resonance imaging) are undertaken. To the non-physician, this process of disease diagnosis seems straightforward. However, for a patient to have all the classical symptoms and signs of a particular disease is the exception rather than the rule. How these diagnoses relate to the underlying mechanism of disease is often unknown. For example, patients with mutations in different genes may present as clinically identical. Mutations of APP, presenilin 1 and presenilin 2 lead to clinically indistinguishable forms of Alzheimer's disease16-19. It is also important to note that mutations at different sites along the APP gene can lead to two distinct diseases, early-onset Alzheimer's disease and recurrent intracerebral haemorrhages20. For many common diseases, the situation may be assumed to be even more complicated, with many contributing molecular variants of several interacting susceptibility genes leading to multiple clinical effects over varying time frames7, 21-25 (Box 1). Thus many of the diseases that we classify clinically may be syndromes with several distinct contributing pathogenic mechanisms. With all this clinical and genetic heterogeneity we should not lose sight of the fact that the major objective is to treat, cure or prevent disease. It is significant that a medicine works; does it matter whether it is effective in patients who may have different diagnoses? The goal of medicine is to relieve pain and suffering. Similar mechanisms may exist for quite diverse clinical diseases. As the targets and mechanisms are validated in humans, additional clinical indications may become more obvious because of shared mechanisms rather than similar clinical presentations.
How does your doctor know when making the diagnosis that medicines that are effective for you have not been precluded? Pharmacogenetics will enable individuals to be classified according to their likely response to a medicine. This is not a new concept as clinical subtypes are often classified by drug responsiveness (for example, steroid-sensitive and steroid-resistant asthma). Application of pharmacogenetics will expand the population to those who can be helped but might have otherwise been missed because their clinical syndrome did not fit neatly into a traditional disease category. Alosetron is a recently approved medicine in the United States for the treatment of female patients with diarrhoea-predominant irritable bowel syndrome (IBS)26, 27. Most physicians will acknowledge that the diagnosis of IBS can be imprecise — in fact, the 'disease' is truly a syndrome. The value of a diagnostic test to sub-classify IBS into different types may be limited, but a simple medicine response profile to determine whether the patient's symptoms will be alleviated
by alosetron could have considerable value28. Pharmacogenetic approaches will no doubt confirm what clinicians already know — disease diagnosis is not easy nor necessarily homogeneous and accurate.
Apparently distinct diseases may have similar underlying mechanisms. A medicine developed for a specific indication could have value in treating other related or non-related conditions. This is also not a new concept. There are many medicines that were initially registered with a single indication, which have then been expanded as more clinical research is conducted. For example, carbamazepine was initially registered as a treatment for trigeminal neuralgia, a syndrome with intermittent severe lightning-like bursts of facial pain, but was later extended to treat various forms of epilepsy. By understanding the genetic basis of patient responses to medicines, and perhaps also by having a better understanding of how the medicine works, we will be able to identify additional clinical indications more quickly.
Treatment How does a physician know if the medicine and the dose prescribed will be effective and whether or not the patient will experience adverse effects? Information is available from clinical trials in the medicine's data sheet/label in which similar patients were included and the physician may use experience of treating previous patients. On many occasions, the prescribed medicine will be effective and not cause serious side effects. Other patients may not respond or suffer adverse reactions. By applying the results of pharmacogenetic research to clinical practice, physicians will be able to use information from patients' DNA to determine how patients are likely to respond to a particular medicine. The clinical fact that the drug dose for some patients must be individualized has been accepted for years. Polymorphisms in genes encoding P450 enzymes, N-acetyltransferase and other key enzymes in drug metabolism account for the concentration variation of certain drugs in patients' blood29, 30. It is also well established that some patients can be slow in activating drugs and respond inadequately to some prodrugs, or exhibit reduced clearance and increased effects from some pharmacologically active agents31-33. Enzyme tests that measure those variants have, in some cases, already been replaced with genetic variants on chips. In the future, metabolic screens of genetic variants will be standardized so that automated read-outs of each person's predicted response to each medicine could be generated. These DNA-based screens will not provide disease-specific diagnosis, but useful information to aid in individual dosing of medications or avoidance of side effects.
SNP mapping: a tool for personalized genetic profilingSingle nucleotide polymorphisms (SNPs) are single-base differences in the DNA sequence that can be observed between individuals in the population34-36 (Box 2). A polymorphism has been defined as the least common allele occurring in 1% or greater of the population37, whereas mutations are rare differences which occur in less than 1% of the population (usually much less than 1%). Typically, mutations have been discovered in coding sequences of genes causing rare inherited diseases38. SNPs are present throughout the human genome with an average frequency of approximately 1 per 1,000 base pairs (bp)35. 'The SNP Consortium' (a consortium of pharmaceutical and bio-informational companies, five academic centres and a charitable trust) is currently producing an ordered high-density SNP map of the human genome (Box 2). Mapped SNPs are being placed regularly into
public domain websites (http://snp.cshl.org ). The original target was to produce an SNP map with 200,000–300,000 SNPs evenly distributed throughout the human genome. In fact, this initiative is ahead of schedule and will probably provide 600,000–800,000 SNPs by the end of year 2 (April 2001). This map will enable disease and drug response phenotypes to be mapped by linkage disequilibrium. Linkage disequilibrium occurs when haplotype combinations of alleles at different loci occur more frequently than would be expected from random association; it decays with time (generations) in proportion to the recombination fraction between the loci. When alleles are physically close, they are more likely to be inherited together than are alleles that are further apart. Therefore, variations of several ordered SNP markers that are close to, or within, a particular gene variant on a chromosome are likely to be inherited together with that gene variant when they are in linkage disequilibrium. So consecutive SNP variations that are in linkage disequilibrium and associated with a disease phenotype can 'mark' the position on the chromosome where a susceptibility gene is located.
Recent data show the utility of using high-density SNP linkage disequilibrium mapping to find disease-susceptibility genes. Before these SNP mapping experiments, individual testing of multiple candidate genes found to be located within a linkage region was a long, expensive and relatively unproductive way of searching for disease-susceptibility genes.
Polymorphisms of the ApoE gene provided the first proof of principle for the detection of a linkage disequilibrium locus around a known susceptibility gene for Alzheimer's disease. In 1997, a high-density SNP map for a region of 4 million bases (0.1% of the human genome) around the ApoE locus on chromosome 19 was constructed39. The goal of the experiment was to determine whether the ApoE gene could be detected as a susceptibility locus associated with Alzheimer's disease using high-density SNP mapping to detect a small region of linkage disequilibrium (Fig. 2a,b )40. These studies showed that by using DNA from patients with Alzheimer's disease and controls, it is possible to detect those SNPs in linkage disequilibrium that are associated with the disease.
Figure 2 Significance of SNP allele frequency differences in an affected Alzheimer's disease population and age-matched controls. Full legend High resolution image and legend (37k)
This methodology has been used to identify susceptibility genes for other diseases such as migraine with aura, which is also localized on chromosome 19 (Fig. 3). In this case a linkage region of approximately 1 million bases was reduced to a 70,000–120,000-bp locus (C.-F. Xu et al., unpublished results). Although this linkage disequilibrium segment of DNA is larger than that found for ApoE and Alzheimer's disease, it contains the coding
sequences of a single gene. Similar data have been collected and tested for psoriasis on chromosome 3 (C.-F. Xu et al., unpublished results) and non-insulin-dependent diabetes mellitus on chromosome 12 (E. Lai et al., unpublished results). Thus it is now possible to rapidly reduce the size of the DNA region which contains disease-susceptibility genes by two to three orders of magnitude from millions of base pairs to thousands of base pairs. In practical terms, this accelerates the identification of susceptibility genes within the relatively large regions of DNA that are found by traditional linkage using typical 400 marker screens. Using theoretical, simulated data, some researchers had suggested that one SNP per 6,000 bp would be necessary to locate disease-susceptibility genes41. These simulations have been questioned and are not supported by published data or data from mapping of susceptibility genes42, 43. In particular, this research in these disease areas is a practical demonstration that a density of SNPs of one every 10,000–30,000 bp can rapidly narrow the search for susceptibility genes. After the high-density SNP map of the whole genome is completed, it will no longer be necessary to create SNP maps at each disease locus as they will already exist. Thus the rate of discovery of susceptibility genes will depend on the quality of the patient and control populations, rather than being limited by the technical capacity to construct new, ordered, limited SNP maps. The next technical hurdle will be the development of inexpensive high-throughput methods for scoring large numbers of SNPs from hundreds of patients and controls. Considerable efforts are now underway within the biotechnical community to establish low-cost, high-throughput, accurate SNP scoring technologies.
Figure 3 Linkage disequilibrium data for 12 adjacent SNPs that are located and ordered within the 120-kilobase region encoding a migraine susceptibility gene (in this instance, a D' value above 0.30 is indicative of highly significant linkage disequilibrium). Full legend High resolution image and legend (56k)
Determining abbreviated SNP linkage disequilibrium profilesSNPs are the simplest form of DNA polymorphism. Using currently available DNA analysis systems, such as chip-based resequencing or microsphere-based analytical methodologies, thousands of SNPs can be read out automatically and rapidly36, 44. By applying whole-genome SNP linkage disequilibrium mapping to patients during phase II clinical trials of a medicine, it may be possible to select multiple small regions from the whole-genome SNP map where SNPs are in linkage disequilibrium and associated with efficacy and common adverse event phenotypes45. Selecting only these small regions of SNP linkage disequilibrium into abbreviated SNP linkage disequilibrium profiles (Box 2) will enable more rapid and inexpensive screening of patients who are likely to experience efficacy or adverse events in response to that medicine46. Thus whereas the phase II SNP scan might genotype 200,000 SNPs for each patient, the critical data used for identifying markers for efficacy for subsequent phase III clinical trials may use only several hundred SNPs from multiple small regions in linkage disequilibrium and associated with efficacy or adverse events. The abbreviated patterns for efficacy could be extended during large-scale post-approval drug surveillance (see below) to include further efficacy phenotypes and
adverse event profiles without providing any significant collateral disease information for relatives regarding inheritance of any specific disease-associated gene allele.
Chip technologies are already available for accurately genotyping hundreds to a few thousand SNPs36. The cost of chips as a platform for medicine response profiling is likely to be reduced when analyses of hundreds of thousands of patients are performed once the medicine is marketed. In fact, each chip could contain a panel of abbreviated SNP linkage disequilibrium profiles for several drugs with the same clinical indications so that the most appropriate medicine with that indication for that patient can be determined from a single blood sample.
Similar analyses of patients with identical disease phenotypes could be used to determine disease heterogeneity. Different SNP linkage disequilibrium profiles of patients with the same disease phenotype could define patterns of disease heterogeneity without necessarily identifying the actual genes and alleles involved36, 47. Genetic research conducted during phase II clinical trials of investigational medicines could use the high-density SNP map of the human genome to identify the sub-type of the disease as well as SNP markers in linkage disequilibrium that correlate with specific responses to the medicine.
Pharmacogenetics and drug developmentMore efficient clinical trials and enhanced drug surveillance Application of SNP mapping technologies will enable effective medicines to be developed and made available for clinical use more rapidly. Using abbreviated SNP linkage disequilibrium mapping, medicine response profiles could be identified during phase II clinical trials. These could be used in the selection of patient groups enriched for efficacy in phase III studies. This is likely to make these trials smaller, faster and more efficient48.
Regulatory agencies would correctly be concerned that there were not enough patients in these streamlined phase III trials to evaluate adverse events, although larger clinical trials that do not select 'efficacy' patients are also unlikely to detect rare adverse events (less than 1 in 1,000). Regulatory authorities would also be apprehensive that, when the drug is marketed, patients who did not meet the pharmacogenetic criteria for prescription may be prescribed the drug without study of their potential benefits or adverse events. However, the risk –benefit ratio for patients with poor efficacy predictions may exclude them from phase III studies on ethical grounds as they would now knowingly be included solely to experience potential adverse events. Furthermore, in clinical practice, access to the medicine could be determined by prescriptions based on pharmacogenetic profiles.
In fact, pharmacogenetic technology may enable a significantly enhanced post-approval surveillance system to be established for approved medicines. Regulatory agencies, pharmaceutical companies and the public recognize the need to improve strategies for drug surveillance49, 50. In this proposed concept of regulated surveillance, hundreds of thousands of patients who receive the medicine would have blood spots taken and stored on filter papers in an approved location using the original blood sample screened for the initial medicine response profile for efficacy. As rare, serious adverse events are documented and characterized, DNA from patients who experienced the adverse event could be extracted and compared with DNA from control patients who received the drug but did not
experience the adverse event. This would enable abbreviated SNP profiles for patients susceptible to the adverse event to be determined. These adverse event profiles would be combined with efficacy profiles to produce a comprehensive medicine response profile. This would allow selection of patients for both efficacy and lower complications of therapy (Fig. 4).
Figure 4 The development of a pharmacogenetic medicine response profile. Full legend High resolution image and legend (56k)
A predictive pharmacogenetic adverse event profile derived from hundreds of thousands of patients taking the drug would be a major advance on the present system of documenting reported serious adverse events during the use of the medicine in clinical practice, as this current system often obtains little or no predictive information to help subsequent patients, other than broad warnings.
Over the next few years, as we approach the ability to differentiate patients by their therapeutic responses, regulatory agencies and pharmaceutical companies will need to work together to pilot and examine methods to evaluate fewer total patients in faster, more efficient clinical trials while enhancing drug surveillance systems. Initial studies using medicine response profiles would no doubt use nested populations of patients within trials designed to meet current guidelines and regulations in order to demonstrate proof of concept.
Medicines for all The application of pharmacogenetics will not diminish the population in whom a drug is effective, but simply allow prediction of patient response rather than prolonged and expensive prescribing by trial and error. Just as it will be possible to identify patients with drug efficacy, it will also be possible to identify those patients who do not respond early in the process of drug development. The ability to target heterogeneous groups of patients for parallel drug development early, rather than waiting years for non-responsive populations to emerge after extensive clinical use of the medicine, will be a significant benefit ( Fig. 4). For example, SNP profiling of different medicine-responsive association groups during phase II trials will enable identification of the location of genes contributing to heterogeneous forms of the disease, leading to the discovery of new medicines and additional susceptibility targets.
By focusing clinical trials on patients who are most likely to respond, drug development resources could be targeted to those patients with continued unmet medical need. In particular, molecules that show less than a 30% response rate in a large population, but have clear efficacy in an identifiable smaller population of patients, would become viable as they could be readily identified for development and clinical practice.
As a result of disease heterogeneity, there may be large, definable sub-groups of patients suffering with a common phenotype, for example Alzheimer's disease, which represent only 10–15% of patients with that diagnosis. Focusing drug development on sub-groups of patients selected by either a disease-specific diagnostic or a medicine response profile will provide opportunities to develop more medicines for a larger proportion of patients with heterogeneous diseases. Similarly, patient groups who have vaguely defined phenotypes that are more difficult to categorize by objective criteria, such as depression, could be studied more efficiently using medicine response profiles as selection variables.
Value of pharmacogenetics to health-care deliveryThe cost-effectiveness of new medicines (which are the product of considerable investment in research and development) is a significant concern to patients, funding bodies and governments46, 51, 52. The application of pharmacogenetics to the delivery of medicines will maximize the value of each medicine. Medicines would be prescribed to only those patients where a high probability of efficacy without significant adverse events is expected45, 46. This is a much-preferred scenario than the problems facing funding agencies and governments at the present time. Medicines that might be prescribed to 100 patients to achieve an effect in 20 are becoming more difficult for sponsors of medical care to consider. However, selection of predicted responders offers a more efficient and economical solution to a growing problem that is leading governments and health-care providers to deny effective medicines to the few, because a proportion of patients do not respond to the treatment52. The economy of predictable efficacy, limited adverse events, lower complications owing to targeted delivery, and increased cost-effectiveness of medicines will improve health-care delivery and eliminate the need for rationing. Effective and well-tolerated medicines with predictive medicine response profiles will obviate the need for formulary restrictions on prescribing and new policies to mandate cost-effectiveness to be proved in a broad population of patients.
Pharmacogenetics will impact medical care at multiple levels. As well-tolerated and effective medicines that treat, cure or prevent common diseases become a greater proportion of the medical care bill, the costs of chronic debilitating illnesses will be significantly reduced. As treatment and prevention of chronic and common diseases improves, a significant proportion of money saved by reducing hospitalization and long-term care costs could be transferred to well-tolerated and effective medicines.
Understanding the differences in 'genetic testing'The term 'genetic testing' is currently used indiscriminately to refer to very different applications of genetic science. It has entered into common vocabulary with very little specificity surrounding the wide diversity included in this shorthand term. Figure 5 illustrates some of the differences in using the term 'genetic testing'. Until now, government-sponsored committees convened to address 'genetic testing' have generally limited their definition and their reports to concerns regarding diseases caused by single-gene mutations. For example, the US National Institutes of Health Task Force on Genetic Testing and the SACGT (Secretary's Advisory Committee on Genetic Testing), its successor, have dealt mainly with mutational genetics and the need for government oversight in this area. While this objective has considerable merit, it represents only part of the spectrum of 'genetics tests'. Unfortunately, subsequent references to the Task Force
conclusions, particularly by ethics commentators, have broadened the limited scope of the Task Force report53. Quite distinct differences in recommendations for patients and relatives of patients with complex diseases are frequently miss-stated with authority by authors whose only experience is in mutational diseases53, 54.
Figure 5 'Genetic testing' needs to be defined carefully. Full legend High resolution image and legend (56k)
Another class of 'genetic tests' is related to pharmacogenetics, including polymorphic detoxifying enzymes, drug-receptor variants or other inherited polymorphic traits that are not diagnostic of disease29-31, 55. In fact, when terms such as 'genetic testing' are applied, differentiation between tests that are specific to disease genes and profiles that are specific to genes involved in drug metabolism are often not well appreciated. Greater specificity of language is required to differentiate tests for disease genes from profiles for non-disease genes. Similarly, distinctions exist between non-disease gene polymorphisms associated with metabolic and drug-target characteristics and extended genomic profiles (for example, abbreviated SNP linkage disequilibrium profiles or medicine response profiles) that simply describe the phenotypic response (efficacy or adverse events) in response to a medicine.
Specificity of language use can be clarified in a hypothetical example. Assume that a 62-year-old man presents with symptoms of dementia that, after a thorough evaluation for other causes of dementia, is diagnosed as 'probable Alzheimer's disease'. If that patient carried an APP717 mutation or an ApoE4/4 homozygous genotype, the probability of accurate diagnosis of Alzheimer's disease, defined by subsequent autopsy neuropathologic confirmation, goes from 60–70% at clinical diagnosis to >97%56, 57. Both are disease-specific diagnostic 'genetic tests' and both provide predictive value in a symptomatic patient, although the APP717 mutation is generally (but incorrectly) interpreted as being 100% predictive before symptoms begin. It should be noted that there are only two dozen families carrying autosomal dominant APP mutations associated with early-onset Alzheimer's disease. Most of these families segregate the APP717 mutation. Thus there are less than 100 known APP717 individuals carrying the APP717 mutation. There are, however, three asymptomatic individuals who are at least one, or two, standard deviations over the mean age of onset for APP717 mutations. All carry the ApoE2/3 genotype. To date, no patient with the APP717 mutation who developed clinical Alzheimer's disease has carried the ApoE2/3 (or ApoE2/2) genotype. ApoE2/3 seems to protect from the APP717 mutation. Thus, genetic counselling predictions made from measuring the APP717 allele should not be made without also considering concomitant ApoE genotyping. These data and their significance have been either unknown to or perhaps unappreciated by 'ethics' commentators. APP717 provides predictive information before any symptoms because it is very rare and disease begins in the 40–60-year age range17, 58. Carrying two ApoE4 alleles does not predict Alzheimer's disease, only an increased susceptibility for the development
of the disease as a function of age compared with other ApoE genotypes. Both are examples of disease gene-specific tests with very different implications for asymptomatic individuals, family members and societal risks of medical-care burden (Fig. 5).
Assume that a hypothetical drug exists for Alzheimer's disease that has two properties. The first is that the half-life of the drug in people varies as a function of a cytochrome P450 drug metabolizing polymorphism. The second property is a greater probability of efficacy in patients with a particular pharmacogenetic profile, that is, there is an abbreviated SNP profile using a panel of 400 SNPs from a map of 200,000 SNPs. 'Genetic testing' using the abbreviated SNP profile could select this particular drug for this patient, whereas a P450 'genetic test' might indicate a higher or more frequent dosing schedule. Neither provides any information about Alzheimer's disease. Neither provides any significant negative collateral information to relatives about Alzheimer's disease. Neither profile has the same ethical implications as measuring a mendelian mutation (APP717) or disease-specific susceptibility genotype (ApoE4/4). However, all of these are referred to as 'genetic tests'.
The abbreviated SNP linkage disequilibrium profiles will predict patients' responses to medicines, but they will not specifically 'test' the patient for the presence or absence of a disease gene-specific mutation, nor will they provide any other significant disease-specific predictive information about the patient or family members. For practical purposes they would be anonymous laboratory profiles providing a read-out of predicted efficacy and adverse events. Medicine response profiles will simply measure phenotypic responses to a medicine based on a pattern of inherited factors detected as small regions of linkage disequilibrium. Thus, 'genetic' methods would be used to differentiate those patients who experience good efficacy and lower significant adverse events in response to a medicine from other patients who fail to respond or develop serious adverse events. The genetics of response to the medicine will be the only data generated using an abbreviated SNP linkage disequilibrium profile and, practically, could be easily designed, edited and safeguarded to be totally meaningless with respect to any known disease-specific gene information.
Traditional genetic counselling regarding education about disease inheritance would be of little value to an individual or a relative because no predictive information about disease risk is identified in the SNP linkage disequilibrium profile. Thus, as a practical matter, ethical and legal considerations of disease-specific gene tests, drug target or metabolic gene profiles, and abbreviated SNP linkage disequilibrium profiles for drug response deserve to be considered independently. As the scientific base shifts over the next decade from rare mutational to common diseases affecting millions of people, the rules governing 'genetic testing' should accurately reflect these distinctions. It is therefore incumbent that medical guidelines for mendelian- or susceptibility-gene testing do not extend automatically to discussions of other types of genetically based profiles in pharmacogenetics. Clear language and differentiation of respective ethical, legal and societal issues are required to prevent inaccurate vernacular usage creating a confused public perception of 'genetic testing'.
1. Curran, M. E. Potassium ion channels and human disease: phenotypes to drug targets? Curr. Opin. Biotechnol. 9, 565-572 (1998). | PubMed | ISI |
2. Marton, M. J. et al. Drug target validation and identification of secondary drug target effects using DNA microarrays. Nature Med. 4, 1293-1301 (1998). | Article | PubMed | ISI |
3. Wiley, S. R. Genomics in the real world. Curr. Pharmaceut. Des. 4, 417-422 (1998). | ISI |4. Blackstock, W. P. & Weir, M. P. Proteomics: quantitative and physical mapping of cellular
proteins. Trends Biotechnol. 17, 121-127 (1999). | Article | PubMed | ISI |5. Kozian, D. H. & Kirschbaum, B. J. Comparative gene-expression analysis. Trends Biotechnol.
17, 73-78 (1999). | Article | PubMed | ISI |6. Rockett, J. C., Esdaile, D. J. & Gibson, G. G. Differential gene expression in drug metabolism
and toxicology: practicalities, problems and potential. Xenobiotica 29, 655-691 (1999). | Article | PubMed | ISI |
7. Roses, A. D. Apolipoprotein E affects the rate of Alzheimer disease expression: beta-amyloid burden is a secondary consequence dependent on APOE genotype and duration of disease. J. Neuropathol. Exp. Neurol. 53, 429-437 (1994). | PubMed | ISI |
8. Saunders, A. M. Apolipoprotein E and Alzheimer's disease: an update on genetic and functional analyses. J. Neuropathol. Exp. Neurol. (in the press).
9. Boschert, U., Merlo-Pich, E., Higgins, G., Roses, A. D. & Catsicas, S. Apolipoprotein E expression by neurons surviving excitotoxic stress. Neurobiol. Dis. 6, 508-514 (1999). | Article | PubMed | ISI |
10. Xu, P. T. et al. Human apolipoprotein E2, E3 and E4 isoform-specific transgenic mice: human-like pattern of neuronal immunoreactivity in central nervous system not observed in wild type mice. Neurobiol. Dis. 3, 229-245 (1996). | Article | PubMed | ISI |
11. Xu, P. T. et al. Regionally specific neuronal expression of human APOE gene in transgenic mice. Neurosci. Lett. 246, 65-68 (1998). | Article | PubMed | ISI |
12. Xu, P. T. et al. Specific regional transcription of apolipoprotein E in human brain neurons. Am. J. Pathol. 154, 601-611 (1999). | PubMed | ISI |
13. Huang, J. T. et al. Interleukin-4-dependent production of PPAR- ligands in macrophages by 12/15-lipoxygenase. Nature 400, 378-382 (1999). | Article | PubMed | ISI |
14. Kliewer, S. A. Lehmann, J. M. & Wilson, T. M. Orphan nuclear receptors: shifting endocrinology into reverse. Science 284, 757-760 (1999). | Article | PubMed | ISI |
15. Barroso, I. et al. Dominant negative mutations in human PPAR associated with severe insulin resistance, diabetes mellitus and hypertension. Nature 402, 880-883 (1999). | Article | PubMed | ISI |
16. Roses, A. D. Apolipoprotein E alleles as risk factors in Alzheimer's disease. Annu. Rev. Med. 47, 387-400 (1996). | PubMed | ISI |
17. Goate, A. et al. Segregation of a missense mutation in the amyloid precursor protein gene with familial Alzheimer's disease. Nature 349, 704-706 (1991). | PubMed | ISI |
18. Levy-Lehad, E. et al. Candidate gene for the chromosome 1 familial Alzheimer's disease locus. Science 269, 973-977 (1995). | PubMed | ISI |
19. Sherrington, R. et al. Cloning of a gene bearing missense mutations in early-onset familial Alzheimer's disease. Nature 375, 754-760 (1995). | PubMed | ISI |
20. Van Nostrand, W. E., Wagner, S. L., Haan, J., Bakker, E. & Roos, R. A. Alzheimer's disease and hereditary cerebral hemorrhage with amyloidosis-Dutch type share a decrease in cerebrospinal fluid levels of amyloid beta-protein precursor. Ann. Neurol. 32, 215-218 (1992). | PubMed |
21. Aitman, T. J. & Todd, J. A. Molecular genetics of diabetes mellitus. Baillieres Clin. Endocrinol. Metabol. 9, 631-656 (1995). | ISI |
22. Sandford, A., Weir, T. & Pare, P. The genetics of asthma. . Am. J. Respir. Crit. Care Med. 153, 1749-1765 (1996). | PubMed | ISI |
23. Schork, N. J. Genetics of complex disease: approaches, problems, and solutions. Am. J. Respir. Crit. Care Med. 156, S103-S109 (1997). | PubMed | ISI |
24. Concannon, P. et al. A second-generation screen of the human genome for susceptibility to insulin-dependent diabetes mellitus. Nature Genet. 19, 292-296 (1998). | Article | PubMed | ISI |
25. Howard, T. D. et al. Genetics of allergy and bronchial hyperresponsiveness. Clin. Exp. Allergy 29(Suppl.), 86-89 (1999). | PubMed | ISI |
26. Talley, N. J. Irritable bowel syndrome: disease definition and symptom description. Eur. J. Surg. 583(Suppl.), 24-28 (1998).
27. Paterson, W. G. et al. Recommendations for the management of irritable bowel syndrome in family practice. IBS Consensus Conference Participants. Can. Med. Assoc. J. 161, 154-160 (1999). | ISI |
28. Hamm, L. R. et al. Additional investigations fail to alter the diagnosis of irritable bowel syndrome in subjects fulfilling the Rome criteria. Am. J. Gastroenterol. 94, 1279-1282 (1999). | PubMed | ISI |
29. Evans W. E. & Relling, M. V. Pharmacogenomics: translating functional genomics into rational therapeutics. Science 286, 487-491 (1999). | Article | PubMed | ISI |
30. Meyer, U. A. & Zanger, U. M. Molecular mechanisms of genetic polymorphisms of drug metabolism. Annu. Rev. Pharmacol. Toxicol. 37, 269-296 (1997). | PubMed | ISI |
31. Cohen, L. J. & DeVane, C. L. Clinical Implications of antidepressant pharmacokinetics and pharmacogenetics. Ann. Pharmacotherapy 3, 1471-1480 (1996).
32. Rudorfer, M. V., Lane, E. A., Chang, W. H., Zhang, M. & Potter, W. Z. Desipramine pharmacokinetics in Chinese and Caucasian volunteers. Br. J. Clin. Pharmacol. 17, 433-440 (1984). | PubMed | ISI |
33. Mueller, R. F. & Young, I. D. in Emery's Elements of Medical Genetics (ed. Kalow, W.) 169-175 (Churchill Livingstone, Edinburgh, 1997).
34. Zhao, L. P., Aragaki, C., Hsu, L. & Quiaoit, F. Mapping of complex traits by single-nucleotide polymorphisms. Am. J. Hum. Genet. 63, 225-240 (1998). | Article | PubMed | ISI |
35. Brookes, A. J. The essence of SNPs. Gene 234, 177-186 (1999). | Article | PubMed | ISI |36. Hacia, J. G. et al. Determination of ancestral alleles for human single-nucleotide polymorphisms
37. Marez, D. et al. Polymorphism of the cytochrome P450 CYP2D6 gene in a European population: characterization of 48 mutations and 53 alleles, their frequencies and evolution. Pharmacogenetics 7, 193-202 (1997). | PubMed | ISI |
38. McKusick, V. A. Foreword to Mendelian Inheritance in Man 10th edn, vol. 1, xv-xxxvii (The Johns Hopkins University Press, Baltimore, 1992).
39. Lai, E., Riley, J., Purvis, I. & Roses, A. A 4-Mb high-density single nucleotide polymorphism-based map around human APOE. Genomics 54, 31-38 (1998). | Article | PubMed | ISI |
40. Martin, E. R. et al. Analysis of association at single nucleotide polymorphisms in the APOE region. Genomics 63, 7-12 (2000). | Article | PubMed | ISI |
41. Kruglyak, L. Prospects for whole-genome linkage disequilibrium mapping of common disease genes. Nature Genet. 22, 139-144 (1999). | Article | PubMed | ISI |
42. Collins, A., Lonjou, C. & Morton, N. E. Genetic epidemiology of single-nucleotide polymorphisms. Proc. Natl Acad. Sci. USA. 96, 15173-15177 (1999). | Article | PubMed | ISI |
43. Ott, J. Predicting the range of linkage disequilibrium. Proc. Natl Acad. Sci. USA. 97, 2-3 (2000). | Article | PubMed | ISI |
44. Chen, J. et al. Microsphere-based assay for single-nucleotide polymorphism analysis using single base chain extension. Genome Res. 10, 549-557 (2000). | Article | PubMed | ISI |
45. Roses, A. D., Manasco, P. & Freeman, A. J. Pharmacogenetics and genetics to discover new medicines. J. Comm. Biotech. (in the press).
46. Roses, A. D. Pharmacogenetics and the future of drug development and delivery. Lancet 355, 1358-1361 (2000). | Article | PubMed | ISI |
47. Alon, U. et al. Broad patterns of gene expression revealed by clustering analysis of tumor and normal colon tissues probed by oligonucleotide arrays. Proc. Natl Acad. Sci. USA 96, 6745-6750 (1999). | Article | PubMed | ISI |
48. Bonnie, A., Fijal, M. S., Hall, J. M. & Witte, J. S. Clinical trials in the genomic era. Effects of protective genotypes on sample size and duration of trial 2000. Controlled Clin. Trials 21, 7-20
(2000). | PubMed |49. Lazarou, J., Pomeranz, B. H. & Corey, P. N. Incidence of adverse drug reactions in hospitalized
patients: a meta-analysis of prospective studies. J. Am. Med. Assoc. 279, 1200-1205 (1998). | ISI |
50. Wood, A. J., Stein, C. M. & Woosley, R. Making medicines safer--the need for an independent drug safety board. N. Engl. J. Med. 339, 1851-1854 (1998). | PubMed | ISI |
51. White, J. Targets and systems of health care cost control. J. Health Politics Policy Law 24, 653-696 (1999). | ISI |
52. Mather, D. B., Sullivan, S. D., Augustein, D., Fullerton, P. & Atherton, D. Incorporating clinical outcomes and economic consequences into drug formulary decision: a practical approach. Am. J. Man. Care 5, 277-285 (1999). | ISI |
53. McConnell, L. M. B. et al. Genetic testing and Alzheimer disease: recommendations of the Stanford Program in Genomics, Ethics, and Society. Genetic Testing 3, 3-12 (1999). | PubMed | ISI |
54. Koenig, B. A., Greely, H. T., McConnell, L. M., Silveberg, H. L. & Raffin, T. A. Genetic testing for BRCA1 and BRCA2: recommendations of the Stanford Program in Genomics, Ethics, and Society. Breast Cancer Working Group. J. Womens Health 7, 531-545 (1998). | PubMed | ISI |
55. Taningher, M., Malacarne, D., Izzotti, A., Ugolini, D. & Parodi, S. Drug metabolism polymorphisms as modulators of cancer susceptibility. Mutation Res. 436, 227-261 (1999). | PubMed | ISI |
56. Saunders, A. M. et al. Specificity, sensitivity, and predictive value of apolipoprotein-E genotyping for sporadic Alzheimer's disease. Lancet 348, 90-93 (1996). | Article | PubMed | ISI |
57. Mayeux, R., et al. Utility of the apolipoprotein E genotype in the diagnosis of Alzheimer's disease. Alzheimer's disease Centers Consortium on Apolipoprotein E and Alzheimer's disease. N. Engl. J. Med. 338, 506-511 (1998). [Published erratum appears in N. Engl. J. Med. 338, 1325 (1998).] | ISI |
58. Roses, A. D. Genetic testing for Alzheimer disease. Practical and ethical issues. Arch. Neurol. 54, 1226-1229 (1997). | PubMed | ISI |
59. Roses, A. D. Apolipoprotein E is a relevant susceptibility gene that affects the rate of expression of Alzheimer's disease. Neurobiol. Aging 15(Suppl 2), S165-S167 (1994). | PubMed | ISI |
Acknowledgements. I acknowledge my colleagues at Glaxo Wellcome in the development of the strategies outlined in this review; in particular, the vision and support of J. Niedel and the commitment of the Glaxo Wellcome R&D Executive Committee — A. Baxter, T. Eaves, A. Hennah and J. Palmer — in using their wealth of experience to help make this vision become a reality. I also thank the Genetics Directorate at Glaxo Wellcome for their expertise and continued hard work. Some of the recent pre-publication work carried out by Glaxo Wellcome scientists is reviewed in this paper. I especially thank A. Freeman, A. Saunders and A. Kidgell for expert editorial assistance
Figure 1 Genetics and genomics to identify drug targets. Two general strategies are used to identify genes and find new targets for drugs: genetics and genomics. Each approach shares technologies, like functional genomics, but as a part of different experimental designs. Genetics identifies disease-related susceptibility genes and genomics identifies genes that belong to similar families based on their sequence homologies. The goal of most genomic strategies is to collect genes that may be expressed and used for high-throughput screening targets. Any one of the identified genes may or may not have a connection to any disease process, with a high probability that it does not. Focused uses of functional genomic technologies include, for example, study of lines of transgenic mice that differ only in the specific polymorphisms defined in the susceptibility gene that relates to disease expression in humans. Understanding isoform-specific metabolic functions can lead to the identification of new metabolic targets for drug screening. Screening use of functional genomic technologies are used to imply validation for targets derived from discovery genomics, such as higher gene expression in a tissue of a subset of genes or the expression of protein observed in disease tissues but not seen in comparable tissue from controls.
Figure 2 Significance of SNP allele frequency differences in an affected Alzheimer's disease population and age-matched controls. a, The association data for dozens of ordered SNPs from a region of 2 million bases on either side of ApoE. When the allele frequencies of each SNP are compared in large series of Alzheimer's disease patients and controls, a sharp peak of several SNPs can be readily observed in linkage disequilibrium, with no significant difference in the frequencies of background alleles. (From ref. 45; published with permission.) b, If the peak is enlarged to illustrate a region of only 60,000 bases around ApoE, three SNPs from the map that are each highly significantly associated with Alzheimer's disease can be identified. Only two genes, ApoC1 and ApoE, are coded in the
physical DNA segment defined by the SNPs associated with Alzheimer's disease. The association data from the SNP defining the ApoE4 polymorphism, known to be associated with earlier onset of disease, is also illustrated. Not illustrated is the lack of association of another defined ApoE polymorphism, that for ApoE2. ApoE2 is associated with protection, or later onset of the phenotype of Alzheimer's disease. Although ApoE2 is in linkage disequilibrium with ApoE4 , there is no association with the disease7, 59. Thus whereas SNPs may be in linkage disequilibrium, as are those for ApoE2 and ApoE4, the association with Alzheimer's disease is found only for several SNPs in linkage disequilibrium with ApoE4 and Alzheimer's disease. It is the presence of these SNPs that allow rapid recognition of the region within which ApoE4 is located. (From ref. 45; published with permission.)
Figure 3 Linkage disequilibrium data for 12 adjacent SNPs that are located and ordered within the 120-kilobase region encoding a migraine susceptibility gene (in this instance, a D' value above 0.30 is indicative of highly significant linkage disequilibrium). Five of these 12 SNPs also demonstrated significant association with migraine, illustrating the use of linkage disequilibrium mapping to identify disease-associated polymorphisms.
Figure 4 The development of a pharmacogenetic medicine response profile. An abbreviated SNP profile to predict efficacy could be identified in phase II clinical trials by detecting those SNPs along the genome that are in linkage disequilibrium when patients with efficacy are compared with patients who did not respond to the drug candidate. An abbreviated profile of these small regions of linkage disequilibrium that differentiate efficacy can then be used to select patients for larger phase III studies. This could make many of these phase III studies smaller and therefore more efficient. Pharmacogenetics could also be used during the initial post-marketing surveillance period to identify SNP markers associated with serious but rare adverse events. These markers could be added to the SNP markers for efficacy and common adverse events identified during development to produce a comprehensive medicine response profile, and to identify which patients respond to the drug and which patients will be at high risk for an adverse event
Figure 5 'Genetic testing' needs to be defined carefully. The magnitude of the ethical, legal and social implications of genetic testing is dependent on the information derived from the test. Genetic tests for mutations in single genes that are causally related to rare diseases and are inherited in a simple mendelian fashion can have profound implications for the individual and family members. Genetic tests for disease-susceptibility gene polymorphisms — which are risk factors for the disease — have the added complication of uncertainty. In both cases the lack of effective intervention drives many of the issues. Pharmacogenetic profiles, on the other hand, will predict if an individual patient is likely to benefit from a medicine and be free of serious side effects. These profiles will not be designed to provide any other information, as the profile data are derived from the patients who respond with efficacy or adverse event when taking the drug, compared with patients who did not respond. It does not differentiate disease. Should a polymorphism that is found to be related to disease association be included in a profile, it can be removed and replaced by another SNP that is in linkage disequilibrium, thus avoiding any disease-specific association, even if inadvertent. This would be similar to replacing the ApoE4 SNP by one or more of the others in linkage disequilibrium with ApoE4 but not specifically associated with Alzheimer's disease. The ethical, legal and social implications of pharmacogenetic profiles are therefore of a lower magnitude of societal concern compared with specific genetic tests for disease. (From ref. 46; published with permission.)
In mid-2000, at the beginning of a new century, no topic could be more appropriate for Nature Insight than functional genomics. Of all the scientific disciplines, none will have a greater influence on the future of drug discovery than genomics, and none will change medicine more profoundly.
Exactly one hundred years have passed since the genetic rules of Gregor Mendel, originally published in 1865, were rediscovered in the reports of the German Botanic Society, their significance having initially been overlooked. In 1900 Mendel's findings flourished in a fertile environment of scientific curiosity, which laid the foundations for the subsequent genetic revolution of the 20th century.
At the height of this century, the world was struck by Watson's and Crick's discovery of the DNA structure and its ramifications:"It has not escaped our notice that the specific pairings we have postulated immediately suggest a possible copying mechanism for the genetic material", they concluded in an article published in "Nature" announcing the news to the world. Along with the digital revolution, the genetic revolution has already radically changed the face of science and propelled mankind forward towards its roots, while biology is being transformed more and more into an information science.
Sequencing the human genetic information is a task that has now almost been completed. The speed at which this has been achieved goes beyond all expectations of just 12 years ago. It has taken us into the entrance hall of the library of life, whose still largely incomprehensible volumes contain the three billion letters of our genetic make-up, now waiting to be joined together into meaningful words, sentences, paragraphs and chapters. With the resulting instructions we shall be able to make life on earth more worthwhile.
Such a vast decoding task makes deciphering the hieroglyphics look like child's play. To accomplish this task, we all need to combine the urge for scientific knowledge with an unprecedented responsibility for life and its preservation. This library of life affects the subjective life of us all to a greater extent than any scientific factors have ever done in the past. If we use it wisely, we shall have a unique opportunity to ensure the sustainable development of life on Earth.
"Our challenge is Life" is the motto that governs our actions here at Aventis. Functional genomics (http://www.aventis.com) - together with a wide array of enabling technologies - plays a central part in meeting this challenge, and we, as a leading life sciences company, are supporting it with all available resources. We hope the results achieved in the near future will help millions of patients throughout the world by healing conditions for which there has so far been no adequate treatment, if any at all.
Frank L. DouglasExecutive Vice PresidentHead of Drug Innovation & Approval