Pascual-Marqui RD, Esslen M, Kochi K, Lehmann D: Functional imaging with low resolution brain electromagnetic tomography (LORETA): review, new comparisons, and new validation. Japanese Journal of Clinical Neurophysiology 30:81-94, 2002. Authors' version. Page 1 of 19 Functional imaging with low resolution brain electromagnetic tomography (LORETA): review, new comparisons, and new validation R.D. Pascual-Marqui, M. Esslen, K. Kochi, D. Lehmann The KEY Institute for Brain-Mind Research, University Hospital of Psychiatry, Zurich, Switzerland Corresponding author: Roberto D. Pascual-Marqui The KEY Institute for Brain-Mind Research University Hospital of Psychiatry Lenggstr. 31, CH-8029 Zurich, Switzerland Tel.:+41-1-3884934 Fax:+41-1-3803043 e-mail: [email protected]http://www.keyinst.unizh.ch/loreta.htm Abstract This paper provides a review of several recent publications that have successfully used the functional brain imaging method known as LORETA. Special emphasis is given to: (1) the electrophysiological and neuroanatomical basis of the method, (2) the localization and spatial blurring properties of the method, (3) the experimental validation of the method with real human data, and (4) its limitations. Papers that criticize LORETA are briefly discussed. Two new results are presented. Firstly, LORETA is compared with a recently published tomography (Dale et al., Neuron 26:55-67, 2000), in terms of localization and spatial blurring properties. The results demonstrate by far, that LORETA is the method of choice, especially when the measurements are contaminated with noise. For the sake of reproducible research, all the material (data, program code, and executables) used in the comparative study is available upon request to the corresponding author. The second result consists of the analysis of a face perception event related potential experiment. LORETA was used to test for significant activation in the first 500 milliseconds after stimulus onset. High time resolution activation signals can be computed with this new statistical procedure. Activation of Brodmann areas (BA) 17/18 and of the right fusiform gyrus (BA 37, the “face processing” area) was demonstrated. These results provide further validation for LORETA. Keywords Functional imaging, LORETA, electric neuronal activity, brain mapping, face perception.
Transcript
Pascual-Marqui RD, Esslen M, Kochi K, Lehmann D: Functional imaging with low resolution brain electromagnetic tomography (LORETA): review, new comparisons, and new validation. Japanese Journal of Clinical Neurophysiology 30:81-94, 2002. Authors' version.
Page 1 of 19
Functional imaging with low resolution brain electromagnetic tomography (LORETA): review, new comparisons, and new validation
R.D. Pascual-Marqui, M. Esslen, K. Kochi, D. Lehmann The KEY Institute for Brain-Mind Research, University Hospital of Psychiatry,
Zurich, Switzerland Corresponding author: Roberto D. Pascual-Marqui The KEY Institute for Brain-Mind Research University Hospital of Psychiatry Lenggstr. 31, CH-8029 Zurich, Switzerland Tel.:+41-1-3884934 Fax:+41-1-3803043 e-mail: [email protected] http://www.keyinst.unizh.ch/loreta.htm
Abstract This paper provides a review of several recent publications that have successfully
used the functional brain imaging method known as LORETA. Special emphasis is given to: (1) the electrophysiological and neuroanatomical basis of the method, (2) the localization and spatial blurring properties of the method, (3) the experimental validation of the method with real human data, and (4) its limitations. Papers that criticize LORETA are briefly discussed. Two new results are presented. Firstly, LORETA is compared with a recently published tomography (Dale et al., Neuron 26:55-67, 2000), in terms of localization and spatial blurring properties. The results demonstrate by far, that LORETA is the method of choice, especially when the measurements are contaminated with noise. For the sake of reproducible research, all the material (data, program code, and executables) used in the comparative study is available upon request to the corresponding author. The second result consists of the analysis of a face perception event related potential experiment. LORETA was used to test for significant activation in the first 500 milliseconds after stimulus onset. High time resolution activation signals can be computed with this new statistical procedure. Activation of Brodmann areas (BA) 17/18 and of the right fusiform gyrus (BA 37, the “face processing” area) was demonstrated. These results provide further validation for LORETA.
Keywords Functional imaging, LORETA, electric neuronal activity, brain mapping, face
perception.
Reference: Pascual-Marqui RD, Esslen M, Kochi K, Lehmann D: Functional imaging with low resolution brain electromagnetic tomography (LORETA): review, new comparisons, and new validation. Japanese Journal of Clinical Neurophysiology 30:81-94, 2002
Page 2 of 19
Introduction Currently, the most often used methods for functional imaging of the human brain
are positron emission tomography (PET) and functional magnetic resonance imaging (fMRI) (Toga and Mazziotta 1996). These tomographies provide three-dimensional (3D) images comprising information on metabolism. Although the spatial resolution of these images is indeed excellent, the temporal resolution is not high enough to keep up with the speed at which neuronal processes occur. For instance, in a fundamental study by Logothetis et al. (2001), it was shown that the time course of the fMRI haemodynamic response was roughly a low pass filtered (i.e., low time resolution) version of the electric neuronal activity.
More recently, a growing number of studies have been published that make use of
functional imaging methods based on the electroencephalogram (EEG) and the magnetoencephalogram (MEG). For a recent extensive review of electromagnetic imaging methods, see Baillet et al. (2001).
It may seem paradoxical that although the human EEG was first reported in 1929
(Berger), the recently developed PET and fMRI methods have preceded the use of electromagnetic tomographies. This is due to a fundamental limitation of extracranial EEG/MEG measurements: they do not contain sufficient information on the three-dimensional (3D) distribution of electric neuronal activity. Over 140 years ago, Helmholtz (1853) reported the general non-uniqueness of the solution to this type of electromagnetic inverse problem. It implies that EEG/MEG measurements (even with an infinite number of sensors) can be explained by many different distributions of generators. Naturally, one may ask: which solution corresponds to reality? The answer, in general, is that it cannot be determined.
The curse of non-uniqueness (Pascual-Marqui and Biscay-Lirio 1993) may therefore
seem to render hopeless the task of developing an electromagnetic tomography. Fortunately, this is not the case. The EEG and the MEG are not due to capricious distributions of electric neuronal generators. Rather, they obey certain electrophysiological and neuroanatomical constraints, that when plugged into the laws of electrodynamics, offer at least an approximate solution to the inverse problem.
It is now widely accepted that extracranial measurements of EEG and MEG are
generated by cortical pyramidal neurons undergoing post-synaptic potentials (PSPs). These neurons are oriented perpendicular to the cortical surface. The magnitude of experimentally recorded extracranial signals, at any given time instant, is due to the spatial summation of the impressed current density induced by highly synchronized PSPs occurring in large clusters of neurons. According to calculations reviewed by Hämäläinen et al. (1993), a typical cluster size must cover at least 40 to 200 mm2 of cortical surface.
All these facts are reviewed in general in (Martin 1991, Dale et al. 2000, Baillet et
al. 2001). In addition, independent experimental evidence demonstrating high synchronization of neighboring neurons can be found in (Llinas 1988, Haalman and Vaadia 1997, Sukov and Barth, 1998).
Reference: Pascual-Marqui RD, Esslen M, Kochi K, Lehmann D: Functional imaging with low resolution brain electromagnetic tomography (LORETA): review, new comparisons, and new validation. Japanese Journal of Clinical Neurophysiology 30:81-94, 2002
Page 3 of 19
Low resolution brain electromagnetic tomography (LORETA) (Pascual-Marqui et al. 1994, Pascual-Marqui 1999) is a functional imaging method based on the electrophysiological and neuroanatomical constraints previously described. For instance, the cortex can be modeled as a collection of volume elements (voxels) in the digitized Talairach atlas provided by the Brain Imaging Center, Montreal Neurological Institute. In this case, the LORETA inverse solution (which is consistent with the EEG/MEG measurements) corresponds to the 3D distribution of electric neuronal activity that has maximum similarity (i.e., maximum synchronization), in terms of orientation and strength, between neighboring neuronal populations (represented by adjacent voxels). In another example, the cortical surface can be modeled as a collection of surface elements with known orientation. LORETA can accommodate this neuroanatomical constraint, and find the inverse solution that maximizes only the synchronization of strength between neighboring neuronal populations.
The consistency of LORETA with physiology is not the only reason for favoring it
above so many other published inverse solutions. The most important criterion for choosing a neuroimaging method is that it must be capable of correct localization, since this is the purpose of functional mapping. For instance, consider a method that views the planet earth from afar, and then produces a map that localizes Mount Fuji on the South Pole. Such a method is worthless, as compared to a method that is capable of localizing Mount Fuji to within 100 Km of its actual position.
In a previous review paper that compared all published linear, distributed inverse
solutions (Pascual-Marqui 1999), it was shown that only LORETA was capable of correct localization (to within 1 voxel resolution in the average), whereas all other methods were especially incapable of localizing deep sources.
An additional essential criterion for choosing an inverse solution is its validation
with experimental data under conditions where the sources are known a priori. For instance, inverse methods can be tested with event related potentials (ERPs) obtained under visual or auditory stimulation.
The empirical validity of LORETA has been established under diverse physiological
conditions. Lavric et al. (2001a, 2001b) describe LORETA activation of language areas in an ERP study comparing cognitive mechanisms of regular and irregular past-tense production. Waberski et al. (2001) find LORETA activation of the auditory cortex in a mismatch-negativity (MMN) experiment. In a P300 experiment comparing normal subjects with schizophrenic patients, Winterer et al. (2001) found P300 LORETA activation in most of the areas reported by independent studies that used intracortical recordings. In a visual ERP study under hemifield stimulation, Steger et al. (2001) found LORETA activation transfer from contra- (P1a) to ipsilateral (P1b) visual cortices.
Other ERP-type studies providing validation for LORETA, and that also report new
findings in cognitive processing, are: 1. Using visual stimulation and finding activation of visual cortices: Khateb et al. (2000,
2001), Hirota et al. (2001), Van Leeuwen et al. (1998), Strik et al. (1998), Pegna et al. (1997).
2. Using auditory stimulation and finding activation of auditory cortices: Mulert et al. (2001), Anderer et al. (1998a, 1998b).
Reference: Pascual-Marqui RD, Esslen M, Kochi K, Lehmann D: Functional imaging with low resolution brain electromagnetic tomography (LORETA): review, new comparisons, and new validation. Japanese Journal of Clinical Neurophysiology 30:81-94, 2002
Page 4 of 19
3. Using motor and visuo-motor tasks and finding activation of visual and motor cortices: Thut et al. (2000, 1999).
4. Using visual stimulation with faces and finding activation of face processing cortices: Pizzagalli et al. (2000).
LORETA has also been validated in the analysis of epilepsy-related data:
1. Worrell et al. (2000) localized epileptic foci in patients with MRI lesions. 2. Seeck et al. (1998) found the generators of epileptogenic discharges confirmed by fMRI
and subdural recordings. 3. Lantz et al. (1997) found activation of interictal epileptiform activity confirmed with
intracranial recordings. LORETA can also be used to find the generators of EEG frequency components. A
detailed description of the methods used in this approach can be found in (Frei et al. 2001, Gomez and Thatcher 2001, Pascual-Marqui et al. 1999). Several studies that provide validation for EEG-based LORETA analysis are the following: 1. In agreement with independent PET studies that implicated the rostral anterior
cingulate in depression, Pizzagalli et al. (2001) found that the theta frequency band generator in the same region is a predictor for treatment response in depression.
2. Anderer et al. (2000) found that buspirone-induced activation of EEG generators is in agreement with the localization reported in independent PET studies.
3. Dierks et al. (2000) found correlation between the localization of LORETA EEG generators and PET images in Alzheimer's disease.
Other studies that use LORETA and report new findings are:
1. Frei et al. (2001) and Gamma et al. (2000): drug (MDMA) effect study on EEG generators.
2. Connemann et al. (2001): case study of alpha-delta sleep generators in different sleep stages.
3. Jausovec and Jausovec (2001): P300 generators related to IQ. 4. Isotani et al. (2001): EEG generators of hypnotically induced anxiety and relaxation. 5. Prabhu et al. (2001): P300 generators in female alcoholics. 6. Koles et al. (2001): EEG generators during verbal and spatial cognitive tasks. 7. Kounios et al. (2001): evidence demonstrating different neural substrates for the
encoding of fusion and juxtaposition concept associations. 8. Anderer et al. 2001: evidence for two distinct sleep spindle generators, one in prefrontal
cortex (Brodmann areas 9 and 10) oscillating with a frequency below 13 Hz, and the other in precuneus (Brodmann area 7) oscillating with a frequency above 13 Hz.
9. Pascual-Marqui et al. (1999): comparison of EEG generators of schizophrenic patients with normal subjects.
10. Wang et al. (1999): generators involved in selective attention based on forms defined by motion.
11. Brandeis et al. (1998): evidence showing that “stop” failures in children with attention deficits occur during posterior activation, which may be related to the orienting of attention, preceding and partly determining inhibitory control problems in ADD.
12. Anderer et al. (1998c): drug effect study on P300 generators in age-associated memory impairment.
In some applications, when the actual generator is known to be very well
approximated by an active point (i.e., the single dipole), LORETA images might be too
Reference: Pascual-Marqui RD, Esslen M, Kochi K, Lehmann D: Functional imaging with low resolution brain electromagnetic tomography (LORETA): review, new comparisons, and new validation. Japanese Journal of Clinical Neurophysiology 30:81-94, 2002
Page 5 of 19
blurred, and dipole fitting methods or non-linear tomographies would certainly be preferred (Leder et al. 2001, Fuchs et al. 1999).
Other studies have criticized LORETA:
1. In the opinion of Menendez and Andino (2000), the localization property of LORETA, shared by no other linear, distributed inverse solution, is of no value in source localization. In addition, these authors show that for some test sources, LORETA has a localization error of two or three voxels, a fact that was already reported, and not omitted, in (Pascual-Marqui 1995, 1999).
2. In the opinion of Kincses et al. (1999), the electrophysiological and neuroanatomical constraints used by LORETA are arbitrary, and have no physiological meaning.
3. In a simulation experiment that makes use of a capricious source distribution, Michel et al. (1999) apply LORETA with the purpose of demonstrating that it cannot localize correctly.
4. Based on a theoretical lemma, De Peralta-Menendez and Gonzalez-Andino (1998) state that LORETA is incapable of localizing sources on the boundary of the solution space. However, Pascual-Marqui (1999) demonstrated the falsehood of the statement, and demonstrated that those authors had been systematically criticizing LORETA based on an incorrectly programmed algorithm of their own making.
In this paper, we present further experimental results supporting the validity of
LORETA. Moreover, we perform a fair and rigorous comparison of LORETA with a newly published imaging method developed by Dale et al. (2000), and we demonstrate that LORETA has smaller errors of localization and lower spatial dispersion (better resolution) than the method of Dale et al. All material related to the comparative study is available upon request to the corresponding author (R.D. Pascual-Marqui).
Material and Methods
Functional imaging of electric neuronal activity For comparative purposes, three different electromagnetic tomographies will be
used: LORETA (Pascual-Marqui 1999), the minimum norm tomography (Hämäläinen and Ilmoniemi 1984), and the Dale et al. (2000) tomography. All the technical details on the physics, mathematics, and implementations, can be found in the quoted references. It should be noted, however, that whereas LORETA and the minimum norm solution produce estimates of current density (electric neuronal activity), the method of Dale et al. (2000) gives a statistical estimate of the current density. Regardless of this difference, the images produced by all three tomographies are interpreted in the same fashion, i.e., localization is determined by the coordinates of the maxima (“hotspots”). It should also be noted that since there is no a priori knowledge of where the hotspots should be, all these tomographies are implemented without favoring any particular brain area. This means that all brain regions have the same probability (or weight) of containing a hotspot.
When dealing with data that contains noise, the LORETA and minimum norm
tomographies are computed with regularization. The amount of regularization is estimated by minimizing the generalized cross-validation error (see Pascual-Marqui 1999, “reply to comments”, for technical details). The Dale et al. (2000, see equation 7 therein)
Reference: Pascual-Marqui RD, Esslen M, Kochi K, Lehmann D: Functional imaging with low resolution brain electromagnetic tomography (LORETA): review, new comparisons, and new validation. Japanese Journal of Clinical Neurophysiology 30:81-94, 2002
Page 6 of 19
tomography uses explicitly in its calculations the noise variance, which must be known a priori. For data without noise, the Dale equations were used in their limiting form, when the noise variance tends to zero (without reaching zero).
The head models In the analysis of experimental data such as the ERP to visual presentation of
faces, the head model consisted of a three-shell sphere (Ary et al. 1981) registered to the Talairach human brain atlas (Talairach and Tournoux 1988), available as a digitized MRI from the Brain Imaging Centre, Montreal Neurological Institute. Registration between spherical and realistic head geometry was based on the EEG electrode coordinates reported by Towle et al. (1993). The solution space (the three-dimensional space where the inverse EEG problem was solved) was restricted to the cortical grey matter and hippocampus, as determined by the corresponding digitized Probability Atlas also provided by Montreal Neurological Institute. A voxel was labeled as grey matter if it satisfied three conditions: its probability of being grey matter was higher than that of being white matter, its probability of being grey matter was higher than that of being cerebrospinal fluid, and its probability of being grey matter was higher than 33%. Under these neuroanatomical constraints, the solution space resulted in 2394 voxels at 7mm spatial resolution.
For the full characterization of the localization and resolution properties of an
inverse solution, the three-shell unit radius sphere was used as the head model. The measurement space consisted of 148 electrodes on the scalp surface, and the solution space consisted of 818 grid points (voxels) corresponding to a 3D regular cubic grid with minimum inter-point distance d=0.133, confined to a maximum radius of 0.8, with vertical coordinate values Z≥-0.4. This model was used previously by Pascual-Marqui (1999) for the comparison of five different published linear, distributed inverse solutions.
Experimental part 17 right-handed, informed volunteers (seven male, ten female; mean age 31.9 years,
SD=11.5 years) took part in the study. All subjects were healthy, with no personal history of neurological or psychiatric illness, no drug or alcohol abuse, no current medication and normal or corrected-to-normal vision. All subjects gave written consent to their participation. The study was approved by the ethics committee of the University Hospital.
Pictures of neutral facial affect (Ekman and Friesen 1975) were presented on a 15-
inch computer screen. Subjects were seated at a distance of 1.1m from the screen. All images were corrected to equal total luminosity. Each face was shown on-screen for 500ms, followed by 500ms with a blank (black) screen. Presentation consisted of 10 blocks, each one comprising 30 randomly ordered faces, with a 1-minute pause between blocks.
During visual stimulation, scalp electric potentials were recorded from 25
electrodes (sampling rate 1000 Hz, 300 Hz low-pass filter cut-off, time constant of 10 seconds, electrode impedance < 5 kΩ). Recordings were on-line down-sampled to 256 Hz, and finally stored. Electrode positions corresponded to the standard 19 sites of the international 10/20 system, plus FC1, FC2, CP1, CP2, PO3, and PO4. Recordings were
Reference: Pascual-Marqui RD, Esslen M, Kochi K, Lehmann D: Functional imaging with low resolution brain electromagnetic tomography (LORETA): review, new comparisons, and new validation. Japanese Journal of Clinical Neurophysiology 30:81-94, 2002
Page 7 of 19
performed in an electromagnetic- and sound-shielded chamber, with dimmed lights. After recording, artifact free post-stimulus EEG-Epochs of 1-second duration were selected by means of visual inspection, and filtered from 1.5 - 30 Hz. Finally, for each subject, average evoked potentials were computed.
Theoretical simulation part A full characterization of the localization and resolution properties of a linear,
distributed inverse solution can be obtained by testing its response to point sources, located anywhere in the solution space. This procedure was used by Pascual-Marqui (1995, 1999) for comparing several different tomographies. More recently, it was used by Dale et al. (2000) in the characterization of their new tomography, allowing them to claim that their method had low localization error and high resolution as compared to the minimum norm method.
This procedure will be used in this paper for the comparison of LORETA, the
minimum norm tomography, and the Dale et al. (2000) tomography. A brief description of the method follows. (A) Place a point source (dipole) in the
solution space and compute the electric potentials on the 148 scalp electrodes, using the three-shell unit radius sphere model. (B) Feed the scalp measurements to the tomographic method and compute the 3D current density image. (C) Find the maximum in the image and compute the localization error as the distance to actual position of the point source. (D) Compute the spatial dispersion of the current density magnitude in the image, centered at the position of the actual point source (and not at the image’s maximum). These four steps are repeated three times (for the X, Y, and Z orientation of the test-dipole), at each voxel in the solution space, giving a total of 3x818=2454 tests.
The measure of spatial dispersion used in the present study is the same as
described in Pascual-Marqui (1995). It corresponds to the spatial standard deviation for the 3D distribution of current density magnitude. This differs from the spatial dispersion definition used by Dale et al. (2000), which is related to half-width at half-height. Regardless of this difference, both definitions are closely related, and as long as the same measure is applied to different tomographies, the comparison is valid, fair, and rigorous.
The following points deserve emphasis:
1. This whole procedure for testing the properties of a tomography is justified because of the principles of linearity and superposition. 2. However, even if a tomography passes this test successfully (i.e., that it produces a blurred image of any point source with correctly localized maximum), it does not prove that it will localize any arbitrary-capricious source distribution. 3. Nevertheless, low localization error and low spatial dispersion, in the sense defined here, constitute a minimum necessary condition to be satisfied by any tomography. In other words: an inverse solution is worthless as a tomography if it does not comply with this minimum necessary condition.
Reference: Pascual-Marqui RD, Esslen M, Kochi K, Lehmann D: Functional imaging with low resolution brain electromagnetic tomography (LORETA): review, new comparisons, and new validation. Japanese Journal of Clinical Neurophysiology 30:81-94, 2002
Page 8 of 19
Statistical methods of analysis The direct visual inspection of a single tomographic image of current density
(electric neuronal activity) does not necessarily reveal the brain areas directly involved in information processing. A rigorous method must be used to establish a threshold value that helps in deciding statistical significance of the current density magnitude. The method used in this paper is known as statistical nonparametric mapping (SnPM). An excellent tutorial was recently published by Nichols and Holmes (2002).
SnPM is applied to the analysis of the experimental data from the ERP experiment,
where it is of interest to find when and where in the brain is face perception taking place. Since there are 17 subjects, and each ERP consists of 128 time frames (analysis is limited to the first 500ms after stimulus onset), the total number of tomographic images is 17x128=2176. Each image in Talairach space consists of three numbers at each voxel (dipole moment strength in the X, Y, and Z orientations), giving a total of 3x2394=7182 variables. For each variable, and for each time frame, a simple t-test for zero-mean is performed, which gives a total of 7182x128=919296 t-tests. The fact that a t-statistic is used for testing activation does not justify the use of the univariate t-distribution threshold for deciding significance. There are two main reasons for this: firstly, multiple comparisons based on nearly one million variables do not correspond to a univariate Student’s t-distribution, and secondly, if the current density does not have a normal Gaussian distribution, then the t-statistic does not have a Student’s t-distribution.
The SnPM method solves all these problems: it estimates the probability
distribution by means of the randomization procedure, it corrects for multiple comparisons, and it has the highest possible statistical power (Nichols and Holmes 2002).
Results and discussion
Comparison of localization properties of LORETA, minimum norm, and the Dale tomography
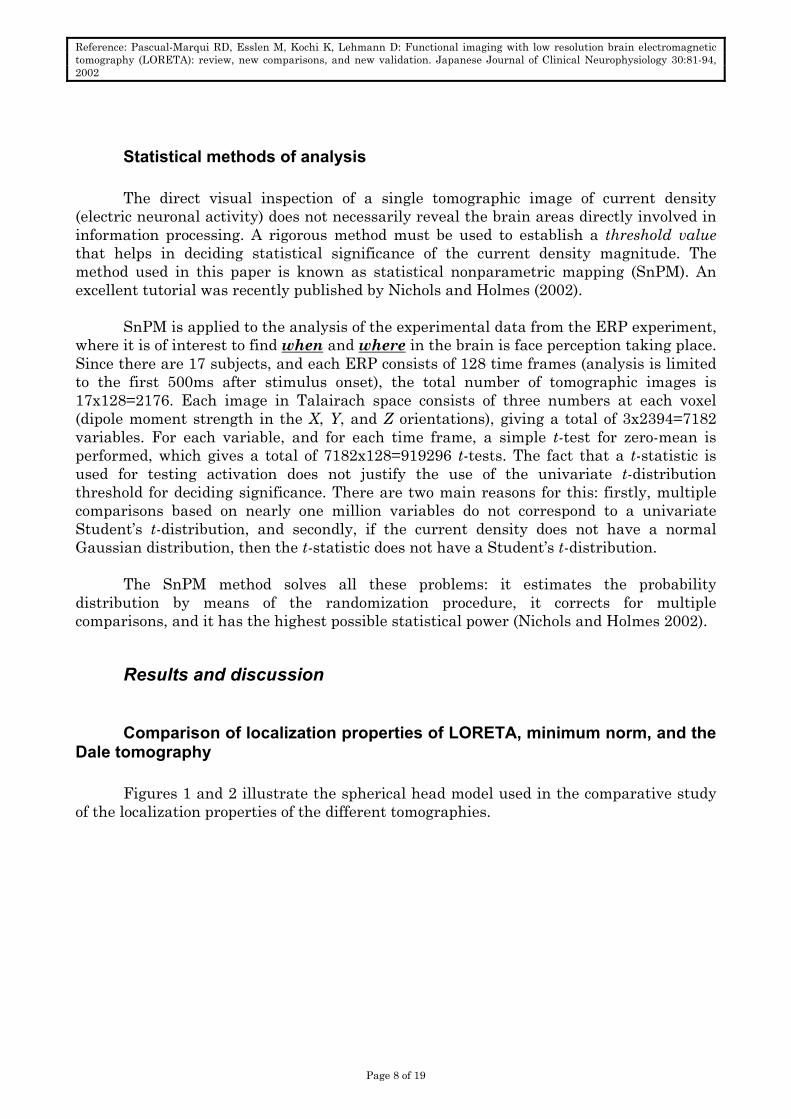
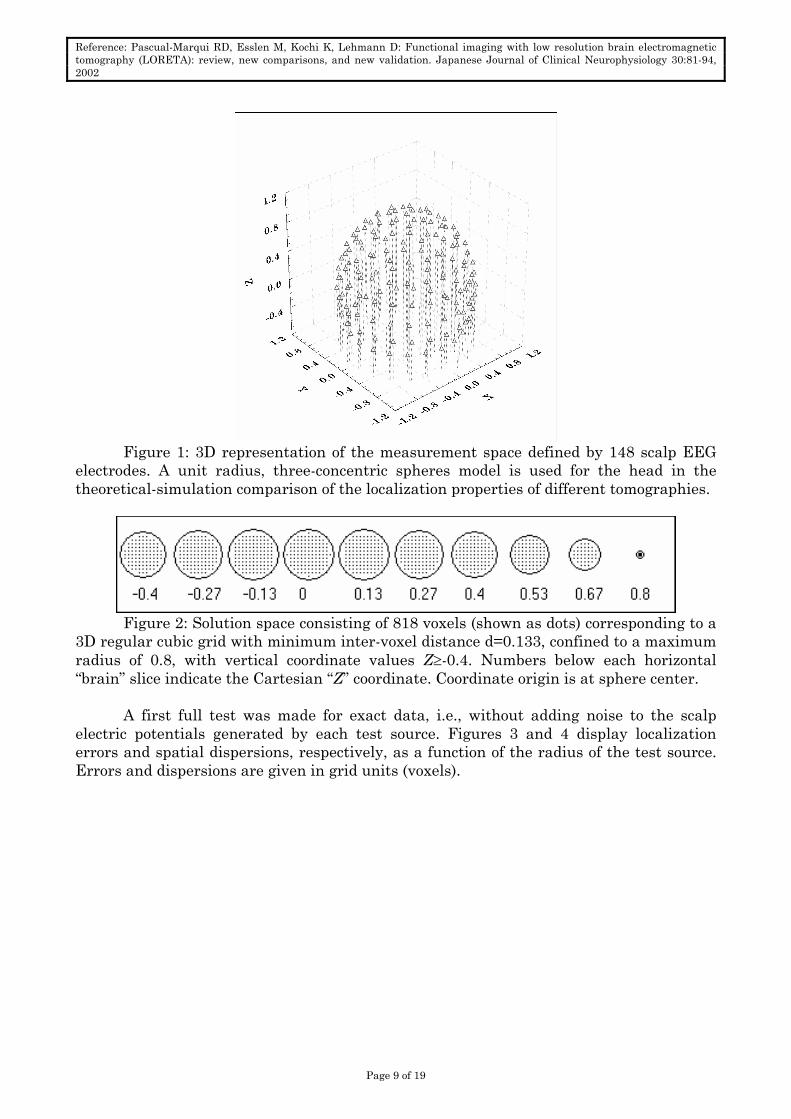
Figures 1 and 2 illustrate the spherical head model used in the comparative study
of the localization properties of the different tomographies.
Reference: Pascual-Marqui RD, Esslen M, Kochi K, Lehmann D: Functional imaging with low resolution brain electromagnetic tomography (LORETA): review, new comparisons, and new validation. Japanese Journal of Clinical Neurophysiology 30:81-94, 2002
Page 9 of 19
Figure 1: 3D representation of the measurement space defined by 148 scalp EEG
electrodes. A unit radius, three-concentric spheres model is used for the head in the theoretical-simulation comparison of the localization properties of different tomographies.
Figure 2: Solution space consisting of 818 voxels (shown as dots) corresponding to a
3D regular cubic grid with minimum inter-voxel distance d=0.133, confined to a maximum radius of 0.8, with vertical coordinate values Z≥-0.4. Numbers below each horizontal “brain” slice indicate the Cartesian “Z” coordinate. Coordinate origin is at sphere center.
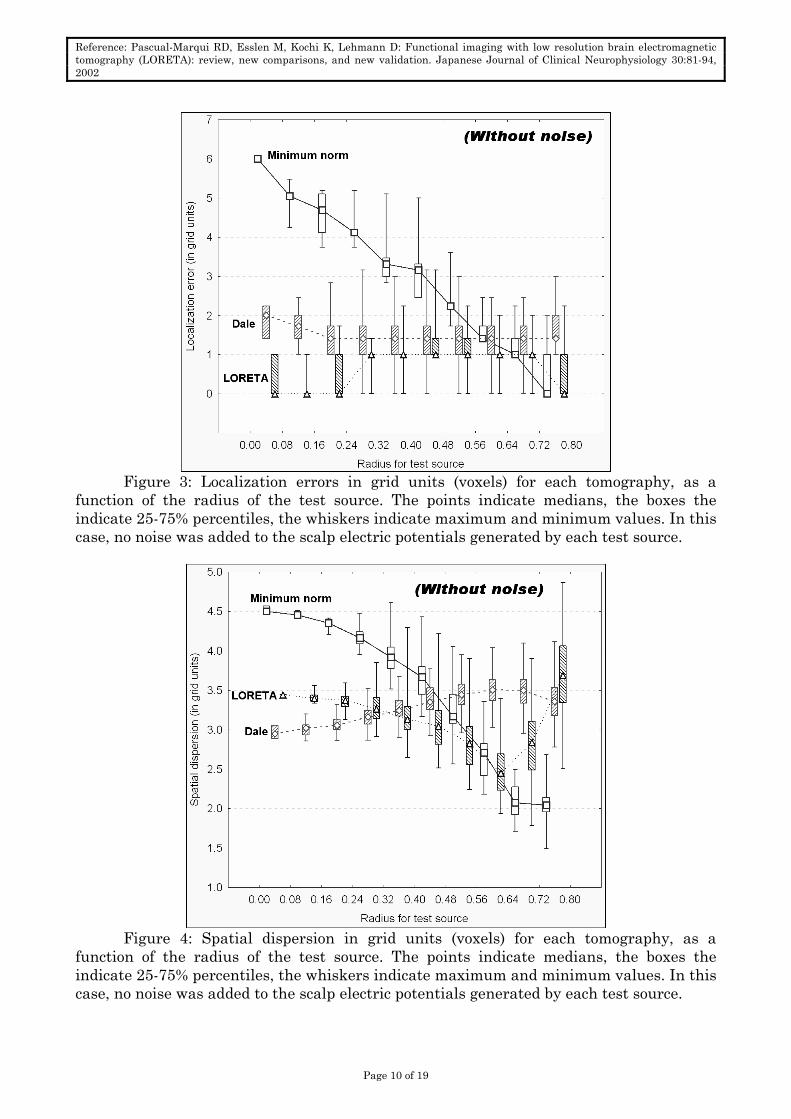
A first full test was made for exact data, i.e., without adding noise to the scalp
electric potentials generated by each test source. Figures 3 and 4 display localization errors and spatial dispersions, respectively, as a function of the radius of the test source. Errors and dispersions are given in grid units (voxels).
Reference: Pascual-Marqui RD, Esslen M, Kochi K, Lehmann D: Functional imaging with low resolution brain electromagnetic tomography (LORETA): review, new comparisons, and new validation. Japanese Journal of Clinical Neurophysiology 30:81-94, 2002
Page 10 of 19
Figure 3: Localization errors in grid units (voxels) for each tomography, as a
function of the radius of the test source. The points indicate medians, the boxes the indicate 25-75% percentiles, the whiskers indicate maximum and minimum values. In this case, no noise was added to the scalp electric potentials generated by each test source.
Figure 4: Spatial dispersion in grid units (voxels) for each tomography, as a
function of the radius of the test source. The points indicate medians, the boxes the indicate 25-75% percentiles, the whiskers indicate maximum and minimum values. In this case, no noise was added to the scalp electric potentials generated by each test source.
Reference: Pascual-Marqui RD, Esslen M, Kochi K, Lehmann D: Functional imaging with low resolution brain electromagnetic tomography (LORETA): review, new comparisons, and new validation. Japanese Journal of Clinical Neurophysiology 30:81-94, 2002
Page 11 of 19
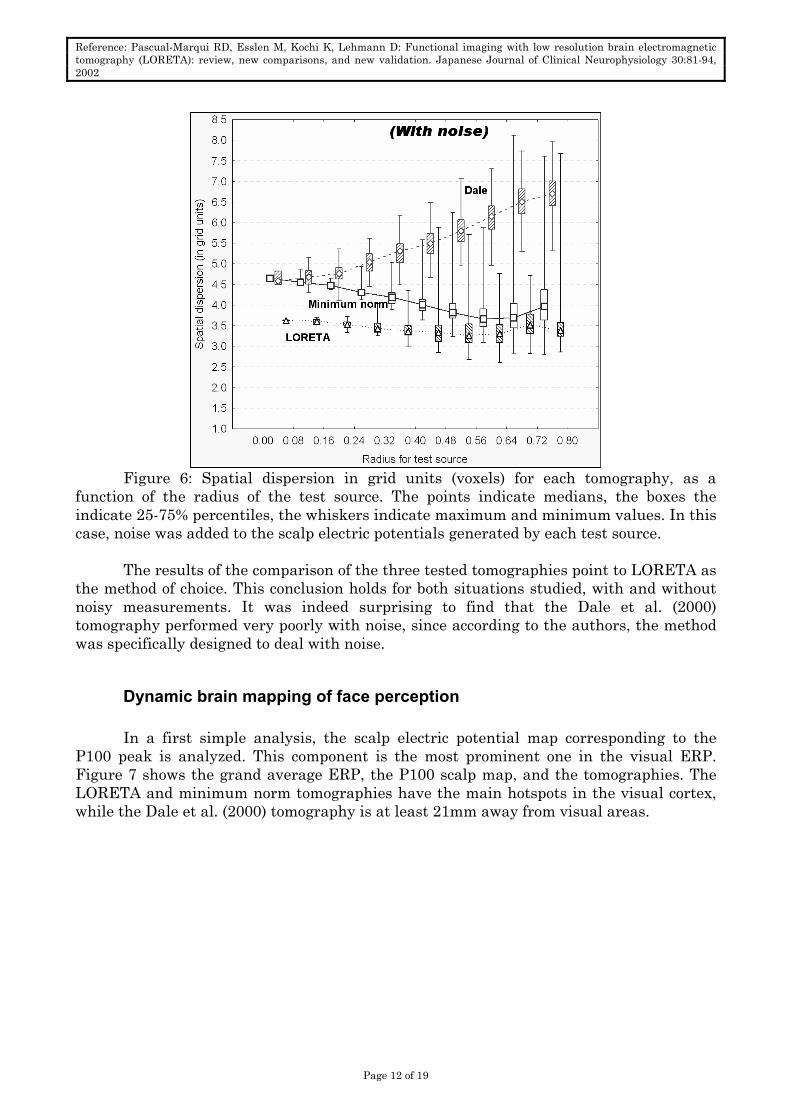
In a second test, random noise was added to the scalp electric potentials generated by each test source in the following way. Let SDmin denote the minimum among all standard deviations of the scalp electric potential maps (based on 148 electrodes) produced by the test sources. Random scalp maps, consisting of 148 uniformly distributed pseudo-random numbers in the interval ±1 were generated, and scaled to achieve a standard deviation equal to one-tenth of SDmin. The random maps were then added to the exact scalp maps for each test source, and given to each tomography. Figures 5 and 6 display localization errors and spatial dispersions, respectively, under the “noise-in-measurements” condition.
The Dale errors and spatial dispersions were significantly larger than those of
LORETA, when compared with the paired t-test and with Wilcoxon’s nonparametric test.
Figure 5: Localization errors in grid units (voxels) for each tomography, as a
function of the radius of the test source. The points indicate medians, the boxes the indicate 25-75% percentiles, the whiskers indicate maximum and minimum values. In this case, noise was added to the scalp electric potentials generated by each test source.
Reference: Pascual-Marqui RD, Esslen M, Kochi K, Lehmann D: Functional imaging with low resolution brain electromagnetic tomography (LORETA): review, new comparisons, and new validation. Japanese Journal of Clinical Neurophysiology 30:81-94, 2002
Page 12 of 19
Figure 6: Spatial dispersion in grid units (voxels) for each tomography, as a
function of the radius of the test source. The points indicate medians, the boxes the indicate 25-75% percentiles, the whiskers indicate maximum and minimum values. In this case, noise was added to the scalp electric potentials generated by each test source.
The results of the comparison of the three tested tomographies point to LORETA as
the method of choice. This conclusion holds for both situations studied, with and without noisy measurements. It was indeed surprising to find that the Dale et al. (2000) tomography performed very poorly with noise, since according to the authors, the method was specifically designed to deal with noise.
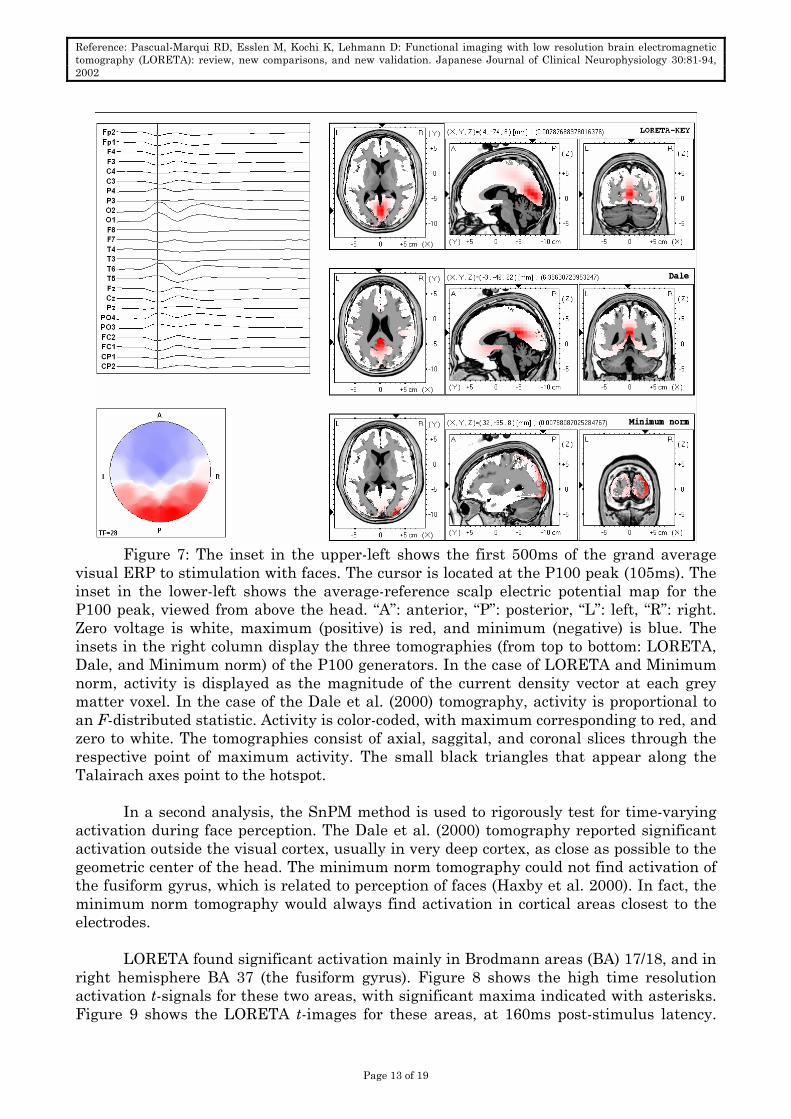
Dynamic brain mapping of face perception In a first simple analysis, the scalp electric potential map corresponding to the
P100 peak is analyzed. This component is the most prominent one in the visual ERP. Figure 7 shows the grand average ERP, the P100 scalp map, and the tomographies. The LORETA and minimum norm tomographies have the main hotspots in the visual cortex, while the Dale et al. (2000) tomography is at least 21mm away from visual areas.
Reference: Pascual-Marqui RD, Esslen M, Kochi K, Lehmann D: Functional imaging with low resolution brain electromagnetic tomography (LORETA): review, new comparisons, and new validation. Japanese Journal of Clinical Neurophysiology 30:81-94, 2002
Page 13 of 19
Figure 7: The inset in the upper-left shows the first 500ms of the grand average
visual ERP to stimulation with faces. The cursor is located at the P100 peak (105ms). The inset in the lower-left shows the average-reference scalp electric potential map for the P100 peak, viewed from above the head. “A”: anterior, “P”: posterior, “L”: left, “R”: right. Zero voltage is white, maximum (positive) is red, and minimum (negative) is blue. The insets in the right column display the three tomographies (from top to bottom: LORETA, Dale, and Minimum norm) of the P100 generators. In the case of LORETA and Minimum norm, activity is displayed as the magnitude of the current density vector at each grey matter voxel. In the case of the Dale et al. (2000) tomography, activity is proportional to an F-distributed statistic. Activity is color-coded, with maximum corresponding to red, and zero to white. The tomographies consist of axial, saggital, and coronal slices through the respective point of maximum activity. The small black triangles that appear along the Talairach axes point to the hotspot.
In a second analysis, the SnPM method is used to rigorously test for time-varying
activation during face perception. The Dale et al. (2000) tomography reported significant activation outside the visual cortex, usually in very deep cortex, as close as possible to the geometric center of the head. The minimum norm tomography could not find activation of the fusiform gyrus, which is related to perception of faces (Haxby et al. 2000). In fact, the minimum norm tomography would always find activation in cortical areas closest to the electrodes.
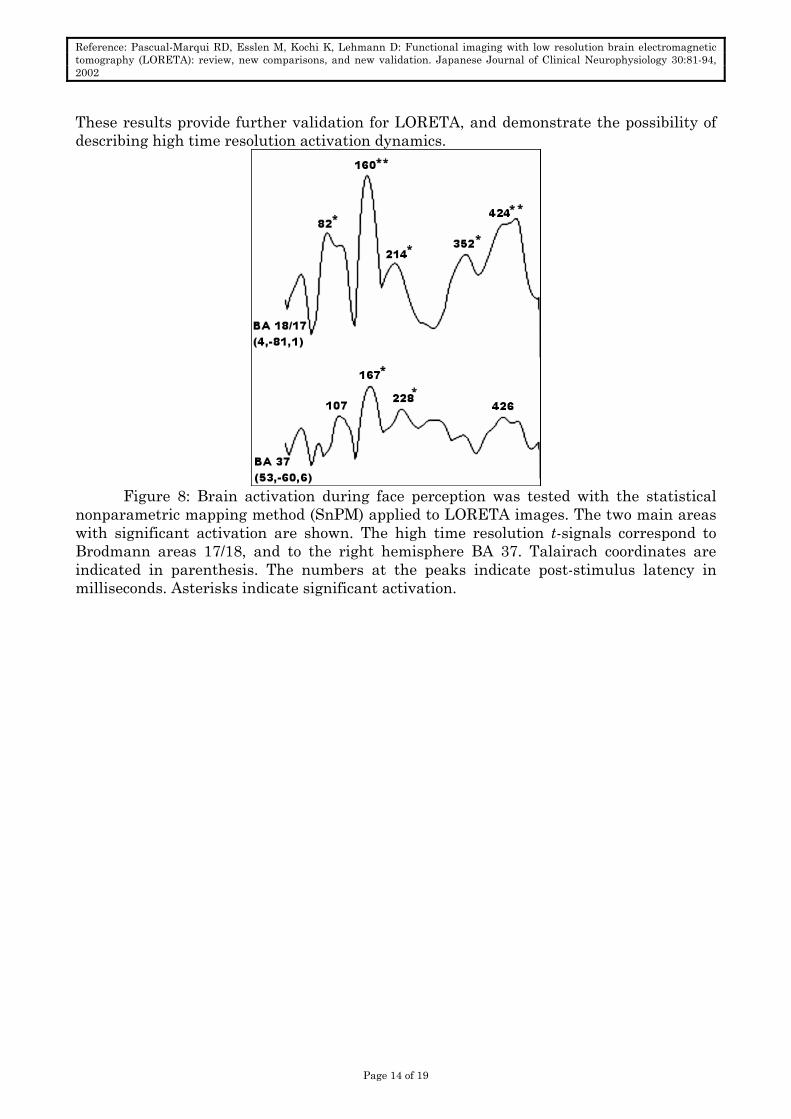
LORETA found significant activation mainly in Brodmann areas (BA) 17/18, and in
right hemisphere BA 37 (the fusiform gyrus). Figure 8 shows the high time resolution activation t-signals for these two areas, with significant maxima indicated with asterisks. Figure 9 shows the LORETA t-images for these areas, at 160ms post-stimulus latency.
Reference: Pascual-Marqui RD, Esslen M, Kochi K, Lehmann D: Functional imaging with low resolution brain electromagnetic tomography (LORETA): review, new comparisons, and new validation. Japanese Journal of Clinical Neurophysiology 30:81-94, 2002
Page 14 of 19
These results provide further validation for LORETA, and demonstrate the possibility of describing high time resolution activation dynamics.
Figure 8: Brain activation during face perception was tested with the statistical
nonparametric mapping method (SnPM) applied to LORETA images. The two main areas with significant activation are shown. The high time resolution t-signals correspond to Brodmann areas 17/18, and to the right hemisphere BA 37. Talairach coordinates are indicated in parenthesis. The numbers at the peaks indicate post-stimulus latency in milliseconds. Asterisks indicate significant activation.
Reference: Pascual-Marqui RD, Esslen M, Kochi K, Lehmann D: Functional imaging with low resolution brain electromagnetic tomography (LORETA): review, new comparisons, and new validation. Japanese Journal of Clinical Neurophysiology 30:81-94, 2002
Page 15 of 19
Figure 9: LORETA images of t-statistics derived from tests of activation during face
perception. Images correspond to 160ms post stimulus latency. Significant activation was found in BAs 17/18 (upper figure), and in right fusiform gyrus (lower figure). The small black triangles that appear along the Talairach axes point to the hotspot, shown in red. “A”: anterior, “P”: posterior, “L”: left, “R”: right.
References
1) Anderer P, Klosch G, Gruber G, Trenker E, Pascual-Marqui RD, Zeitlhofer J, Barbanoj MJ, Rappelsberger P, Saletu B: Low-resolution brain electromagnetic tomography revealed simultaneously active frontal and parietal sleep spindle sources in the human cortex. Neuroscience 103: 581-592, 2001.
2) Anderer P, Pascual-Marqui RD, Semlitsch HV, Saletu B: Electrical sources of P300 event-related brain potentials revealed by low resolution electromagnetic tomography .1. Effects of normal aging. Neuropsychobiology 37: 20-27, 1998a.
3) Anderer P, Pascual-Marqui RD, Semlitsch HV, Saletu B: Differential effects of normal aging on sources of standard N1, target N1 and target P300 auditory event-related brain potentials revealed by low resolution electromagnetic tomography (LORETA). Evoked Potentials-Electroencephalography and Clinical Neurophysiology 108: 160-174, 1998b.
4) Anderer P, Saletu B, Pascual-Marqui RD: Effect of the 5-HT1a partial agonist buspirone on regional brain electrical activity in man: a functional neuroimaging study using low-resolution electromagnetic tomography (LORETA). Psychiatry Research-Neuroimaging 100: 81-96, 2000.
Reference: Pascual-Marqui RD, Esslen M, Kochi K, Lehmann D: Functional imaging with low resolution brain electromagnetic tomography (LORETA): review, new comparisons, and new validation. Japanese Journal of Clinical Neurophysiology 30:81-94, 2002
Page 16 of 19
tomography .2. Effects of nootropic therapy in age-associated memory impairment. Neuropsychobiology 37: 28-35, 1998c.
6) Ary JP, Klein SA, Fender DH: Location of sources of evoked scalp potentials: corrections for skull and scalp thickness. IEEE Trans. Biomed. Eng. 28: 447-452, 1981.
8) Berger H: Über das Elektroencephalogramm des Menschen. Archiv für Psychiatrie und Nervenkrankheit 87: 527-570, 1929.
9) Brandeis D, Van Leeuwen TH, Rubia K, Vitacco D, Steger J, Pascual-Marqui RD, Steinhausen HC: Neuroelectric mapping reveals precursor of stop failures in children with attention deficits. Behavioural Brain Research 94: 111-125, 1998.
10) Connemann BJ, Mann K, Pascual-Marqui RD, Roschke J: Limbic activity in slow wave sleep in a healthy subject with alpha-delta sleep. Psychiatry Research-Neuroimaging 107: 165-171, 2001.
11) Dale AM, Liu AK, Fischl BR, Buckner RL, Belliveau JW, Lewine JD, Halgren E: Dynamic statistical parametric mapping: combining fMRI and MEG for high-resolution imaging of cortical activity. Neuron 26: 55-67, 2000.
12) De Peralta-Menendez RG, Gonzalez-Andino SL: A critical analysis of linear inverse solutions to the neuroelectromagnetic inverse problem. IEEE Transactions on Biomedical Engineering 45: 440-448, 1998.
13) Dierks T, Jelic V, Pascual-Marqui RD, Wahlund LO, Julin P, Linden DEJ, Maurer K, Winblad B, Nordberg A: Spatial pattern of cerebral glucose metabolism (PET) correlates with localization of intracerebral EEG-generators in Alzheimer's disease. Clinical Neurophysiology 111: 1817-1824, 2000.
14) Ekman P, Friesen WV: Unmasking the face. Prentice Hall, New Jersey, 1975. 15) Frei E, Gamma A, Pascual-Marqui R, Lehmann D, Hell D, Vollenweider FX:
Localization of MDMA-induced brain activity in healthy volunteers using low resolution brain electromagnetic tomography (LORETA). Human Brain Mapping 14: 152-165, 2001.
16) Fuchs M, Wagner M, Kohler T, Wischmann HA: Linear and nonlinear current density reconstructions. Journal of Clinical Neurophysiology 16: 267-295, 1999.
17) Gamma A, Frei E, Lehmann D, Pascual-Marqui RD, Hell D, Vollenweider FX: Mood state and brain electric activity in Ecstasy users. Neuroreport 11: 157-162, 2000.
18) Gomez JF, Thatcher RW: Frequency domain equivalence between potentials and currents using LORETA. International Journal of Neuroscience 107: 161-171, 2001.
19) Haalman I, Vaadia E: Dynamics of neuronal interactions: relation to behavior, firing rates, and distance between neurons. Human Brain Mapping 5: 249-253, 1997.
20) Hämäläinen MS, Hari R, Ilmoniemi RJ, Knuutila J, Lounasmaa OV: Magnetoencephalography - theory, instrumentation, and applications to noninvasive studies of the working human brain. Rev. Mod. Phys. 65: 413–497, 1993.
21) Hämäläinen MS and Ilmoniemi RJ: Interpreting measured magnetic fields of the brain: estimates of current distributions. Technical Report TKK-F-A559, Helsinki University of Technology, 1984.
22) Haxby JV, Hoffman EA, Gobbini MI: The distributed human neural system for face perception. Trends in Cognitive Sciences 4: 223-233, 2000.
23) Helmholtz H: Ueber einige Gesetze der Vertheilung elektrischer Ströme in körperlichen Leitern, mit Anwendung auf die thierisch-elektrischen Versuche, Ann. Phys. Chem. 89: 211-233, 353-377, 1853.
Reference: Pascual-Marqui RD, Esslen M, Kochi K, Lehmann D: Functional imaging with low resolution brain electromagnetic tomography (LORETA): review, new comparisons, and new validation. Japanese Journal of Clinical Neurophysiology 30:81-94, 2002
Page 17 of 19
24) Hirota T, Yagyu T, Pascual-Marqui RD, Saito N, Kinoshita T: Spatial structure of brain electric fields during intermittent photic stimulation. Neuropsychobiology 44: 108-112, 2001.
25) Isotani T, Tanaka H, Lehmann D, Pascual-Marqui RD, Kochi K, Saitoh N, Yagyu T, Kinoshita T, Sasada K: Source localization of EEG activity during hypnotically induced anxiety and relaxation. International Journal of Psychophysiology 41: 143-153, 2001.
26) Jausovec N, Jausovec K: Differences in EEG current density related to intelligence. Cognitive Brain Research 12: 55-60, 2001.
27) Khateb A, Michel CM, Pegna, AJ, Landis T, Annoni JM: New insights into the stroop effect: a spatiotemporal analysis of electric brain activity. Neuroreport 11: 1849-1855, 2000.
28) Khateb A, Michel CM, Pegna AJ, Thut G, Landis T, Annoni JM: The time course of semantic category processing in the cerebral hemispheres: an electrophysiological study. Cognitive Brain Research 10: 251-264, 2001.
29) Kincses WE, Braun C, Kaiser S, Elbert T: Modeling extended sources of event-related potentials using anatomical and physiological constraints. Human Brain Mapping 8(4) :182-193, 1999.
30) Koles ZJ, Flor-Henry P, Lind JC: Low-resolution electrical tomography of the brain during psychometrically matched verbal and spatial cognitive tasks. Human Brain Mapping 12: 144-156, 2001.
31) Kounios J, Smith RW, Yang W, Bachman P, D'esposito M: Cognitive association formation in human memory revealed by spatiotemporal brain imaging. Neuron 29: 297-306, 2001.
32) Lantz G, Michel CM, Pascual-Marqui RD, Spinelli L, Seeck M, Seri S, Landis T, Rosen I: Extracranial localization of intracranial interictal epileptiform activity using LORETA (low resolution electromagnetic tomography). Electroencephalography and Clinical Neurophysiology 102: 414-422, 1997.
33) Lavric A, Pizzagalli D, Forstmeier S, Rippon G: Mapping dissociations in verb morphology. Trends in Cognitive Sciences 5: 301-308, 2001a.
34) Lavric A, Pizzagalli D, Forstmeier S, Rippon G: A double-dissociation of English past-tense production revealed by event-related potentials and low-resolution electromagnetic tomography (LORETA). Clinical Neurophysiology 12: 1833-1849, 2001b.
35) Leder U, Haueisen J, Pohl P, Malur FM, Heyne JP, Baier V, Figulla HR: Methods for the computational localization of atrio-ventricular pre-excitation syndromes. International Journal of Cardiac Imaging 17: 153-160, 2001.
36) Llinas RR: The intrinsic electrophysiological properties of mammalian neurons: insights into central nervous system function. Science 242: 1654-1664, 1988.
37) Logothetis NK, Pauls J, Augath M, Trinath T, Oeltermann A: Neurophysiological investigation of the basis of the fMRI signal. Nature 412: 150-157, 2001.
38) Martin JH: The collective electrical behavior of cortical neurons: The electroencephalogram and the mechanisms of epilepsy. In Kandel ER, Schwartz JH, Jessell TM (Eds.) Principles of Neural Science, Prentice Hall International, London, pp 777-791, 1991.
39) Menendez RGD, Andino SLG: Discussing the capabilities of Laplacian minimization. Brain Topography 13: 97-104, 2000.
40) Michel CM, De Peralta RG, Lantz G, Andino SG, Spinelli L, Blanke O, Landis T, Seeck M: Spatiotemporal EEG analysis and distributed source estimation in
Reference: Pascual-Marqui RD, Esslen M, Kochi K, Lehmann D: Functional imaging with low resolution brain electromagnetic tomography (LORETA): review, new comparisons, and new validation. Japanese Journal of Clinical Neurophysiology 30:81-94, 2002
Page 18 of 19
presurgical epilepsy evaluation. Journal of Clinical Neurophysiology 16: 239-266, 1999.
41) Mulert C, Gallinat J, Pascual-Marqui R, Dorn H, Frick K, Schlattmann P, Mientus S, Herrmann WM, Winterer G: Reduced event-related current density in the anterior cingulate cortex in schizophrenia. Neuroimage13: 589-600, 2001.
42) Nichols TE, Holmes AP: Nonparametric permutation tests for functional neuroimaging: a primer with examples. Human Brain Mapping, 15: 1-25, 2002.
43) Pascual-Marqui RD: Reply to comments by Hämäläinen, Ilmoniemi and Nunez. In Source Localization: Continuing Discussion of the Inverse Problem (W. Skrandies, Ed.), pp. 16-28, ISBET Newsletter No.6 (ISSN 0947-5133), 1995.
44) Pascual-Marqui RD: Review of methods for solving the EEG inverse problem. International Journal of Bioelectromagnetism 1: 75-86, 1999.
45) Pascual-Marqui RD, Biscay-Lirio R. Spatial resolution of neuronal generators based on EEG and MEG measurements. International Journal of Neuroscience. 68: 93-105, 1993.
47) Pascual-Marqui RD, Michel CM, Lehmann D: Low resolution electromagnetic tomography: a new method for localizing electrical activity in the brain. International Journal of Psychophysiology. 18: 49-65, 1994.
48) Pegna AJ, Khateb A, Spinelli L, Seeck M, Landis T, Michel CM: Unraveling the cerebral dynamics of mental imagery. Human Brain Mapping 5: 410-421, 1997.
49) Pizzagalli D, Lehmann D, Koenig T, Regard M, Pascual-Marqui RD: Face-elicited ERPs and affective attitude: brain electric microstate and tomography analyses. Clinical Neurophysiology 111: 521-531, 2000.
50) Pizzagalli D, Pascual-Marqui RD, Nitschke JB, Oakes TR, Larson CL, Abercrombie HC, Schaefer SM, Koger JV, Benca RM, Davidson RJ: Anterior cingulate activity as a predictor of degree of treatment response in major depression: evidence from brain electrical tomography analysis. American Journal of Psychiatry 158: 405-415, 2001.
51) Prabhu VR, Porjesz B, Chorlian DB, Wang KM, Stimus A, Begleiter H: Visual P3 in female alcoholics. Alcoholism-Clinical and Experimental Research 25: 531-539, 2001.
52) Seeck M, Lazeyras F, Michel CM, Blanke O, Gericke CA, Ives J, Delavelle J, Golay X, Haenggeli CA, De Tribolet N, Landis T: Non-invasive epileptic focus localization using EEG-triggered functional MRI and electromagnetic tomography. Electroencephalography and Clinical Neurophysiology 106: 508-512, 1998.
54) Strik WK, Fallgatter AJ, Brandeis D, Pascual-Marqui RD: Three-dimensional tomography of event-related potentials during response inhibition: evidence for phasic frontal lobe activation. Evoked Potentials-Electroencephalography and Clinical Neurophysiology 108: 406-413, 1998.
55) Sukov W, Barth DS: Three-dimensional analysis of spontaneous and thalamically evoked gamma oscillations in auditory cortex. J. Neurophysiol. 79: 2875–2884, 1998.
56) Talairach J, Tournoux P: Co-Planar Stereotaxic Atlas of the Human Brain: Three-Dimensional Proportional System. Georg Thieme, Stuttgart, 1988.
Reference: Pascual-Marqui RD, Esslen M, Kochi K, Lehmann D: Functional imaging with low resolution brain electromagnetic tomography (LORETA): review, new comparisons, and new validation. Japanese Journal of Clinical Neurophysiology 30:81-94, 2002
Page 19 of 19
57) Thut G, Hauert CA, Morand S, Seeck M, Landis T, Michel C: Evidence for interhemispheric motor-level transfer in a simple reaction time task: an EEG study. Experimental Brain Research 128: 256-261, 1999.
58) Thut G, Hauert CA, Viviani P, Morand S, Spinelli L, Blanke O, Landis T, Michel C: Internally driven vs. externally cued movement selection: a study on the timing of brain activity. Cognitive Brain Research 9: 261-269, 2000.
59) Toga AW, Mazziotta JC: Brain mapping: the methods. Academic Press, San Diego, 1996.
60) Towle VL, Bolanos J, Suarez D, Tan K, Grzeszczuk R, Levin DN, Cakmur R, Frank SA, Spire JP: The spatial location of EEG electrodes: locating the best-fitting sphere relative to cortical anatomy. Electroencephalogr Clin Neurophysiol 86: 1-6, 1993.
61) Van Leeuwen TH, Steinhausen HC, Overtoom CCE, Pascual-Marqui RD, Van't Klooster B, Rothenberger A, Sergeant JA, Brandeis D: The continuous performance test revisited with neuroelectric mapping: impaired orienting in children with attention deficits. Behavioural Brain Research. 94: 97-110, 1998.
62) Waberski TD, Kreitschmann-Andermahr I, Kawohl W, Darvas F, Ryang Y, Gobbele R, Buchner H: Spatio-temporal source imaging reveals subcomponents of the human auditory mismatch negativity in the cingulum and right inferior temporal gyrus. Neuroscience Letters 308: 107-110, 2001.
63) Wang J, Jin YP, Xiao F, Fan SL, Chen L: Attention-sensitive visual event-related potentials elicited by kinetic forms. Clinical Neurophysiology 110: 329-341, 1999.
64) Winterer G, Mulert C, Mientus S, Gallinat J, Schlattmann P, Dorn H, Herrmann WM: P300 and LORETA: Comparison of normal subjects and schizophrenic patients. Brain Topography 13: 299-313, 2001.
65) Worrell GA, Lagerlund TD, Sharbrough FW, Brinkmann BH, Busacker NE, Cicora KM, O'Brien TJ: Localization of the epileptic focus by low-resolution electromagnetic tomography in patients with a lesion demonstrated by MRI. Brain Topography 12: 273-282, 2000.