Open Access2008Lopez-Bigaset al.Volume 9, Issue 2, Article R33ResearchFunctional protein divergence in the evolution of Homo sapiensNuria Lopez-Bigas*, Subhajyoti De† and Sarah A Teichmann†
Addresses: *Research Unit on Biomedical Informatics, Experimental and Health Science Department, Universitat Pompeu Fabra, Dr. Aiguader, Barcelona, 08003, Spain. †MRC Laboratory of Molecular Biology, Hills Road, Cambridge CB2 2QH, UK.
Background: Protein-coding regions in a genome evolve by sequence divergence and gene gainand loss, altering the gene content of the organism. However, it is not well understood how thishas given rise to the enormous diversity of metazoa present today.
Results: To obtain a global view of human genomic evolution, we quantify the divergence ofproteins by functional category at different evolutionary distances from human.
Conclusion: This analysis highlights some general systems-level characteristics of humanevolution: regulatory processes, such as signal transducers, transcription factors and receptors,have a high degree of plasticity, while core processes, such as metabolism, transport and proteinsynthesis, are largely conserved. Additionally, this study reveals a dynamic picture of selectiveforces at short, medium and long evolutionary timescales. Certain functional categories, such as'development' and 'organogenesis', exhibit temporal patterns of sequence divergence in eukaryotesrelative to human. This framework for a grammar of human evolution supports previouslypostulated theories of robustness and evolvability.
BackgroundThough it is known that coding regions evolve primarily bysequence divergence of individual genes and gene gain andloss, altering the gene content of the organism, it is not wellunderstood how these processes have resulted in the tremen-dous diversity of metazoa present today. Have metazoansevolved through a process of incremental changes occurringevenly across genes from different functional categories, or isthere a pattern by which some classes of gene function accu-mulate mutations quickly, while others remain conservedthroughout evolution across different branches of the speciestree?
The differential rate of evolution of proteins has been of long-standing interest. As early as 1971, Dickerson [1] studied therelationship between the number of amino acid differencesand divergence time for cytochrome c, hemoglobins, andfibrinopeptide. In 1978, Dayhoff et al. [2] studied the rates ofamino acid substitutions per amino acid site in various pro-teins, finding that histones are among the most conservedproteins while hormones and immunoglobulins evolve thefastest.
The recent availability of full genome sequences has allowedlarge scale comparisons of gene sequences between organ-isms, that is, chicken and human [3], human and mouse [4]or human, fugu, Drosophila and Caenorhabditis elegans [5].
Purifying selection on mutations has been related to anumber of aspects of protein structure and function, such asthe number of interaction partners, expression levels, dispen-sability, and the character and interface of protein-proteincomplexes amongst others (reviewed in [6]). Recent studieshave focused on sequence divergence between humans andother primates, and on the sequence diversity within humanpopulations in the form of single nucleotide polymorphisms[7-13]. Another approach to quantifying evolutionary diver-gence at the genome level is to measure gene gains and lossesbetween species by identifying orthologs between pairs oforganisms [14]. Other studies have analyzed specific func-tional gene sets in particular groups of organisms. For exam-ple, Babu et al. [15] reported high variability in prokaryotictranscription factor repertoires in contrast to the conserva-tion of their target genes in prokaryotes. Coulson andOuzounis [16] reported that eukaryotic transcriptional regu-lator families are primarily taxon-specific. Peregrin-Alvarezet al. [17] found that metabolic enzymes are present across awider phylogenetic spectrum than other genes.
Some studies have analyzed the expansion of protein familiesin relation to the number of genes in the genome [18,19] or toorganismic complexity, measured as the number of cell types[20]. These studies report that protein families involved inregulatory processes and extracellular functions show anincrease in the number of genes correlated with genome sizeand organismic complexity.
All of the studies mentioned above address the evolution ofthe protein repertoire in various sets of organisms. Here, weinvestigate the evolutionary divergence of all functionalgroups of human proteins at different levels. We measuredivergence of human proteins relative to 15 eukaryotes span-ning from mammals to fungi using a new method we callFRED (for 'Functional categories and their relative evolution-ary divergence'), which is outlined in Figure 1.
In contrast to previous studies of conservation [7-9,13,14,21],our work spans 15 genomes ranging from mammals to fungi,which allows us to gain a broad perspective on the history ofmutations and selection leading to the human lineage. By
comparing the sequence evolution of different functionalgroups in human we see which parts of the genome are moreplastic to change, and which parts are conserved. With ourapproach, we gain a dynamic picture of the extent of conser-vation, since some functions are strictly conserved onlywithin vertebrates, for instance, while others are maintainedacross all eukaryotes. This dynamic picture of differentialrates of divergence across functional categories reveals a'grammar' of metazoan evolution up to the human lineage.
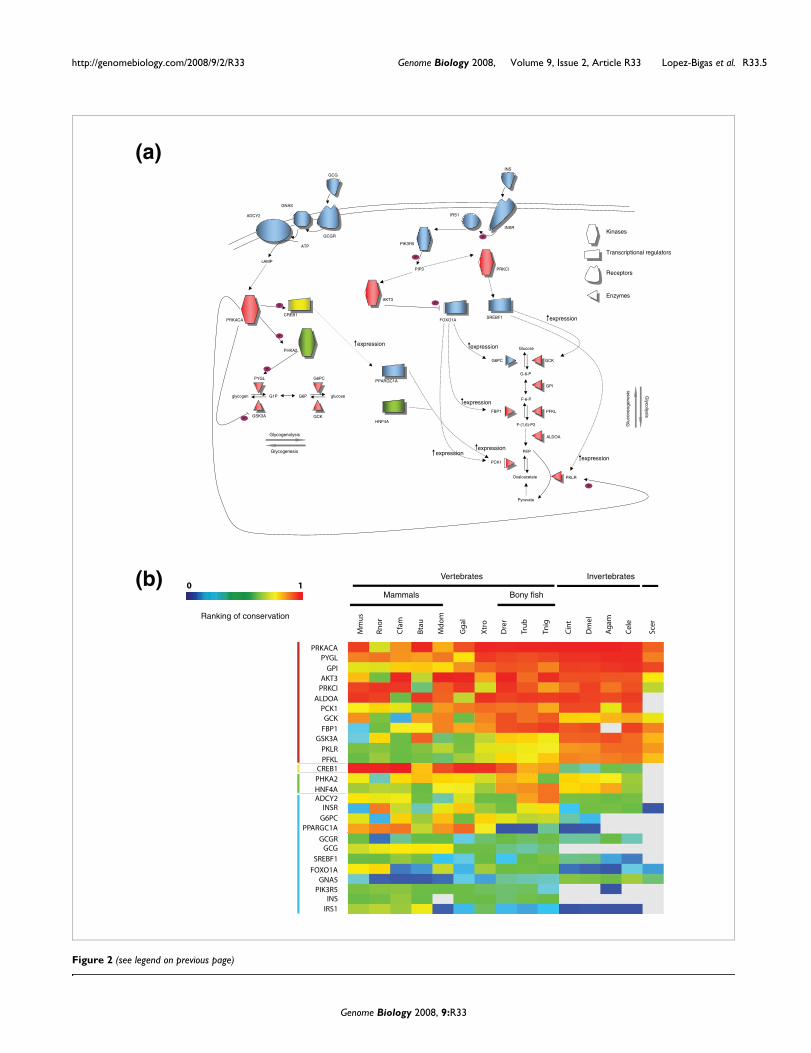
ResultsFunctional protein divergence in the glucagon and insulin signaling pathwaysFirst, we focus on a specific system to investigate whetherthere are different levels of protein conservation for types ofprotein function. Glucose metabolism is a key process inhuman cells for the storage and release of energy. Theenzymes that catalyze the reactions leading to the synthesisand degradation of glucose are regulated by complex signal-ing pathways triggered by glucagon and insulin hormones[22]. This system is a good case study, as there are a variety ofproteins of different molecular functions involved in the proc-ess: enzymes, receptors, signal transducers and transcriptionfactors.
Figure 2a depicts key genes involved in glucose homeostasisregulated by insulin and glucagon hormones and the func-tional relationships between them. We measure sequencedivergence using the ranked 'conservation score' (CS; pleaserefer to Materials and methods for a definition of this score;Figure 2b). This case study illustrates that the proteinsinvolved in regulation of the glucose metabolism, such as glu-cagon (GCG) and insulin (INS), their receptors (INSR andGCGR) and some transcriptional regulators involved in theprocess (SREBF1, PPARGC1A and FOXO1A), have very lowconservation compared to enzymes directly involved in thecatalysis of reactions of glucose metabolism. For example,FOXO1A is a transcription factor that regulates the expres-sion levels of several enzymes in gluconeogenesis (G6PC,FBP1 and PCK1). This protein is highly divergent in eukaryo-tes, especially in invertebrates. Recently, this gene has been
Flow chart of the FRED method for analyzing the protein divergence landscape of functional categoriesFigure 1 (see following page)Flow chart of the FRED method for analyzing the protein divergence landscape of functional categories. (a) We start from a matrix of all human genes with the conservation score (CS) in each of the 15 genomes analyzed. (b) First, all genes with a CS over 0 are ranked in each organism, and the highly ranked genes are shown in red and lowly ranked in blue following a gradient of colors. White cells mean that no ortholog/homolog is detected. Next, the genes are classified according to GO terms. (c) For each set of genes within a GO category, we calculate the median CS, and also select 10,000 sets of the same number of genes as in the GO category considered at random from the complete set of genes with GO annotation. (d) For each random set, we calculate the median CS. (e) From the 10,000 random sets we obtain the expected median CS and the standard error, which allow us to calculate the Z-score for the GO category under consideration. (f) This Z-score is then plotted in a matrix on a color-coded scale. Gray means no significant difference in the level of conservation compared to the background. A similar procedure is followed for the calculation of Z-scores for number of orthologs and homologs by counting the proportion of genes with homologs or orthologs in each set. Mmus, Mus musculus; Rnor, Rattus norvegicus; Cfam, Canis familiaris; Bta, Bos taurus; Mdom, Monodelphis domestica; Ggal, Gallus gallus; Xtro, Xenopus tropicalis; Drer, Danio rerio; Trub, Takifugu rubripes; Tnig, Tetraodon nigroviridis; Cint, Ciona intestinalis; Agam, Anopheles gambiae; Dmel, Drosophila melanogaster; Cele, Caenorhabditis elegans; Scer, Saccharomyces cerevisiae. All the results of these analyses for all GO categories are provided online in a searchable database at [28].
shown to be differentially expressed between primates [23].
The mammalian insulin signaling pathway has been studiedin depth. Insulin signaling influences other processes in addi-tion to glucose metabolism, such as protein synthesis, growthand cell division. This pathway, from the receptor to the tar-get serine/threonine kinases, is known to be conserved infruitfly [24] and nematode [25-27]. However, as seen in ouranalysis, the degree of conservation of the proteins involvedin the insulin pathway is low relative to the conservation ofother human proteins. In contrast, most of the enzymesinvolved in the process are highly conserved across eukarya.
Thus, the human proteins involved in this well-known biolog-ical system show the following trend of conservation acrossmetazoa: genes whose function is the direct catalysis of enzy-matic reactions are conserved, while genes involved in theregulation of these core catalytic proteins (receptors, signaltransducers and transcription factors) are divergent. Wewondered whether this pattern of conservation is specific tothe insulin and glucagon signaling system, or whether it is ageneral pattern found in the whole human proteome.
Protein divergence of the human proteome during mammalian evolutionTo generalize our study of evolutionary rates across func-tional categories, we analyzed the evolutionary landscape ofhuman genes and their orthologs in over 300 functional cate-gories across 15 eukaryotes using our FRED method. Wequantified the conservation of genes using four measures.Two of the measures are the CS of the orthologs (Figure 3, andFigures S2a,b and S3a,b in Additional data file 1) and the CSof the closest homolog (Figure 3, and Figures S2d,e and S3d,ein Additional data file 1) of human proteins in other eukaryo-tic organisms. These two measures of amino acid sequenceconservation are highly correlated across all genomes com-pared to human (for example, the correlation coefficient =0.97 for mouse and 0.93 for Drosophila; Table S1 in Addi-tional data file 1). In addition to these measures of sequencedivergence, we quantified the presence of orthologs to thehuman proteins in the other genomes as well as the presenceof homologs. The degree of orthology reflects the presence ofhuman genes in other genomes (Figures S1, S2c and S3c inAdditional data file 1), while homology reflects the presenceof the human gene family in other genomes (Figures S1, S2fand S3f in Additional data file 1) (Please refer to the Supple-
mentary methods in Additional data file 1 for details of thecalculation of these measures.). The relative conservation ofGene Ontology (GO) categories, the statistics and the CS foreach of the 14,062 human genes analyzed are provided onlinein a searchable database [28].
While we also consider the rate of loss of genes and families,we focus on sequence divergence in describing our results.Though there is a wide range of protein sequence conserva-tion in all categories, the shape of the distribution differsbetween categories (Figure 4). Some categories contain manyhighly conserved proteins across all eukaryotes and only fewproteins that are not conserved, while others are dominatedby proteins that diverge quickly. Yet another type of categorycontains proteins that are conserved in one phylogeneticgroup relative to human and divergent in another phyloge-netic group.
The set of proteins in a particular functional category will varywhen comparing human to different genomes due to genegain and loss. Therefore, the average CS of the proteins in afunctional category depends on both the sequence divergenceof ancient conserved orthologs, as well as genes that haveevolved anew in the lineage considered (and are still con-served in human). Since this is true of all functional catego-ries, the median conservation score of a category is a robustmeasure of variation in proteins between the functional cate-gories of a particular pair of genomes. In order to make surethat our conclusions hold even when we consider only univer-sally conserved orthologs, we have used the KOGs classifica-tion [29] as a further control data set (Figure S4 in Additionaldata file 1). We will now survey the varying patterns of conser-vation of the different functional categories, and will attemptto identify underlying principles.
Metabolism, transport and cell structure proteins are conservedThe most conserved functional categories, shown in red inFigure 3, belong to the three super-groups of 'metabolism'(catalytic activity, macromolecule metabolism, biosynthesis,protein metabolism, primary metabolism, mRNA splicing,mRNA processing), 'transport' (transporter activity, carrieractivity, ion transport activity, protein transport, intracellulartransport, transport, protein localization) and 'cell structure'(structural constituent of ribosome, structural moleculeactivity, nucleosome assembly, organelle organization and
Degree of conservation of the glucagon and insulin signaling pathwaysFigure 2 (see following page)Degree of conservation of the glucagon and insulin signaling pathways. (a) Regulatory interactions between proteins involved in glucagon (GCG) and insulin (INS) signaling, and enzymes involved in glucose and glycogen metabolism. Proteins depicted in red show high conservation, those depicted blue have low levels of conservation and the ones in green intermediate conservation. The CREB protein is represented in yellow because it is highly conserved in vertebrates and not in invertebrates. There is a clear correlation between the functions of the molecules shown in the key and the degree of conservation indicated by the color code: enzymes and kinases tend to be red and conserved, while signal transducers, receptors and transcription factors tend to be blue and divergent. (b) Matrix of normalized ranking of the genes depicted in (a). The rows in the matrix are ordered by the sum of the CS rank in the 15 organisms.
biogenesis, chromatin assembly or disassembly, DNA pack-aging) (Figure 3). Note that the nucleosome assembly cate-gory is actually more conserved than indicated by CSorthologs in Figure 3 (see CS homologs in Figure 3); this dis-tortion is due to a known limitation of the current Ensembl-Compara ortholog assignment (Albert Vilella, personal com-munication). Many of the proteins that belong to conservedcategories involved in binding are also part of the metabolismsuper-group: nucleotide binding, ATP binding, RNA binding,protein binding. The three broad groups of metabolism,transport and cell structure are all core cellular processes.
Modulators of core processes are highly divergentIn contrast, proteins with the lowest conservation, shown inblue in Figure 3, are mainly involved in 'regulatory' functionsand processes or involved in 'responses to the environment'.For example, amongst the least conserved molecular func-tions are receptors (receptor activity, transmembrane recep-tor activity, olfactory receptor activity, rhodopsin likereceptor activity), signal transducers and transcription fac-tors not involved in development (TF-DBD). All thesedivergent molecular functions are mainly involved inmodulating the conserved core processes. Note that this trendholds across many different structural families and differenttypes of regulators, so that it cannot be explained in terms ofparticular molecular characteristics, such as fewer con-straints on the fold or on the surface of receptors compared tothe constraints on enzyme.
The other biological processes that are evolving rapidly arethose involved in responses to the environment: defenseresponse, immune response, response to stimulus, responseto external stimulus, response to stress, response towounding, inflammatory response. These processes are allinvolved in the response to an external challenge to the organ-ism. Since challenges such as parasites vary from one eukary-ote to another, natural selection favors rapid evolution ofproteins in these categories. Pressure for adaptation againstchanging environments and pathogens imposes strong selec-tion for advantageous mutations to sweep the populationrapidly.
Host-parasite interactions have been suggested as the mostlikely reason for the fast evolution of human immunity genes[21]. In addition, these categories have a low number of geneswith orthologs or homologs in other organisms (Figure S1 in
Additional data file 1). This is not surprising since the anti-body-based immune system does not exist in bony fish orother lower eukaryotes [30], and there may be parallel oralternative adaptive immune systems in these organisms,such as the leucine-rich repeat receptor system in lampreys[31].
Developmental genes are conserved only in mammalsSome categories are conserved amongst mammals whilediverging rapidly in other organisms relative to human,including development, morphogenesis, organogenesis, andmany categories associated with transcriptional regulation(Figures 3 and 4). Although the GO category 'transcriptionfactor activity' shows this pattern of conservation, our divi-sion of transcription factors into 'Developmental TFs' and'TF-DBD', which are transcription factors involved in otherprocesses (see Materials and methods for details), reveals afundamental difference between the two groups: transcrip-tion factors involved in development are highly conserved inmammals, while those not involved in development have onlyaverage conservation in mammals and are significantly diver-gent in bony fish relative to human. Both groups oftranscription factors ('Developmental TFs' and 'TF-DBD') arehighly divergent in invertebrates relative to human (Figure3). Thus, for the transcription factors not involved in develop-ment, the trend is consistent with that of other regulatory cat-egories such as receptors and signal transducers.
An example of a particular developmental transcription fac-tor that is highly conserved in mammals but switches to beingvery divergent in invertebrates is the Neurogenic differentia-tion factor 1 (NeuroD1), which is required for dendrite mor-phogenesis and maintenance in the cerebellar cortex [32].Note that there is a distribution of sequence conservationwithin each functional category. Thus, within the 'develop-ment' category, there are proteins, including some transcrip-tion factors, that form part of the core of the developmentalnetwork, conserved from invertebrates to human, while at thesame time, other parts of the network have undergone pro-found change or innovation [33]. This trend is also noticeablewhen we focus on short evolutionary distance from humans.Though NeuroD1 follows the same pattern as the 'Develop-mental TF' category as a whole, there are exceptions: sometranscription factors involved in core developmental proc-esses, such as Pax-6, are remarkably conserved across alleukaryotes (Figure S2 in Additional data file 1).
Divergence of orthologs and homologs of representative functional categoriesFigure 3 (see following page)Divergence of orthologs and homologs of representative functional categories. (a) Molecular function and (b) biological process. Colors towards red signify high relative conservation of the group of genes in a particular genome. Colors towards blue signify low relative conservation. Gray means no statistically significant difference in conservation level compared to the background of the rest of the genome. White cells denote that there is no gene with the GO term and with ortholog/homolog in the other organism. The colored lines on the left of the names of the functional classes correspond to the colors of the categories represented in Figure 5.
Controls for orthology, conservation measure, functional classifications and expressionThis whole genome divergence pattern is not an artifact of theset of orthologs and homologs or the functional classificationscheme we use: almost identical results are obtained usingthe orthologous groups within seven eukaryotes and also thefunctional classification provided by the KOGs [29] (FigureS4 and Table S1 in Additional data file 1). Furthermore, whenwe restrict the orthologous groups considered to those thatare present across all seven eukaryotes, very similar resultsare obtained (Figure S4c,d in Additional data file 1). Thismeans that orthologs present, for example, in mammals onlyare not distorting the general trend of a conserved core anddivergent regulatory functions. In addition, this test alsoaccounts for possible genome annotation biases due toconservation.
We compared our results of protein divergence (using CS)with two measures of divergence at the DNA level: the GERP(Genome evolutionary rate profiling) method developed byCooper and colleagues [34] where divergence rate of everybase position is compared against an expected rate; and therate of non-synonymous substitution (dN) between humanand mouse and human and rat genomes (see Materials andmethods for details). Using the GERP score we measureddivergence in mammals (chimpanzee, macaque, rat, mouse,dog, cow, opossum) at each coding base for around 15,000human genes. An evolutionarily conserved base position hasa low GERP score while a divergent position has a high score.We measured the average GERP score for all coding nucle-otides for each gene and assessed whether these values differsignificantly between functional groups using Z-score analy-sis (Figure S5 in Additional data file 1). Similarly, we assessedthe dN values per gene. The FRED results using the GERPscore and dN correlates remarkably well with that of the CS in
Histogram distribution of CSs of orthologs for selected GO categories in M. musculus, D. rerio and D. melanogasterFigure 4Histogram distribution of CSs of orthologs for selected GO categories in M. musculus, D. rerio and D. melanogaster. (a) The CS distributions for proteins in three molecular function categories. 'Catalytic activity' is significantly conserved in all three organisms, while 'Transcription factors DBD' and 'Receptor activity' are significantly divergent in zebrafish and Drosophila. (b) The CS distributions for proteins in three biological process categories. 'Biosynthesis' is a highly conserved category in all three organisms, while 'Development' is significantly conserved in mouse but significantly divergent in Drosophila. 'Response to stimulus' is significantly divergent across all three organisms.
mammals, showing consistency between DNA and protein-level measures.
Another factor that could potentially confound our analysis isthe correlation between phylogenetic extent and expressionbreadth across tissues [35]. Restricting our FRED analysis tohousekeeping genes (defined as genes expressed in more than75 tissues in GeneAtlas v2 expression array [36]) or to geneswith tissue-specific expression (those expressed in less than20 tissues) yields essentially the same results as consideringall proteins (data not shown).
From these control analyses, it is clear that our general con-clusion is independent of factors such as expression, thedefinition of orthologs, the measure of conservation and thefunctional classification scheme used.
DiscussionHere, we establish the entire divergence landscape of humanprotein-coding genes across eukaryotes and discuss evolu-tionary selection in the human lineage in the light of long-term evolution. The main results from our analysis are, first,that two main groups of proteins are diverging at differentspeeds: regulatory proteins diverge quickly across species,while proteins involved in core processes are conserved (Fig-ure 5). This shows that at the level of protein-coding genes,morphological changes in metazoan evolution relative tohumans have been primarily driven by variation in regulatorygenes rather than enzymatic and structural genes. While thisis consistent with many previous small-scale studies, our con-clusions are more comprehensive and clear due to the amountof data we consider in this analysis. Second, certain functionalcategories exhibit dynamic patterns of sequence divergenceacross their evolutionary history leading to human. Genesinvolved in 'development' and 'organogenesis' are signifi-cantly conserved within mammals, while significantly diver-gent in human relative to invertebrates.
The picture of long-term evolution is broadly consistent withthe signatures of selection on functional categories in thehuman lineage, implying that the same underlying grammarguides the dynamics of metazoan evolution relative to humanover short as well as long evolutionary timescales. Recentstudies [7-10,13,21] have identified several categories ofgenes with higher divergence rates between hominids, or withsigns of positive selection using different measures for detect-ing selection. For example, Bustamante and colleagues [7]identified genes involved in transport and cell structure asbeing under negative selection in the human lineage, whichwe find to have strong protein sequence conservation. Genesinvolved in regulatory processes have been reported to showsignatures of positive selection [7,12], especially genes relatedto regulation of transcription. In addition, genes involved inimmune and defense response also show strong signatures ofpositive selection in the human [7,12,21]. Both sets of catego-
ries have high sequence divergence in our comparison ofhuman proteins to other eukaryotes. Bustamante et al. [7]report strong negative selection on ectoderm development,and we find development to be conserved in mammals.
Our analysis highlights some general systems-level character-istics of metazoan evolution relative to human: regulatoryprocesses, such as signal transducers, transcription factorsand receptors, have a high degree of plasticity, while coreprocesses, such as metabolism, transport and protein synthe-sis, are largely conserved. This dual architecture of a con-served core and variable regulatory peripheral processes mayconfer robustness [37] and evolvability [38] on the system. Sofar there has been little concrete biological data on genes thatare responsible for phenotypic plasticity and the evolution ofspecies. Our analysis provides evidence for which genes andfunctional categories are most variable in organismic evolu-tion, and what we observe fits the framework of the theoriescited above.
We have focused purely on molecular variation of proteincoding genes. There are many other dimensions to humanevolution that are not captured by this analysis, or at least notdirectly. These include evolution of epigenetic regulation,alternative splicing, non-coding genes such as microRNAs[39,40], promoters [41,42] and other non-coding regions[43,44]. However, divergence rates of the human protein-coding genes are linked with evolution of all of these otherprocesses, and proteins themselves are the major players inthe development, structure and physiological adaptability ofanimals.
In the future, analyses such as ours will be aided by greaterdensity of sequence information. The 'thousand dollargenome' or, more generally, cheaper sequencing and geno-typing technologies will provide us with greater coverage ofpolymorphisms both in human and other organisms. At thesame time, population-wide measurements of expression atthe RNA [45-47] and protein levels will allow us tounderstand how changes in DNA affect cellular processes. Interms of whole organisms, quantitative phenotypic traits arebeginning to be related to sequence features [48]. Ultimately,we hope to understand what variations at cellular, organismicand species level are determined by genomic diversity.
Materials and methodsFunctional classificationProtein-coding human genes with functional annotation(14,062 genes) were extracted from Ensembl [49] for both the'molecular function' and 'biological process' GO classification[50]. Note that GO terms are organized into structures calleddirected acyclic graphs, such that a specialized term can beassociated with several less specialized terms. For instance, agene annotated with the term 'transcription factor activity'will also automatically be annotated as 'DNA binding' and
'nucleic acid binding', which are parent terms of the formerterms in the GO database. We analyzed all the GO molecularfunction categories and all biological process categories thathave more than 100 human genes annotated with their term(135 and 242, respectively). We carried out our analysis withand without annotation that is inferred electronically (thisrepresents 54% of annotations for biological process and 69%for molecular function), and the conclusions are consistentusing both versions of GO annotation (data not shown). Inaddition, although we used all the Ensembl genes with GOannotations (14,062 genes) for our study, we repeated theanalysis using only genes included in the RefSeq database[51], finding essentially the same results (data not shown).
In addition to these categories, we introduced a category ofour own of predicted sequence-specific DNA-bindingtranscription factors. This category is defined from the data-base DBD, which contains repertoires of predicted transcrip-tion factors for completely sequenced genomes based ondomain assignments from the SUPERFAMILY and PFAMhidden Markov model libraries [52]. Furthermore, wedivided this category into: developmental transcription fac-tors (that is, also annotated with the GO biological processterm 'development'); and all others (TF-DBD).
In the alternative functional classification scheme consid-ered, the KOGs database [29], there are orthologous groups ofproteins from seven eukaryotic genomes: three animals (thenematode C. elegans, the fruit fly Drosophila melanogasterand Homo sapiens), one plant, Arabidopsis thaliana, twofungi (Saccharomyces cerevisiae and Schizosaccharomycespombe), and the intracellular microsporidian parasiteEncephalitozoon cuniculi [29]. The orthologous groups ofproteins are classified into one of 25 functional categorieswherever possible, so there are fewer larger categories in thisscheme compared to the GO scheme.
Genomes and phylogenetic groupsProteins from the human genome (NCBI36 - Ensembl v.42)were used for the analysis. In addition, the following versionsof other completed eukaryotic genomes are part of our analy-sis. Mammals: two rodents, mouse (Mus musculus -NCBIM36) and rat (Rattus norvegicus - RGSC3.4), dog(Canis familiaris - CanFam2.0), cow (Bos taurus - Btau2.0),opossum (Monodelphis domestica - MonDom4.0). Other ver-tebrates: chicken (Gallus gallus - WASHUC2) and Frog(Xenopus tropicalis - JGI4.1), and three bony fish, zebrafish(Danio rerio - Zv6), fugu (Takifugu rubripes - FUGU4) andtetraodon (Tetraodon nigroviridis - TETRAODON7). Inver-tebrates: mosquito (Anopheles gambiae - AgamP3), fruitfly(D. melanogaster - BDGP4.3), sea urchin (Ciona intestinalis
Peripheral and core functional categoriesFigure 5Peripheral and core functional categories. A set of core molecular functions and biological processes that are highly conserved are represented in red in the centre of the figure. Other sets of functions and processes that are highly divergent across all eukaryotes (blue) or highly divergent in some organisms and highly conserved in others (yellow) are represented on the periphery as regulators of the core processes. The colors correspond to the colored lines on the left in Figure 3.
Homology and orthologyPairwise similarity for all human genes against each otherand the other genomes was obtained from Ensembl-Compara(v42.0) [49]. These relationships were computed using WUB-LASTP (v2.0) [53] for each gene considering the longest pep-tide isoform only. Homologs are defined as those sequenceswith a match with an E-value ≤10-10 in other genomes, whileorthologs in Ensembl-Compara are assigned based on maxi-mum likelihood phylogenetic gene trees.
The presence of an ortholog for a human protein in anothergenome provides more precise information about the conser-vation of the protein than the presence of a homolog. How-ever, orthology detection is error-prone for distantevolutionary relationships and for protein families with manyduplications and losses. Therefore, we decided to use both,orthologs and homologs, in our study.
Functional categories and their relative evolutionary divergence: FREDWe have developed a scheme for quantifying the relative pro-tein sequence divergence of different functional categoriesbetween a pair of genomes, which we used to compare humanto 15 other genomes. We call this framework FRED, forfunctional categories and their relative evolutionary diver-gence, which is outlined in Figure 1 and described below.
Conservation measuresThe primary measure of evolutionary rate that we use isamino acid sequence evolution through the CS [54]. We usethe median CS for all the orthologs of human to anothergenome in a particular functional category. This means thatthe set of proteins considered for a particular functional cate-gory can differ when comparing human to one genome oranother due to gain and loss of genes throughout evolution.However, we normalize the rate of sequence divergence foreach functional category by the average divergence for thepair of genomes considered. This means that gene gain andloss in a particular category is implicitly compared to the ratesin other functional categories when we study sequence diver-gence. Furthermore, we also consider the set of universallyconserved orthologs across eukaryotes from the KOGs data-base [29] and test our conclusions on this set. In addition, wehave analyzed the extent of the existence of orthologs andhomologs to the human genes in the 15 other genomes, anddiscuss the extent of correlation between the different meas-ures of evolutionary rate.
Conservation scoreThe CS is an estimate of the divergence that has occurredbetween a pair of proteins during evolution, and is independ-ent of the length of the proteins [54]. The value of CS was cal-culated for each human gene by dividing the WUBLASTP
score of the ortholog (or the closest homolog) in the otherorganism by the WUBLASTP score of the protein againstitself, as reported elsewhere [54]: CS ortholog or homolog =WUBLASTP score ortholog or homolog/WUBLASTP scoreself.
The CS accounts for the proportion of the query proteinmatched by WUBLASTP and the quality of the match, but isindependent of the query protein length. The CS ranges from0, when no ortholog or homolog is detected, to 1, when theclosest homolog is identical to the human protein. Note, thatfor all our analyses using CS, we use only values higher than0, meaning that we take into account only genes with detect-able and significant orthologs or homologs. This score isindicative of how conserved a protein has remained throughevolution, and hence the degree to which mutations withinthe sequence have been tolerated. We do not consider themolecular details of the differences in mutation rates, such asvariations in the proportion of residues that are required foradequate protein function. Instead, we consider the net resultof accepted mutations across functional categories.
In Figure 2b, we display in color the relative CS of each genein a particular organism. To do this we ranked all humangenes with homologs in the other genome according to theirCS. The gene with the highest CS is shown in red and the onewith the lowest CS in blue, with all others in intermediatecolors according to their rank by CS. Thus, colors towards redmean high relative CS of the protein, green is medium relativeCS and blue low relative CS.
Note that for the orthologs from the KOGs classificationscheme, the CS value was calculated for each human gene bydividing the BLASTP score of the closest KOG partner in theother organism by the BLASTP score of the protein againstitself.
Simulations for Z-score calculationsAs described above and summarized in Figure 1, we groupedthe genes by GO molecular function and biological processcategory, and then calculated both the mean and median CSfor orthologs and homologs, as well as the number of geneswith homologs or orthologs in a particular genome. To testwhether there was a significant deviation from randomexpectation for these measures we used the Z-score:
where μx is the mean, and is the standard error. The
for number of genes with homologs and orthologs was calcu-
where ρ is the proportion of genes in the category in question
that have homologs or orthologs, and N is the total number of
genes in the category. To calculate for the mean and
median CS in each of the GO categories (X), we randomly
selected 10,000 datasets of human proteins of identical sam-
ple sizes as the category in question and repeated the calcula-
tion for each random set. Z-scores for both mean and median
CS values for functional categories yield essentially the same
results, as the correlation coefficients between the two meas-
ures are greater than 0.9 for all functional categories and
genomes.
We display matrices of Z-score values in which each cell isrepresented by a color-coded scale. Red signifies conserva-tion (either greater number of homologs or orthologs than thebackground, or greater average conservation score than thebackground) and blue signifies divergence. Gray means nosignificant difference in the level of conservation compared tothe background.
When adjusting the conventional α value (0.05, the p-valuethreshold) using the Bonferroni correction for multiple test-ing we obtain a corrected α of 1.3 × 10⁻⁴, taking into accountthat we are doing 377 tests (135 molecular function and 242GO biological process categories). Therefore, we consider assignificant absolute Z-scores larger than 3.652 (|Z| > 3.652),which corresponds to an analytical p-value of 1.3 × 10⁻⁴. Thisis a stringent threshold as Bonferroni is a conservative correc-tion, especially for the data structure considered here.
Note that our measure of degree of conservation of a func-tional class (Z-score) is always relative to the conservation ofall the genes in that genome in comparison to human. Forinstance, transcription factors are diverging rapidly in fly rel-ative to human but have average conservation in mouse; thismeans that the orthologous fly-human transcription factorshave diverged rapidly compared to fly-human orthologs inother functional categories, not compared to the mouse-human orthologs. The speed of divergence of a category willdepend on the divergence of both ancient conserved genesand genes that have arisen within the particular lineage con-sidered. Clearly, there will be more human orthologs thathave arisen recently in organisms closely related to human.The expectation is that a recently duplicated gene will have arelatively high rate of sequence divergence in order to sub- orneo-functionalize. The contribution of such genes to variousfunctional categories will be uneven, since it is known thatsome categories expand more quickly than others [18]. At thesame time, the constraint on proteins in most functional cat-egories will be more similar in organisms closer to human,and may change in organisms more distantly related tohuman (even if there are orthologs within the category). Tocontrol for these issues, we re-calculated the Z-scores forKOGs functional categories on proteins that are universally
conserved across all seven eukaryotes in the KOGs database(see main text).
Divergence profile of orthologous regions across mammals: GERPTo understand the evolutionary history of coding regions atbase level positions, we considered the divergence profile oforthologous regions across mammals. We used the GERPmethod developed by Cooper and colleagues [34] wheredivergence rate of every base position is compared against anexpected rate. An evolutionarily conserved base position hasa low GERP score while a divergent position has a high score.
First, ortholog information for human genes in seven othermammalian genomes, namely chimpanzee, macaque, rat,mouse, dog, cow, opossum, was collected from Ensembl-Compara v37 and 42. We considered only orthologs that were>100 amino acids long aligned over at least 70% of the humanprotein. DNA level multiple alignment was performed usingDIALIGN [55]. The neutral phylogenetic tree of the mamma-lian genomes was constructed by eliminating nodes that werenot present in our study from the tree provided by Cooper etal. [34]. The average neutral rate of substitution for the mam-malian genomes included in the analysis was taken as 1.93substitutions per base. Semphy [56] was used by GERP to cal-culate the observed rate of divergence on a base-by-basebasis. The score for evolutionary divergence was calculated asGERP score = Observed rate - Expected rate. Around 15,000genes that had orthologs in 4 or more mammalian genomeswere subject to GERP analysis.
We measured the average GERP score for all coding nucle-otides for each functional category and we assessed usingFRED analysis if these values differ significantly betweenfunctional groups (Figure S5 in Additional data file 1).
Non-synonymous substitution rates: dNdN data for the genes were taken from Ensembl-Compara v45[49]. We computed the correlation between dN and CS fororthologs of human genes in mouse (16,040 genes) and rat(14,726 genes) (Figure S6 in Additional data file 1). Weassessed using FRED analysis if the dN values for human-mouse and human-rat differ significantly between functionalgroups (Figure S5 in Additional data file 1).
Authors' contributionsNLB calculated CSs for all human proteins and carried out Z-score analysis. SD performed the GERP analysis, comparedCSs against other methods and helped to draft the
manuscript. NLB and SAT conceived the study, participatedin its design and coordination, and drafted the manuscript.All authors read and approved the final manuscript.
Additional data filesThe following additional data files are available. Additionaldata file 1 contains Supplementary Table 1, SupplementaryFigures 1, 5 and 6, figure legends for all supplementary figuresand screenshots of the evolvability web server [28], whichcontains the web-based figures, statistics and information onthe CS for all genes.Additional data file 1Supplementary table and figuresSupplementary table and figures.Click here for file
AcknowledgementsWe thank R Guigo, J Pereira-Leal, T Kisiel, C Vogel, C Chothia, E Bornberg-Bauer, H Dopazo, E Levy, R Castelo, P Lio, D Petrov, G Bejerano, A Nav-arro and M Alba for valuable comments and discussion. We are also thank-ful to the Ensembl-Compara group for help in using their data. NL-B is arecipient of a Ramón y Cajal contract of the Spanish Ministry of Science andEducation (MEC) and acknowledges funding from the International HumanFrontier Science Program Organization (HFSPO), the MEC grant numberSAF2006-0459 and EMBO Short Term Fellowship (ASTF 17-2006). SD is anLMB-Cambridge scholarship holder and acknowledges funding from theCambridge Commonwealth Trust.
References1. Dickerson RE: The structures of cytochrome c and the rates
of molecular evolution. J Mol Evol 1971, 1:26-45.2. Dayhoff M, Schwartz R, Orcutt B: A model of evolutionary
change in proteins. In Atlas of Protein Sequence and Structure. Volume5. Edited by Dayhoff M. Silver Springs, MD: National BiomedicalResearch Foundation; 1978:345-352.
3. Hillier LW, Miller W, Birney E, Warren W, Hardison RC, Ponting CP,Bork P, Burt DW, Groenen MA, Delany ME, Dodgson JB, ChinwallaAT, Cliften PF, Clifton SW, Delehaunty KD, Fronick C, Fulton RS,Graves TA, Kremitzki C, Layman D, Magrini V, McPherson JD, MinerTL, Minx P, Nash WE, Nhan MN, Nelson JO, Oddy LG, Pohl CS, Ran-dall-Maher J, et al.: Sequence and comparative analysis of thechicken genome provide unique perspectives on vertebrateevolution. Nature 2004, 432:695-716.
4. Albà MM, Castresana J: Inverse relationship between evolution-ary rate and age of mammalian genes. Mol Biol Evol 2005,22:598-606.
5. Luz H, Vingron M: Family specific rates of protein evolution.Bioinformatics 2006, 22:1166-1171.
6. Pál C, Papp B, Lercher MJ: An integrated view of proteinevolution. Nat Rev Genet 2006, 7:337-348.
7. Bustamante CD, Fledel-Alon A, Williamson S, Nielsen R, Hubisz MT,Glanowski S, Tanenbaum DM, White TJ, Sninsky JJ, Hernandez RD,Civello D, Adams MD, Cargill M, Clark AG: Natural selection onprotein-coding genes in the human genome. Nature 2005,437:1153-1157.
8. Castillo-Davis CI, Kondrashov FA, Hartl DL, Kulathinal RJ: The func-tional genomic distribution of protein divergence in two ani-mal phyla: coevolution, genomic conflict, and constraint.Genome Res 2004, 14:802-811.
9. Clark AG, Glanowski S, Nielsen R, Thomas PD, Kejariwal A, ToddMA, Tanenbaum DM, Civello D, Lu F, Murphy B, Ferriera S, Wang G,Zheng X, White TJ, Sninsky JJ, Adams MD, Cargill M: Inferring non-neutral evolution from human-chimp-mouse orthologousgene trios. Science 2003, 302:1960-1963.
10. The Chimpanzee Sequencing and Analysis Consortium: Initialsequence of the chimpanzee genome and comparison withthe human genome. Nature 2005, 437:69-87.
11. The International HapMap Consortium: A haplotype map of thehuman genome. Nature 2005, 437:1299-1320.
12. Voight BF, Kudaravalli S, Wen X, Pritchard JK: A map of recentpositive selection in the human genome. PLoS Biol 2006, 4:e72.
acceleration in the evolution of the human and chimpgenome. PLoS Comput Biol 2006, 2:e38.
14. Chervitz SA, Aravind L, Sherlock G, Ball CA, Koonin EV, Dwight SS,Harris MA, Dolinski K, Mohr S, Smith T, Weng S, Cherry JM, BotsteinD: Comparison of the complete protein sets of worm andyeast: orthology and divergence. Science 1998, 282:2022-2028.
15. Madan Babu M, Teichmann SA, Aravind L: Evolutionary dynamicsof prokaryotic transcriptional regulatory networks. J Mol Biol2006, 358:614-633.
16. Coulson RM, Ouzounis CA: The phylogenetic diversity ofeukaryotic transcription. Nucleic Acids Res 2003, 31:653-660.
17. Peregrin-Alvarez JM, Tsoka S, Ouzounis CA: The phylogeneticextent of metabolic enzymes and pathways. Genome Res 2003,13:422-427.
18. van Nimwegen E: Scaling laws in the functional content ofgenomes. Trends Genet 2003, 19:479-484.
20. Vogel C, Chothia C: Protein family expansions and biologicalcomplexity. PLoS Comput Biol 2006, 2:e48.
21. Nielsen R, Bustamante C, Clark AG, Glanowski S, Sackton TB, HubiszMJ, Fledel-Alon A, Tanenbaum DM, Civello D, White TJ, J Sninsky J,Adams MD, Cargill M: A scan for positively selected genes in thegenomes of humans and chimpanzees. PLoS Biol 2005, 3:e170.
22. Jiang G, Zhang BB: Glucagon and regulation of glucosemetabolism. Am J Physiol Endocrinol Metab 2003, 284:E671-E678.
23. Gilad Y, Oshlack A, Smyth GK, Speed TP, White KP: Expressionprofiling in primates reveals a rapid evolution of human tran-scription factors. Nature 2006, 440:242-245.
24. Brogiolo W, Stocker H, Ikeya T, Rintelen F, Fernandez R, Hafen E: Anevolutionarily conserved function of the Drosophila insulinreceptor and insulin-like peptides in growth control. Curr Biol2001, 11:213-221.
25. Pierce SB, Costa M, Wisotzkey R, Devadhar S, Homburger SA, Buch-man AR, Ferguson KC, Heller J, Platt DM, Pasquinelli AA, Liu LX,Doberstein SK, Ruvkun G: Regulation of DAF-2 receptor signal-ing by human insulin and ins-1, a member of the unusuallylarge and diverse C. elegans insulin gene family. Genes Dev2001, 15:672-686.
26. Duret L, Guex N, Peitsch MC, Bairoch A: New insulin-like pro-teins with atypical disulfide bond pattern characterized inCaenorhabditis elegans by comparative sequence analysis andhomology modeling. Genome Res 1998, 8:348-353.
28. Evolvability Web Server [http://bg.upf.edu/evolvability]29. Tatusov RL, Fedorova ND, Jackson JD, Jacobs AR, Kiryutin B, Koonin
EV, Krylov DM, Mazumder R, Mekhedov SL, Nikolskaya AN, Rao BS,Smirnov S, Sverdlov AV, Vasudevan S, Wolf YI, Yin JJ, Natale DA: TheCOG database: an updated version includes eukaryotes.BMC Bioinformatics 2003, 4:41.
30. Klein J, Nikolaidis N: The descent of the antibody-basedimmune system by gradual evolution. Proc Natl Acad Sci USA2005, 102:169-174.
31. Alder MN, Rogozin IB, Iyer LM, Glazko GV, Cooper MD, Pancer Z:Diversity and function of adaptive immune receptors in ajawless vertebrate. Science 2005, 310:1970-1973.
32. Yokoyama M, Nishi Y, Miyamoto Y, Nakamura M, Akiyama K, Mat-subara K, Okubo K: Molecular cloning of a human neuroD froma neuroblastoma cell line specifically expressed in the fetalbrain and adult cerebellum. Brain Res Mol Brain Res 1996,42:135-139.
33. Davidson EH, Erwin DH: Gene regulatory networks and theevolution of animal body plans. Science 2006, 311:796-800.
34. Cooper GM, Stone EA, Asimenos G, Green ED, Batzoglou S, SidowA: Distribution and intensity of constraint in mammaliangenomic sequence. Genome Res 2005, 15:901-913.
35. Freilich S, Massingham T, Bhattacharyya S, Ponsting H, Lyons PA,Freeman TC, Thornton JM: Relationship between the tissue-specificity of mouse gene expression and the evolutionaryorigin and function of the proteins. Genome Biol 2005, 6:R56.
36. Su AI, Cooke MP, Ching KA, Hakak Y, Walker JR, Wiltshire T, OrthAP, Vega RG, Sapinoso LM, Moqrich A, Patapoutian A, Hampton GM,Schultz PG, Hogenesch JB: Large-scale analysis of the humanand mouse transcriptomes. Proc Natl Acad Sci USA 2002,99:4465-4470.
38. Kirschner M, Gerhart J: Evolvability. Proc Natl Acad Sci USA 1998,95:8420-8427.
39. Stark A, Brennecke J, Bushati N, Russell RB, Cohen SM: AnimalmicroRNAs confer robustness to gene expression and havea significant impact on 3'UTR evolution. Cell 2005,123:1133-1146.
40. Farh KK, Grimson A, Jan C, Lewis BP, Johnston WK, Lim LP, BurgeCB, Bartel DP: The widespread impact of mammalian micro-RNAs on mRNA repression and evolution. Science 2005,310:1817-1821.
41. Lee S, Kohane I, Kasif S: Genes involved in complex adaptiveprocesses tend to have highly conserved upstream regions inmammalian genomes. BMC Genomics 2005, 6:168.
42. Taylor MS, Kai C, Kawai J, Carninci P, Hayashizaki Y, Semple CA:Heterotachy in mammalian promoter evolution. PLoS Genet2006, 2:e30.
43. Carroll SB: Evolution at two levels: on genes and form. PLoSBiol 2005, 3:e245.
44. Wray GA: The evolutionary significance of cis-regulatorymutations. Nat Rev Genet 2007, 8:206-216.
45. Khaitovich P, Hellmann I, Enard W, Nowick K, Leinweber M, Franz H,Weiss G, Lachmann M, Pääbo S: Parallel patterns of evolution inthe genomes and transcriptomes of humans andchimpanzees. Science 2005, 309:1850-1854.
46. Stranger BE, Forrest MS, Dunning M, Ingle CE, Beazley C, Thorne N,Redon R, Bird CP, de Grassi A, Lee C, Tyler-Smith C, Carter N,Scherer SW, Tavaré S, Deloukas P, Hurles ME, Dermitzakis ET: Rel-ative impact of nucleotide and copy number variation ongene expression phenotypes. Science 2007, 315:848-853.
47. Stranger BE, Forrest MS, Clark AG, Minichiello MJ, Deutsch S, Lyle R,Hunt S, Kahl B, Antonarakis SE, Tavaré S, Deloukas P, Dermitzakis ET:Genome-wide associations of gene expression variation inhumans. PLoS Genet 2005, 1:e78.


![[XLS] · Web viewSheet3 Sheet2 Sheet1 gb:NM_024861.1 /DEF=Homo sapiens hypothetical protein FLJ22671 (FLJ22671), mRNA. /FEA=mRNA /GEN=FLJ22671 /PROD=hypothetical protein FLJ22671](https://static.documents.pub/doc/80x56/5acd73227f8b9a27628da910/xls-viewsheet3-sheet2-sheet1-gbnm0248611-defhomo-sapiens-hypothetical-protein.jpg)


