Page 1
Optimizing stomatal conductance for maximum carbon
gain under water stress: a meta-analysis across plant
functional types and climates
Stefano Manzoni1,2, Giulia Vico1,2, Gabriel Katul1,2, Philip A. Fay3, Wayne Polley3,
Sari Palmroth2 and Amilcare Porporato1,2*
1Civil and Environmental Engineering Department, Box 90287, Duke University, Durham, North Carolina 27708-0287,
USA; 2Nicholas School of the Environment, Duke University, Box 90328, Durham, North Carolina 27708, USA; and3USDA-ARS Grassland Soil and Water Research Laboratory, 808 E Blackland Rd, Temple, Texas 76502, USA
Summary
1. Quantification of stomatal responses to environmental variables, in particular to soil water
status, is needed to model carbon and water exchange rates between plants and the atmosphere.
2. Models based on stomatal optimality theory successfully describe leaf gas exchange under dif-
ferent environmental conditions, but the effects of water availability on the key optimization
parameter [the marginal water use efficiency (WUE), k = ¶A ⁄ ¶E] has resisted complete theoreti-
cal treatment. Building on previous optimal leaf gas exchange models, we developed an analyti-
cal equation to estimate k from gas exchange observations along gradients of soil water
availability. This expression was then used in a meta-analysis of about 50 species to investigate
patterns of variation in k.3. Assuming that cuticular water losses are negligible k increases under mild water stress but
decreases when severe water stress limits photosynthesis. When cuticular conductance is consid-
ered, however, k increases monotonically with increasing water stress, in agreement with previ-
ous theoretical predictions. Moreover, the shape of these response curves to soil water
availability changes with plant functional type and climatic conditions. In general, k is lower in
species grown in dry climates, indicating lower marginal WUE.
4. The proposed parameterization provides a framework to assess the responses of leaf gas
exchange to changes in water availability. Moreover, the model can be extended to scale leaf-
level fluxes to the canopy and ecosystem level.
Key-words: elevated atmospheric CO2, optimal water use, photosynthesis model, stomatal
conductance, water stress, water use efficiency
Introduction
Stomatal adjustment allows plants to occupy habitats with
fluctuating environmental states by permitting dynamic reg-
ulation of CO2 and H2O diffusion into and out of leaves.
Open stomata facilitate the diffusion of CO2 from the atmo-
sphere into the substomatal cavity. Simultaneously, water is
lost by transpiration, which is driven by the leaf-to-air gra-
dient in water vapour concentration. If soil water becomes
scarce, plant water status worsens, leading to cascading
effects that can be severely adverse at both the leaf and
plant scales (Hsiao 1973; Porporato et al. 2001). To reduce
these risks, plants under water deficit reduce transpirational
water losses by reducing stomatal conductance. Moreover,
water stress hinders leaf internal transport of CO2, enzyme
activity and hence photosynthetic capacity (Ghannoum
2009; Lawlor & Tezara 2009). These so-called internal (met-
abolic and diffusive) limitations become predominant rela-
tive to stomatal limitation as water stress further increases
(Du et al. 1996; Galmes, Medrano & Flexas 2007; Tezara,
Driscoll & Lawlor 2008; Ghannoum 2009; Lawlor & Tezara
2009).
The complexity of these stomatal controls and feedbacks
on leaf carbon (C) assimilation and water loss poses a major
challenge to modelling stomatal and internal limitations on
photosynthesis under water stress. Empirical relationships
have been used to link photosynthetic rate, stomatal conduc-
tance and leaf (or soil) water status (Collatz et al. 1991;*Correspondence author. E-mail: [email protected]
� 2011 The Authors. Functional Ecology � 2011 British Ecological Society
Functional Ecology 2011 doi: 10.1111/j.1365-2435.2010.01822.x
Page 2
Friend 1995; Leuning 1995; Tuzet, Perrier & Leuning 2003;
Daly, Porporato & Rodriguez-Iturbe 2004; Siqueira, Katul &
Porporato 2008; Vico & Porporato 2008). More mechanistic
models link stomatal aperture to changes in the pressure gra-
dient along the soil–plant–atmosphere continuum or to
drought-related chemical signals from roots (Sperry 2000;
Dewar 2002; Gao et al. 2002; Buckley, Mott & Farquhar
2003). These models, however, require several parameters
that are not easily quantified across species.
The stomatal optimality hypothesis represents a viable
alternative to detailed mechanistic or empirical models of
stomatal responses to the environment. According to opti-
mality theory, stomatal conductance to CO2 (gC) is regulated
by the plant so as to maximize C assimilation during a finite
time interval, subject to a given water availability (Cowan
1977; Farquhar & Sharkey 1982; Hari et al. 1986). Over a
single day, soil moisture (i.e. the water availability con-
straint) varies much less than plant-atmosphere fluxes, which
fluctuate in response to high frequency environmental vari-
ability. As a consequence, the optimization problem is sim-
plified to the condition that the Lagrange multiplier is a
constant during a given day (Cowan & Farquhar 1977).
Here, we denote this Lagrange multiplier, representing the
marginal water use efficiency (WUE; i.e. the change in pho-
tosynthesis per unit of change in transpiration), as k, thusadopting the notation by Hari et al. (1986). Note that this
notation is the inverse of the definition used by Cowan &
Farquhar (1977). Once k is defined, the functional relation-
ship between stomatal conductance and environmental con-
ditions is readily obtained.
Several studies have confirmed that k is nearly constant
during a day (Hall & Schulze 1980; Fites & Teskey 1988;
Berninger & Hari 1993; Hari, Makela & Pohja 2000; but see
Thomas, Eamus & Bell 1999), whereas optimality can only
be achieved at time-scales of soil water changes if the Lag-
range multiplier k evolves in time (Cowan 1982, 1986;
Makela, Berninger & Hari 1996; Schymanski et al. 2009).
During a single dry-down event, changes in k can be calcu-
lated by using the initial amount of available soil water and
expected duration of the dry period. Both initial soil water
and duration of the dry-down are, however, highly variable
quantities, depending on the stochasticity of rainfall (Laio
et al. 2001; Porporato, Daly & Rodriguez-Iturbe 2004). This
makes the full analytical treatment of the optimization prob-
lem extremely complex (Cowan 1986). When the stochastici-
ty of rainfall depths is neglected (Cowan 1982; Makela,
Berninger & Hari 1996), k can be analytically shown to
increase in time during a dry-down because of decreasing soil
and plant water availability (solid line in Fig. 1). As higher kimplies decreased stomatal conductance (when other envi-
ronmental parameters are held constant), the predicted pat-
tern is consistent with the commonly observed decrease in
stomatal conductance at low soil moisture. Contrary to these
expectations, empirical estimates of k often show a decrease
under severe water stress (Farquhar, Schulze & Kuppers
1980b; Grieu, Guehl & Aussenac 1988) (data points and
dashed lines in Fig. 1).
The objective of this work is to assess how k changes as
a function of water availability for the plant, and discuss
inconsistencies between current optimization theories and
experimental evidence. To study the effects of water stress
on k, an existing simplified model of leaf gas exchange
that optimizes stomatal conductance to achieve maximal C
gain is revised. Values of k are estimated from gas
exchange data for nearly 50 species exposed to different
levels of water stress and atmospheric CO2. Using this
data base, a meta-analysis is performed on the response
patterns of leaf gas exchange to combined water stress and
CO2 availability.
Materials and methods
Ananalytical leaf gas exchangemodel is described and used to express
k as a function of measurable quantities (Section ‘Theory’). This
expression is then used to estimate k from data available in the litera-
ture for a variety of species under worsening water conditions (Sec-
tion ‘Data analysis’).
T H E O R Y
The leaf gas exchange model we employ is based on previous studies
(Hari et al. 1986; Lloyd & Farquhar 1994; Katul, Palmroth & Oren
2009; Katul, Manzoni, Palmroth and Oren, 2010) and thus will be
only briefly reviewed here, highlighting the approximations necessary
to address the effects of plant water status on leaf gas exchange. The
model accounts for water vapour and CO2 fluxes between a leaf and
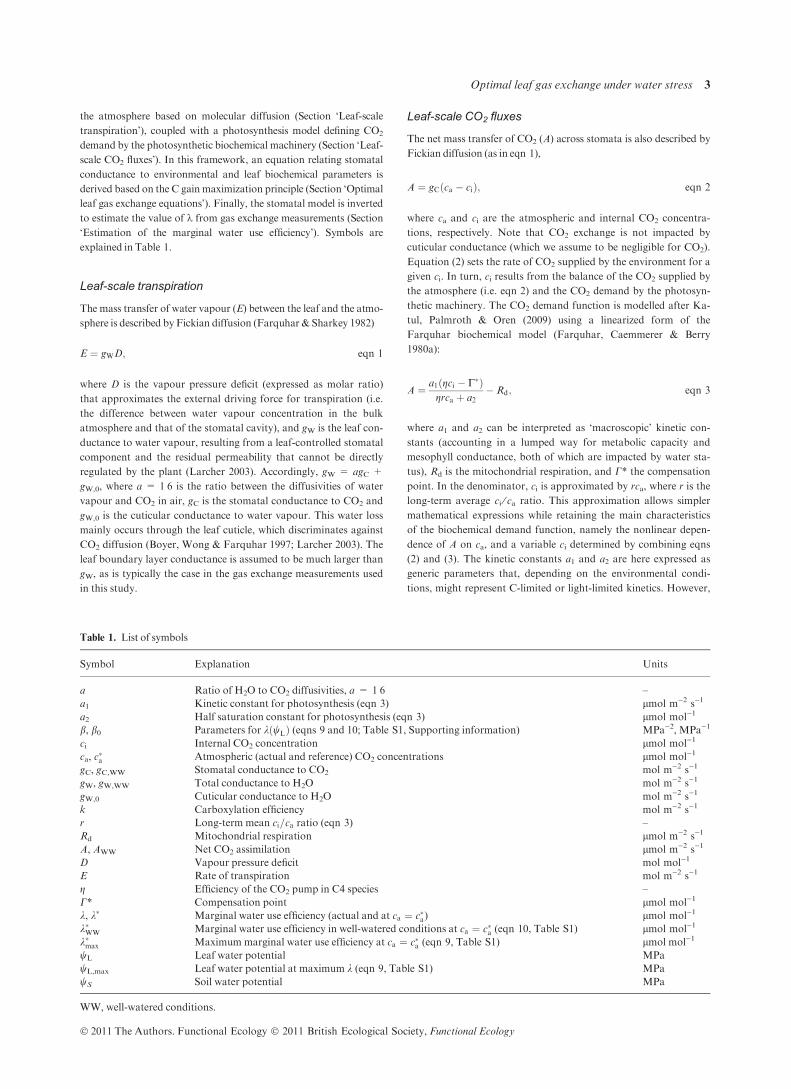
Fig. 1. Qualitative dependence of the marginal water use efficiency,
k, on leaf water potential, wL. Theoretical considerations suggest a
monotonic increase of k with water stress (solid line), while a
decrease is apparent from some estimates under severe stress ( and
dotted line, estimates for Corylus avellana from Farquhar, Schulze
& Kuppers 1980b; h and dashed line, estimates for Pseudotzuga
species from Grieu, Guehl & Aussenac 1988). Lines are qualita-
tively drawn to guide the eye.
� 2011 The Authors. Functional Ecology � 2011 British Ecological Society, Functional Ecology
2 S. Manzoni et al.
Page 3
the atmosphere based on molecular diffusion (Section ‘Leaf-scale
transpiration’), coupled with a photosynthesis model defining CO2
demand by the photosynthetic biochemical machinery (Section ‘Leaf-
scale CO2 fluxes’). In this framework, an equation relating stomatal
conductance to environmental and leaf biochemical parameters is
derived based on the C gain maximization principle (Section ‘Optimal
leaf gas exchange equations’). Finally, the stomatal model is inverted
to estimate the value of k from gas exchange measurements (Section
‘Estimation of the marginal water use efficiency’). Symbols are
explained in Table 1.
Leaf-scale transpiration
The mass transfer of water vapour (E) between the leaf and the atmo-
sphere is described by Fickian diffusion (Farquhar & Sharkey 1982)
E ¼ gWD; eqn 1
where D is the vapour pressure deficit (expressed as molar ratio)
that approximates the external driving force for transpiration (i.e.
the difference between water vapour concentration in the bulk
atmosphere and that of the stomatal cavity), and gW is the leaf con-
ductance to water vapour, resulting from a leaf-controlled stomatal
component and the residual permeability that cannot be directly
regulated by the plant (Larcher 2003). Accordingly, gW = agC +
gW,0, where a = 1Æ6 is the ratio between the diffusivities of water
vapour and CO2 in air, gC is the stomatal conductance to CO2 and
gW,0 is the cuticular conductance to water vapour. This water loss
mainly occurs through the leaf cuticle, which discriminates against
CO2 diffusion (Boyer, Wong & Farquhar 1997; Larcher 2003). The
leaf boundary layer conductance is assumed to be much larger than
gW, as is typically the case in the gas exchange measurements used
in this study.
Leaf-scale CO2 fluxes
The net mass transfer of CO2 (A) across stomata is also described by
Fickian diffusion (as in eqn 1),
A ¼ gC ca � cið Þ; eqn 2
where ca and ci are the atmospheric and internal CO2 concentra-
tions, respectively. Note that CO2 exchange is not impacted by
cuticular conductance (which we assume to be negligible for CO2).
Equation (2) sets the rate of CO2 supplied by the environment for a
given ci. In turn, ci results from the balance of the CO2 supplied by
the atmosphere (i.e. eqn 2) and the CO2 demand by the photosyn-
thetic machinery. The CO2 demand function is modelled after Ka-
tul, Palmroth & Oren (2009) using a linearized form of the
Farquhar biochemical model (Farquhar, Caemmerer & Berry
1980a):
A ¼ a1 gci � C�ð Þgrca þ a2
� Rd; eqn 3
where a1 and a2 can be interpreted as ‘macroscopic’ kinetic con-
stants (accounting in a lumped way for metabolic capacity and
mesophyll conductance, both of which are impacted by water sta-
tus), Rd is the mitochondrial respiration, and C* the compensation
point. In the denominator, ci is approximated by rca, where r is the
long-term average ci ⁄ ca ratio. This approximation allows simpler
mathematical expressions while retaining the main characteristics
of the biochemical demand function, namely the nonlinear depen-
dence of A on ca, and a variable ci determined by combining eqns
(2) and (3). The kinetic constants a1 and a2 are here expressed as
generic parameters that, depending on the environmental condi-
tions, might represent C-limited or light-limited kinetics. However,
Table 1. List of symbols
Symbol Explanation Units
a Ratio of H2O to CO2 diffusivities, a = 1Æ6 –
a1 Kinetic constant for photosynthesis (eqn 3) lmol m)2 s)1
a2 Half saturation constant for photosynthesis (eqn 3) lmol mol)1
b, b0 Parameters for kðwLÞ (eqns 9 and 10; Table S1, Supporting information) MPa)2, MPa)1
ci Internal CO2 concentration lmol mol)1
ca, c�a Atmospheric (actual and reference) CO2 concentrations lmol mol)1
gC, gC,WW Stomatal conductance to CO2 mol m)2 s)1
gW, gW,WW Total conductance to H2O mol m)2 s)1
gW,0 Cuticular conductance to H2O mol m)2 s)1
k Carboxylation efficiency mol m)2 s)1
r Long-term mean ci=ca ratio (eqn 3) –
Rd Mitochondrial respiration lmol m)2 s)1
A, AWW Net CO2 assimilation lmol m)2 s)1
D Vapour pressure deficit mol mol)1
E Rate of transpiration mol m)2 s)1
g Efficiency of the CO2 pump in C4 species –
C* Compensation point lmol mol)1
k, k� Marginal water use efficiency (actual and at ca ¼ c�a) lmol mol)1
k�WW Marginal water use efficiency in well-watered conditions at ca ¼ c�a (eqn 10, Table S1) lmol mol)1
k�max Maximum marginal water use efficiency at ca ¼ c�a (eqn 9, Table S1) lmol mol)1
wL Leaf water potential MPa
wL,max Leaf water potential at maximum k (eqn 9, Table S1) MPa
wS Soil water potential MPa
WW, well-watered conditions.
� 2011 The Authors. Functional Ecology � 2011 British Ecological Society, Functional Ecology
Optimal leaf gas exchange under water stress 3
Page 4
in what follows, a1 = Vc,max and a2 is the half saturation constant
for carboxylation, because all the gas exchange data used in the
meta-analysis have been acquired under saturating light. For the
sake of simplicity, we apply the same biochemical model to both C3
and C4 species, with different values of C* and g. The latter repre-sents the effect of the CO2 concentration mechanism: in C3 species
g = 1 (i.e. no CO2 pump), while in C4 species g > 1. For nota-
tional simplicity, we also group the kinetic parameters in eqn (3)
and obtain A ¼ k gci � C�ð Þ � Rd, where k ¼ a1ðgrca þ a2Þ�1 is the
carboxylation efficiency (Lloyd 1991), which may decrease under
low water potentials due to reduced metabolic rates.
Optimal leaf gas exchange equations
We can now derive expressions of optimal stomatal conductance and
photosynthesis under varying water availability. For simplicity, we
assume that changes in soil water are the only source of variability in
gas exchange (i.e. light and vapour pressure deficit are maintained
nearly constant during the soil dry-down), and that gC is the main
control variable for gas exchange (i.e. we neglect direct effects of cavi-
tation on gC). As explained in Appendix S1 (Supporting informa-
tion), these assumptions enable us to treat wL (which is often
measured) as a proxy of the root-zone integrated wS (seldom mea-
sured), and to use equations that are mathematically equivalent to
ones used under well-watered conditions.
Based on these assumptions, the condition for maximizing C
uptake for a givenwater availability can be expressed through the con-
trol variable gC as (Hari et al. 1986;Katul, Palmroth&Oren 2009),
@A
@gC� k
@E
@gC¼ 0; eqn 4
where k is the Lagrangian multiplier of the problem, mathemati-
cally equivalent to the marginal WUE,
k ¼ ð@A=@gCÞ=ð@E=@gCÞ
[we again stress that this definition of k is consistent with the nota-
tion of Hari et al. (1986) and Katul, Palmroth & Oren (2009), but is
the inverse of the definition used in Cowan & Farquhar (1977)].
To compute the optimal gas exchange rates, we first express A as a
function of gC by combining eqns (2) and (3),
A ¼ gC½kðgca � C�Þ � Rd�gC þ gk
: eqn 5
Differentiating eqns (1) and (5) the partial derivatives ¶E ⁄ ¶gC and
¶A ⁄ ¶gC are obtained, so that, for a given k, eqn (4) yields a simple
analytical expression for the optimal stomatal conductance as a func-
tion of environmental variables (i.e. D and ca), carboxylation effi-
ciency k, and respiration terms,
gC ¼ kg
ffiffiffiffiffiffiffiffiffiffiffiffiffiffiffiffiffiffiffiffiffiffiffiffiffiffiffiffiffiffiffiffiffiffigca � C� � Rd=k
gaDk
s� 1
!: eqn 6
When the dark respiration is neglected and g = 1 (C3 species), the
expression derived by Lloyd (1991) is recovered. When Rd > 0 and
C* � 0, eqn (6) leads to the formulation obtained by Hari &Makela
(2003). If all respiration terms can be neglected, eqn (6) simplifies to
the expression reported by Katul, Palmroth & Oren (2009). Combin-
ing eqns (5) and (6) also yields
A ¼ k gca � C� �ffiffiffiffiffiffiffiffiffiffiffiffiffiffiffiffiffiffiffiffiffiffiffiffiffiffiffiffiffiffiffiffiffiffiffiffiffiffiffiffiffiffiffiffiffiffiffiffiffigakDðgca � C� � Rd=kÞ
ph i� Rd: eqn 7
Our primary goal here is to estimate k, so eqns (5)–(7) are inverted
to provide an analytical expression for k as a function of measured A
and gC, as explained next.
Estimation of the marginal water use efficiency
In optimal control theory, k should change in time whenever the con-
straint to the optimization (in our case water availability) is dynamic
(e.g. Luenberger 1979).However, computing analytically the time tra-
jectory of k is complicated by the stochastic nature of the soil water
balance (Cowan 1982, 1986;Makela, Berninger &Hari 1996). Hence,
we use the definition of marginal WUE to estimate k from available
photosynthesis and stomatal conductance measurements, assuming
quasi-equilibrium conditions. That is, we consider soil moisture con-
stant over the time period of the gas exchangemeasurement (generally
less than an hour). This assumption allows us to estimate a series of
values for k as the soil dries and leaf water potential decreases.
As before, the partial derivatives ¶E ⁄ ¶gC and ¶A ⁄ ¶gC are obtained
from eqns (1) and (5). The carboxylation efficiency is expressed as
k(A, gC) by inverting eqn (5), that is, k is estimated as the slope of the
linearized A ) ci curve at the intersection with the supply curve. This
approximation allows closing the problem by only employing individ-
ual gas exchange measurements. More rigorous methods of approxi-
mating the carboxylation efficiency require measured A ) ci curves,
which are often not available at different water availabilities. The fea-
sibility of the method we use is discussed in Katul, Manzoni, Palm-
roth and Oren (2010). Based on the above assumptions, k is
computed from the definition ofmarginalWUE,
k ¼ A=gCð Þ2 1þ Rd=Að ÞaD ca þ Rd=gC � C�=gð Þ
¼WUE2 D aþ gW;0=gC� �2
1þ Rd=Að Þa ca þ Rd=gC � C�=gð Þ :
eqn 8
Lloyd et al. (1994) estimated k from gas exchange measurements
using a similar methodology, while an analogous expression for k(without respiration terms) was employed by Katul et al. (2010).
Equation (8) shows explicitly the linkage between the marginalWUE
and the flux-based instantaneous WUE (WUE = A ⁄E). Note that
no a priori dependence of k on leaf water status has been assumed or
imposed. Instead, changes in A and gC induced by water availability
(the main source of variability in gas exchange rates in this meta-anal-
ysis) completely determine the estimated values of k. Also, hereafter
we do not consider measurements where A < 0 because no optimal
stomatal control can be achieved when respiration exceeds gross C
uptake.
In the following, two assumptions regarding the cuticular conduc-
tance gW,0 are considered: (i) gW,0 = 0, so that gC in eqn (8) is equal
to the measured stomatal conductance to CO2, and (ii) gW,0 > 0, so
that gC is estimated from measured gW as gC ¼ ðgW � gW;0Þ=a.Because gW,0 does not appear in the first equality in eqn (8), these
assumptions only affect the interpretation of the gas exchange data,
but not the expression used to estimate k.
D A T A A N A LY S I S
Equation (8) was used to estimate k from two sets of gas exchange
experiments regarding (i) a single dry-down period (published data)
� 2011 The Authors. Functional Ecology � 2011 British Ecological Society, Functional Ecology
4 S. Manzoni et al.
Page 5
and (ii) several dry-down periods under field conditions along an
atmospheric CO2 gradient (unpublished data from the Lysimeter
CO2 Gradient experiment, LYCOG; see Fay et al. 2009 for details on
the experimental setup). We collected data sets including photosyn-
thesis, stomatal conductance and leaf water potential under well-
watered to severely water-stressed conditions in about 50 species from
a variety of environmental conditions (details and data are provided
inAppendix S2, Supporting information).
To estimate k, eqn (8), other thanmeasuredA and gC, requires esti-
mates for dark respiration and CO2 compensation point, which were
obtained fromGivnish (1988) and Leuning (1995), and Lloyd & Far-
quhar (1994), respectively, and were assumed not to vary with wL.
For C4 species, we assumed a fixed efficiency of the CO2 concentra-
tion mechanism, mathematically represented by a factor g � 25 that
increases ci to values occurring at the location of CO2 fixation
(Osmond,Winter & Ziegler 1975; Von Caemmerer 2000). Also, in C4
species, we assumedC* � 0 (Lloyd et al. 1994).
Values of water vapour conductance obtained through gas
exchange measurements were interpreted according to two contrast-
ing assumptions on cuticular conductance [i.e. negligible cuticular
conductance (i) gW,0 = 0 and (ii) gW,0 > 0], resulting in two different
patterns of estimated kðwLÞ relationships. Assuming negligible gW,0, kscales as the square ofWUE (eqn 8), which in turn generally increases
undermoderate water stress, but then decreases due tometabolic limi-
tations (Larcher 2003). It is then reasonable to describe this depen-
dence by means of a bell-shaped curve (equivalent to a parabola in
the semi-logarithmic plane) for kðwLÞ,
kðwLÞ ¼ k�max
cac�a
exp �b wL � wL;max
� �2h i; eqn 9
where wL,max (the leaf water potential at maximum k), k�max (the
maximummarginal WUE at a reference ca ¼ c�a ¼ 400 lmol mol)1)
and b [a measure of the peakedness of kðwLÞ] are fitting parameters.
Conversely, data sets where the expected decrease in WUE at very
negative wL was not apparent (resulting in b < 0 in eqn 9) were fit-
ted by an exponential function - formally equivalent to the one dis-
cussed below.
The second assumption on cuticular conductance (i.e. gW,0 > 0,
resulting in gW ¼ agC þ gW;0) implies that values of stomatal conduc-
tance that are calculated from gas exchange measurements overesti-
mate the conductance to CO2 (Boyer, Wong & Farquhar 1997). To
account for this effect, we set gW,0 to 90% of the minimum measured
gW and accordingly corrected gC in eqn (8). Under this assumption
the curvature of kðwLÞ disappears. A suitable empirical relationship
to fit the corrected gas exchange data is
k0ðwLÞ ¼ k�WW
cac�a
exp b0wL½ �; eqn 10
where k�WW (the marginal WUE in well-watered conditions at
ca ¼ c�a ¼ 400 lmol mol)1), and the slope parameter b0 are fitted to
the data.
The effect of ca on kwas assumed linear (Katul et al., 2010) in both
cases (eqns 9 and 10). This allows us to define a normalized marginal
WUE k� ¼ kc�a=ca that can be used to compare gas exchange data
from different atmospheric conditions.
Results
In this section, the overall patterns of the estimated marginal
WUE as a function of plant water status and atmospheric
CO2 concentration are explored across plant functional types
and climate conditions. We then show an example of a poten-
tial application of the model to describe leaf gas exchange
under water stress and contrast these findings with model
runs in which k is assumed to be constant.
V AR I A B I L I T Y O F k W I T H W A T E R ST AT U S A N D c a
An example of the variability of k with leaf water potential
estimated using eqn (8) is shown in Fig. 2. Under the assump-
tion that gW,0 = 0, k shows a concave downward pattern
with a maximum around wL = )5 MPa (filled symbols). In
contrast, when data are interpreted assuming gW,0 > 0, kincreases monotonically with increasing water stress (open
symbols). This change is because of the decreased values of
stomatal conductance to CO2 when wL is low and gW,0 > 0.
Because gC appears in the denominator of eqn (8), this results
in increased k at very negative potentials.
Most of the other analysed data sets follow similar pat-
terns, with a nonlinear dependence of k on wL if gW,0 = 0
and a linear increase of k with water stress if gW,0 > 0. Over-
all, eqn (9) (assuming gW,0 = 0) and eqn (10) (gW,0 > 0)
capture most of the variability in the relationship between kand wL (Table S1), although the values of the different
parameters are highly variable among species. These results
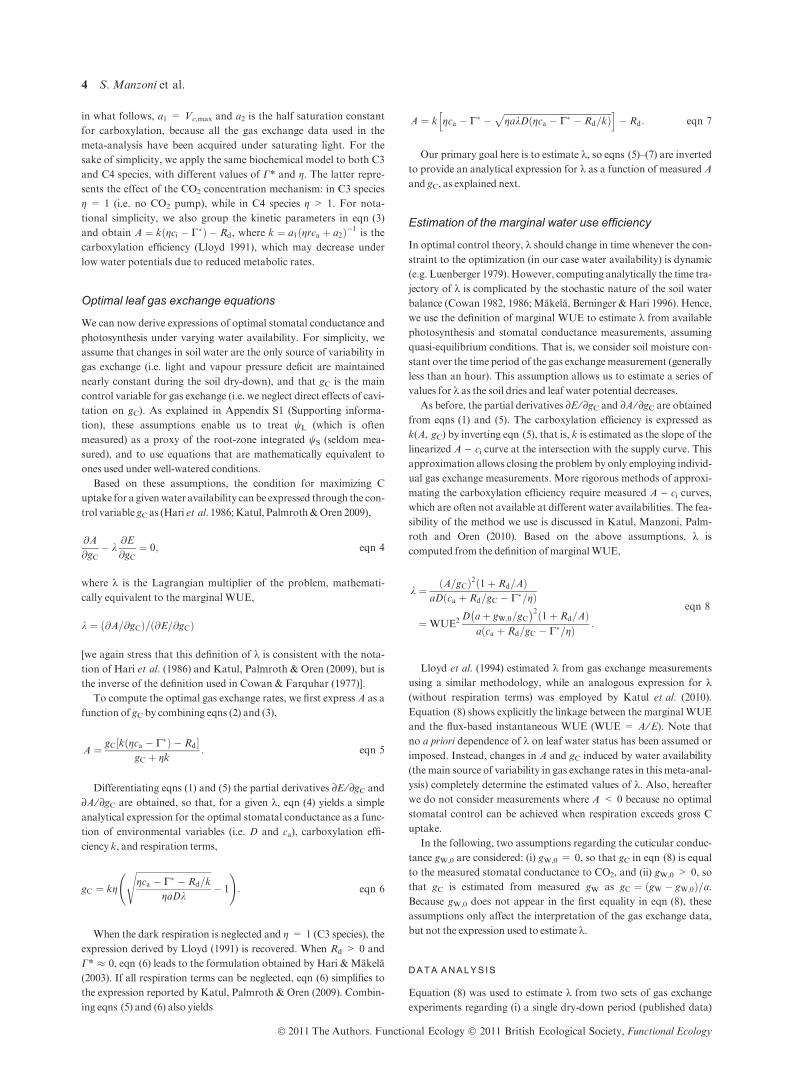
are summarized in Fig. 3, where the normalization of both
marginal WUE and leaf water potential cause all the data to
collapse on a single parabola (Fig. 3a; gW,0 = 0) and a single
line (Fig. 3b; gW,0 > 0) on the semi-logarithmic plane. Few
data sets (mainly those limited to a small range in wL) do not
show the full nonlinear pattern in k assuming gW,0 = 0.
These data can be described by an exponential function
–8 –6 –4 –2 0102
103
104
105
yL (MPa)
l*(µ
mol
mol
−1 )
gW,0
= 0
gW,0
> 0
Fig. 2. Example of variations in k� (marginal water use efficiency at
c�a ¼ 400 lmol mol)1) with leaf water status when cuticular conduc-
tance is neglected (gW,0 = 0) or accounted for (gW,0 > 0). Data for
Artemisia tridentata are from Delucia et al. (1989); regression statis-
tics are reported in Table S1 (Supporting information).
� 2011 The Authors. Functional Ecology � 2011 British Ecological Society, Functional Ecology
Optimal leaf gas exchange under water stress 5
Page 6
formally similar to eqn (10) (see details in Table S1, Sup-
porting information). When gW,0 > 0, few data sets exhibit
a moderate decrease in k with water stress (data points cor-
responding to bwL > 0 in Fig. 3b). In one data set (Pinus
contorta, not considered in the following analyses), the
decrease in k at low wL is strong despite accounting for
gW,0. Similar patterns in k are also found when we fit
eqns (9) and (10) to wS (for the few data sets that provide it)
instead of wL (results not shown).
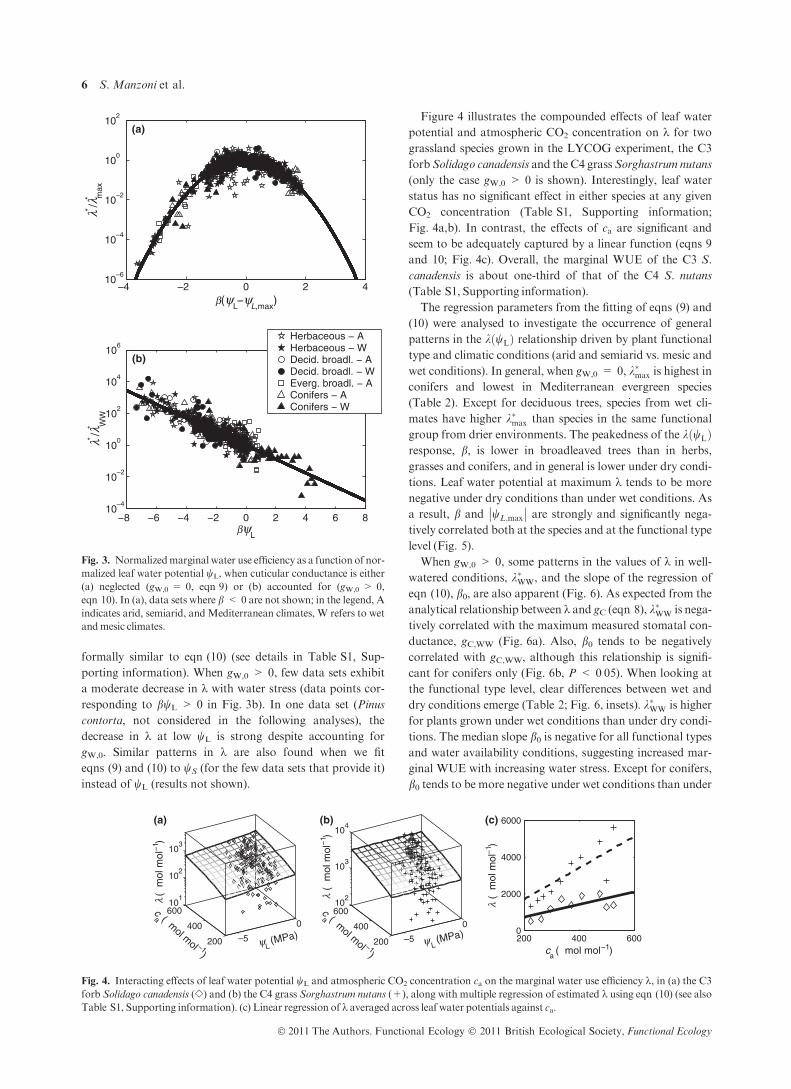
Figure 4 illustrates the compounded effects of leaf water
potential and atmospheric CO2 concentration on k for two
grassland species grown in the LYCOG experiment, the C3
forbSolidago canadensis and the C4 grass Sorghastrum nutans
(only the case gW,0 > 0 is shown). Interestingly, leaf water
status has no significant effect in either species at any given
CO2 concentration (Table S1, Supporting information;
Fig. 4a,b). In contrast, the effects of ca are significant and
seem to be adequately captured by a linear function (eqns 9
and 10; Fig. 4c). Overall, the marginal WUE of the C3 S.
canadensis is about one-third of that of the C4 S. nutans
(Table S1, Supporting information).
The regression parameters from the fitting of eqns (9) and
(10) were analysed to investigate the occurrence of general
patterns in the kðwLÞ relationship driven by plant functional
type and climatic conditions (arid and semiarid vs. mesic and
wet conditions). In general, when gW,0 = 0, k�max is highest in
conifers and lowest in Mediterranean evergreen species
(Table 2). Except for deciduous trees, species from wet cli-
mates have higher k�max than species in the same functional
group from drier environments. The peakedness of the kðwLÞresponse, b, is lower in broadleaved trees than in herbs,
grasses and conifers, and in general is lower under dry condi-
tions. Leaf water potential at maximum k tends to be more
negative under dry conditions than under wet conditions. As
a result, b and wL;max
�� �� are strongly and significantly nega-
tively correlated both at the species and at the functional type
level (Fig. 5).
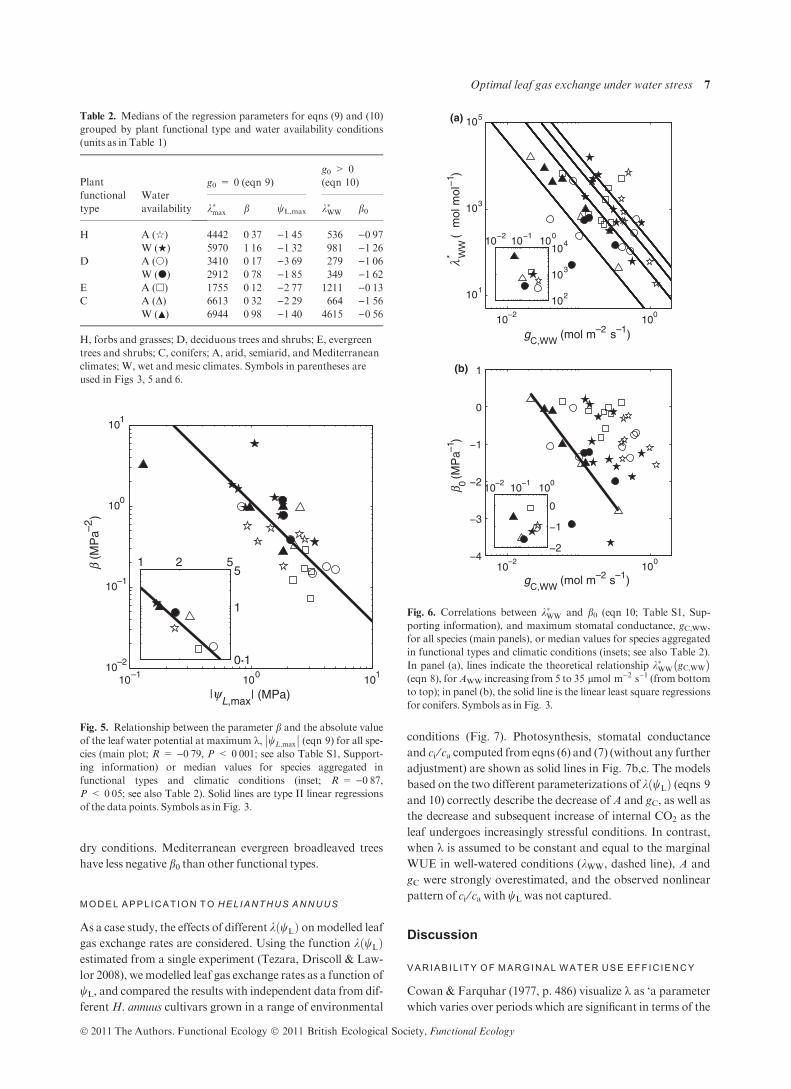
When gW,0 > 0, some patterns in the values of k in well-
watered conditions, k�WW, and the slope of the regression of
eqn (10), b0, are also apparent (Fig. 6). As expected from the
analytical relationship between k and gC (eqn 8), k�WW is nega-
tively correlated with the maximum measured stomatal con-
ductance, gC,WW (Fig. 6a). Also, b0 tends to be negatively
correlated with gC,WW, although this relationship is signifi-
cant for conifers only (Fig. 6b, P < 0Æ05). When looking at
the functional type level, clear differences between wet and
dry conditions emerge (Table 2; Fig. 6, insets). k�WW is higher
for plants grown under wet conditions than under dry condi-
tions. The median slope b0 is negative for all functional typesand water availability conditions, suggesting increased mar-
ginal WUE with increasing water stress. Except for conifers,
b0 tends to be more negative under wet conditions than under
−8 −6 −4 −2 0 2 4 6 810
–4
10–2
100
102
104
106
byL
l /l*
WW
*
(b)
Herbaceous − AHerbaceous − WDecid. broadl. − ADecid. broadl. − WEverg. broadl. − AConifers − AConifers − W
–4 –2 0 2 410
–6
10–4
10–2
100
102
b(yL−y
L,max)
l /l*
max
*
(a)
Fig. 3. Normalizedmarginal water use efficiency as a function of nor-
malized leaf water potential wL, when cuticular conductance is either
(a) neglected (gW,0 = 0, eqn 9) or (b) accounted for (gW,0 > 0,
eqn 10). In (a), data sets where b < 0 are not shown; in the legend, A
indicates arid, semiarid, and Mediterranean climates, W refers to wet
andmesic climates.
–5
0
200
400
60010
1
102
103
yL(MPa) yL
(MPa)
(a)
ca (µmol mol −1
)
l(µ
mol
mol
−1 )
200 400 6000
2000
4000
6000
ca
(µmol mol−1)
l (µ
mol
mol
−1 )
(c)
–5
0
200
400
60010
2
103
104
(b)
ca (µmol mol −1
)
l (µ
mol
mol
−1 )
Fig. 4. Interacting effects of leaf water potential wL and atmospheric CO2 concentration ca on the marginal water use efficiency k, in (a) the C3
forb Solidago canadensis (e) and (b) the C4 grass Sorghastrum nutans (+), along with multiple regression of estimated k using eqn (10) (see also
Table S1, Supporting information). (c) Linear regression of k averaged across leaf water potentials against ca.
� 2011 The Authors. Functional Ecology � 2011 British Ecological Society, Functional Ecology
6 S. Manzoni et al.
Page 7
dry conditions. Mediterranean evergreen broadleaved trees
have less negative b0 than other functional types.
M O D E L A P P L I C A T I O N T O H EL I A N T H U S A N N U U S
As a case study, the effects of different kðwLÞ onmodelled leaf
gas exchange rates are considered. Using the function kðwLÞestimated from a single experiment (Tezara, Driscoll & Law-
lor 2008), wemodelled leaf gas exchange rates as a function of
wL, and compared the results with independent data from dif-
ferentH. annuus cultivars grown in a range of environmental
conditions (Fig. 7). Photosynthesis, stomatal conductance
and ci ⁄ ca computed from eqns (6) and (7) (without any further
adjustment) are shown as solid lines in Fig. 7b,c. The models
based on the two different parameterizations of kðwLÞ (eqns 9and 10) correctly describe the decrease of A and gC, as well as
the decrease and subsequent increase of internal CO2 as the
leaf undergoes increasingly stressful conditions. In contrast,
when k is assumed to be constant and equal to the marginal
WUE in well-watered conditions (kWW, dashed line), A and
gC were strongly overestimated, and the observed nonlinear
pattern of ci ⁄ ca withwL was not captured.
Discussion
V AR I A B I L I T Y O F M A R G I N A L W A T E R U S E E F F I C I E N C Y
Cowan & Farquhar (1977, p. 486) visualize k as ‘a parameter
which varies over periods which are significant in terms of the
Table 2. Medians of the regression parameters for eqns (9) and (10)
grouped by plant functional type and water availability conditions
(units as in Table 1)
Plant
functional
type
Water
availability
g0 = 0 (eqn 9)
g0 > 0
(eqn 10)
k�max b wL,max k�WW b0
H A (q) 4442 0Æ37 )1Æ45 536 )0Æ97W (w) 5970 1Æ16 )1Æ32 981 )1Æ26
D A (s) 3410 0Æ17 )3Æ69 279 )1Æ06W (d) 2912 0Æ78 )1Æ85 349 )1Æ62
E A (h) 1755 0Æ12 )2Æ77 1211 )0Æ13C A (D) 6613 0Æ32 )2Æ29 664 )1Æ56
W ( ) 6944 0Æ98 )1Æ40 4615 )0Æ56
H, forbs and grasses; D, deciduous trees and shrubs; E, evergreen
trees and shrubs; C, conifers; A, arid, semiarid, and Mediterranean
climates; W, wet and mesic climates. Symbols in parentheses are
used in Figs 3, 5 and 6.
10–1
100
101
10–2
10–1
100
101
b (M
Pa–2
)
|yL,max
| (MPa)
1 2 5
0··1
1
5
Fig. 5. Relationship between the parameter b and the absolute value
of the leaf water potential at maximum k, wL;max
�� �� (eqn 9) for all spe-
cies (main plot; R = )0Æ79, P < 0Æ001; see also Table S1, Support-
ing information) or median values for species aggregated in
functional types and climatic conditions (inset; R = )0Æ87,P < 0Æ05; see also Table 2). Solid lines are type II linear regressions
of the data points. Symbols as in Fig. 3.
10−2
100
101
103
105
lW
W*
(µm
ol m
ol−
1 )
(a)
10–2
100−4
−3
−2
−1
0
1
b 0(M
Pa–1
)
gC,WW
(mol m–2 s–1)
gC,WW
(mol m–2 s–1)
(b)
10−2
10−1
100
−2
−1
0
10−2
10−1
100
102
103
104
Fig. 6. Correlations between k�WW and b0 (eqn 10; Table S1, Sup-
porting information), and maximum stomatal conductance, gC,WW,
for all species (main panels), or median values for species aggregated
in functional types and climatic conditions (insets; see also Table 2).
In panel (a), lines indicate the theoretical relationship k�WW gC;WW
� �(eqn 8), forAWW increasing from 5 to 35 lmol m)2 s)1 (from bottom
to top); in panel (b), the solid line is the linear least square regressions
for conifers. Symbols as in Fig. 3.
� 2011 The Authors. Functional Ecology � 2011 British Ecological Society, Functional Ecology
Optimal leaf gas exchange under water stress 7
Page 8
relative growth and ontogenetic development of a plant, and
is affected also by changes in the water relations insofar as
they are determined by the state of water in the ground’. Opti-
mal control theory, consistently with the above view, predicts
that k should change in time when the constraint to the opti-
mization (e.g. water availability) changes depending on the
control variable itself (e.g. stomatal conductance) (Luenber-
ger 1979). Stomatal optimization theory predicts that kincreases under water stress because of increased risk of tissue
damage (Cowan 1982; Makela, Berninger & Hari 1996).
These theoretical results were obtained under strong simplify-
ing assumptions regarding the stochastic nature of rainfall
(which plays a role in the formulation of the optimization
problem) and neglected cuticular conductance and metabolic
limitations to photosynthesis because of water stress. More
recently, k was related to soil water availability through plant
hydraulic constraints (Konrad, Roth-Nebelsick & Grein
2008), or assuming a power law scaling with wS (Schymanski
et al. 2009).
Instead of predicting (or assuming) a priori the changes in kalong water availability gradients, here we estimated a ‘mac-
roscopic’ marginal WUE from observations, thus implicitly
accounting for all physiological effects of water availability
on photosynthesis and transpiration. A similar approach has
been adopted to explore the variations of k across biomes
(Lloyd et al., 1994), over a range of wet to dry climates (Palm-
roth et al. 1999), during a growing season (Hari & Makela
2003), and in response to CO2 enrichment (Katul et al.,
2010), and water stress (Grieu, Guehl & Aussenac 1988).
Fewer works have focused on changes in k during ontogeny.
Buckley (2008) assumed that the marginal WUE changes at
this time-scale in concert with marginal nitrogen and light use
efficiencies, thus implying that k must increase under elevated
ca. Here, we focus on drought-related changes in k. We can-
not investigate long-term changes in k because of slowly
evolving climatic conditions during growth, because most of
the available data are obtained from potted plants grown
under controlled conditions until the initiation of the experi-
mental drought.
We also neglected the potential contribution of direct
hydraulic limitations on gC (i.e. we assumed that gC effectively
acts as a free control variable). This could be expected to be
critical in our analysis, since gC could be bound to lower-
than-optimal values as transpiration reaches the cavitation
threshold because of strictly hydraulic limitations (Buckley
2005). Indeed, amodel based on the assumption that k should
reflect the maximum transpiration rate allowed by the soil–
leaf hydraulic system has been recently proposed (Konrad,
Roth-Nebelsick & Grein 2008). Nevertheless, while hydraulic
constraints are certainly involved in the regulation of gC, it
should also be taken into account that evolution selected for a
coordinated response of both plant tissues and stomata,
resulting in simultaneous decrease of plant and stomatal con-
ductances as the soil dries (Sperry 2000; Brodribb et al. 2003).
This coordinated change (as opposed to gS fi L driving gC)
allows us to model gC as a free control variable even in the
presence of some degree of cavitation. It is true, however, that
in extreme cases where runaway cavitation occurs gC cannot
be considered anymore a free control variable. In such cases
(likely seldom occurring in the data sets used because of mild
vapor pressure deficit), our estimates of k would be overesti-
mated, as they would reflect suboptimal conditions (e.g. gClower than the optimal one) (Buckley 2005).
Changes in k assuming negligible cuticular conductance
In contrast to previous studies on k, we considered two alter-
native assumptions for cuticular conductance to water
vapour (gW,0): (i) a perfectly regulated stomatal conductance
(i.e. gW,0 = 0), and (ii) a non-zero water losses through the
cuticle (gW,0 > 0). When assuming gW,0 = 0, we found an
increase in k under mild water stress, followed by a decrease
under severe water stress (Fig. 3a). The complete nonlinear
pattern appears when gas exchange is sampled throughout
the dry-down, including severe water limitation. The nonlin-
ear pattern may explain why others have reported different
responses of k to water stress. Some studies estimated an
increase in k with wL or decreasing soil water (Hall & Schulze
1980; Berninger & Hari 1993; Thomas, Eamus & Bell 1999;
Kolari, Nikinmaa & Hari 2008), and others a decrease (Far-
quhar, Schulze & Kuppers 1980b), or no significant response
(Xu & Baldocchi 2003). In one case, a nonlinear, concave
response similar to the results in Fig. 3a was found (Grieu,
Guehl & Aussenac 1988). In addition, modelling studies have
shown that k must increase when soil water decreases to cap-
ture observed trends in gas exchange (Schymanski et al. 2008,
2009) and wood isotopic composition (Arneth et al. 2002).
Recalling that k �WUE2 (eqn 8), the observed decline
under severe stress is not surprising. A decrease in WUE is in
fact expected because internal (metabolic and diffusive) limi-
tations on photosynthesis become predominant over stoma-
tal control (Tezara et al. 1999; Lawlor et al., 2009). The result
is the frequently observed concave relationship between
WUE and leaf water potential (Delucia & Heckathorn 1989;
Ni & Pallardy 1991; Kalapos, Van Den Boogaard & Lambers
1996; Medrano, Flexas & Galmes 2009). Analogously, the
nonlinear shape of kðwLÞ shown in Fig. 3a suggests that a
transition from stomatal control on photosynthesis (increas-
ing k) to internal controls (decreasing k) occurs around
wL,max. The parameter kmax can thus be interpreted as a nor-
malized measure of the maximumWUE that is achieved dur-
ing the transition from well-watered to water-stressed
conditions. It should be noted, however, that gas exchange
measurements have traditionally been interpreted assuming
gW,0 = 0 and the estimated WUE are affected by this
assumption.
Changes in k assuming non-negligible cuticular conduc-
tance
Observations suggest that in general gW,0 is different from
zero (Kerstiens 1996; Boyer, Wong & Farquhar 1997; Lar-
cher 2003), resulting in patterns in k that are different from
the case gW,0 = 0. Specifically, the concavity observed when
� 2011 The Authors. Functional Ecology � 2011 British Ecological Society, Functional Ecology
8 S. Manzoni et al.
Page 9
assuming gW,0 = 0 disappears and k increases monotonically
with more negative wL. The monotonic increase of k found
under this assumption is consistent with previous theoretical
predictions based on perfect stomatal control. Hence, correct-
ing the gas exchange datawith gW,0 > 0 to obtain an estimate
of the ‘true’ stomatal conductance allows recovering the
shape of kðwLÞ predicted by optimization theory. The specific
assumption on gW,0 is thus critical to test the optimality
hypothesis along gradients of water availability. Both formu-
lations, however, yield realistic simulations of water status
effects on leaf gas exchange (Fig. 7).
Atmospheric CO2 and other sources of variability
The marginalWUEwas found to increase along a gradient of
ca from �250 to �500 lmol mol)1 (Fig. 4), in agreement
with previous studies (Arneth et al. 2002; Buckley 2008; Ka-
tul et al., 2010). This pattern is also consistent with the higher
WUE often found under elevated CO2 (Anderson et al. 2001;
Polley, Johnson&Derner 2002).
Part of the variability in k is caused by other factors in addi-
tion to wL and ca. Natural fluctuations in leaf physiology and
biochemistry, light environment, and nutrient availability
during canopy development may contribute to leaf-to-leaf
and temporal variability in k (the coefficient of variation of kfor a given wL is in the range 0Æ2–0Æ9 for the LYCOG data).
As a consequence, hypothesized effects of atmospheric CO2
and leaf water status on k emerge only in an ensemble average
sense under field conditions. That is, leaf-scale dynamics on
average follow the patterns described by eqns (9) and (10),
but k of individual leaves may vary widely (Fig. 4). Similar
results have been found in a pine forest at ambient and ele-
vated CO2 concentrations, where the coefficient of variation
of kwas about 0Æ4 (Katul et al., 2010).
E F F E C T S OF P L A N T F U N C T I O N A L T Y P E A N D C L I M A T E
O N k (w L )
The parameters of the kðwLÞ curves are highly species-specific(Table S1, Supporting information); however, when grouped
by plant functional type and climate, some patterns do
emerge (Figs 5 and 6; Table 2). In general, conifers have
higher k�max and k�WW than other functional types in any given
climate. At the opposite end of the spectrum, deciduous
broadleaved trees have lower k�max and k�WW than most func-
tional types, excluding evergreen Mediterranean broadleaved
species that have even lower k�max.Moreover, for a given func-
tional type, k�max and k�WW tend to be higher for plants grown
under wet conditions than under dry conditions. Our results
can be compared with some of the biome-level estimates of kreported by Lloyd & Farquhar (1994), in particular for bio-
mes characterized by relatively uniform plant functional
types. For conifers and grasses (in mesic or wet climates), we
found median k�WW � 4600 and 1000 lmol mol)1, respec-
tively (Table 2), which compare relatively well with k � 4000
and 1430 lmol mol)1 calculated by Lloyd & Farquhar
(1994). In contrast, our estimates of k�WW for rice and broad-
leaved deciduous trees (Table S1, Supporting information)
are, respectively, higher and lower than the values reported
by Lloyd & Farquhar (1994), likely because of intraspecific
−4 −2 0
0
0·5
1A
/AW
W
(a)
−4 −2 00
0·2
0·4
0·6
0·8
1
g C(m
ol m
−2
s−1 )
(b)
l(yL) (Eq. (9))
l(yL) (Eq. (10))
l(yL) = l
WW
−4 −2 00·4
0·6
0·8
1
1·2
yL(MPa)
c i/ca
(c)
−4 −2 00
0·5
1
yL (MPa)
a 1/a1,
WW
Fig. 7. Leaf biochemical and physiological responses to water stress
(in terms ofwL) inHelianthus annuus under light-saturated conditions
(i.e. a1 = Vc,max). (a) Rate of photosynthesis and maximum
carboxylation rate (inset), both expressed as a fraction of
maximum (Vc,max data are estimated from published A ) ci curves,
Vc;max ¼ 90� exp ðwL=1�7Þ2�3, R2 = 0Æ96); (b) stomatal conduc-
tance; (c) ratio of internal to atmospheric CO2 concentrations (data
points computed using eqn 7 from Farquhar et al., 1982). Model
results are obtained using eqns (6) and (7) (and setting a minimum gCwhere A < 0), the empirical function a1 ¼ Vc;maxðwLÞ from panel
(a), and different formulations for kðwLÞ, as detailed in the legend.
Gas exchange data are from Gimenez, Mitchell & Lawlor (1992),
Tezara et al. (1999) and Tezara, Driscoll & Lawlor (2008) (•, D and
s, respectively).
� 2011 The Authors. Functional Ecology � 2011 British Ecological Society, Functional Ecology
Optimal leaf gas exchange under water stress 9
Page 10
and climatic differences. Lower k under dry conditions is also
consistent with the less conservative water use strategies (low
WUE) employed by annuals and shrubs from arid ecosystems
to achieve competitive advantages in face of limited water
availability (DeLucia & Heckathorn 1989, Delucia & Schle-
singer 1991) as opposed to more conservative water use (high
WUE) in drought-sensitive species from mesic ecosystems.
The variability of the parameters in the kðwLÞ curves acrossspecies can thus be interpreted as the long-term result of com-
petition strategies, while the shape of kðwLÞ describes the
responses of a single species to short-term changes in water
availability.
The median of wL,max for a given functional type is more
negative under dry than under wet growing conditions
(Fig. 5; Table 2). This suggests that the maximum WUE in
dry climates is achieved at relatively lower water availabilities
than in wet climates, possibly because of higher drought resis-
tance and delayed effects of water stress on the photosyn-
thetic machinery in drought-adapted species. In contrast,
conifers and deciduous broadleaved trees growing in mesic
ecosystems tend to transition from stomatal to internal limi-
tations at less negative leaf water potential (Larcher 2003).
ThewL,max in herbaceous species from dry climates is less neg-
ative than in other functional groups, suggesting low drought
resistance, while drought avoidance (e.g. dormancy or short
growing period coincident with the rainy season) could be a
more effective strategy under such conditions (Snyman, Ven-
ter & Vanrensburg 1997; Larcher 2003). It is also interesting
to note that, in all functional types, species from dry ecosys-
tems are characterized by lower curvature of kðwLÞ (i.e. lowerb; see Fig. 5) than species fromwet ecosystems, indicating rel-
atively small changes in WUE under water stress. The result-
ing negative correlation between wL;max
�� �� and b thus hints at a
consistent pattern of high drought resistance and small
changes in WUE in species growing under dry conditions, as
opposed to low resistance and large changes in WUE in spe-
cies adapted tomoremesic conditions.
Conclusions
We analysed leaf gas exchange observations under well-
watered towater-limited conditions to test the hypothesis that
the marginal WUE, k, increases with water stress. We first
assumed that plants can perfectly control water losses (i.e. we
neglected cuticular water losses). Under this assumption, kwas found to increase under mild water stress as previously
hypothesized, while it decreased under severe water stress due
to stronger internal limitations to photosynthesis, differently
from predictions by previous theoretical work. In contrast,
when considering cuticular conductance, k increases mono-
tonically with decreasing water availability, consistently with
optimization theory. The parameters that describe the empiri-
cal kðwLÞ relationships are species-specific, but significant
patterns emerge when species are grouped according to func-
tional type and climate, allowing us to interpret changes in
marginalWUE in terms of plant strategies to cope with water
stress.
Our results highlight the need to revise optimality models
of gas exchange by accounting for leaf internal limitations
under water stress and the presence of water loss pathways
that cannot be controlled by stomata. As a next step, leaf
water potential is being included in a dynamic manner, by
coupling transpiration to soil moisture and atmospheric con-
ditions (Manzoni et al. 2010). By adding the indirect effects of
stomatal conductance on leaf (and canopy) gas exchange and
energy balance the optimization problem becomes more com-
plicated (as also explained in Appendix S1, Supporting infor-
mation), precluding explicit analytical solutions (Buckley,
Miller & Farquhar 2002; Schymanski et al. 2009). Despite
this increased complexity, this coupled model allows testing
the optimality hypothesis at the canopy scale and describing
vegetation dynamics under field conditions.
Acknowledgements
This research was partially supported by the U.S. Department of Agriculture
(USDA grant 58-6206-7-029), by the United States Department of Energy
(DOE) through the Office of Biological and Environmental Research (BER)
Terrestrial Carbon Processes (TCP) program (FACE and NICCR grants:
DE-FG02-95ER62083, DE-FC02-06ER64156), and by the National Science
Foundation (NSF-EAR 0628342, NSF-EAR 0635787). A.P. gratefully
acknowledges the support of the Landolt & Cie visiting Chair ‘Innovative
strategies for a sustainable future’ at the Ecole Polytechnique Federale de
Lausanne (EPFL), Lausanne, Switzerland. We also thank Susan Schwinning
and Danielle Way for their comments to an earlier version of the manuscript,
and Stan Schymanski and an anonymous reviewer for their constructive
critiques.
References
Anderson, L.J., Maherali, H., Johnson, H.B., Polley, H.W. & Jackson, R.B.
(2001) Gas exchange and photosynthetic acclimation over subambient to
elevated CO2 in a C-3-C-4 grassland.Global Change Biology, 7, 693–707.
Arneth, A., Lloyd, J., Santruckova, H., Bird, M., Grigoryev, S., Kalaschnikov,
Y.N., Gleixner, G. & Schulze, E.D. (2002) Response of central Siberian
Scots pine to soil water deficit and long-term trends in atmospheric CO2 con-
centration.Global Biogeochemical Cycles, 16, 1005.
Berninger, F. & Hari, P. (1993) Optimal regulation of gas-exchange – evidence
from field data.Annals of Botany, 71, 135–140.
Boyer, J.S., Wong, S.C. & Farquhar, G.D. (1997) CO2 and water vapor
exchange across leaf cuticle (epidermis) at various water potentials. Plant
Physiology, 114, 185–191.
Brodribb, T.J., Holbrook,N.M., Edwards, E.J. &Gutierrez,M.V. (2003) Rela-
tions between stomatal closure, leaf turgor and xylem vulnerability in eight
tropical dry forest trees.Plant Cell and Environment, 26, 443–450.
Buckley, T.N. (2005) The control of stomata by water balance. New Phytolo-
gist, 168, 275–291.
Buckley, T.N. (2008) The role of stomatal acclimation inmodelling tree adapta-
tion to highCO2. Journal of Experimental Botany, 59, 1951–1961.
Buckley, T.N., Miller, J.M. & Farquhar, G.D. (2002) The mathematics of
linked optimisation for water and nitrogen use in a canopy. Silva Fennica,
36, 639–669.
Buckley, T.N., Mott, K.A. & Farquhar, G.D. (2003) A hydromechanical and
biochemical model of stomatal conductance.Plant Cell and Environment, 26,
1767–1785.
Collatz, G.J., Ball, J.T., Grivet, C. & Berry, J.A. (1991) Physiological and envi-
ronmental-regulation of stomatal conductance, photosynthesis and transpi-
ration – a model that includes a laminar boundary-layer. Agricultural and
ForestMeteorology, 54, 107–136.
Cowan, I. (1977) Stomatal behavior and environment. Advances in Botanical
Research, 4, 117–228.
Cowan, I. (1982) Regulation of water use in relation to carbon gain in higher
plants.Physiological Plant Ecology II.Water Relations and Carbon Assimila-
tion (ed. O.E. Lange, P.S. Nobel, C.B. Osmond & H. Ziegler), pp. 589–614.
Springer-Verlag, Berlin.
� 2011 The Authors. Functional Ecology � 2011 British Ecological Society, Functional Ecology
10 S. Manzoni et al.
Page 11
Cowan, I. (1986) Economics of carbon fixation in higher plants. On the Econ-
omy of Plant Form and Function (ed. T.J. Givnish), pp. 133–170. Cambridge
University Press, Cambridge.
Cowan, I. & Farquhar, G.D. (1977) Stomatal function in relation to leaf metab-
olism an environment. Integration of Activity in the Higher Plants. Symposia
of the Society of Experimental Biology (ed. D.H. Jennings), pp. 471–505.
CambridgeUniversity Press, Cambridge.
Daly, E., Porporato, A. & Rodriguez-Iturbe, I. (2004) Coupled dynamics of
photosynthesis, transpiration, and soil water balance. Part I: Upscaling from
hourly to daily level. Journal of Hydrometeorology, 5, 546–558.
Delucia, E.H. & Heckathorn, S.A. (1989) The effect of soil drought on water-
use efficiency in a contrasting Great-Basin desert and Sierran montane spe-
cies.Plant Cell and Environment, 12, 935–940.
Delucia, E.H. & Schlesinger, W.H. (1991) Resource-use efficiency and
drought tolerance in adjacent Great-Basin and Sierran plants. Ecology, 72,
51–58.
Dewar, R.C. (2002) The Ball-Berry-Leuning and Tardieu-Davies stomatal
models: synthesis and extension within a spatially aggregated picture of
guard cell function.Plant Cell and Environment, 25, 1383–1398.
Du, Y.C., Kawamitsu, Y., Nose, A., Hiyane, S., Murayama, S., Wasano, K. &
Uchida, Y. (1996) Effects of water stress on carbon exchange rate and activi-
ties of photosynthetic enzymes in leaves of sugarcane (Saccharum sp). Aus-
tralian Journal of Plant Physiology, 23, 719–726.
Farquhar, G.D., Caemmerer, S.V. & Berry, J.A. (1980a) A biochemical-model
of photosynthetic CO2 assimilation in leaves of C-3 species. Planta 149, 78–
90.
Farquhar, G.D., Schulze, E.D. & Kuppers, M. (1980b) Responses to humidity
by stomata ofNicotiana glauca L and Corylus avellana L are consistent with
the optimization of carbon-dioxide uptake with respect to water-loss. Aus-
tralian Journal of Plant Physiology, 7, 315–327.
Farquhar, G.D. & Sharkey, T.D. (1982) Stomatal conductance and photosyn-
thesis. Annual Review of Plant Physiology and Plant Molecular Biology, 33,
317–345.
Fay, P.A., Kelley, A.M., Procter, A.C., Hui, D., Jin, V.L., Jackson, R.B., John-
son, H.B. & Polley, H.W. (2009) Primary productivity and water balance of
grassland vegetation on three soils in a continuous CO2 gradient: initial
results from the lysimeter CO2 gradient experiment. Ecosystems, 12, 699–
714.
Fites, J.A. &Teskey, R.O. (1988) CO2 andwater-vapor exchange ofPinus taeda
in relation to stomatal behavior - Test of an optimization hypothesis. Cana-
dian Journal of Forest Research-Revue Canadienne De Recherche Forestiere,
18, 150–157.
Friend, A.D. (1995) PGEN – an integrated model of leaf photosynthesis, tran-
spiration, and conductance.EcologicalModelling, 77, 233–255.
Galmes, J., Medrano, H. & Flexas, J. (2007) Photosynthetic limitations in
response to water stress and recovery inMediterranean plants with different
growth forms.NewPhytologist, 175, 81–93.
Gao, Q., Zhao, P., Zeng, X., Cai, X. & Shen, W. (2002) A model of stomatal
conductance to quantify the relationship between leaf transpiration, micro-
climate and soil water stress.Plant Cell and Environment, 25, 1373–1381.
Ghannoum, O. (2009) C-4 photosynthesis and water stress. Annals of Botany,
103, 635–644.
Gimenez, C., Mitchell, V.J. & Lawlor, D.W. (1992) Regulation of photosyn-
thetic rate of two sunflower hybrids under water-stress.Plant Physiology, 98,
516–524.
Givnish, T.J. (1988) Adaptation to sun and shade – a whole-plant perspective.
Australian Journal of Plant Physiology, 15, 63–92.
Grieu, P., Guehl, J.M. & Aussenac, G. (1988) The effects of soil and atmo-
spheric drought on photosynthesis and stomatal control of gas-exchange in
three coniferous species.Physiologia Plantarum, 73, 97–104.
Hall, A.E. & Schulze, E.D. (1980) Stomatal response to environment and a pos-
sible interrelation between stomatal effects on transpiration and CO2 assimi-
lation.Plant Cell and Environment, 3, 467–474.
Hari, P. &Makela, A. (2003) Annual pattern of photosynthesis in Scots pine in
the boreal zone.Tree Physiology, 23, 145–155.
Hari, P., Makela, A. & Pohja, T. (2000) Surprising implications of the optimal-
ity hypothesis of stomatal regulation gain support in a field test. Australian
Journal of Plant Physiology, 27, 77–80.
Hari, P., Makela, A., Korpilahti, E. &Holmberg,M. (1986) Optimal control of
gas exchange.Tree Physiology, 2, 169–175.
Hsiao, T.C. (1973) Plant responses towater stress.Annual Review of Plant Phys-
iology and PlantMolecular Biology, 24, 519–570.
Kalapos, T., Van Den Boogaard, R. & Lambers, H. (1996) Effect of soil drying
on growth, biomass allocation and leaf gas exchange of two annual grass
species.Plant and Soil, 185, 137–149.
Katul, G., Palmroth, S. & Oren, R. (2009) Leaf stomatal responses to vapour
pressure deficit under current and CO2-enriched atmosphere explained
by the economics of gas exchange.Plant Cell and Environment, 32, 968–979.
Katul, G., Manzoni, S., Palmroth, S. & Oren, R. (2010) A stomatal optimiza-
tion theory for gas exchange in ambient and enriched CO2 atmosphere.
Annals of Botany, 105, 431–442.
Kerstiens, G. (1996) Cuticular water permeability and its physiological signifi-
cance. Journal of Experimental Botany, 47, 1813–1832.
Kolari, P., Nikinmaa, E. & Hari, P. (2008) Photosynthesis and drought. Boreal
Forest and Climate Change (eds P. Hari & L. Kulmala), pp. 256–262.
Springer, Berlin.
Konrad, W., Roth-Nebelsick, A. & Grein, M. (2008) Modelling of stomatal
density response to atmospheric CO2. Journal of Theoretical Biology, 253,
638–658.
Laio, F., Porporato, A., Ridolfi, L. & Rodriguez-Iturbe, I. (2001) Plants in
water-controlled ecosystems: active role in hydrologic processes and
response to water stress – II. Probabilistic soil moisture dynamics. Advances
inWater Resources, 24, 707–723.
Larcher,W. (2003)Physiological plant ecology. Springer, Berlin.
Lawlor, D.W. & Tezara, W. (2009) Causes of decreased photosynthetic rate
and metabolic capacity in water-deficient leaf cells: a critical evaluation of
mechanisms and integration of processes.Annals of Botany, 103, 561–579.
Leuning, R. (1995) A critical-appraisal of a combined stomatal-photosynthesis
model for C-3 plants.Plant Cell and Environment, 18, 339–355.
Lloyd, J. (1991)Modeling stomatal responses to environment inMacadamia in-
tegrifolia.Australian Journal of Plant Physiology, 18, 649–660.
Lloyd, J. & Farquhar, G.D. (1994) C-13 discrimination during CO2 assimila-
tion by the terrestrial biosphere.Oecologia, 99, 201–215.
Luenberger, D.G. (1979) Introduction to Dynamic Systems. Theory, Models,
and Applications. JohnWiley & Sons, NewYork.
Makela, A., Berninger, F. & Hari, P. (1996) Optimal control of gas exchange
during drought: theoretical analysis.Annals of Botany, 77, 461–467.
Manzoni, S., Katul, G., Fay, P.A., Polley, H.W. & Porporato, A. (2010) Mod-
eling the vegetation-atmosphere carbon dioxide and water vapor interac-
tions along a controlled CO2 gradient. Ecological Modelling, in press,
doi:10.1016 ⁄ j.ecolmodel.2010.1010.1016.
Medrano, H., Flexas, J. & Galmes, J. (2009) Variability in water use efficiency
at the leaf level among Mediterranean plants with different growth forms.
Plant and Soil, 317, 17–29.
Ni, B.R. & Pallardy, S.G. (1991) Response of gas-exchange to water-stress in
seedlings of woody angiosperms.Tree Physiology, 8, 1–9.
Osmond, C.B., Winter, K. & Ziegler, H. (1975) Functional significance of dif-
ferent pathways of CO2 fixation in photosynthesis. Physiological Plant Ecol-
ogy II. Water Relations and Carbon Assimilation (eds O.E. Lange, P.S.
Nobel, C.B. Osmond&H. Ziegler), pp. 479–548. Springer-Verlag, Berlin.
Palmroth, S., Berninger, F., Nikinmaa, E., Lloyd, J., Pulkkinen, P. & Hari, P.
(1999) Structural adaptation rather than water conservation was observed in
Scots pine over a range of wet to dry climates.Oecologia, 121, 302–309.
Polley, H.W., Johnson, H.B. & Derner, J.D. (2002) Soil- and plant-water
dynamics in a C3 ⁄ C4 grassland exposed to a subambient to superambient
CO2 gradient.Global Change Biology, 8, 1118–1129.
Porporato, A., Daly, E. & Rodriguez-Iturbe, I. (2004) Soil water balance and
ecosystem response to climate change.AmericanNaturalist, 164, 625–632.
Porporato, A., Laio, F., Ridolfi, L. & Rodriguez-Iturbe, I. (2001) Plants in
water-controlled ecosystems: active role in hydrologic processes and
response to water stress – III. Vegetation water stress. Advances in Water
Resources, 24, 725–744.
Schymanski, S.J., Roderick, M.L., Sivapalan, M., Hutley, L.B. & Beringer, J.
(2008) A canopy-scale test of the optimal water-use hypothesis. Plant Cell
and Environment, 31, 97–111.
Schymanski, S.J., Sivapalan, M., Roderick, M.L., Hutley, L.B. & Beringer, J.
(2009) An optimality-based model of the dynamic feedbacks between natu-
ral vegetation and the water balance. Water Resources Research, 45,
WO1412
Siqueira,M., Katul, G. & Porporato, A. (2008) Onset of water stress, hysteresis
in plant conductance, and hydraulic lift: Scaling soil water dynamics from
millimeters to meters.Water Resources Research, 44, WO1432.
Snyman, H.A., Venter, W.D. & Vanrensburg,W.L.J. (1997) Transpiration and
water-use efficiency in response to water stress in Themeda triandra and Era-
grostis lehmanniana. South African Journal of Botany, 63, 55–59.
Sperry, J.S. (2000) Hydraulic constraints on plant gas exchange. Agricultural
and ForestMeteorology, 104, 13–23.
Tezara, W., Driscoll, S. & Lawlor, D.W. (2008) Partitioning of photosynthetic
electron flow betweenCO2 assimilation andO2 reduction in sunflower plants
under water deficit.Photosynthetica, 46, 127–134.
� 2011 The Authors. Functional Ecology � 2011 British Ecological Society, Functional Ecology
Optimal leaf gas exchange under water stress 11
Page 12
Tezara, W., Mitchell, V.J., Driscoll, S.D. & Lawlor, D.W. (1999) Water stress
inhibits plant photosynthesis by decreasing coupling factor and ATP. Nat-
ure, 401, 914–917.
Thomas, D.S., Eamus, D. & Bell, D. (1999) Optimization theory of stomatal
behaviour – II. Stomatal responses of several tree species of north Australia
to changes in light, soil and atmospheric water content and temperature.
Journal of Experimental Botany, 50, 393–400.
Tuzet, A., Perrier, A. & Leuning, R. (2003) A coupled model of stomatal con-
ductance, photosynthesis and transpiration. Plant Cell and Environment, 26,
1097–1116.
Vico, G. & Porporato, A. (2008) Modelling C3 and C4 photosynthesis under
water-stressed conditions.Plant and Soil, 313, 187–203.
Von Caemmerer, S. (2000) Biochemical Models of Leaf Photosynthesis. CSIRO
Publishing, Collingwood.
Xu, L.K. & Baldocchi, D.D. (2003) Seasonal trends in photosynthetic parame-
ters and stomatal conductance of blue oak (Quercus douglasii) under pro-
longed summer drought and high temperature. Tree Physiology, 23, 865–
877.
Received 19March 2010; accepted 29November 2010
Handling Editor: DavidWhitehead
Supporting Information
Additional supporting information may be found in the
online version of this article.
Appendix S1. Optimal gas exchange under varying water
status.
Appendix S2. Data set selection and characteristics.
Table S1. Summary statistics for the function kðwLÞ.Table S2. Leaf gas exchange andwater potential data base.
As a service to our authors and readers, this journal provides sup-
porting information supplied by the authors. Such materials may be
re-organized for online delivery, but are not copy-edited or typeset.
Technical support issues arising from supporting information (other
thanmissing files) should be addressed to the authors.
� 2011 The Authors. Functional Ecology � 2011 British Ecological Society, Functional Ecology
12 S. Manzoni et al.


![Click Here Full Article Front dynamics of supercritical ... · the effects of shearing and frictional forces [Daly and Porporato, 2004; Hogg and Pritchard, 2004]. [4] The case of](https://static.documents.pub/doc/80x56/5e74e88ddfe97568bd12b1c5/click-here-full-article-front-dynamics-of-supercritical-the-effects-of-shearing.jpg)


![The Global Stoichiometry of Litter Nitrogen Mineralization ... · Stefano Manzoni, 1. Robert B. ]ackson, 2. John A. Trofymow, 3. Amilcare Porporato. 1* Plant residue decomposition](https://static.documents.pub/doc/80x56/5c65fb7609d3f20f218b94bd/the-global-stoichiometry-of-litter-nitrogen-mineralization-stefano-manzoni.jpg)


