BearWorks BearWorks College of Natural and Applied Sciences 12-1-2020 Fundamental electronic structure and multiatomic bonding in 13 Fundamental electronic structure and multiatomic bonding in 13 biocompatible high-entropy alloys biocompatible high-entropy alloys Wai Yim Ching Saro San Jamieson Brechtl Ridwan Sakidja Missouri State University Miqin Zhang See next page for additional authors Follow this and additional works at: https://bearworks.missouristate.edu/articles-cnas Recommended Citation Recommended Citation Ching, Wai-Yim, Saro San, Jamieson Brechtl, Ridwan Sakidja, Miqin Zhang, and Peter K. Liaw. "Fundamental electronic structure and multiatomic bonding in 13 biocompatible high-entropy alloys." npj Computational Materials 6, no. 1 (2020): 1-10. This article or document was made available through BearWorks, the institutional repository of Missouri State University. The work contained in it may be protected by copyright and require permission of the copyright holder for reuse or redistribution. For more information, please contact [email protected].
Transcript
BearWorks BearWorks
College of Natural and Applied Sciences
12-1-2020
Fundamental electronic structure and multiatomic bonding in 13 Fundamental electronic structure and multiatomic bonding in 13
Follow this and additional works at: https://bearworks.missouristate.edu/articles-cnas
Recommended Citation Recommended Citation Ching, Wai-Yim, Saro San, Jamieson Brechtl, Ridwan Sakidja, Miqin Zhang, and Peter K. Liaw. "Fundamental electronic structure and multiatomic bonding in 13 biocompatible high-entropy alloys." npj Computational Materials 6, no. 1 (2020): 1-10.
This article or document was made available through BearWorks, the institutional repository of Missouri State University. The work contained in it may be protected by copyright and require permission of the copyright holder for reuse or redistribution. For more information, please contact [email protected].
Fundamental electronic structure and multiatomic bondingin 13 biocompatible high-entropy alloysWai-Yim Ching 1✉, Saro San 1, Jamieson Brechtl 2, Ridwan Sakidja 3, Miqin Zhang 4 and Peter K. Liaw 5
High-entropy alloys (HEAs) have attracted great attention due to their many unique properties and potential applications. Thenature of interatomic interactions in this unique class of complex multicomponent alloys is not fully developed or understood. Wereport a theoretical modeling technique to enable in-depth analysis of their electronic structures and interatomic bonding, andpredict HEA properties based on the use of the quantum mechanical metrics, the total bond order density (TBOD) and the partialbond order density (PBOD). Application to 13 biocompatible multicomponent HEAs yields many new and insightful results,including the inadequacy of using the valence electron count, quantification of large lattice distortion, validation of mechanicalproperties with experiment data, modeling porosity to reduce Young’s modulus. This work outlines a road map for the rationaldesign of HEAs for biomedical applications.
INTRODUCTIONHigh-entropy alloys (HEAs) are complex metallic alloys1–4 com-prised of four, five, or more principal components of differentconcentrations. Such a structure leads to a high mixing entropythat favors the formation of single phase disordered solidsolutions at higher temperatures5,6, although the enthalpy alsoplays a critical role in determining its composition and phase withno long-range-order (LRO)1,7. A significant amount of disorderexist in HEAs when they undergo elemental segregation,precipitation, and chemical ordering, but uncertainty remainsregarding the existence and the nature of short-range-orders(SRO)8. The fundamental theory for the formation of HEAs is notfully established despite many theories and modeling efforts sincetheir inception9–12. Due to the complexity of their compositionsand the difficulties for accurate measurements for comparison,most of these efforts are based on different perspectives and quitescattered. They generally used the random solid-solution-model(RSSM) to evaluate their properties although the methodsemployed could be very different13–15. Current theoreticalmethods for HEAs are spread out and include but not limited tothe use of CALPHAD1,12,16, quasi-random-structure (SQS)17–19
usually in the framework of density functional theory (DFT) onsmall-size supercells20, coherent potential approximations (EMTO-CPA) or effective medium theory21,22. Despite a plethora ofapproaches and methods used, few of them can provide acomprehensive view on their formation and the prediction of theirproperties due to several obstacles. Firstly, due to relatively largechemical disorder in HEAs, the application of RSSM requires usinglarge supercells. Secondly, the computational demand foraccurate large-scale DFT calculations could be prohibitive. Finally,the lack of a non-empirical metric to interpret the results thatinvolve subtle interactions between different metal atoms. Byintroducing the concept of total bond order density (TBOD) andpartial bond order density (PBOD) based on the quantum-mechanical (QM) metrics (see the “Methods” section), we avoid
the use of pure geometric parameters in describing the structures,compositions, and properties of HEAs. The new perspective isbased on the understanding the nature of metallic bonding,crucially related to the theory of formation of HEAs. Althoughmetallic bonding has been extensively discussed in the field ofmetallic glasses (MGs)23,24, it has not been thoroughly investigatedfor HEAs. Metallic bonding is multi-atomic in nature, different fromthe covalent or ionic bonding where the bond length (BL) isexplicitly defined as the distance between the two atoms formingthe bond. In MGs, and to a lesser extent in HEAs, the BL can beambiguous, since all atoms within a certain distance of separationcan contribute to metallic bonding. For a fixed distance ofseparation for a pair of atoms in the model, there could be manypossible values of bond order (BO), a measure of the bondstrength; and for a specific value of BO, there could be manypossible pairs of atoms with the same distance of separation. Atheory that is predominately depending on the geometricparameter of BL, or atomic size for interpretation could beoversimplified and problematic. On the other hand, the concept ofthe TBOD is still applicable as long as the BO values of all thecontributing atoms are counted. This point has already beenstrongly argued for in reference25 for MG. What differentiate HEAsfrom MGs is that HEAs have a basic crystal lattice (FCC, BCC, orHCP) as its structural backbone. However, based on the RSSMdescription, HEAs are not strictly crystalline. They possess no LROand negligible or small SRO with different nearest neighbor (NN)and second nearest neighbor (SNN) pairs. This is the samepredicament facing the vague description of the so-called latticedistortion (LD) that will be discussed later. The use of TBOD and itspartial components, the PBOD, to explore the theory of formationin HEAs is clearly a novel approach.As the populations of developed countries continue to age,
there is an increasing demand for biocompatible implantmaterials. Traditionally, stainless steels and titanium alloys havebeen typically implemented as joint surrogate metals26,27. Morerecently HEAs5,7 have been proposed as viable candidates due to
1Department of Physics and Astronomy, University of Missouri Kansas City, Kansas City, MO 64110, USA. 2The Bredesen Center for Interdisciplinary Research and GraduateEducation, The University of Tennessee, Knoxville, TN 37996-3394, USA. 3Department of Physics, Astronomy and Materials Science, Missouri State University, Springfield, MO65897, USA. 4Department of Materials Science and Engineering, The University of Washington, Seattle, WA 98195, USA. 5Department of Materials Science and Engineering, TheUniversity of Tennessee, Knoxville, TN 37996-2100, USA. ✉email: [email protected]
www.nature.com/npjcompumats
Published in partnership with the Shanghai Institute of Ceramics of the Chinese Academy of Sciences
their favorable properties, such as high strength and ductility,resistance to corrosion, wear, and fatigue. Importantly, HEAs mayconsist of refractory elements that are mostly non-toxic andhypoallergenic. They favor the structure of a single solid-solutionphase in BCC lattice and have been proposed as a new class ofmetallic biomaterials28. With Mo present, it exhibited excellentbiocompatibility compared to the pure Ti28. However, the Young’smodulus of this alloy system is roughly 10 times greater thanhuman bones29. Other challenges including the structural com-plexity involved at the interfaces with tissues and bones, andother soft matters in an aqueous environment involving bodyfluids.In this article, we present the results on the electronic structure,
interatomic bonding, and the application of TBOD and PBOD inaddressing the challenges for fundamental understanding on thetheory of formation of HEAs and its potential applications. Wewould like to point out the special merits of using TBOD and PBODas key metrics for assessing the fundamental properties ofmulticomponent alloys (see “Methods” section for detail). Theycan be directly compared with each other irrespective of theiratomic species, composition, or size. Moreover, they can beapplied to other materials systems as long as all interatomicbonding between every pair of atoms are included and normal-ized by the volume of the cell. This characteristic is very differentfrom other techniques based on ground state energies used in theenthalpy evaluation19,30,31. The total energies for different HEAscan be very different because of the difference in the referenceenergies, although the formation energy for each HEA canexplicitly be calculated, which can be quite onerous and timeconsuming for multi-component HEAs with different composi-tions. Also, the PBOD resolved from the TBOD have differentpairwise components is particularly useful in revealing the detailsof the interatomic interactions, since TBOD and PBOD are derivedfrom quantum mechanical calculations, not from geometricparameters. Such information cannot be obtained easily basedon the calculation of total energies.In the present work, the electronic structures, interatomic
bonding, and mechanical properties of the 13 bioinspired HEAs(Table 1) are investigated through advanced modeling using largesupercells yielding many new and insightful results critical to thedevelopment and application of biocompatible HEAs.
RESULTSElectronic structure and interatomic bondingWe start the “Results” section with the central part of this paper,the electronic structure, and interatomic bonding. The results forthe 13 HEAs constitute a substantial amount of data. Model M3(TiNbTaZrMo) is chosen as a representative one (Fig. 1) for focusedpresentation of the results. They are sketch of the supercellstructure of 250 atoms (Fig. 1a), total and partial density of states(DOS) (Fig. 1b), partial charge (PC) distribution (Fig. 1c), and resultsrelated to interatomic bonding (Fig. 1d, e). Results for other HEAsare presented in (Figs. S1, S2, and S4). The data on TDOS values atthe Fermi level EF (N(EF)) and the minimum values at the locationsof the deep valley in the conduction band (CB) above EF of the 13HEAs are listed in Supplementary Table 1. The similarity in the DOSfeatures amongst the 13 HEAs for energies ranging from −5 to+5 eV is because they are all derived from the 3d/4d/5d orbitals ofthe transition metals in the HEAs.An important electronic structural property is the effective
charge Q* associated with the so-called PC ΔQ= (Q0–Q*) where Q0
is the charge of the neutral atom also called the valence electroncount (VEC) (see “Methods” section). Figure 1c displays the PCdistribution of the 250 atoms in M3. Similar plots for other HEAsare shown in Supplementary Fig. 2. Table 2 lists the averaged PCand Q* for each atomic component in the 13 HEAs. We thenaverage them over the HEAs containing that element (bottom ofTable 2 and above the row for VEC). As can be seen, Ti, V, Zr, andHf have a VEC of 4, Nb and Ta have a VEC of 5, and Mo has a VECof 6. The calculated Q* values range from 4.10 (M3) to 4.37 (M9) forTi; 4.09 (M1) to 4.25 (M4) for V; 3.67 (M3) to 3.87 (M9) for Zr, and3.51 (M10, M13) to 3.72 (M9) for Hf, respectively. These Q* valuesdepend on the compositions of the HEAs. The increases in Q* (Ti,Ta, V, and Mo) or decreases in Q* (Nb, Zr, and Hf) beyond their VECdepend on the atomic compositions and specific HEAs involved.The averaged Q* of each type of atoms for all 13 HEAs showsignificant deviations from VEC (Supplementary Fig. 3). This trendstrongly suggests that conventional theories using VEC as the keyparameter in their formulation may be inadequate and is the mainreason for the failure of using the rule of mixture (ROM) in theexplanation of simulation results in other studies32,33. The trend isalso particularly true in some more complicated HEAs with specificlocal structures, such as those involving defects or othermicrostructures. Since the entire HEA system should be electricallyneutral with a zero net charge, a slight deviation in the atomic
Table 1. Fully relaxed structures for the 13 biocompatible models.
Models C a (Å) b (Å) c (Å) α β γ Vol (Å3) NN (Å) SNN (Å)
The NN and SNN stand for the average distances of nearest neighbors (NN), and second nearest neighbors (SNN), The elements involved are Ti, V, Zr, Nb, Mo,Hf, and Ta and ‘C’ stands for components. M1 (M8) has the smallest (largest) volume.
W.-Y. Ching et al.
2
npj Computational Materials (2020) 45 Published in partnership with the Shanghai Institute of Ceramics of the Chinese Academy of Sciences
1234567890():,;
composition can offer opportunities for fine-tuning their targetedproperties. Atom-specific effective charge Q* can also be used as adescriptor in the machine-learning (ML) technique but they areless important than the TBOD and PBOD.The distribution of the BO vs. the bond length (“BL”) for all
interatomic pairs up to a “BL” of 4.0 Å in M3 is shown in Fig. 1d.The “BL” (with quotation) is the distance of separation between apair of atoms with a specific BO value. These BOs are calculatedwith contributions from all atoms near this particular pair sincemetallic bonding is multiatomic, not pairwise. The TBOD is
determined by the strength of all interatomic bonds and theirpropensity normalized by the cell volume (see “Methods” section).The contributions from the specific PBOD that are decomposedfrom the TBOD is depicted in the pie chart (Fig. 1e). Similar BO vs.“BL” plots and pie charts for other HEAs are shown inSupplementary Fig. 4.The TBOD and PBOD in the 13 biocompatible HEAs are
presented in the form of histogram bars (Fig. 2a) and pie chart(Fig. 2b). This complex display requires the detailed analysis toappreciate the information that it contains. Some of the general
Fig. 1 Electronic structure and bonding in M3. a Ball and stick sketch of the supercell. b TDOS and atom-resolved PDOS. The zero energycorresponds to the Fermi level EF. The magnitude of DOS at EF, N(EF) correlates with electric conductivity of the alloy. Peaks are marked as O1,O2, and O3 at −0.39, −1.56, and −2.53 eV below EF, and C1 and C2 at 2.70 and 3.98 eV above EF. c Partial charge distribution of 250 atoms infive metals. They can be either positive or negative. d BO vs. “BL” distribution between all atomic pairs among 15 possible types. e Percentagecontribution of PBOD to TBOD for each type. Ta–Mo has the largest contributions (12.54%) and Nb–Nb the smallest (2.2%). f FWHM for the twoGaussians fitted to the histogram distribution of the average NN and SNN the interatomic distances. The two FWHMs are 0.233 and 0.269 Åwith an average value of 0.250 Å. This provides the quantitative measure of the lattice distortion in HEAs.
W.-Y. Ching et al.
3
Published in partnership with the Shanghai Institute of Ceramics of the Chinese Academy of Sciences npj Computational Materials (2020) 45
trends are discussed in the figure caption. Still, we cannot becertain about whether there exists any trends related to theircomposition, atomic species, and their interatomic interactions inrelation to PBOD. This critical issue will require a more penetratinganalysis. An interesting issue frequently discussed in the HEAcommunity is the possible existence of SRO and if we can quantifyit. A commonsense rule is to consider that a single atom has noSRO, or the short-rang-order-parameter SROP= 0, and a diatomicmolecule has the maximum SROP= 1. The SROP in HEAs can beobtained from the root-mean-square (RMS) deviation of [PBOD/TBOD]. First, the ratio of PBOD/TBOD for each of the 13 models arecalculated from the data listed in the table of Fig. 2a. Next the RMSvalue for each model are calculated and listed in SupplementaryTable 1. As can be seen, they exclusively depend on the number ofatomic components. The 4-component and 5-component HEAshave SROP= 0.11 and 0.07, respectively. The larger the atomiccomponents, the lower the SROP. We thus conclude that SRO inHEAs under the RSSM is very small. Since the TBOD and PBOD areobtained from QM calculations of individual BO values, thereforeprovide the vitally important details regarding the nature of theformation of HEAs. This is consistent with the notion of orderemerging from disorder for a broader class of functionalizedHEAs34. It should also be pointed out that the above description isstrictly based on the homomgenized RSSM used in the supercelland does not apply to cases where there may involve other factorsunder differernt assumptions8,35. Experimentally, the actualsample will be much larger and may involve multiphasestructures, the presence of impurities or dislocations that mayinduce some form of SRO beyond the simple notion of number ofatomic components. The present method of quantifying SROcould still be applied in such a senario as long as the supercellitself contains far more complicated nonhomogeneoius structuresbeyond the RSSM.
Lattice distortionLD plays a central role in controlling the properties of HEAs36. Alarge LD could be the harbinger of a possible phase transition orsample inhomogeneity. However, the degree of LD in HEAs isdifficult to quantify beyond the geometric parameters (Table 1).
We can quantify LD from the BO vs. “BL” data (Fig. 1d andSupplementary Fig. 4) by resolving them into interatomic pairs.For M3, the scattered plot shows that Ti–Zr, Ti–Ti, and Ti–Nb pairsfrom NN and SNN groups start to merge (Supplementary Fig. 4c).This is a strong evidence of large LD. Similar observations for otherHEAs are displayed in Supplementary Fig. 4a–h. The investigationson LD reported in the literature are mostly vague and sometimesmisleading. The difficulty in providing a more precise descriptionfor LD arises from the lack of a basic reference for the undistortedlattice for HEAs due to the random distributions of the differentmetallic ions of varying sizes throughout the lattice. In otherwords, there is no such a thing as an undistorted lattice to be usedas a reference. To quantify the notion of LD, the histogramdistribution of “BL” of interatomic pairs in M3 is plotted (Fig. 1f).The data are fitted with two Gaussians exhibiting a bimodaldistribution for the NNN and SNN pairs. The larger the two FWHMand their sum, the greater the LD. Similar analysis applied to all 13HEAs are shown in Supplementary Table 1 and Supplementary Fig.5. The largest (smallest) sum of FWHM is in M8 (M1), whichcoincides with the supercell volume (Table 1). However, there islittle resemblance in the relative ranking of the volume and thesum of FWHM. FWHM is extracted from the distribution of BOvalues calculated quantum mechanically, whereas volume is astructural parameter that does not involve detailed interactionsamong the atoms. Thus, LD in HEAs can now be rigorouslyquantified that are difficult to capture in experiments. Forexample, neutron scattering may reveal the NN distance, butnot the detail of the SNN distance. This trend contributes to thedifficulties in discussing the LD from experimental data. In the 4-component HEA such as M1 (TiNbTaV) there are 10 distinctivelydifferent NN pairs. In the 5-component HEA M5 (NbTaTiVZr), thereare 15 NN pairs. The ab initio modeling can facilitate theinterpretation of the experimental data. For example, based onthe neutron (synchrotron) diffraction measurements, Lee et al.estimated the NN distance in M136 and M537 to be 2.788 (2.085 Å)and 2.863 (2.866 Å), respectively. These results compare veryfavorably with the calculated values of 2.786 and 2.854 Å(Supplementary Table 1), respectively. Both results show thatadding Zr to M5 from M1, the average NN distance increased by
Table 2. List of effective charge for each element.
Comparison of effective charge (Q*) and partial charge (PC) with the valence electron count (VEC) for each atom in the 13 biocompatible HEA models.
W.-Y. Ching et al.
4
npj Computational Materials (2020) 45 Published in partnership with the Shanghai Institute of Ceramics of the Chinese Academy of Sciences
only about 2.2% or 2.4% which is not a large LD envisioned.However, the calculated FWHM values for M1 and M5 (Supple-mentary Table 1) are 0.211 and 0.379 Å respectively, an increase of
almost 80%. Obviously, the sum from NN and SNN FWHM is amore realistic estimation for the observed large LD due to theaddition of Zr to M1 (TiNbTaV) observed experimentally.
Fig. 2 Total and partial bond order density in units of electrons/(Å)3. a Histogram presentation of TBOD and PBOD for 13 models.Observations: (1) M1 has the highest TBOD of 0.0480 of e−/(Å)3 and M9 has the lowest TBOD of 0.0319 of e−/(Å)3. (2) The TBOD does notdepend on the number of components (4 or 5). (3) There is no evidence that the size of the atom influences the PBOD. (4) There is someevidence that the Ti–Ta pair has a relatively large PBOD whereas the Nb–Nb pair has a relatively small PBOD. b Pie chart presentation for PBODexcept M3 (in Fig. 1e).
W.-Y. Ching et al.
5
Published in partnership with the Shanghai Institute of Ceramics of the Chinese Academy of Sciences npj Computational Materials (2020) 45
Mechanical propertiesOne of the most important properties of HEAs is the mechanicalproperties. They are intimately related to the electronic structureand bonding (see “Methods” section). The calculated results of the13 HEAs include the elastic coefficients, compliance tensor, bulkmodulus (K), shear modulus (G), Young’s modulus (E), Poisson’sratio (η), G/K ratio and estimated Vickers harness (Hv) togetherwith the available experimental data37–46 is presented in Table 3.The experimental data for refractory BCC HEAs are quite limited.Of the 13 models listed, there are no experimental data for (M4,M7, M11, M12, and M13). M10 has data for Hv only, while M2 andM3 have results for E and Hv only. M5 and M9 lack Hv data. M1 isthe only HEA having experimental data in every column tocompare with the calculated values. The calculated Hv is based ona formula suggested by Tian et al.47 from the fitted data to MGsand is generally underestimated from the measured data. Theexperimental data for HEAs have considerable variations due tothe uncertainty in the composition and different methods used.Overall, the agreement with the limited experimental data is quitereasonable and consistent, especially for M6 and M9. Thecalculated Poisson’s ratios for the 13 HEAs range from 0.366(M10) to 0.402 (M1), which are on the ductile side. We plotted theG vs. K for all the 13 HEAs in Supplementary Fig. 6. The Pugh’s ratioG/K is well within the range of 0.30 and 0.20 with the averagearound 0.25 which is on the ductile side for metallic systems,somewhere between bulk metallic glass (BMG) and polycrystallinemetals48. There is a good correlation between the calculated bulkmodulus K and TBOD (Fig. 3), since the TBOD is a single metric thatquantifies the internal cohesion. Correlations of TBOD with G andE are less obvious since they involve directional dependence inthe strain.
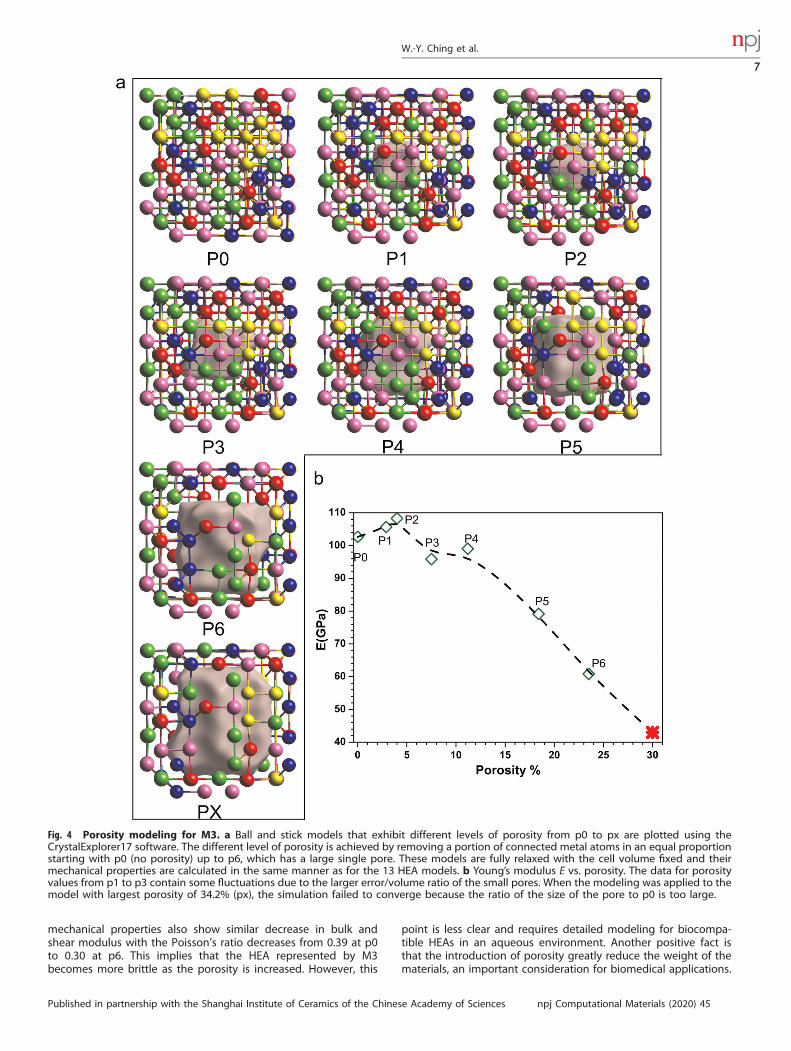
Porosity in TiNbTaZrMoFor the biocompatible HEAs proposed for biomedical applications,the most relevant property is Young’s modulus E, which rangefrom 83.7 GPa for M5 (NbTaTiVZr) to 113.5 GPa for M13(TiNbMoHfTa). To be compatible with the strengths of bonesand joints in a human body, the E needs to be reduced by at least
50%. It is well known that there is a correlation between Young’smodulus and the porosity in porous materials49. We provide somepreliminary test calculation by introducing porosity in thesimulation for M3 to reduce E. Seven cases of porous models(p1–p6 and px) are constructed from the non-porous model or M3(p0) by deleting a portion of connected atoms from p0 makingsure that the atomic composition is still remain equal partition asin the original model. This is not an easy task but is necessary. Theporosity values for each model from p0 to p6 and px aredetermined by using the PLATON software to be 0.0%, 2.90%,4.00%, 7.50%, 11.2%, 18.2%, 23.5%, and 30.0%, respectively. Thesemodels are shown in Fig. 4a using Crystalexplore17 software.The porosity can reduce Young’s modulus significantly in M3
(Fig. 4b). Figure 4a shows that p6 with porosity of 23.5%, the E wasreduced to 60.83 GPa from 102.65 GPa in p0, closer to E valuesexhibited by human cortical bones typically ranging from 7 to30 GPa50, but still way too large. The other porosity-dependent
Table 3. Mechanical properties comparison of calculated and experimental data in 13 HEAs.
Elastic coefficient Cij, bulk modulus (K), shear modulus (G), and Young’s modulus (E) in unit of GPa in 13 HEAs. η is the Poisson’s ratio and Hv is the estimatedVickers hardness. Experimental data with references using different techniques are indicated at bottom. The superscript: (1)resonant ultrasound spectroscopy;(2)in-situ neutron; (3)ultrasound spectroscopy; (4)compression; (5)nano-indentation; (6)use Vickers hardness testing.
0.030 0.035 0.040 0.045 0.050
110
120
130
140
150
160
170
M9
K
TBOD
R2=0.70 M1M13
M3
M5M7
M4
M10M2
M11
M12
M6
M8
Fig. 3 Correlation of bulk modulus with TBOD in 13 HEAs. Dashedline is a linear fit that resulted from the coefficient of determinationR2= 0.70 of bulk modulus (K) in GPA and TBOD in e/Å of the 13investigated HEAs. This means the K is tightly correlated with TBOD.
W.-Y. Ching et al.
6
npj Computational Materials (2020) 45 Published in partnership with the Shanghai Institute of Ceramics of the Chinese Academy of Sciences
mechanical properties also show similar decrease in bulk andshear modulus with the Poisson’s ratio decreases from 0.39 at p0to 0.30 at p6. This implies that the HEA represented by M3becomes more brittle as the porosity is increased. However, this
point is less clear and requires detailed modeling for biocompa-tible HEAs in an aqueous environment. Another positive fact isthat the introduction of porosity greatly reduce the weight of thematerials, an important consideration for biomedical applications.
Fig. 4 Porosity modeling for M3. a Ball and stick models that exhibit different levels of porosity from p0 to px are plotted using theCrystalExplorer17 software. The different level of porosity is achieved by removing a portion of connected metal atoms in an equal proportionstarting with p0 (no porosity) up to p6, which has a large single pore. These models are fully relaxed with the cell volume fixed and theirmechanical properties are calculated in the same manner as for the 13 HEA models. b Young’s modulus E vs. porosity. The data for porosityvalues from p1 to p3 contain some fluctuations due to the larger error/volume ratio of the small pores. When the modeling was applied to themodel with largest porosity of 34.2% (px), the simulation failed to converge because the ratio of the size of the pore to p0 is too large.
W.-Y. Ching et al.
7
Published in partnership with the Shanghai Institute of Ceramics of the Chinese Academy of Sciences npj Computational Materials (2020) 45
Currently, most biomedical applications involve the use of Ti alloyswhich is the lightest refractory element in the HEAs.The current study on porosity simulation is limited to the
starting supercell size of 250 atoms. A larger supercell containing432 atoms (see Supplementary Materials) or even larger and withmultiple smaller pores would be necessary for more realisticsimulations. Young’s modulus for the 432-atom supercell is100.77 GPa, slightly <102.65 GPa for the 250-atom supercell(Supplementary Table 2). This exploratory study is to provide theproof-of-concept that supercell modeling can provide the guide-line to reduce Young’s modulus in biocompatible HEAs byintroducing porosity of varying shapes that can accommodatebone structures in the human body. In doing so, our simulationmethod may facilitate the discovery of viable means to fabricateHEAs that are good candidates for biomedical applications.
DISCUSSIONIn this study, several new results with lasting impacts are revealed.(1) The use of quantum mechanical metrics, TBOD and PBOD, forthe HEA research. (2) Accurate ab initio modeling for 13biocompatible HEAs together with their mechanical properties.(3) Realistic calculation of the atomic charges on every atomshowing the inadequacy of using the VEC as a valid parameter inthe theory of HEAs. (4) Precise quantification of the degree of LDbased on our approach of ab initio simulation. (5) Proof of conceptin addressing the porosity effect critical for using HEAs forbiomedical applications.The method and approach we used here can be readily
extended to other multi-phase HEAs, or composites with lighternonmetallic elements, and the presence of defects or other specialrefractory elements, such as tungsten (W)51 greatly expanding itsapplicability. There is now a new trend to expand HEAs tocomposite materials, which contain light elements, such as C, B, N,and O (especially C) to form HEA ceramics32,33. Although therandom solid solution model may still hold, the supercellconstruction for the composites will be much more challengingbecause of the involvement of non-metallic elements. Otherpossible extensions of HEAs include the deviation from equal-atomic compositions or even the mixed phases to optimize certainproperties. Last but not the least, more realistic modeling forbiocompatible HEAs in aqueous solution or body fluid is possible.With the ever-increasing computing power, such large-scalecomputational modeling in complex materials is very realistic inthe near future.
METHODSSupercell constructionThe cubic supercells for biocompatible high entropy-alloys (HEAs) in theBCC lattice are constructed based on the random solid solution model(RSSM). The size of the supercell, or the number of atoms N it contains BCCsupercell is determined by the simple formula N= 2 × (n)3. In the presentwork, n is 5 so the supercell has 250 atoms in the cubic cell of length equalto na, where a is the lattice constant of the single atom BCC crystal of atypical transition metal. We believe that a 250-atom supercell may be theminimal size to justify the use the RSSM with sufficient confidence. Itshould be pointed out that our supercell is different from those used in theSQS structure in the simulations by other researchers which is usuallymuch smaller. To account for the different possible structural configura-tions, many such so-called “supercells” have to be used. In the presentstudy, we assert that the statistical distribution of random distribution ofmetals is sufficient, since the supercell is sufficiently large and withperiodical boundary conditions and can account for the randomdistribution of the NN, second NN and also the third NN and beyond foreach atom in the model. These two approaches are similar in spirit butdifferent in strategy. We believe the use of large supercells for many HEAsis more efficient, tractable, and conducive for detailed bond analysis andcalculation of TBOD. Four or five atomic species of equal percentage are
chosen from the following seven refractory elements: Ti, V, Zr, Nb, Mo, Hf,and Ta, and are distributed randomly in the lattice sites of the supercellwith periodic boundaries. For the 5-component HEAs, there are 50 atomseach. For the 4-component HEAs, two of them have 62 atoms, and theother two have 63 atoms each. The initial lattice constant for the supercellis obtained from the scaled average of the crystal lattice constant for eachatom. To fully comply with the spirit of RSSM, a script is written such thatthe atomic occupation of each site is completely random with norestriction to their NN atoms and beyond. So for the 4 (5)-component HEAmodels, the supercell will have 10 (15) possible NN pairs.
Structural relaxationThe initial BCC supercells for HEAs are fully optimized using the Vienna Abinitio Simulation Package (VASP)52,53. VASP is a plane-wave-based DFTmethod using the pseudopotential. It is very efficient for the structuraloptimization and elastic properties calculations. In the present work, thePAW-PBE potential for the exchange correlation potential within thegeneralized gradient approximation (GGA) was used54. We adopt arelatively high energy cutoff of 500 eV. The electronic and ionic forceconvergences were set at 10−5 eV and 10−3 eV/Å, respectively, with a 2 ×2 × 2 k-point mesh. Additional testing with selected sample for higher k-point showed no discernable difference. The final relaxed structures of the13 biocompatible HEAs (Table 1) based on which all the properties areevaluated. The sketch of the supercell for M3 is shown in Fig. 1a.
Electronic structure and interatomic bondingFor electronic structure and bonding calculations, the in-house developedpackage, the orthogonalized linear combination of the atomic orbitals(OLCAO) method is used55 with the VASP-relaxed structures as the input.The OLCAO method is another DFT-based method using atomic orbitalsfor the basis expansion, which are expressed as a linear combination ofGaussian type of orbitals (GTO). The use of GTO enables the efficientevaluation of three center integrals in the analytic form and thus makesthe method highly efficient, especially for large complex systems asdemonstrated in many recent publications. In the present calculations forHEAs, a more localized minimal basis (MB) set is used, which consists of thecore orbitals and the open shell of valence orbitals. Using Ti as an example,the MB has core orbitals of (1s, 2s, 2p, 3s, and 3p) and valence orbitals of(4s, 4p, and 3d).In addition to the usual electronic structures such as DOS and partial
DOS (PDOS), the most important part of the calculation is the effectivecharges Q�
α and the BO values, ραβ, between each pair of atoms (α, β) basedon the Mulliken population analysis scheme56:
Q�α ¼
X
i
X
m;occ
X
j;β
C�miα Cm
jβSiα;jβ (1)
ραβ ¼X
m;occ
X
j;β
C�miα Cm
jβSiα;jβ (2)
In Eqs. (1) and (2), Siα,jβ are the overlap integrals between the ith orbitalin the αth atom and jth orbital in the βth atom. Cm
jβ are the eigenvectorcoefficients of the mth band for the jth orbital in the βth atom. The PC, ΔQ,or the charge transfer for each atom, is the deviation from neutral atomiccharge (Q0) from the effective charge (Q*) or ΔQ=Q0–Q*. The accuratedetermination of PC is extremely important in interpreting many of thematerial properties and their functionality, especially in HEAs. This functionarises from the multi-component nature of the HEAs, which consists oftransition metal elements with different d-electron occupations. The BOvalue, ραβ, between a pair of atoms in Eq. (2) provides a quantitativemeasure of the contribution to the metallic bond from atoms α and β witha specific distance of separation. This BO value is affected by the presenceof all the nearby atoms which contribute to the BO. The summation of allBO values normalized by the cell volume gives us the TBOD, which is asingle metric to assess the internal cohesion in the crystal57. The TBOD canbe resolved into partial components or the partial BO density (PBOD) forthe different types of atomic pairs, or different groups of atoms in thestructural units in the crystal or the supercell.
Mechanical propertiesFor the elastic and mechanical properties of the HEAs, we used the stress(σi) vs. strain (εj) response analysis scheme58,59 on the fully relaxedstructure from VASP. A small strain ε (±0.5%) is applied to the supercell toobtain the elastic coefficients Cij and compliance tensor Sij (i, j= 1, 2, 3, 4, 5,
W.-Y. Ching et al.
8
npj Computational Materials (2020) 45 Published in partnership with the Shanghai Institute of Ceramics of the Chinese Academy of Sciences
6) by solving the following set of linear equations:
σi ¼X6
j¼1
Cijεj (3)
From the calculated Cij and Sij, other mechanical properties such as thebulk modulus (K), shear modulus (G), Young’s modulus (E), and Poisson’sratio (η) are obtained using the Voight–Reuss–Hill (VRH) polycrystallineapproximation60–62. More detailed information on the methods used formechanical properties are described in the Supplementary Materials S1.
DATA AVAILABILITYAll the data in this paper including those in the supplementary materials are freelyavailable by contacting the corresponding author ([email protected]).
CODE AVAILABILITYThere are several software and packages were used for this study; the analyses weredone using Crystalexplore17, Platon, and Origin software. Besides the Vienna ab initiostructural Simulation Package (VASP)53, the orthogonalized linear combination of theatomic orbitals (OLCAO)55 method was used.
Received: 16 January 2020; Accepted: 31 March 2020;
REFERENCES1. Miracle, D. B. & Senkov, O. N. A critical review of high entropy alloys and related
concepts. Acta Mater. 122, 448–511 (2017).2. Gao, M. C., Yeh, J.-W., Liaw, P. K. & Zhang, Y. High-entropy Alloys: Fundamentals
and Applications (Springer, 2016).3. Lim, X. Mixed-up metals make for stronger, tougher, stretchier alloys. Nat. News
533, 306 (2016).4. Ye, Y., Wang, Q., Lu, J., Liu, C. & Yang, Y. High-entropy alloy: challenges and
prospects. Mater. Today 19, 349–362 (2016).5. Zhang, Y. et al. Microstructures and properties of high-entropy alloys. Prog. Mater.
Sci. 61, 1–93 (2014).6. Li, Z., Pradeep, K. G., Deng, Y., Raabe, D. & Tasan, C. C. Metastable high-entropy dual-
phase alloys overcome the strength–ductility trade-off. Nature 534, 227 (2016).7. Santodonato, L. J., Liaw, P. K., Unocic, R. R., Bei, H. & Morris, J. R. Predictive multi-
phase evolution in Al-containing high-entropy alloys. Nat. Commun. 9, 4520 (2018).8. Li, Q. J., Sheng, H. & Ma, E. Strengthening in multi-principal element alloys with
local-chemical-order roughened dislocation pathways. Nat. Commun. 10, 11 (2019).9. Ding, J., Yu, Q., Asta, M. & Ritchie, R. O. Tunable stacking fault energies by tailoring
local chemical order in CrCoNi medium-entropy alloys. Proc. Natl Acad. Sci. USA115, 8919–8924 (2018).
10. Sun, X. et al. Phase selection rule for Al-doped CrMnFeCoNi high-entropy alloysfrom first-principles. Acta Mater. 140, 366–374 (2017).
11. Zhang, F. et al. An understanding of high entropy alloys from phase diagramcalculations. Calphad 45, 1–10 (2014).
12. Senkov, O. N., Senkova, S. V., Woodward, C. & Miracle, D. B. Low-density, refractorymulti-principal element alloys of the Cr–Nb–Ti–V–Zr system: microstructure andphase analysis. Acta Mater. 61, 1545–1557 (2013).
13. LaRosa, C. R., Shih, M., Varvenne, C. & Ghazisaeidi, M. Solid solution strengtheningtheories of high-entropy alloys. Mater. Charact. 151, 310–317 (2019).
14. Tian, F. A review of solid-solution models of high-entropy alloys based on ab initiocalculations. Front. Mater. 4, https://doi.org/10.3389/fmats.2017.00036 (2017).
15. Widom, M. Modeling the structure and thermodynamics of high-entropy alloys. J.Mater. Res. 33, 2881–2898 (2018).
16. Sanchez, J. M., Vicario, T., Albizuri, J., Guraya, T. & Garcia, J. C. Phase prediction,microstructure and high hardness of novel light-weight high entropy alloys. J.Mater. Res. Technol. 8, 795–803 (2019).
17. Zunger, A., Wei, S. H., Ferreira, L. G. & Bernard, J. E. Special quasirandom struc-tures. Phys. Rev. Lett. 65, 353–356 (1990).
18. Yang, Y., Wang, W., Gan, G.-Y., Shi, X.-F. & Tang, B.-Y. Structural, mechanical andelectronic properties of (TaNbHfTiZr)C high entropy carbide under pressure: abinitio investigation. Physica B: Condens. Matter 550, 163–170 (2018).
19. Curtarolo, S. et al. The high-throughput highway to computational materialsdesign. Nat. Mater. 12, 191–201 (2013).
20. Chen, H. L., Mao, H. H. & Chen, Q. Database development and Calphad calcula-tions for high entropy alloys: challenges, strategies, and tips. Mater. Chem. Phys.210, 279–290 (2018).
21. Tian, F., Varga, L. K., Shen, J. & Vitos, L. Calculating elastic constants in high-entropy alloys using the coherent potential approximation: current issues anderrors. Comput. Mater. Sci. 111, 350–358 (2016).
22. Huang, S., Tian, F. & Vitos, L. Elasticity of high-entropy alloys from ab initio theory.J. Mater. Res. 33, 2938–2953 (2018).
23. Miller, M. & Liaw, P. K. Bulk metallic glasses: an overview. in T. Egami (ed), Ato-mistic theory of metallic liquids and glasses, Chapter 2 (Springer Science & BusinessMedia, 2008).
24. Pelletier, J.-M. & Qiao, J. in J. D. Musgraves, J. Hu, L. Calvez (eds), SpringerHandbook of Glass 617–643 (Springer, 2019).
25. Ching, W.-Y. in J. D. Musgraves, J. Hu, L. Calvez (eds), Springer Handbook of Glass1097–1130 (Springer, 2019).
26. Gibon, E. et al. The biological response to orthopaedic implants for joint repla-cement: Part I: metals. J. Biomed. Mater. Res. Part B 105, 2162–2173 (2017).
27. An, Y. H. & Draughn, R. A. Mechanical Testing of Bone and the Bone–ImplantInterface (CRC Press, 1999).
28. Todai, M. et al. Novel TiNbTaZrMo high-entropy alloys for metallic biomaterials.Scr. Mater. 129, 65–68 (2017).
29. Diao, H. Y., Feng, R., Dahmen, K. A. & Liaw, P. K. Fundamental deformationbehavior in high-entropy alloys: an overview. Curr. Opin. Solid State Mater. Sci. 21,252–266 (2017).
30. Yang, K., Oses, C. & Curtarolo, S. Modeling off-stoichiometry materials with a high-throughput ab-initio approach. Chem. Mater. 28, 6484–6492 (2016).
31. Troparevsky, M. C., Morris, J. R., Kent, P. R., Lupini, A. R. & Stocks, G. M. Criteria forpredicting the formation of single-phase high-entropy alloys. Phys. Rev. X 5,011041 (2015).
32. Sarker, P. et al. High-entropy high-hardness metal carbides discovered by entropydescriptors. Nat. Commun. 9, 4980 (2018).
33. Harrington, T. J. et al. Phase stability and mechanical properties of novel highentropy transition metal carbides. Acta Mater. 166, 271–280 (2019).
34. Dragoe, N. & Bérardan, D. Order emerging from disorder. Science 366, 573–574(2019).
35. Wei, S. et al. Natural-mixing guided design of refractory high-entropy alloys withas-cast tensile ductility. Preprint at 1911.10975 (2019).
36. Lee, C. et al. Lattice distortion in a strong and ductile refractory high-entropyalloy. Acta Mater. 160, 158–172 (2018).
37. Lee, C. et al. Temperature dependence of elastic and plastic deformation beha-vior of a ductile refractory high-entropy alloy. Sci. Adv. (2019) (in press).
38. Couzinie, J. P., Senkov, O. N., Miracle, D. B. & Dirras, G. Comprehensive datacompilation on the mechanical properties of refractory high-entropy alloys. DataBrief. 21, 1622–1641 (2018).
39. Yao, H. W. et al. NbTaV-(Ti,W) refractory high-entropy alloys: experiments andmodeling. Mater. Sci. Eng.: A 674, 203–211 (2016).
40. Wang, S. P. & Xu, J. (TiZrNbTa)-Mo high-entropy alloys: dependence of micro-structure and mechanical properties on Mo concentration and modeling of solidsolution strengthening. Intermetallics 95, 59–72 (2018).
41. Wang, S. P. & Xu, J. TiZrNbTaMo high-entropy alloy designed for orthopedicimplants: as-cast microstructure and mechanical properties. Mater. Sci. Eng. C 73,80–89 (2017).
42. Dirras, G. et al. Elastic and plastic properties of as-cast equimolar TiHfZrTaNbhigh-entropy alloy. Mater. Sci. Eng. A 654, 30–38 (2016).
43. Gorsse, S., Nguyen, M. H., Senkov, O. N. & Miracle, D. B. Database on themechanical properties of high entropy alloys and complex concentrated alloys.Data Brief. 21, 2664–2678 (2018).
44. Lin, C. M., Juan, C. C., Chang, C. H., Tsai, C. W. & Yeh, J. W. Effect of Al addition onmechanical properties and microstructure of refractory AlxHfNbTaTiZr alloys. J.Alloy. Compd. 624, 100–107 (2015).
45. Ye, Y. X. et al. Evaluating elastic properties of a body-centered cubic NbHfZrTihigh-entropy alloy—a direct comparison between experiments and ab initiocalculations. Intermetallics 109, 167–173 (2019).
46. Juan, C. C. et al. Enhanced mechanical properties of HfMoTaTiZr and HfMoNb-TaTiZr refractory high-entropy alloys. Intermetallics 62, 76–83 (2015).
47. Tian, Y. J., Xu, B. & Zhao, Z. S. Microscopic theory of hardness and design of novelsuperhard crystals. Int. J. Refract. Met. Hard Mater. 33, 93–106 (2012).
48. Greaves, G. N., Greer, A., Lakes, R. S. & Rouxel, T. Poisson’s ratio and modernmaterials. Nat. Mater. 10, 823 (2011).
49. Kováčik, J. Correlation between Young’s modulus and porosity in porous mate-rials. J. Mater. Sci. Lett. 18, 1007–1010 (1999).
50. Bowen, P. K. et al. Biodegradable metals for cardiovascular stents: from clinicalconcerns to recent Zn-alloys. Adv. Healthc. Mater. 5, 1121–1140 (2016).
51. El-Atwani, O. et al. Outstanding radiation resistance of tungsten-based high-entropy alloys. Sci. Adv. 5, eaav2002 (2019).
52. Kresse, G. & Furthmuller, J. Vienna ab-initio simulation package (VASP): The guide(VASP Group, Institut fur Materialphysik, Universitat Wien, Sensengasse 8, 2002).
53. Kresse, G. & Furthmüller, J. Software vasp, vienna, 1999. Phys. Rev. B 54, 169 (1996).
W.-Y. Ching et al.
9
Published in partnership with the Shanghai Institute of Ceramics of the Chinese Academy of Sciences npj Computational Materials (2020) 45
54. Perdew, J. P., Burke, K. & Ernzerhof, M. Generalized gradient approximation madesimple. Phys. Rev. Lett. 77, 3865 (1996).
55. Ching, W.-Y. & Rulis, P. Electronic Structure Methods for Complex Materials: TheOrthogonalized Linear Combination of Atomic Orbitals (Oxford University Press, 2012).
56. Mulliken, R. S. Electronic population analysis on LCAO–MO molecular wavefunctions. I. J. Chem. Phys. 23, 1833–1840 (1955).
58. Nielsen, O. & Martin, R. M. First-principles calculation of stress. Phys. Rev. Lett. 50,697 (1983).
59. Yao, H., Ouyang, L. & Ching, W. Y. Ab initio calculation of elastic constants ofceramic crystals. J. Am. Ceram. Soc. 90, 3194–3204 (2007).
60. Voigt, W. Lehrbuch der Kristallphysik, Nachdruck, 1. Auflage, Teubner (Berlin,Leipzig, B.G. Teubner, 1928).
61. Reuss, A. Account of the liquid limit of mixed crystals on the basis of the plasticitycondition for single crystal. Z. Angew. Math. Mech. 9, 49–58 (1929).
62. Hill, R. The elastic behaviour of a crystalline aggregate. Proc. Phys. Soc. Sect. A 65,349 (1952).
ACKNOWLEDGEMENTSThis research used the resources of the National Energy Research Scientific ComputingCenter supported by DOE under Contract No. DE-AC03-76SF00098 and the ResearchComputing Support Services (RCSS) of the University of Missouri System. We thank C.Lee, Prof. V. Keppens and B. L. Musico for the helpful discussion on experimentalmeasurements of elastic properties using neutrons and ultrasonics. The project ispartially supported by DOE-NETL grant DE-FE0031554 (R.S. and W.-Y.C.). S.S. wassupported in part from funds provided by the University of Missouri-Kansas City, Schoolof Graduate Studies. P.K.L. is supported by the National Science Foundation (DMR-1611180 and 1809640) and Department of Energy (FE0008855 and DE-FE-0011194) withDrs. J. Mullen, V. Cedro, R. Dunst, S. Markovich, G. Shiflet, and D. Farkas as programmanagers and the U.S. Army Office Project (W911NF-13-1-0438 and W911NF-19-2-0049)with the program managers, Drs. M.P. Bakas, S. N. Mathaudhu, and D.M. Stepp.
AUTHOR CONTRIBUTIONSW.-Y.C., R.S., P.L. and M.Z. conceived the project. W.-Y.C. and S.S. performed thecalculations, W.-Y.C. drafted the paper. S.S. made all figures. J.B. compiled the
references. All authors participated in the discussion and interpretation of the results.All authors edited and proofread the final manuscript.
COMPETING INTERESTSThe authors declare no competing interests.
ADDITIONAL INFORMATIONSupplementary information is available for this paper at https://doi.org/10.1038/s41524-020-0321-x.
Correspondence and requests for materials should be addressed to W.-Y.C.
Reprints and permission information is available at http://www.nature.com/reprints
Publisher’s note Springer Nature remains neutral with regard to jurisdictional claimsin published maps and institutional affiliations.
Open Access This article is licensed under a Creative CommonsAttribution 4.0 International License, which permits use, sharing,
adaptation, distribution and reproduction in anymedium or format, as long as you giveappropriate credit to the original author(s) and the source, provide a link to the CreativeCommons license, and indicate if changes were made. The images or other third partymaterial in this article are included in the article’s Creative Commons license, unlessindicated otherwise in a credit line to the material. If material is not included in thearticle’s Creative Commons license and your intended use is not permitted by statutoryregulation or exceeds the permitted use, you will need to obtain permission directlyfrom the copyright holder. To view a copy of this license, visit http://creativecommons.org/licenses/by/4.0/.