A study on fundamental equity valuation of the stock CHAPTER 1 INTRODUCTION 1.1 MEANING OF INVESTMENT Investment is time, energy, or matter spent in the hope of future benefits actualized within a specified date or time frame Investment is buying or creating an asset with the expectation of capital appreciation, dividends (profit), interest earnings, rents or some combination of these returns. This may or may not be backed by research and analysis. Most or all forms of investment involve some form of risk, such as investment in equities, property, and even fixed interest securities which are subject, among other things, to inflation risk. It is indispensable for project investors to identify and manage the risks related to the investment. 1.2 INVESTMENT OBJECTIVES The following are basic investment objectives. Maximization of return Investors always expect a good rate of return from their investments. Rate of return could be defined as the total income the investor receives during the holding period stated as a percentage of the purchasing price at the beginning of the holding period. Minimization of risk R. V. Institute of Management, Bengaluru Page 1
Transcript
A study on fundamental equity valuation of the stock
CHAPTER 1
INTRODUCTION
1.1 MEANING OF INVESTMENT
Investment is time, energy, or matter spent in the hope of future benefits actualized
within a specified date or time frame
Investment is buying or creating an asset with the expectation of capital appreciation,
dividends (profit), interest earnings, rents or some combination of these returns. This
may or may not be backed by research and analysis. Most or all forms of investment
involve some form of risk, such as investment in equities, property, and even fixed
interest securities which are subject, among other things, to inflation risk. It is
indispensable for project investors to identify and manage the risks related to the
investment.
1.2 INVESTMENT OBJECTIVES
The following are basic investment objectives.
Maximization of return
Investors always expect a good rate of return from their investments. Rate of
return could be defined as the total income the investor receives during the
holding period stated as a percentage of the purchasing price at the beginning of
the holding period.
Minimization of risk
Risk of holding securities is related with the probability of actual return becoming less
than the expected return. Investment risk is just as important as measuring its expected
rate of return because minimizing risk and maximizing rate of return are interrelated
objectives in the investment management.
Safety
The selected investment avenue should be under the legal and regulatory frame work. If
it is not under the legal frame work, it is difficult to represent the grievances, if any.
Approval of the law itself adds a flavour of safety. And investment done with the
government assures more safety than with the private party.
Liquidity
R. V. Institute of Management, Bengaluru Page 1
A study on fundamental equity valuation of the stock
Marketability of the investment provides liquidity to the investment. The liquidity
depends upon the marketing and trading facility. If a portion of the investment could be
converted into cash without much loss of time, it would help the investor meet the
emergencies. Stocks are liquid only if they command good market by providing adequate
return through dividends and capital appreciation.
Hedge against inflation
Since there is inflation in almost all the economy, the rate of return should ensure a
cover against the inflation. The rate of return should be higher than the rate of inflation,
otherwise the investor will have loss in real terms. Growth stocks would appreciate in
their values overtime and provide a protection against inflation. The return thus earned
should assure the safety of the principal amount, regular flow of income and be a hedge
against inflation.
R. V. Institute of Management, Bengaluru Page 2
A study on fundamental equity valuation of the stock
CHAPTER-2
2.1 INDUSTRY PROFILE
2.1 HISTORICAL BACKGROUND:
The equity brokerage industry in India is one of the oldest in the Asia region. India had
an active stock market for about 150 years that played a significant role developing risk
market as also promoting enterprise and supporting the growth of industry.
The roots of a stock market in India began in 1860s during the American civil war that
led to sudden surge in demand for cotton from India resulting in setting up of a number of
joint stock companies that issued securities to raise finance. This trend as akin to the
rapid growth of securities markets in Europe and the North America in the background of
expansion of railroads and exploration and natural resources and land development.
Historical records show that as early as 1864, there were about 1000 brokers with the
stock markets functioning from three places in Mumbai, between 9am to 7pm at the
junction of Meadows street and Rampart Row, from day break 9am and from 7pm to
early hours of next morning at Bazar gate.
Share prices rose sharply even at that time. A share of Colaba Land Company during the
boom period of the 1860s rose from Rs.10,000 at par to Rs.12,000 and that back day
shares went up from Rs.2,000 to Rs.54,000. Bombay, at that time, was major financial
center having housed 31 banks, 20 insurance companies and 62 joint stock companies.
Reports on stock markets around that time indicate that an ordinary broker in 1864 earned
about Rs.200 per day, a huge sum in those days. The boom period came to an abrupt end
in 1865. “Never had I witnesses in any place a run so widely distributed nor such distress
followed so quickly on the heels of such prosperity” thus wrote Richard Temple, who
served as the Governor of Bombay at that time. An interesting aspect is that despite the
collapse of the stock market, most of the brokers met their payment commitments.
R. V. Institute of Management, Bengaluru Page 3
A study on fundamental equity valuation of the stock
2.2CAPITAL MARKET OPERATIONS:
It consists mainly of primary market operation and secondary market operations. Primary
market or new issue market deals with the issue of new securities to investors on facilities
the corporate sectors in raising funds. The primary market is made up of two components:
where the firms go public for the first time through initial public offering and where the
firms which are already traded raise additional capital through seasoned equity offerings.
In the secondary market the securities which are floating and subscribed in the primary
market are traded with exchange. The primary function of stock exchange or secondary
market is providing liquidity of capital and continuous market for outstanding securities.
The stock exchange brings about a correct evaluation of securities and set prices of
securities close to their investment worth.
FOLLOWING ARE THE VARIOUS INVESTMENT ALTERNATIVES.
Negotiable and fixed income securities
1. Equity Shares
2. Preference Shares
3. Debentures
4. Bonds & Money Market Securities
5. Government Securities
Non – Negotiable Securities
1. Bank Deposits
R. V. Institute of Management, Bengaluru Page 4
A study on fundamental equity valuation of the stock
2. Post Office Deposit
3. NBFC Deposits
4. Tax Saving Schemes
5. Public Provident Fund
6. National Saving Scheme
7. Mutual Funds
8. Real Estate
9. Life Insurance
MARKETS:
In tune with the global stock markets that began to recover from the second half
of 2003, Indian stock markets too witnessed rapid growth. India’s two leading
indices, the most popular BSE Sensex, and the one most used by the markets the
National Stock Exchanges S&P CNX Nifty rose to record levels. Both primary
and secondary market activity experienced sharp surge. Much progress was made
in further strengthening and streamlining risk management, market regulation and
supervision. A few aspects of the major developments in the India’s stock markets
are described below.
MARKET STRUCTURE
Indian securities market is fairly large compared to several other emerging
markets. There are 28 stock exchanges in the country, through entire liquidity is
shared between the countries two national level exchanges namely, National
R. V. Institute of Management, Bengaluru Page 5
A study on fundamental equity valuation of the stock
Stock Exchange of India and the Bombay Stock Exchange Ltd. The regional
stock exchanges are in pursuit of business models that make them viable and
vibrant. Meanwhile, these exchanges have become members of the national
level exchanges through formation of subsidiaries whose business is showing
continuous growth and progress.
10.
With the abolition of the deferral products and introduction of uniform T+2
settlement cycle, the liquidity in these exchanges flowed to the national level
system consisting of NSE and BSE.
2.3 BOMBAY STOCK EXCHANGE AND ITS GROWTH
The Stock Exchange, Mumbai, popularly known as ‘BSE’ was established in 1875
as the native share and Stock Brokers Association. It is the oldest one in Asia, even
older than the Tokyo stock Exchange, which was established in 1878. It is a
voluntary non-profit making association of the persons and is currently engaged in
the process of converting itself into demutualized and corporate entity. It has
evolved over the years into its present status as the premier Stock Exchange in the
country. It is the first Stock Exchange in country to have obtained permanent
recognition in 1956 from the government of India under securities contracts act,
1956.
The Exchange while providing an efficient market also upholds the interest of
the
investors and insuresredressal of their grievances, whether against the companies or its
own member brokers. It also strives to educate the investors by making available
necessary informative inputs.
A Governing Body comprises nine of elected directors an Executive Director, a Reserve
Bank of India nominee and five Public representatives is the apex body, which regulates
the Exchanges and decides it policies.
The governing board following the election of directors annually elects a president, Vice-
President and an honorary treasurer from among the elected directors. The Executive
R. V. Institute of Management, Bengaluru Page 6
A study on fundamental equity valuation of the stock
Directors as the Chief Executive Officers is responsible for the day-to-day administration
of the Exchanges.
The Exchange has inserted new Rule No.126 A in its Rules, Bye-laws and Regulations
pertaining to constitution of the executive commission of the Exchange. Accordingly, an
Executive Committee, consisting of three elected directors, three SEBI nominees or
public representatives, Executive Directors and CEO and Chief Operating Officers has
been constituted. The committee considers judicial and quasi matters in which the
Governing Board has power’s as an Appellate Authority, matters regarding annulment of
transaction, admission, continuance of members brokers, declaration of a member-broker
as defaulter, norms, procedures and other matters relating to arbitration, fess, deposit,
margins, and other monies payable by the member-broker to the Exchange, etc.
2.4 NATIONAL STOCK EXCHANGE (NSE)
The high powered study group on establishment of new stock exchanges popularly
known as Pherwani Committee had in 1991 recommended the promotion of a new stocks
exchange at New Bombay as a model Stock Exchange and to act as National Stock
Exchange.
In order to provide nationwide Stock Exchange facilities to investors, upgrading the
facilities and to bring the Indian Capital market in line with the international markets in
1992, the National Stock Exchange was established. The exchange has two separate
segment viz., Capital market segment and money market segment. Capital market
segment would cover trading inequities, convertibles debenture, non-convertible
debentures etc., NSE provides access to investors from all across the
country on an equal footing and works as an integral component of the national stack
market system.
The growths of business on NSE in the recent years have been very impressive since
the time when exchanges started its operations, i.e., on November 3, 1994. Over the
period, the average trading volume has increased manifold.
The value of traded scrip’s during the year 1999 -2000 on NSE was Rs.8,39,052 crore
(40% of the total turnover of all the stock exchanges combined in India) compared to
R. V. Institute of Management, Bengaluru Page 7
A study on fundamental equity valuation of the stock
Rs.3,69,052 (30.49 % of the total turnover of all the stock exchangein India) on the
country’s premium bourse the BSE
2.5 INTRODUCTION TO EQUITY VALUATION
Equity Valuation:
The investor takes a number of decisions in the process of investment. The investor has to
decide about his risk tolerance level and the nature of assets to be brought weather they
are stocks or bonds or real estates. Once he decides the nature of the assets, he has to
select it from different alternatives. For example, if the common stock is chosen by the
investor he has to decide which company stock’s he has to buy. It may be Reliance
industry stock or the BHEL or IOC or any other company’s stock. Stocks are selected on
the basis of their return and risk. The investor analyses the risk and returns of holding a
particular stock for say five years or ten years. The risk and return analyses of the security
are known as security analysis.
Return:
The return from the stock includes both current income and capital gain caused by the
appreciation of the price. The income and capital gain are expressed as percentage of
money invested in the beginning. The historical returns are derived from the cash flow
received as well as the price changes that occur during the period of holding the stock or
any asset. The income flow is the dividend he receives during the holding period.
In simple terms
r = Price Change + Cash dividend x100
Purchase Price
Assumption;
While ascertaining the value of equity shares, different assumptions are made regarding
the company’s future profits, the amount and the timing of the dividends, the required
R. V. Institute of Management, Bengaluru Page 8
A study on fundamental equity valuation of the stock
rate of return etc. Therefore, different approaches have been developed for the valuation
of equity shares. These different approaches however, make the following assumptions
regarding the basic characteristics of equity shares:
1. Equity shares do not have any redemption date.
2. Equity shares do not have any given redemption or liquidating value. In case of
liquidation of the company, their claim is residual in nature and arising in the last
(after paying all external liabilities and the preference share holders).
3. Dividends on equity shares are neither guaranteed nor compulsory. Further,
neither the rate nor the timing of dividend is specified. So, the dividend can vary
in any directions.
Different approaches for the valuation of the equity shares can be analyzed as follows:
a) Valuation based on dividends.
b) Valuation based on earnings.
Valuation of Equity Shares based on Dividends
An investor buys an equity share in expectation of (i) a stream of future dividends from
the company and (ii) resale price of the equity share after some time when he is no longer
interested in holding the share. The owner of the share receives dividends as a
compensation for investing in the firm. So, as long as, the firm is operating profitable and
the investor holds the share, he would be expecting to receive a dividend from the
company. So, the dividends play a crucial and important role in determining the value of
equity shares. Though there is no legal compulsion to pay dividend on equity shares, still
most companies prefer to pay dividends in order to satisfy the expectation of their
shareholders.
R. V. Institute of Management, Bengaluru Page 9
A study on fundamental equity valuation of the stock
Assumptions: Valuation of the equity shares based on dividends requires the following
assumptions:
1 The dividends are payable annually.
2 The dividend is received after one year from the date of acquisition purchase.
3 Sale of equity share if any, occurs only at the end of a year and at the ex-dividend
terms.
Dividend Discount Model Single
Period Valuation Model
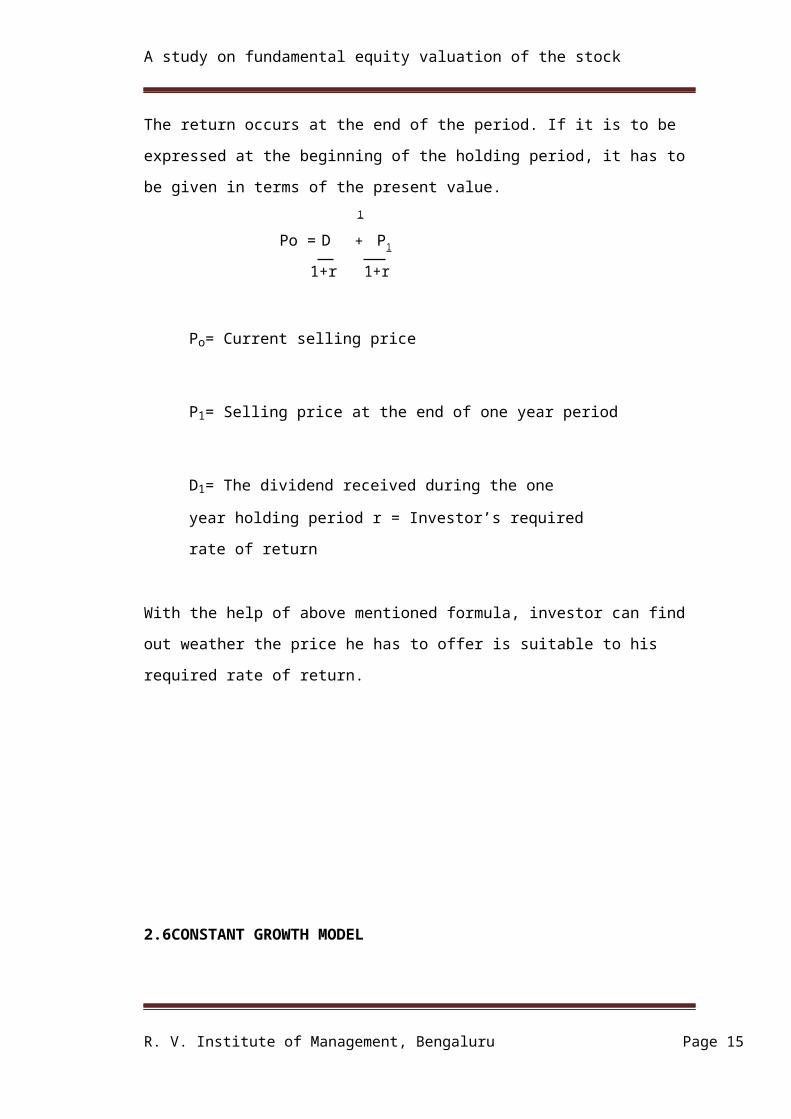
The return occurs at the end of the period. If it is to be expressed at the beginning of the
holding period, it has to be given in terms of the present value.
Po = D 1 + P 1
1+r 1+r
Po= Current selling price
P1= Selling price at the end of one year period
D1= The dividend received during the one year holding period r =
Investor’s required rate of return
With the help of above mentioned formula, investor can find out weather the price he has
to offer is suitable to his required rate of return.
R. V. Institute of Management, Bengaluru Page 10
A study on fundamental equity valuation of the stock
2.6CONSTANT GROWTH MODEL
In this model, the basic assumption is that dividends will grow at the same rate (g) into an
indefinite future.
Po = D(1+g) + D(1+g) 2 + D(1+g) 3 +…..+ D(1+g) N 1+r (1+r) 2
(1+r) 3 (1+r) n When the period approaches to infinity the
equation takes the form
Po = D1
r-g
Po= Present value of the stock r =
required rate of the return g = The
growth rate
D1=The next year dividend
This model is based on the assumption:
a) The firm’s dividend policy will be stable.
b) The firm will earn the stable return over the time.
This model is applicable when the analyst is able to predict all the three variable in the
equation namely (1) next years dividend, (2) the firm long term growth rate and,
(3) the required rate of return of the investor. Once the three values are known to the
analyst, the theoretical value or the present value of the stock can be computed and
compared with the driveling price, if
R. V. Institute of Management, Bengaluru Page 11
A study on fundamental equity valuation of the stock
Theoretical value > Actual price - >buy
Theoretical value < Actual price - >sell
Another advantage of this is that with the present selling price, next year’s dividend and
the growth rate, rate of return of the stock can be estimated.
Present rate of return > Required rate of return - > buy
Present rate of return < Required rate of return - < sell
TWO STAGE GROWTH MODEL
The constant growth model is extended to two stage growth model. Here the growth
stages are divided into two, namely, a period of extraordinary growth and a constant
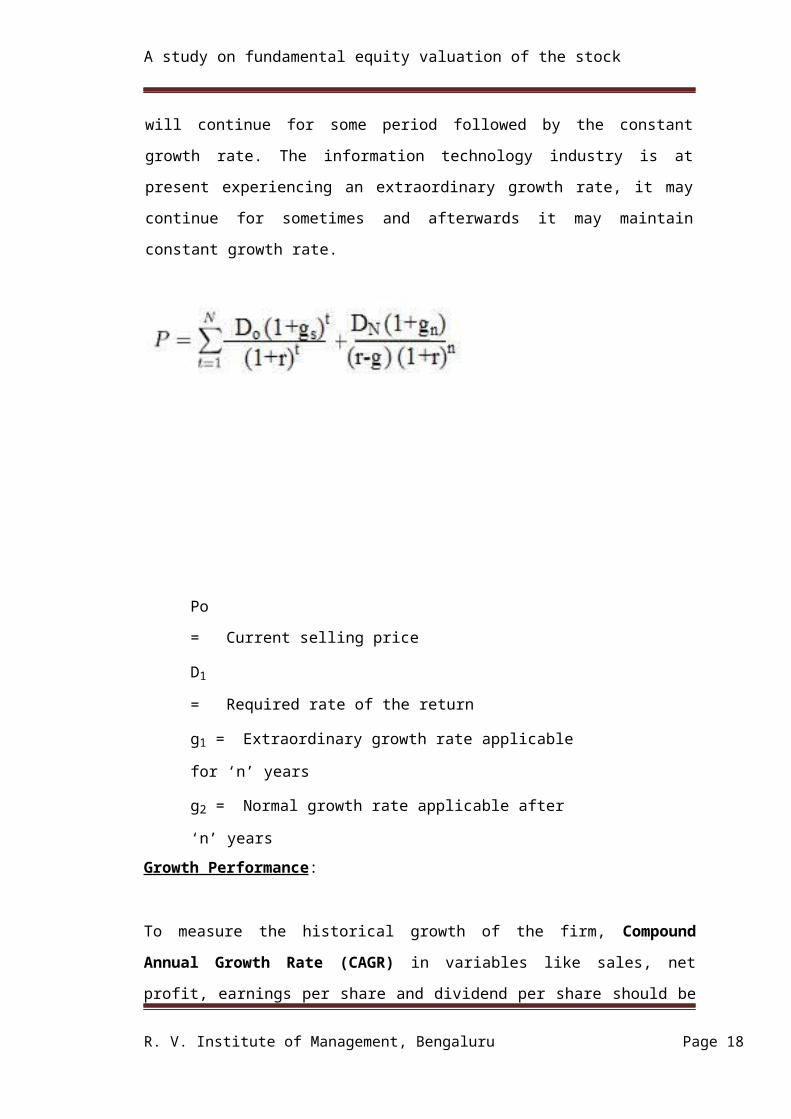
growth period of infinite nature. The extra ordinary growth period will continue for some
period followed by the constant growth rate. The information technology industry is at
present experiencing an extraordinary growth rate, it may continue for sometimes and
afterwards it may maintain constant growth rate.
Po = Current selling price
D1 = Required rate of the return
R. V. Institute of Management, Bengaluru Page 12
A study on fundamental equity valuation of the stock
g1 = Extraordinary growth rate applicable for ‘n’ years
g2 = Normal growth rate applicable after ‘n’ years
Growth Performance:
To measure the historical growth of the firm, Compound Annual Growth Rate
(CAGR) in variables like sales, net profit, earnings per share and dividend per share
should be calculated
CAGR of Dividend per Share: ( DPS for 2014 ÷ DPS for 2010) 1/5 - 1.
Sustainable Growth Rate: The sustainable growth rate is defined as:
Sustainable growth rate = Retention ratio × Return on equity.
Required Rate of return:
The investors required rate of return is calculated by applying Constant Dividend Growth
Model of Gordian.
2.7RELIANCE INDUSTRIES LTD:
Reliance Group;
The Reliance Group, founded by Dhirubhai H. Ambani (1932-2002), is India's largest
private sector enterprise, with businesses in the energy and materials value chain. Group's
annual revenues are in excess of US$ 58 billion. The flagship company, Reliance
Industries Limited, is a Fortune Global 500 company and is the largest private sector
company in India.
Backward vertical integration has been the cornerstone of the evolution and growth of
Reliance. Starting with textiles in the late seventies, Reliance pursued a strategy of
R. V. Institute of Management, Bengaluru Page 13
A study on fundamental equity valuation of the stock
backward vertical integration - in polyester, fibre intermediates, plastics, petrochemicals,
petroleum refining and oil and gas exploration and production - to be fully integrated
along the materials and energy value chain.
Reliance enjoys global leadership in its businesses, being the largest polyester yarn and
fiber producer in the world and among the top five to ten producers in the world in major
petrochemical products.
Major Group Companies are Reliance Industries Limited, including its subsidiaries and
Reliance Industrial Infrastructure Limited.
Significant contribution to India's economic growth
13.4 % of India’s total exports
6.9 % of the Government of India’s indirect tax revenues 4.8 %
of the total market capitalisation in India
Weightage of 11.9 % in the BSE Sensex
Weightage of 10.1 % in the S&P CNX Nifty Index
Growing importance across the globe
Largest refining capacity at any single location
Largest producer of Polyester Fibre and Yarn
5th largest producer of Paraxylene (PX) and Polypropylene (PP)
8th Largest producer of Purified Terephthalic Acid (PTA) and Mono Ethylene
Glycol (MEG)
R. V. Institute of Management, Bengaluru Page 14
A study on fundamental equity valuation of the stock
2.8INDIAN OIL CORPORATION LIMITED
IOC Overview
Indian Oil is India's flagship national oil company with business interests straddling the
entire hydrocarbon value chain – from refining, pipeline transportation and marketing of
petroleum products to exploration & production of crude oil & gas, marketing of natural
gas and petrochemicals. It is the leading Indian corporate in the fortune 'Global 500'
listing, ranked at the 98th position in the year 2011.
With over 34,000-strong workforce, Indian Oil has been helping to meet India’s energy
demands for over half a century. With a corporate vision to be the Energy of India, Indian
Oil closed the year 2010-11 with a sales turnover of Rs. 3,28,744 crore ($ 68,837 million)
and profits of Rs. 7445.48 crore ($ 1,719 million).
At Indian Oil, operations are strategically structured along business verticals - Refineries,
Pipelines, Marketing, R&D Centre and Business Development – E&P, Petrochemicals
and Natural Gas. To achieve the next level of growth, Indian Oil is currently forging
ahead on a well laid-out road map through vertical integration— upstream into oil
exploration & production (E&P) and downstream into petrochemicals – and
diversification into natural gas marketing and alternative energy, besides globalization of
its downstream operations. Having set up subsidiaries in Sri Lanka, Mauritius and the
United Arab Emirates (UAE), Indian Oil is simultaneously scouting for new business
opportunities in the energy markets of Asia and Africa.
R. V. Institute of Management, Bengaluru Page 15
A study on fundamental equity valuation of the stock
Chapter 3
Design of Report
3.1LITERATURE REVIEW:
Technical Analysis as explained by “The technical approach to investing is essentially are
flection of the idea that prices move in trends which are determined by the changing attitudes
of investors toward a variety of economic, monetary, political and psychological forces. The
art of technical analysis ± for it is an art- is to identify trend changes at an early stage and to
maintain an investment posture until the weight of the evidence indicates that the trend has
been reversed.” A method of evaluating securities by analysing statistics generated by market
activity, such as past prices and volume, Technical analysts do not attempt to measure a
security’s intrinsic value, but instead use charts to identify patterns that can suggest future
activity. Technical analysts believe that the historical performance of stocks and markets are
indications of future performance. Technical Analysis has become increasingly popular over
the past several years, as more and more people believe that the historical performance of a
stock is a strong indication of future performance. People using fundamental analysis have
always looked at the past performance of companies by comparing fiscal data from previous
quarters and years to determine future growth. The difference lies in the technical analyst is
belief that securities move according to very predictable trends and patterns. These trends
continue until something happens to change the trend, and until this change occurs, Price
levels are predictable. Hence, testing of technical analysis is important in order to enjoy the
benefit. William Sharpe said ³If you torture the data long enough, it will confess to any crime.
So important is the rule must work on data other than that used to discover it. There are many
evidences which support technical analysis, in July 1990 Journal of Finance article, jagadeesh
found predictable pattern in monthly returns for the period 1934 to 1987. His study revealed
that stocks with large losses in one month tend to show a significant reversal in the following
month and vice versa. In December 2000 Journal of Finance article, Lo, Ma may sky, and
Wang found that several technical indicators have some practical value as they provide
incremental information. This study is also based on sector analysis where from 4
industries in that 4-5 companies are analyzed using technical indicators. If the indicators
show more than 50% of positive results then the relevance of technical tools in trading
increases which will be helpful for investors
R. V. Institute of Management, Bengaluru Page 16
A study on fundamental equity valuation of the stock
3.2NEED FOR THE STUDY:
Valuation of the stocks is the first step towards intelligent investing. The knowledge of
securities market, particularly of the equity markets, is essential to come to grips with the
industry analysis and performance of the company through fundamental ratios. An investor
attempts to determine the worth of their shares based on the fundamentals, real value of stock
and some news from the media. Equity valuation is the most important and needed so as to
know the competitiveness of company with other companies and with industry benchmark.
It’s also needed to predict the future prices of the company to know where the company
stands which would help the investor to make better investing decisions either for long-term
period or for short-term period. Hence the study on fundamental analysis of RIL and IOL is
carried out.
3.3 STATEMENT OF THE PROBLEM:
“A study on fundamental equity valuation of the stock”
A method of evaluating a security that entails attempting to measure its intrinsic value
by examining related economic, financial and other qualitative and quantitative
factors. Fundamental analysts attempt to study everything that can affect the security's
value, including macroeconomic factors (like the overall economy and industry
conditions) and company-specific factors (like financial condition and management
3.4OBJECTIVES OF THE STUDY:
The main objectives of the study are:
To study the Stock Market and its functions.
To identify and evaluate the equity shares of RIL & IOC
To compare the market performance with that of selected stocks.
To know whether the equities are under-priced or over-priced and to suggest
R. V. Institute of Management, Bengaluru Page 17
A study on fundamental equity valuation of the stock
which to buy or to sell or to hold.
To predict the direction of national economy because economic activity affects the
corporate profit, investors attitudes and expectations and ultimately security
prices.
3.5 RESEARCH METHODOLOGY:
The project is on equity valuation where the equity share prices of the companies
are analyzed. The study is based on the past financial information of the Five
years and with the help of current market price of both the stocks while
calculating the future price using model of equity valuation. The nature of data
collection is mainly based on the information available through Secondary Data
and with the help of analytical tools.
Secondary Data:
The main source of information is annual reports of the companies and related
websites which has enabled in analyzing the equities.
Internet sources
Annual Reports
Text Books
Primary Data:
The primary sources of information collection were through discussion with the
faculties and the advisors in the company.
R. V. Institute of Management, Bengaluru Page 18
A study on fundamental equity valuation of the stock
3.6SCOPE OF THE STUDY:
The concept of risk, return and dividend paid, as the determinants of the value are
fundamentals and valid to validation of the securities.
At the outset it’s not easy to predict the rates and prices of stocks.
Investor can design their investment and financing activities in the way which
exploits the relevant variables to maximize the shares value in market
3.7LIMITATIONS OF THE STUDY:
The study has certain limitations like;
Need to adapt to each company Methods of fundamental valuation may vary
depending on the industry and the unique factors of a particular company.
Lack of fundamental analysis is the hope for a certain outcomes
The adaptation of methods of analysis for each company or industry can be very
long.
Stock market and the prices of stock are driven by the desires of investors, any
news from Government and information from insider of the company.
Information on average normal growth rate of industry was not available.
R. V. Institute of Management, Bengaluru Page 19
A study on fundamental equity valuation of the stock
CHAPTER 4
DATA ANALYZING AND DATA INTERPRETATION
4.1 KEY FINANCIAL RATIOS OF RELIANCE INDUSTRIES LTD
CURRENT RATIO:
The current ratio is a financial ratio that measures whether or not a firm has enough
resources to pay its debts over the next 12 months. It compares a firm's current assets to
its current liabilities. To pay short-term obligations, it includes inventories. A current ratio
of assets to liabilities of 2:1 is usually considered to be acceptable
Current Ratios = Current assets
Current liabilities
Year 2014 2013 2012 2011 2010
Ratio 1.11 1.43 1.44 1.16 1.04
1.6
1.4
1.2
1
0.8Ratios
0.6
0.4
0.2
02014 2013 2012 2011 2010
Chart 4.1.1: current ratio of reliance industries ltd
R. V. Institute of Management, Bengaluru Page 20
A study on fundamental equity valuation of the stock
Interpretation:-
Current ratio of the company shows the decreasing from last year. In the year 2010 it
was 1.04, in the year 2011 it has been raised to 1.16 and in the year 2012 it has
reached to 1.44 and in the year 2013 it is steadily decrease by 0.01 to 1.43 and in the
year of 2014 rapidly decreased by 0.32 to1.11. It means that it is liable to pay its
liabilities for the upcoming periods. It has maintained the standard form i.e. 2:1.
QUICK RATIO:
An indicator of a company’s short-term liquidity. The quick ratio measures a
company’s ability to meet its short-term obligations with its most liquid assets. For
this reason, the ratio excludes inventories from current assets.
Year 2014 2013 2012 2011 2010
Ratio 1.03 1.12 1.17 0.94 0.69
1.2
1
0.8
0.6Ratios
0.4
0.2
02014 2013 2012 2011 2010
Chart 4.1.2: Quick Ratio of reliance industries ltd
Interpretation:
According above shown graph in the year 2010 there was lower ratio which was
0.69 compare to the other four years ratio so, that was bad sign for the company and
there was lower cash convertible assets. And in the year 2012 it was 1.17 higher than
the other four years ratio, and in the year 2014 it was 1.03.
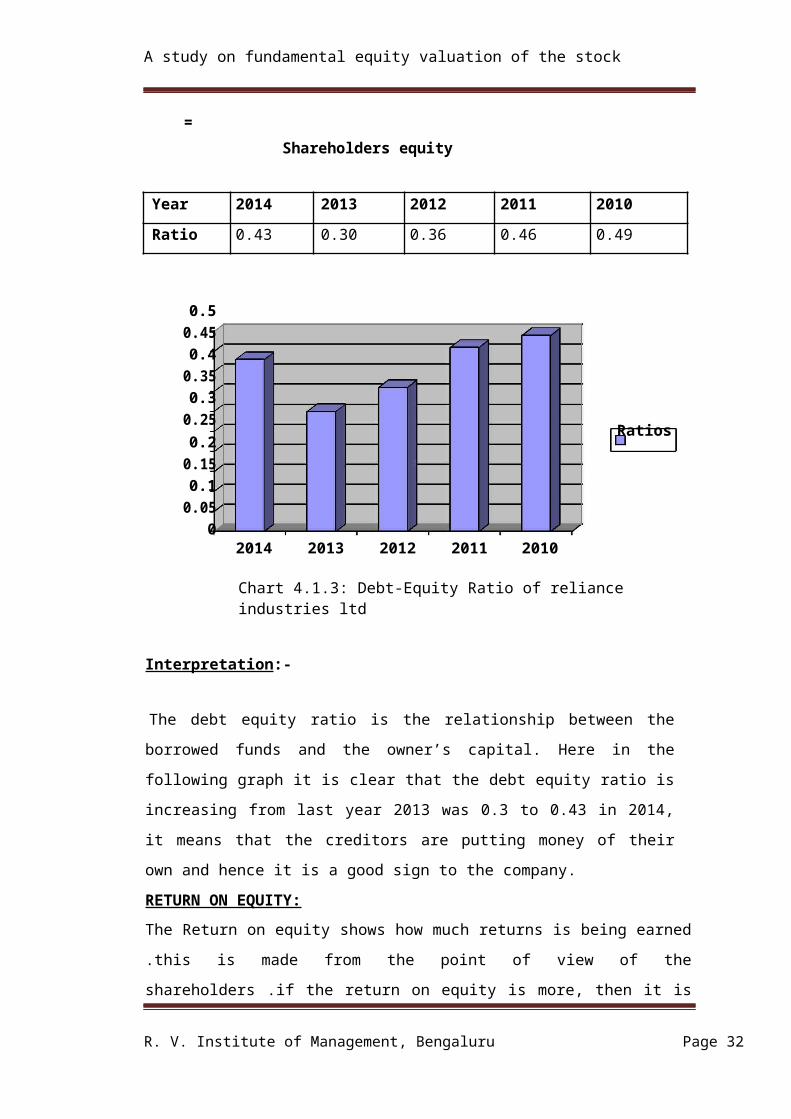
DEBT-EQUITY RATIO:
R. V. Institute of Management, Bengaluru Page 21
A study on fundamental equity valuation of the stock
The Debt / Equity ratio measures the long term financial solvency of firm. It also
measure of a company’s financial leverage calculated by dividing its total liabilities
by stockholders’ equity. It indicates what proportion of equity and debt the company
is using to finance its assets. It is calculated as follows
D/E Ratio = Total Liabilities
Shareholders equity
Year 2014 2013 2012 2011 2010
Ratio 0.43 0.30 0.36 0.46 0.49
0.50.450.4
0.350.3
0.25Ratios
0.20.150.1
0.050
2014 2013 2012 2011 2010
Chart 4.1.3: Debt-Equity Ratio of reliance industries ltd
Interpretation:-
The debt equity ratio is the relationship between the borrowed funds and the owner’s
capital. Here in the following graph it is clear that the debt equity ratio is increasing
from last year 2013 was 0.3 to 0.43 in 2014, it means that the creditors are putting
money of their own and hence it is a good sign to the company.
RETURN ON EQUITY:
The Return on equity shows how much returns is being earned .this is made from the
point of view of the shareholders .if the return on equity is more, then it is said to be the
most demanded shares in the market. Net income is for the fiscal year shareholders
equity does not include preferred shares. Also known as “return on net worth”(RONW).
R. V. Institute of Management, Bengaluru Page 22
A study on fundamental equity valuation of the stock
Return on equity = PAT *100
Shareholders fund
YEAR 2014 2013 2012 2011 2010
RATIO 11.15 11.66 12.30 13.88 12.64
14
12
10
8
6 Ratios
4
2
02014 2013 2012 2011 2010
Chart 4.1.4: Return on Equity Ratio of reliance industries ltd
Interpretation:
In the above graph there is steadily decrease in the ratio from 2012 to 2014. Which
shows the performance of the company in the market how bad it is? If the trend is
continuous in the future it is very bad sign to the company.
EARNING PER SHARE:
Earnings per-share (EPS) is the amount of earnings per each outstanding share of a
company's stock. The portion of a company’s profit allocated to each outstanding share
of common stock. EPS serves as an indicator of a company’s profitability. It can be
calculated in the following way
R. V. Institute of Management, Bengaluru Page 23
A study on fundamental equity valuation of the stock
EPS = Net profit available to the equity shareholders *100
Number of ordinary shares outstanding
Year 2014 2013 2012 2011 2010
Ratio 68.02 65.05 61.26 61.97 49.64
70
60
50
40
30 Ratios
20
10
02014 2013 2012 2011 2010
Chart 4.1.5: Earning Per Share Ratio of reliance industries ltd
Interpretation:-
The EPS indicates that the Earnings of a Share. By the following graph it is clear that
the EPS is continuously increasing from 2010 to 2014. And there was a drastic change
in the EPS in the year 2011, which was good turn point to the company.
DIVIDEND YEILD RATIO:
Dividend Yield or Dividends paid to holders of common stock are set by management,
usually with regard to the company's earnings. There is no guarantee that future
dividends will match past dividends or even be paid at all. The most commonly-cited
figure for dividend yield is the historic yield which is calculated using the following
formula
Dividend Yield Ratio = Dividend
Current Market Price
R. V. Institute of Management, Bengaluru Page 24
A study on fundamental equity valuation of the stock
YEAR 2014 2013 2012 2011 2010
RATIO 1.1 1.1 1 0.8 0.7
1.2
1
0.8
0.6 Ratios0.4
0.2
02014 2013 2012 2011 2010
Chart 4.1.6: Dividend Yield Ratio of reliance industries ltd
Interpretation:-
The dividends are paid on the face value of 10. The company paid the dividend in both
the year i.e. in 2013 and 2014 11 or 110 %. But in the year 2010 the company paid the
dividend of 7 or 70%. There is a increase of 4 or 40% in the payment of the dividend.
Which shows the good sign to the company for the long run.
DIVIDEND PAYOUT RATIO:
Dividend payout ratio is the fraction of net income a firm pays to its stockholders in
dividends. It is the percentage of earnings paid to shareholders in dividends. It is
calculated as follows;
R. V. Institute of Management, Bengaluru Page 25
A study on fundamental equity valuation of the stock
Dividend payout ratio = Dividend paid *100
EPS
Year 2014 2013 2012 2011 2010
Ratio 12.7 12.51 12.62 11.75 12.84
13
12.8
12.6
12.412.2
12 Ratios
11.8
11.6
11.411.2
2014 2013 2012 2011 2010
Chart 4.1.7: Dividend Payout Ratio of reliance industries ltd
Interpretation:-
In the above graph it states that the firm’s ability to pay the dividends to the
shareholders. Even firm’s payment ratio is increasing. The firm here is able to pay the
dividends. The payout ratio is minor fluctuation every year. In the year 2010 it was
12.84, in the year 2011 there was decrease to 11.75 in 2012 and it has increased to
12.51, in the year 2013 it was goes to12.62 and in the year 2014 it was goes up to 12.7.
EARNING RETANTION RATIO:
The percentage of a publicly-traded company's post-tax earnings that are not paid in
dividends. Most earnings retained are re-invested into the company's operations.
Tracking year-on-year earnings retention ratios is important to fundamental analysis to
investigate whether a company is increasing or decreasing its rate of re-investment.
R. V. Institute of Management, Bengaluru Page 26
A study on fundamental equity valuation of the stock
Calculated as:
Year 2014 2013 2012 2011 2010
Ratio 87.3 87.49 86.41 87.85 86.42
88
87.5
87
86.5Ratios
86
85.52014 2013 2012 2011 2010
Chart 4.1.8: Earning Retention Ratio of reliance industries ltd
Interpretation:-
The retention ratio of the company in the year 2010 and 2012 was 86.4 it means in
that year the company has utilized the less funds of its shareholders compare to rest
of three years. In the year 2011 the ratio was more it means that less of its earnings
have been declared as the dividend. Less of the fund of that year has been retained.
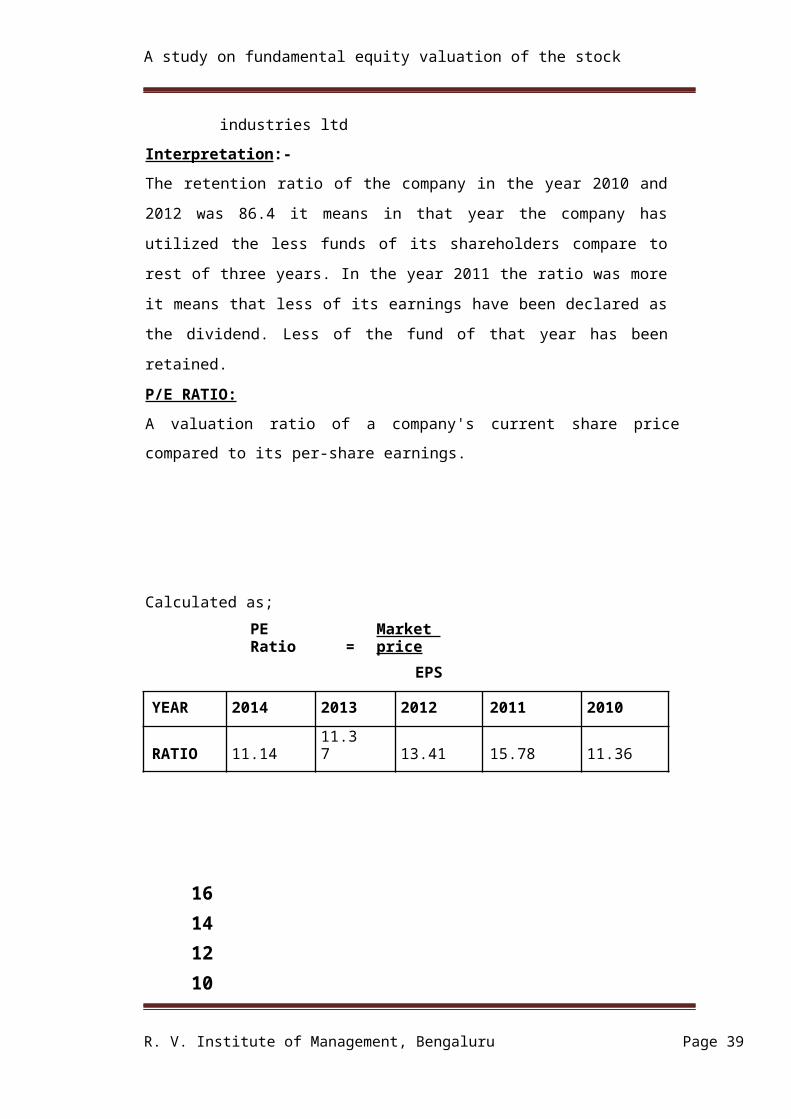
P/E RATIO:
A valuation ratio of a company's current share price compared to its per-share
earnings.
R. V. Institute of Management, Bengaluru Page 27
A study on fundamental equity valuation of the stock
Calculated as;
PE Ratio = Market price
EPS
YEAR 2014 2013 2012 2011 2010
RATIO 11.14 11.37 13.41 15.78 11.36
16
14
12
10
8 Ratios6
4
20
2014 2013 2012 2011 2010
Chart 4.1.9: P/E Ratio of reliance industries ltd
Interpretation:-
The P/E Ratio (Prospective) is high in the year 2011. And in the year 2014 it was less
compare to other four years. It decreased in the 2014. This is only because of the
changes in the market price of the stock every year.
PRICE TO BOOK VALUE:
A ratio used to compare a stock's market value to its book value. It is calculated by
dividing the current closing price of the stock by the latest quarter's book value per
share. Also known as the "price-equity ratio".
R. V. Institute of Management, Bengaluru Page 28
A study on fundamental equity valuation of the stock
Calculated as:
Year 2014 2013 2012 2011 2010
Ratio 609.78 557.49 498.21 446.25 392.51
700
600
500
400
300 Ratios
200
100
02014 2013 2012 2011 2010
Chart 4.1.10: Price to Book Value of reliance industries ltd
Interpretation:-
The Book value is too high in the year 2014. It has increased from 2010. And there is
continuous increase in the share price. On the book value of the share we cannot take
any kind of decision for the investment. Because it is historical value.
R. V. Institute of Management, Bengaluru Page 29
A study on fundamental equity valuation of the stock
Fundamental Ratios of Reliance Industries Limited
2014 2013 2012 2011 2010
Current Ratio1.11 1.43 1.44 1.16 1.04
Quick Ratio 1.03 1.12 1.17 0.94 0.69
Return on Equity11.15 11.66 12.30 13.88 12.64
Debt Equity Ratio 0.43 0.30 0.36 0.46 0.49
Dividend Yield Ratio 1.1 1.1 1.0 0.8 0.7
Dividend Payout Ratio 12.7 12.51 12.62 11.75 12.84
Earnings Retention Ratio 87.3 87.49 86.41 87.85 86.42
P/E Ratio 11.14 11.37 13.41 15.78 11.36
Price to Book Value 609.78 557.49 498.21 446.25 392.51
EPS Ratio 68.02 65.05 61.26 61.97 49.64
4.1: Table showing Financial Ratios of Reliance Industries
CAGR of DPS = ( DPS of year 2015 ÷ DPS of year 2010) - 1
DPS for year 2014 is Rs.9.5 for a face value of Rs.10. (9.5 X 5years= 47.5)
= (9.5 ÷ 7) - 1
= 0.3157 OR 35.71 %
Average Retention Ratio = (0.873+0.875+0.864+0.878+0.864) / 5 =
0.871 OR 87.1%
Average Payout Ratio = (1 – 0.6241)
= 0.376 OR 37.6%
Average Return on equity = ( 0.11+0.12+0.12+0.14+0.13) / 5 =
0.1233 OR 12.33 %
Expected Growth Rate (g) = Average Retention Ratio X Average Return on Equity.
R. V. Institute of Management, Bengaluru Page 30
A study on fundamental equity valuation of the stock
= 0.871 X 0.123
= 0.1071 OR 10.71 %
Constant Growth Model:
Using this model Required rate of return is found.
Po = D1
r-g
Po= Present value of the stock= 861 as on Feb-2015
D1=The next year dividend = Do(1+g) = 9.5 (1 + 0.1071) = 10.52 per share r =
Required rate of the return = ?
g = the growth rate = 10.71% OR 0.1071
r = D1 + g
Po
r = 11.93%
The investors required rate of return would be r = 11.93%
Single Period Valuation Model:
Applying the single period valuation model and finding out share prices for next
year.
Po = D 1 + P 1
1+r 1+r
Where,
Po= Present selling price = Rs.861 as on Feb-2015 P1=
Selling price at the end of one year period
D1= the dividend received during the one year holding period, D1= Do (1+g)
Do = Current year dividend=9.5
r = Investor’s Required rate of return = 11.93%
D1= Do (1+g) = 9.5(1 + 0.1071) = 10.52 per share
P1 = 1068.16/per shareTwo Stage Growth Model:
R. V. Institute of Management, Bengaluru Page 31
A study on fundamental equity valuation of the stock
Po = Current selling price = ?
r = Required rate of the return = 0.1193 or 11.93%
g1 = Extraordinary growth rate applicable for ‘n’ years = 0.15 or 15% g2 =
Normal growth rate applicable after ‘n’ years = 0.1052 or 10.52% n = 5
years
D0 = 9.5
By substituting the above stated values the calculated current stock price is: Po
= Rs.864.04 per share.
4.2Key Financial Ratios of Indian Oil Corporation Ltd;
CURRENT RATIO:
The current ratio is a financial ratio that measures whether or not a firm has
enough resources to pay its debts over the next 12 months. It compares a firm's
current assets to its current liabilities. A current ratio of assets to liabilities of 2:1 is
usually considered to be acceptable
Current Ratios = Current assets
Current liabilities
Year 2014 2013 2012 2011 2010
Ratio 0.81 0.84 0.83 0.8 0.76
0.84
0.82
0.8
0.78Ratios
0.76
0.74
0.72
R. V. Institute of Management, Bengaluru Page 32
A study on fundamental equity valuation of the stock
2014 2013 2012 2011 2010
Chart 4.2.1: Current Ratio of Indian Oil Corporation Ltd
Interpretation:-
The current ratio in the year 2010 was 0.76, and in the year 2011 it has increased to
0.80 which shows the good indication to the company. And in the year 2012 it has
been increased again to 0.83,in the year 2013 it was 0.84, and in the year 2014 it
was decreased to 0.81. At least it has to maintain its current ratio= 2:1
QUICK RATIO:
Quick ratio is a test of liquidity than the current ratio. The term liquidity refers to the
ability of a firm to pay its short-term obligation as & when they become due. Quick ratio
may be defined as the relationship between quick or liquid assets and current liabilities.
An assets is said to be liquid if it is converted into cash within a short period without loss
of value.
Year 2014 2013 2012 2011 2010
Ratio 0.64 0.79 0.74 0.51 0.45
0.8
0.7
0.6
0.5
0.4Ratios
0.3
0.2
0.10
2014 2013 2012 2011 2010
Chart 4.2.2: Quick Ratio of Indian Oil Corporation Ltd
Interpretation:
According above shown graph in the year 2010 there was lower ratio compare to the
other four years ratio so, that was bad sign for the company and there was lower cash
R. V. Institute of Management, Bengaluru Page 33
A study on fundamental equity valuation of the stock
convertible assets. And in the year 2013 it was 0.79 higher than the other four years
ratio, and in the year 2014 it was 0.64.
DEBT-EQUITY RATIO:
The Debt / Equity ratio measures the long term financial solvency of firm. It also
reflects the relative proportion of debt and equity in financing the asset of the firm. It
is calculated as follows,
D/E Ratio = Total debt
Shareholders equity
Year 2014 2013 2012 2011 2010
Ratio 1.22 1.28 1.22 0.95 0.88
1.4
1.2
1
0.8
0.6 Ratios
0.4
0.2
02014 2013 2012 2011 2010
Chart 4.2.3: Debt-Equity Ratio of Indian Oil Corporation Ltd
Interpretation:-
The debt equity ratio is the relationship between the borrowed funds and the owner’s
capital. Here in the following graph it is declared that the debt equity ratio is
increasing comparing to past year. But in the year 2014 it is comparatively decrease.
It means that the creditors are putting more money of their own and hence it is a good
sign to the company.
RETURN ON EQUITY:
The Return on equity shows how much returns is being earned .this is made from the
point of view of the shareholders .if the return on equity is more then it is said to be the
R. V. Institute of Management, Bengaluru Page 34
A study on fundamental equity valuation of the stock
most demanded shares in the market.
Return on equity = PAT *100
Shareholders fund
YEAR 2014 2013 2012 2011 2010
RATIO 10.64 8.2 6.83 13.45 20.21
25
20
15
10Ratios
5
02014 2013 2012 2011 2010
Chart 4.2.4: Return on Equity Ratio of Indian Oil Corporation Ltd
Interpretation:
The Return on equity shows how much returns is being earned .this is made from the
point of view of the shareholders .if the return on equity is more then it is said to be the
most demanded shares in the market.
But in the following graph there was decrease in the ratio from 2008 to 2009. But there
was slight rise in the year 2010.
EARNING PER SHARE:
Earnings per-share (EPS) is the amount of earnings per each outstanding share of a
company's stock. It can be calculated in the following way
EPS = Net profit available to the equity shareholders *100
R. V. Institute of Management, Bengaluru Page 35
A study on fundamental equity valuation of the stock
Number of ordinary shares outstanding
Year 2014 2013 2012 2011 2010
Ratio 28.91 20.61 16.29 30.67 42.1
454035302520 Ratios151050
2014 2013 2012 2011 2010
Chart 4.2.5: Earning Per Share Ratio of Indian Oil Corporation Ltd
Interpretation:-
The EPS indicates the earnings of a share. By the following graph it is clear that the
EPS is fluctuated between the five years. But there was an increase in the year 2010
comparing to other four years. It shows that the company is going to be financially
strengthen in the years
DIVIDEND YIELD RATIO:
Dividend Yield or Dividends paid to holders of common stock are set by management,
usually with regard to the company's earnings. There is no guarantee that future
dividends will match past dividends or even be paid at all. The most commonly-cited
figure for dividend yield is the historic yield which is calculated using the following
formula
Dividend Yield Ratio = Dividend
R. V. Institute of Management, Bengaluru Page 36
A study on fundamental equity valuation of the stock
Current Market Price
YEAR 2014 2013 2012 2011 2010
RATIO 3.4 2 1.6 2.6 4.4
4.54
3.53
2.52 Ratios
1.51
0.50
2014 2013 2012 2011 2010
Chart 4.2.6: Dividend Yield Ratio of Indian Oil Corporation Ltd
Interpretation:-
In the year 2008 the company has announced the dividend of 5.50 or 55 % and in the
year 2009 it has been increased to 7.5 or 75 % which is a very good to the investors
and in the year 2010 it has been increased to 13 or 130 %. It depends upon the nature
of the investors, some are interested in the capital appreciation and few are in dividends.
The dividends are paid on face value of 10.
DIVIDEND PAYOUT RATIO:
Dividend payout ratio is the fraction of net income a firm pays to its stockholders in
dividends. It is calculated as follows;
Dividend payout ratio = Dividend paid *100
EPS
R. V. Institute of Management, Bengaluru Page 37
A study on fundamental equity valuation of the stock
Year 2014 2013 2012 2011 2010
Ratio 30.09 30.07 30.69 30.97 30.88
31
30.8
30.6
30.4
30.2 Ratios
30
29.8
29.62014 2013 2012 2011 2010
Chart 4.2.7: Dividend Payout Ratio of Indian Oil Corporation Ltd
Interpretation:-
This states the firm’s ability to pay the dividends to the shareholders. The dividend
payment ratio in the year 2011 is 30.97 that’s highest among the five years and in the
last two year 2013 and 2014 it were 30.07 and 30.09 are lower. The graph shows the
decreasing trend year by year.
EARNINGS RETANTION RATIO:
The percentage of a publicly-traded company's post-tax earnings that are not paid in
dividends. Most earnings retained are re-invested into the company's operations. Tracking
year-on-year earnings retention ratios is important to fundamental analysis to investigate
whether a company is increasing or decreasing its rate of re-investment.
R. V. Institute of Management, Bengaluru Page 38
A study on fundamental equity valuation of the stock
Calculated as:
Year 2014 2013 2012 2011 2010
Ratio 60.66 69.89 89.34 67.78 69.62
908070605040 Ratios3020100
2014 2013 2012 2011 2010
Chart 4.2.8: Earning Retention Ratio of Indian Oil Corporation Ltd
Interpretation:-
The retention ratio of the company in the year 2012 it was 89.34 it means in that year
the company has utilized the more funds of its shareholders comparing to both the
five years. In the year 2014 it was 60.66, the ratio was less it means that more of its
earnings have been declared as the dividend. Less of the fund of that year has been
retained.
R. V. Institute of Management, Bengaluru Page 39
A study on fundamental equity valuation of the stock
P/E RATIO:
A valuation ratio of a company's current share price compared to its per-share earnings.
Calculated as;
PE Ratio = Market price
EPS
YEAR 2014 2013 2012 2011 2010
RATIO 8.6 16.8 17.6 11.4 6.6
18161412108 Ratios6420
2014 2013 2012 2011 2010
Chart 4.2.9: P/E Ratio of Indian Oil Corporation Ltd
Interpretation:
The P/E Ratio was high in the year 2012 i.e.,17.6 and in the year 2010 it was just 6.6.
And in decreased in the year 2014 it has come to 8.6. This is only because of the changes
in the market price every year.
PRICE TO BOOK VALUE:
A ratio used to compare a stock's market value to its book value. It is calculated by
dividing the current closing price of the stock by the latest quarter's book value per
share.
R. V. Institute of Management, Bengaluru Page 40
A study on fundamental equity valuation of the stock
Also known as the "price-equity ratio".
Calculated as:
Year 2014 2013 2012 2011 2010
Ratio 271.8 251.75 238.38 227.9 208.21
300
250
200
150 Ratios
100
50
02014 2013 2012 2011 2010
Chart 4.2.10: Price to Book Value of Indian Oil Corporation Ltd
Interpretation:-
The Book value is too high in the year 2014.It has increased from 2010. On the book
value of the share we cannot take any kind of decision for the investment. Because it is
historical value.
R. V. Institute of Management, Bengaluru Page 41
A study on fundamental equity valuation of the stock
Fundamental Ratios of Indian Oil Corporation
2014 2013 2012 2011 2010
Current Ratio 68.02 65.05 61.26 61.97 49.64
Quick Ratio 0.64 0.79 0.74 0.51 0.45
Return on Equity 10.64 8.2 6.83 13.45 20.21
Debt Equity Ratio 1.22 1.28 1.22 0.95 0.88
Dividend Yield Ratio 3.4 2.0 1.6 2.6 4.4
Dividend Payout Ratio 30.09 30.07 30.69 30.97 30.88
Earnings Retention
Ratio 60.66 69.89 89.34 67.78 69.62
P/E Ratio 8.6 16.8 17.6 11.4 6.6
Price to Book Value 271.8 251.75 238.38 227.9 208.21
EPS Ratio 28.91 20.61 16.29 30.67 42.1
4.2: Table Showing Financial Ratios of Indian Oil Corporation
CAGR of DPS = ( DPS of year 2015 ÷ DPS of year 2010) - 1
DPS for year 2015 is Rs.8.7 for a face value of Rs.10. (8.7 X 5 years)
= (8.7 ÷ 13) - 1
= 0.3307 or 33.07
Average Retention Ratio = (60.66+69.89+89.34+67.78+69.62) / 5
= 71.58%
Average Payout Ratio = (1 – Average Retention Ratio)
= 1-0.7146
= 0.2854 OR 28.54%
Average Return on equity = ( 10.64+8.2+6.83+13.45) /5 =
R. V. Institute of Management, Bengaluru Page 42
A study on fundamental equity valuation of the stock
0.0782 OR 7.82%
Expected Growth Rate (g) = Average Retention Ratio X Average Return on Equity.
= 0.7158 X 0.0782
= 0.056 OR 5.6 %
Constant Growth Model:
Using this model Required rate of return is found.
Po = D1 r-g
r = Required rate of the return =? Po=
Present value of the stock
g = the growth rate = 5.6 % or 0.056
D1=The next year dividend = Do(1+g) = 8.5 (1 + 0.056) = 8.97 per share
r = 8.3%
The investors required rate of return would be r =8.3 %
Single Period Valuation Model:
Applying the single period valuation model and finding out share prices for next
year.
Po = D 1 + P 1
1+r 1+r
Where,
Po= Present selling price = Rs. 330 as on Feb-2015 P1=
Selling price at the end of one year period
D1= the dividend received during the one year holding period, D1= Do (1+g)
Do = Current year dividend = 8.5
r = Investor’s Required rate of return = 8.3 or 0.083
D1= Do (1+g) = 8.5 (1 + 0.056) = 8.97 per share
P1 = 348.4 per share
R. V. Institute of Management, Bengaluru Page 43
A study on fundamental equity valuation of the stock
Two Stage Growth Model:
Po = Current selling price = ?
r = Required rate of the return = 0.083 or 8.3%
g1 = Extraordinary growth rate applicable for ‘n’ years = 0.24 or 24% g2 =
Normal growth rate applicable after ‘n’ years = 0.05 or 5%
n = 5 years
By substituting the above stated values the calculated current stock price is: Po
= Rs.610.93 per share
R. V. Institute of Management, Bengaluru Page 44
A study on fundamental equity valuation of the stock
4.3 COMPARISONS ANALYSIS:
The dividends are for the face value of Rs. 10
Particulars RIL IOC
Required Rate of Return ( r) using constant 10.72 8.3
growth model
Do: Current Year Dividend. 9.5 8.5
Expected Growth Rate ( g ) 10.71 5.6
D1: using [ Do (1 + g)] 10.52 8.97
P1: using Single Period Valuation (2013-2014) 942.78 339.60
Actual price of stock Feb-2015 861 331
Share price after 5 years using two stage 864.04 610.93
growth model
4.3: Table showing Comparison of Calculated prices and Actual prices of RIL & IOC
Interpretation based on the Intrinsic Value of the Stock;
If the actual price of the share in the market is more than the intrinsic value
(calculated price using models) of the stock then sell the share.
From the above table it can be seen that the intrinsic value of two companies is
less than the prevailing market price.
All the above stocks are over-valued or say over-priced as there’s a huge
difference between real and actual prices in the market.
Thus it can be interpreted that comparatively Reliance Industries Ltd & Indian Oil
Corporation stocks are better to hold on for some time. The dividend paid by Indian
Oil Corporation is lower than the Reliance Industries Ltd.
The investors can expect a moderate rate of return (8.3%) on stocks of Indian Oil
Corporation, with better growth rate of dividend (5.63%).
R. V. Institute of Management, Bengaluru Page 45
A study on fundamental equity valuation of the stock
An investor with a high risk and high expected earnings can invest into Reliance
Industries Ltd. and one with moderate risk taking ability can take up Indian Oil
Corporation Ltd. stocks.
R. V. Institute of Management, Bengaluru Page 46
A study on fundamental equity valuation of the stock
CHAPTER-5
FINDINGS, SUGGESTIONS AND CONCLUSION
5.1 FINDINGS:
Valuation of the stocks mainly has an impact of the dividend payout on it.
The intrinsic value of the stock at times will be lower than the actual prices of the
share due to the present value factor attached with it.
The intrinsic value of the stock also depends on the dividend declared to
shareholders, if the dividend paid is high then the intrinsic value will be higher,
compared to the one with low dividend.
If the actual prevailing price of the stock is less than that of Intrinsic then, its
suggested that investor can buy the share and can sell it back when prices reach its
true value. Thus the investor is assured to make a better profit out of the
difference.
5.2 SUGGESTIONS:
It is identified that by the analysis for both the company’s, RIL gives the good
return than the IOC.
Investors should be known about company information and financial related
information.
An investor need to go through the news about the company and have to specific
decision maker.
According to analysed stocks price might fail sometimes to meet the expected
return of the company.
Indian oil corporation stock price is expected to increase from 330 to 610.93 after
Five year i.e. near to double of the current price, so it suggest that investor go for
long term to IOC.
5.3 CONCLUSION:
R. V. Institute of Management, Bengaluru Page 47
A study on fundamental equity valuation of the stock
Through the analysis study concludes that the valuation of equity (stock) can be influenced by three factors: Required rate of return, Expected growth rate and the Dividend Payout policy of the company and also risk and return. The valuation of stock has different approaches. Application of all the approaches in practical is difficult and thus their results are different. From this analysis it can be conclude that Indian oil Corporation Ltd is better company to invest for the investors