Fundamental Probability and Statistics "There are known knowns. These are things we know that we know. There are known unknowns. That is to say, there are things that we know we don't know. But there are also unknown unknowns. There are things we don't know we don't know," Donald Rumsfeld
Transcript
Fundamental Probability and Statistics
"There are known knowns. These are things we know that we know. There areknown unknowns. That is to say, there are things that we know we don't know.But there are also unknown unknowns. There are things we don't know we don'tknow," Donald Rumsfeld
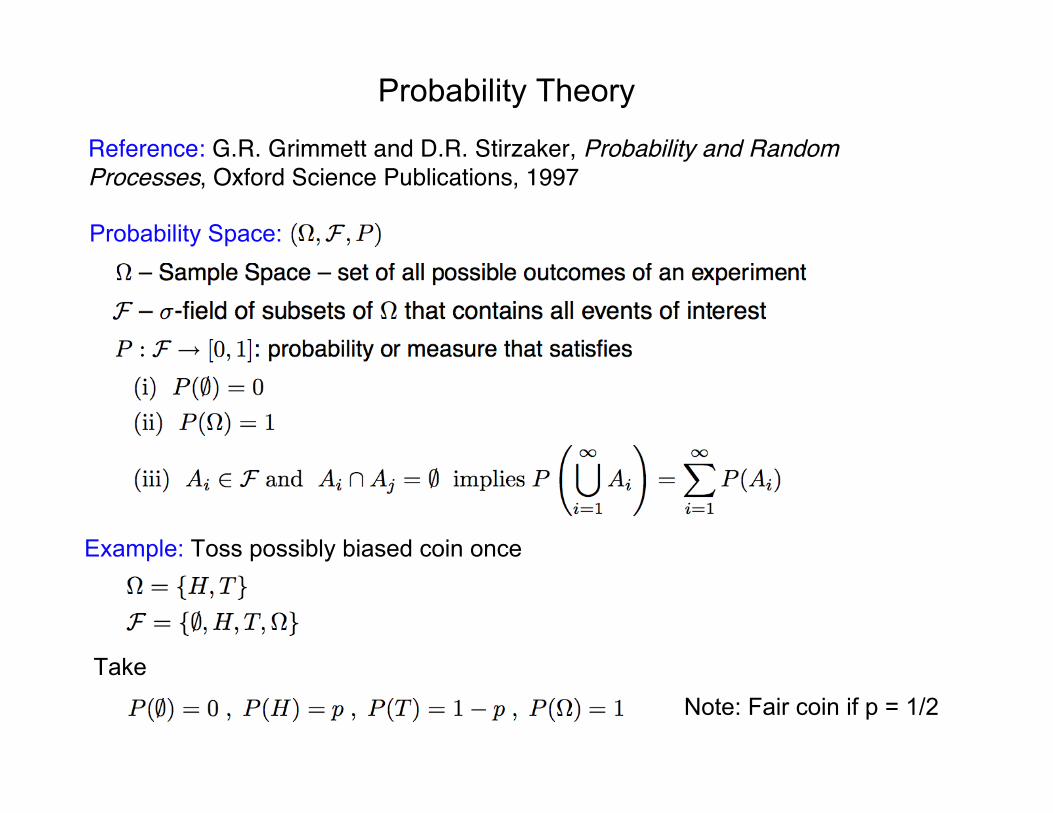
Probability Theory
Probability Space:
Reference: G.R. Grimmett and D.R. Stirzaker, Probability and RandomProcesses, Oxford Science Publications, 1997
Example: Toss possibly biased coin once
Take
Note: Fair coin if p = 1/2
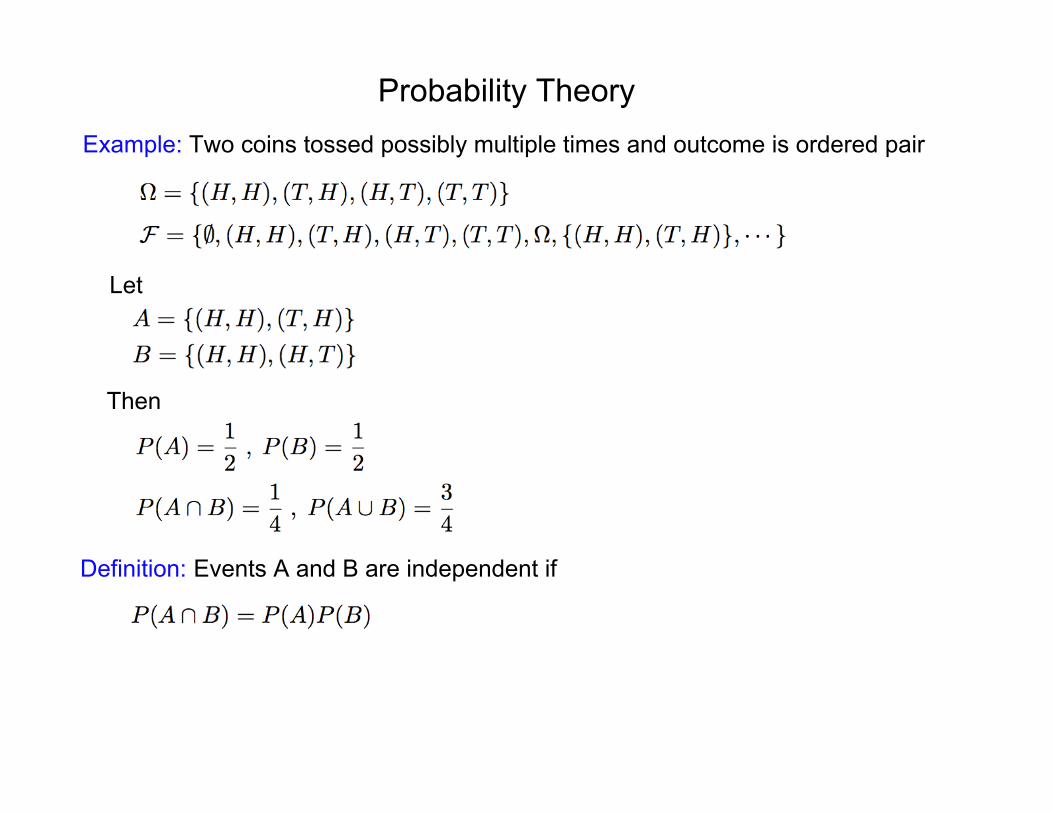
Probability TheoryExample: Two coins tossed possibly multiple times and outcome is ordered pair
Let
Then
Definition: Events A and B are independent if
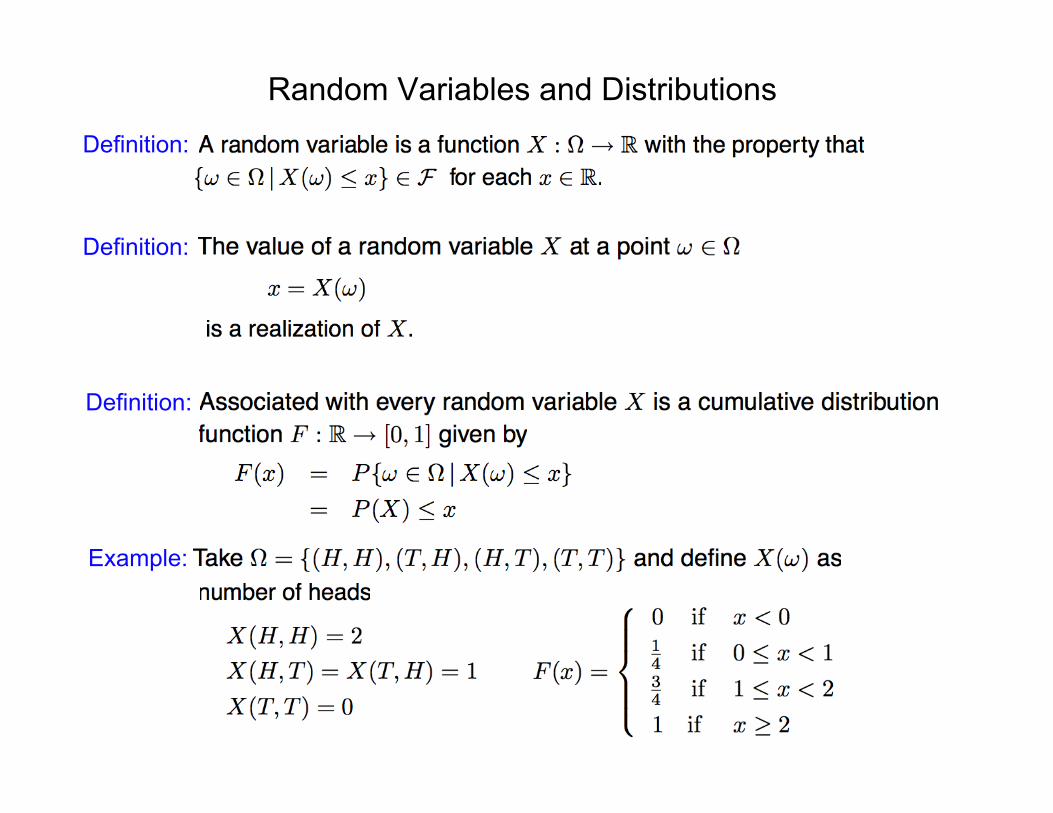
Random Variables and DistributionsDefinition:
Definition:
Definition:
Example:
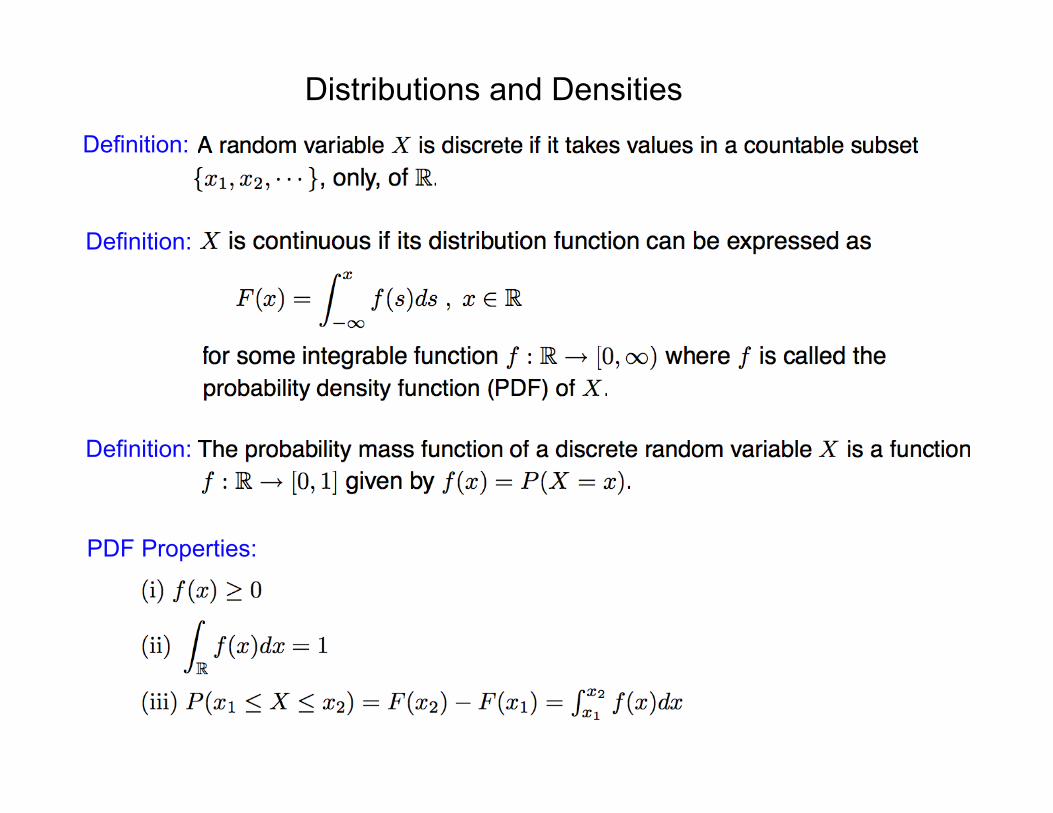
Distributions and DensitiesDefinition:
Definition:
Definition:
PDF Properties:
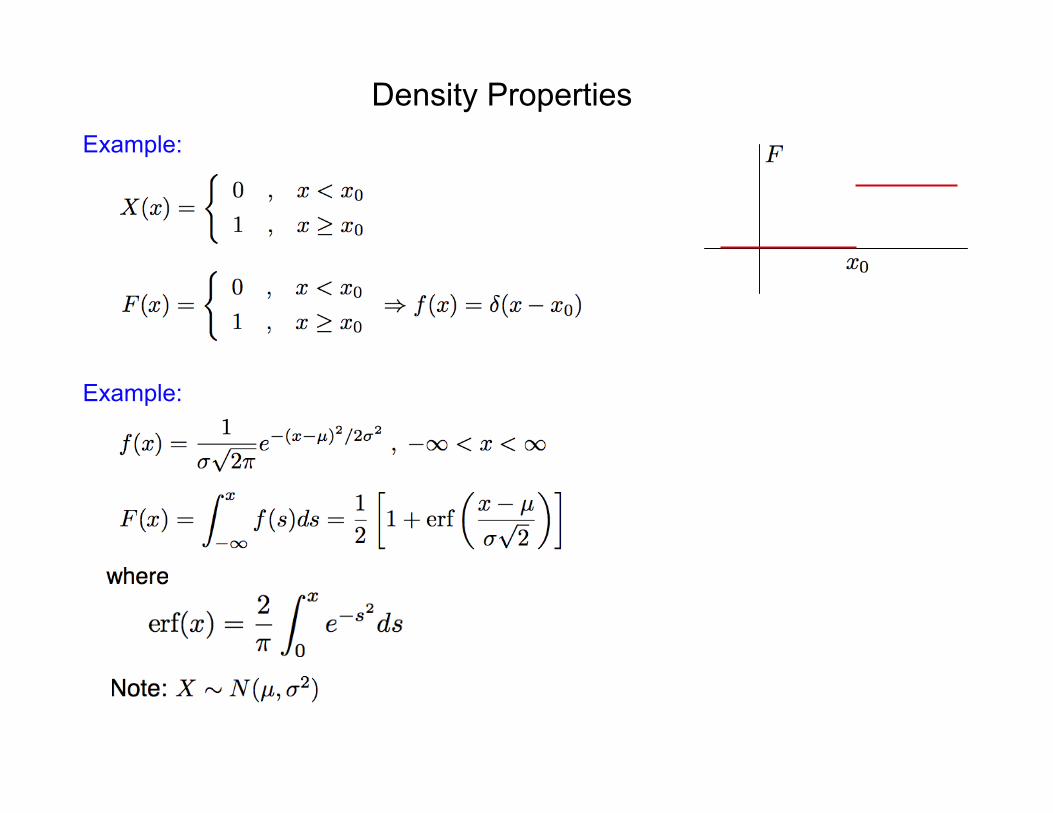
Density PropertiesExample:
Example:
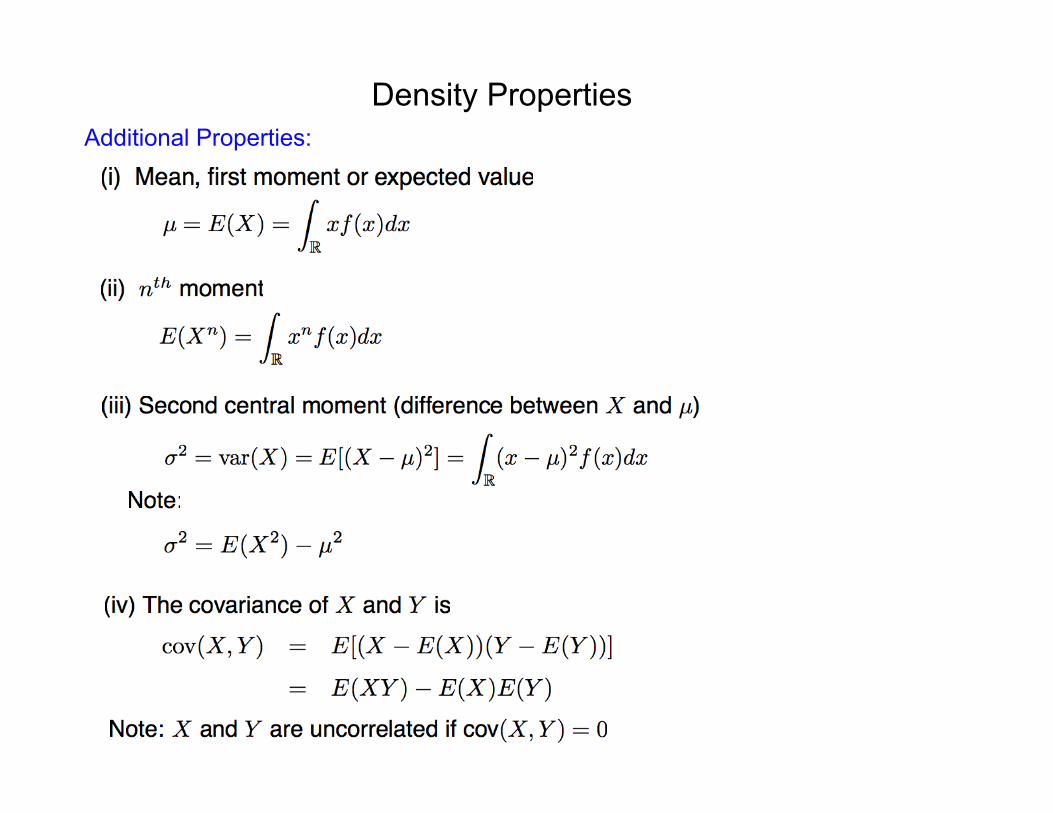
Density PropertiesAdditional Properties:
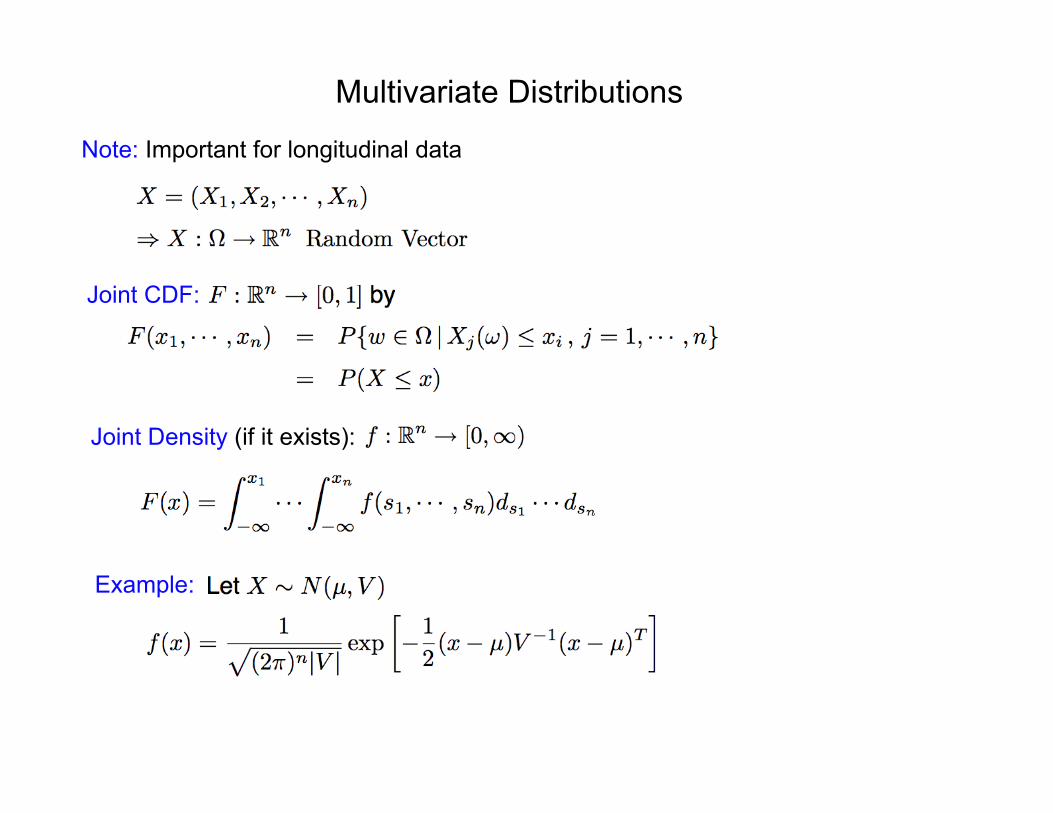
Multivariate Distributions
Note: Important for longitudinal data
Joint CDF:
Joint Density (if it exists):
Example:
Multivariate Distributions
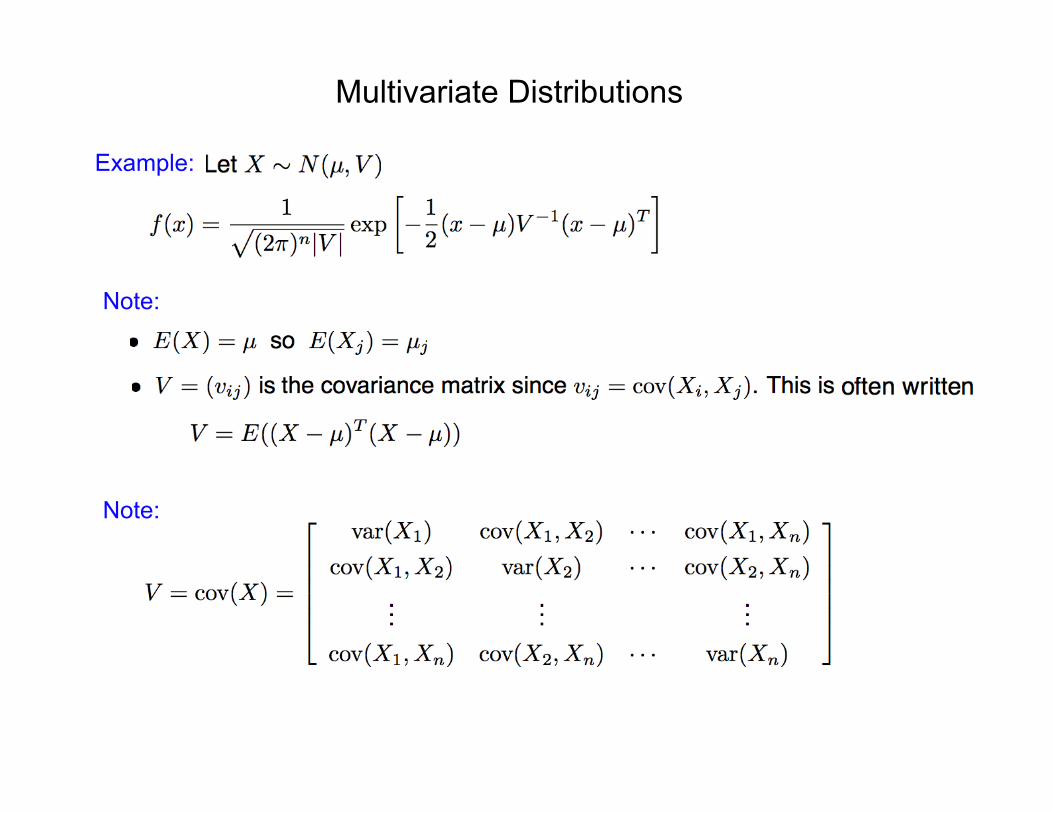
Example:
Note:
Note:
Multivariate Distributions
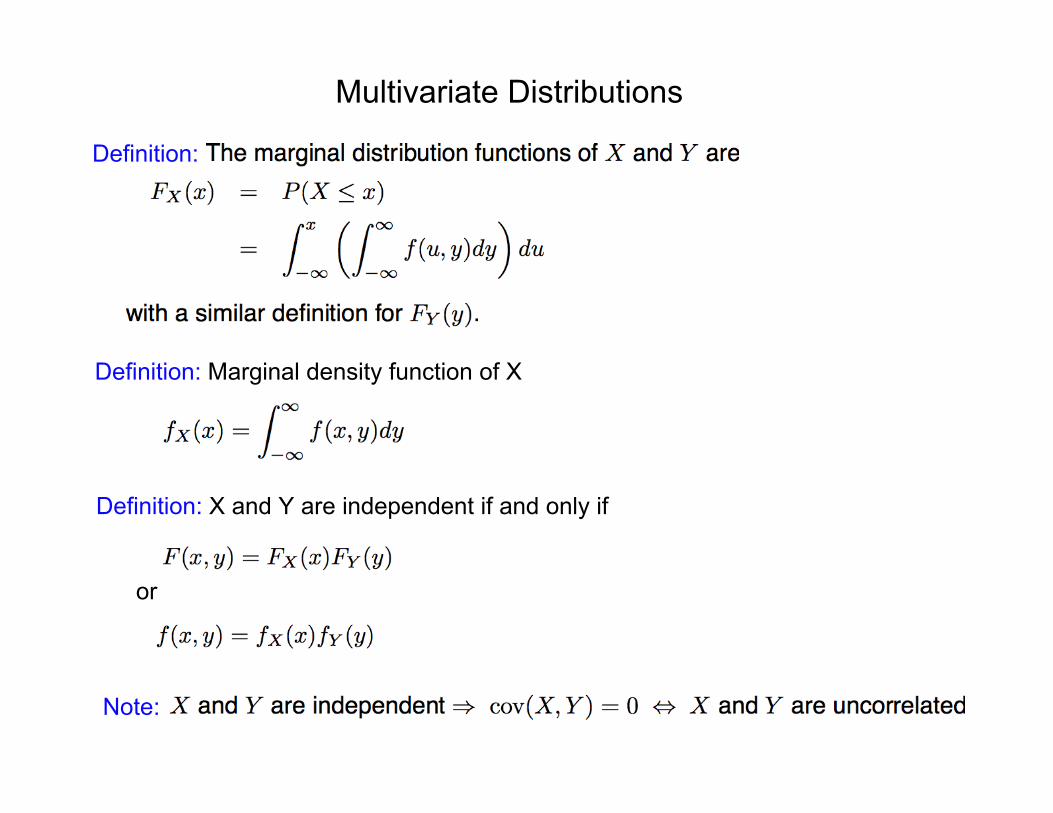
Definition:
Definition: Marginal density function of X
Definition: X and Y are independent if and only if
or
Note:
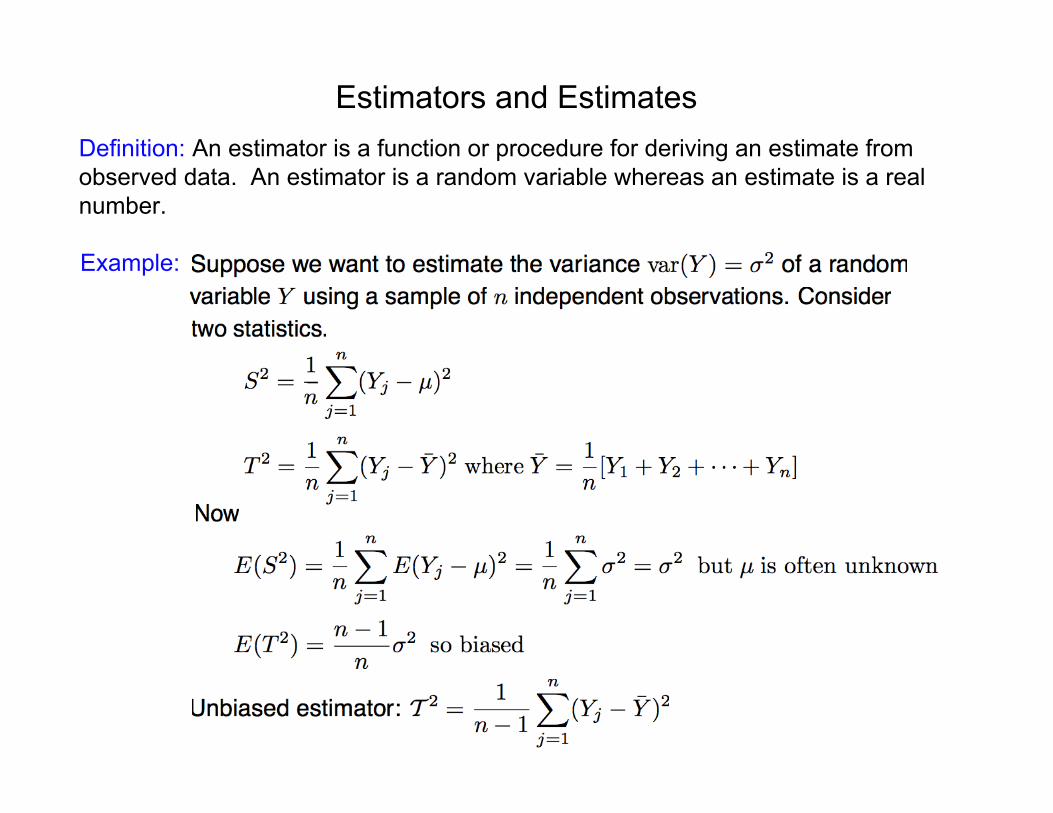
Estimators and EstimatesDefinition: An estimator is a function or procedure for deriving an estimate fromobserved data. An estimator is a random variable whereas an estimate is a realnumber.
Example:
Other EstimatorsCommonly Employed Estimators:
• Maximum likelihood
• Bayes estimators
• Particle filter (Sequential Monte Carlo (SMC))
• Markov chain Monte Carlo (MCMC)
• Kalman filter
• Wiener filter
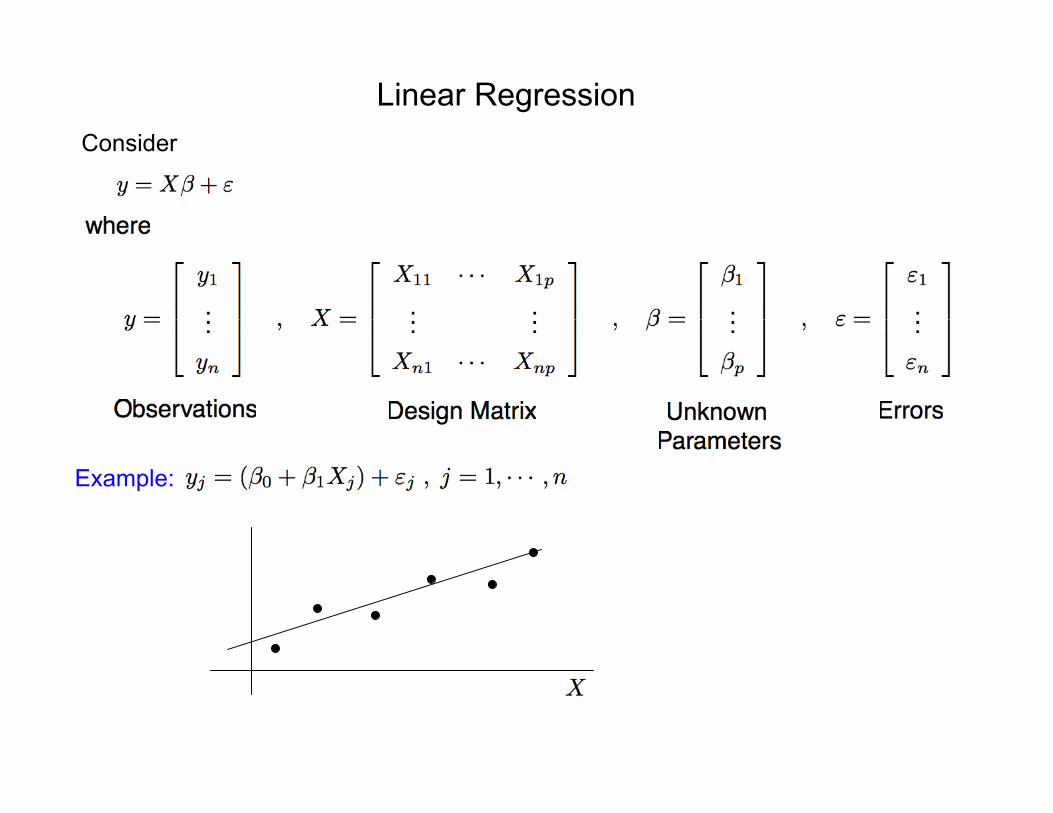
Linear RegressionConsider
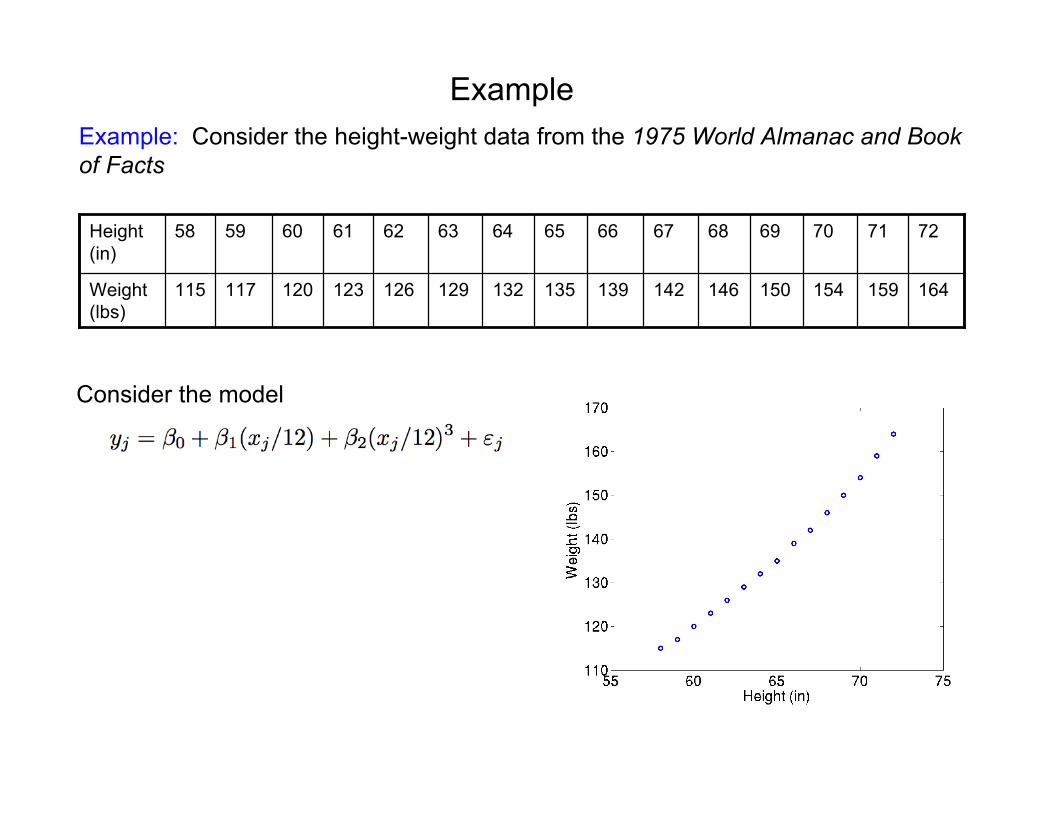
Example:
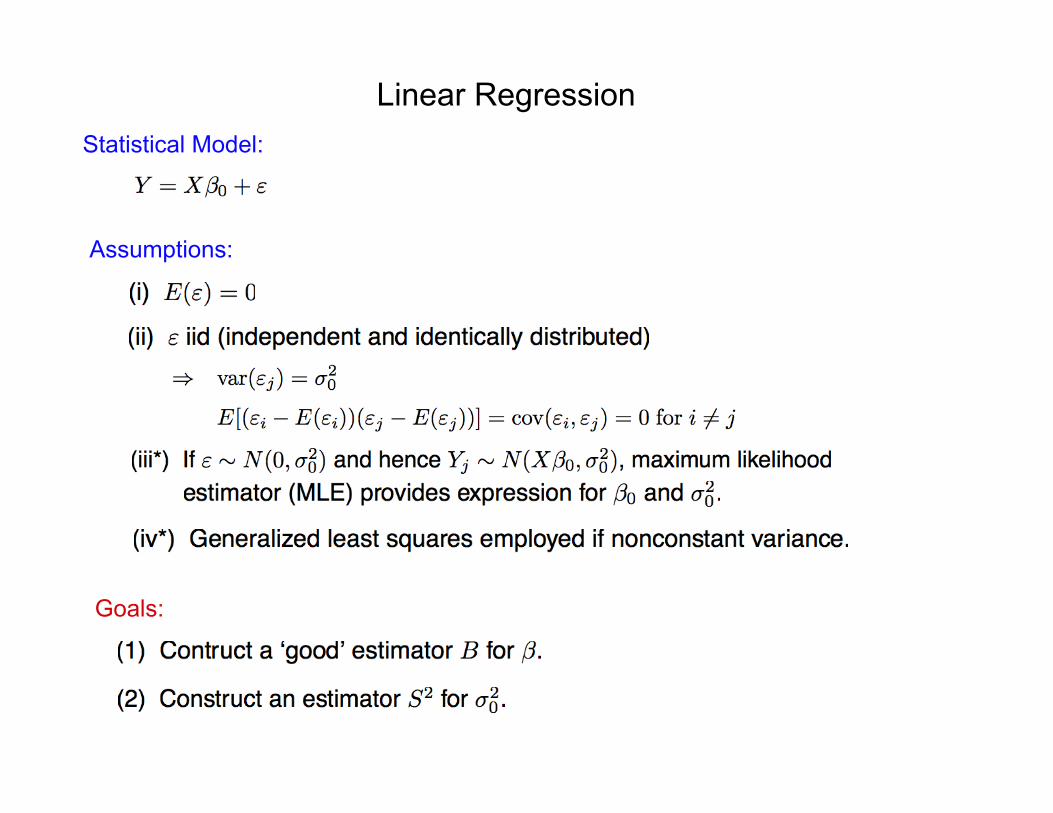
Linear RegressionStatistical Model:
Assumptions:
Goals:
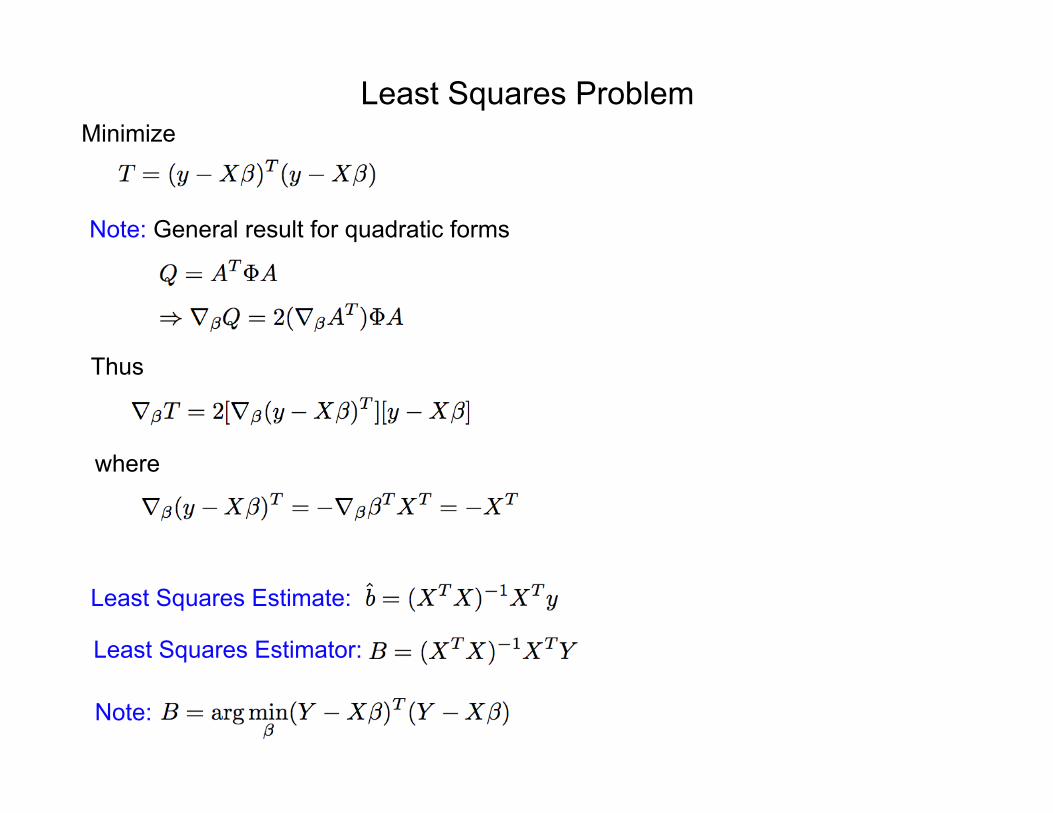
Least Squares ProblemMinimize
Note: General result for quadratic forms
Thus
where
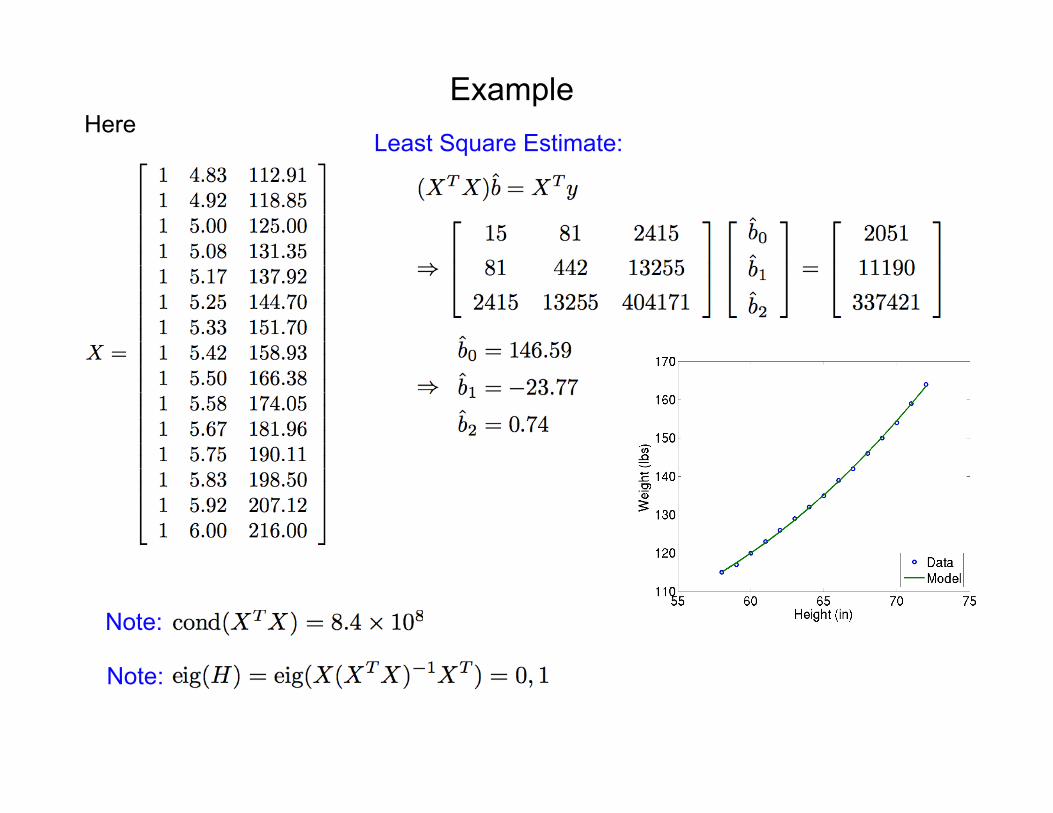
Least Squares Estimate:
Least Squares Estimator:
Note:
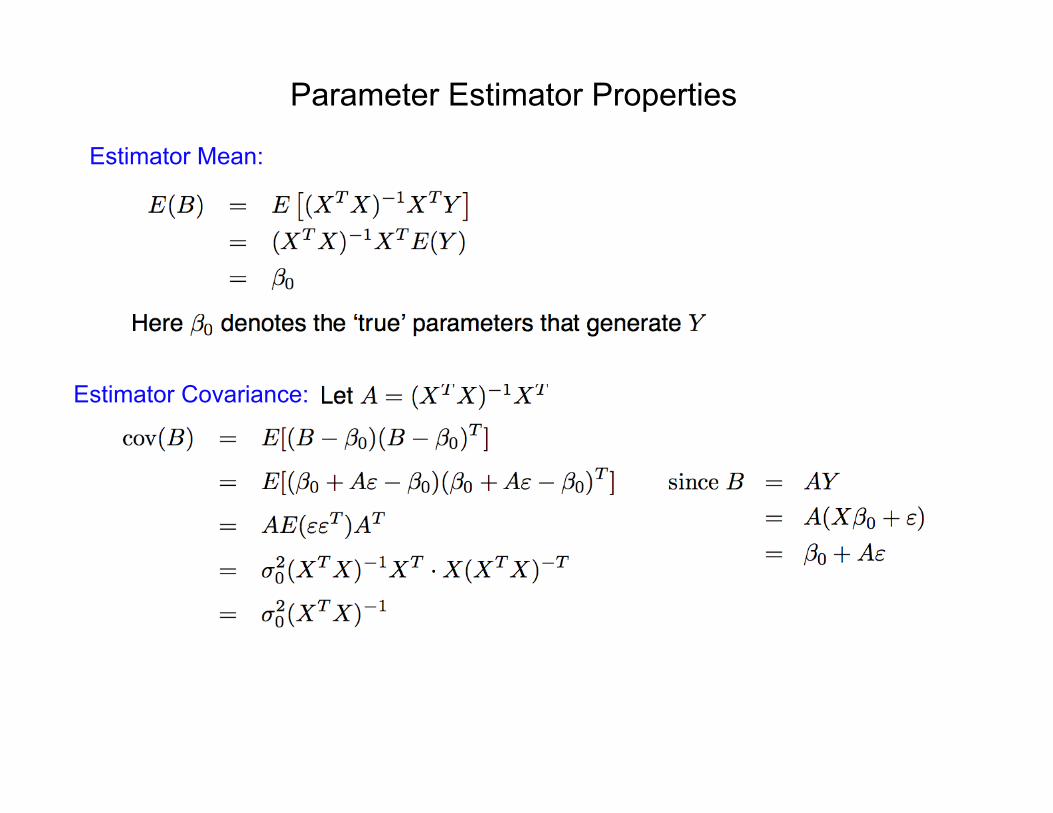
Parameter Estimator Properties
Estimator Mean:
Estimator Covariance:
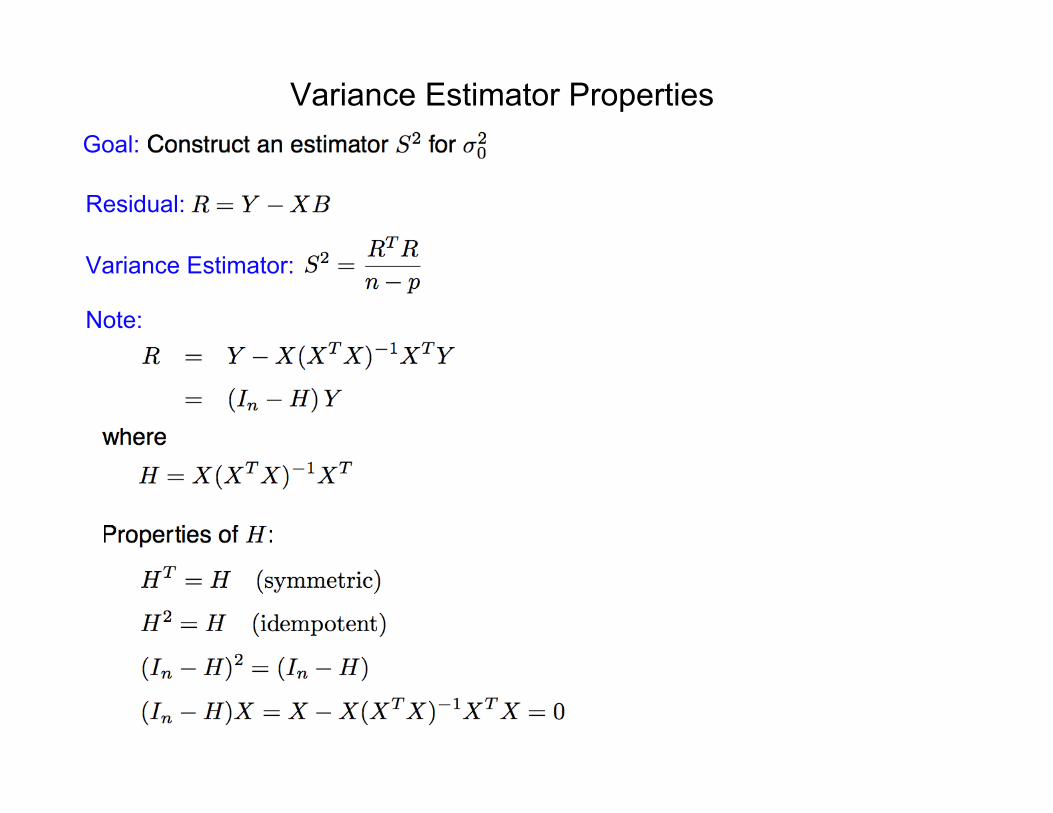
Variance Estimator PropertiesGoal:
Residual:
Variance Estimator:
Note:
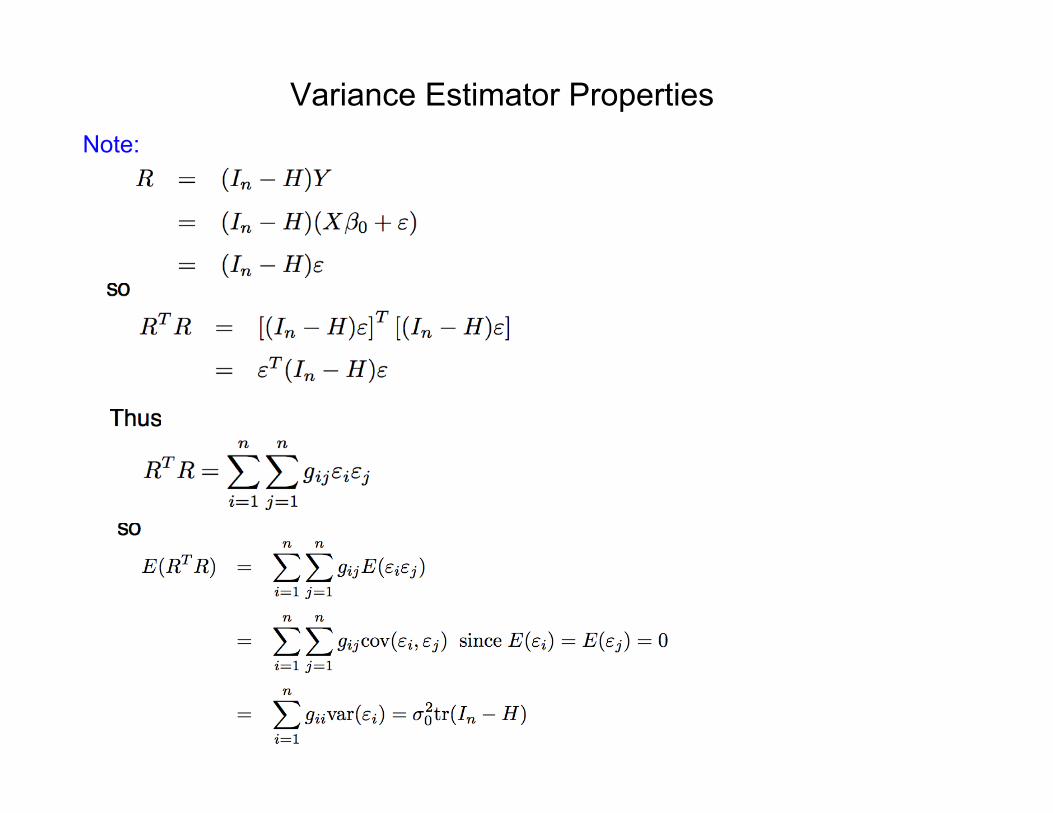
Variance Estimator PropertiesNote:
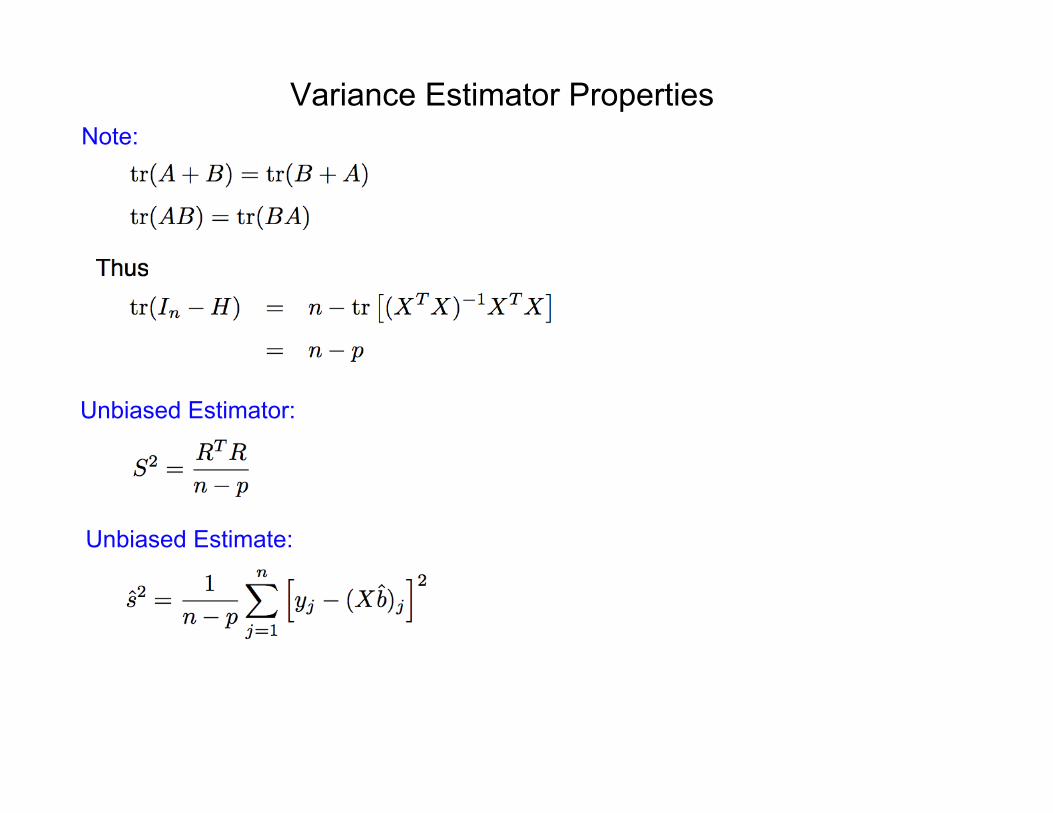
Variance Estimator PropertiesNote:
Unbiased Estimator:
Unbiased Estimate:
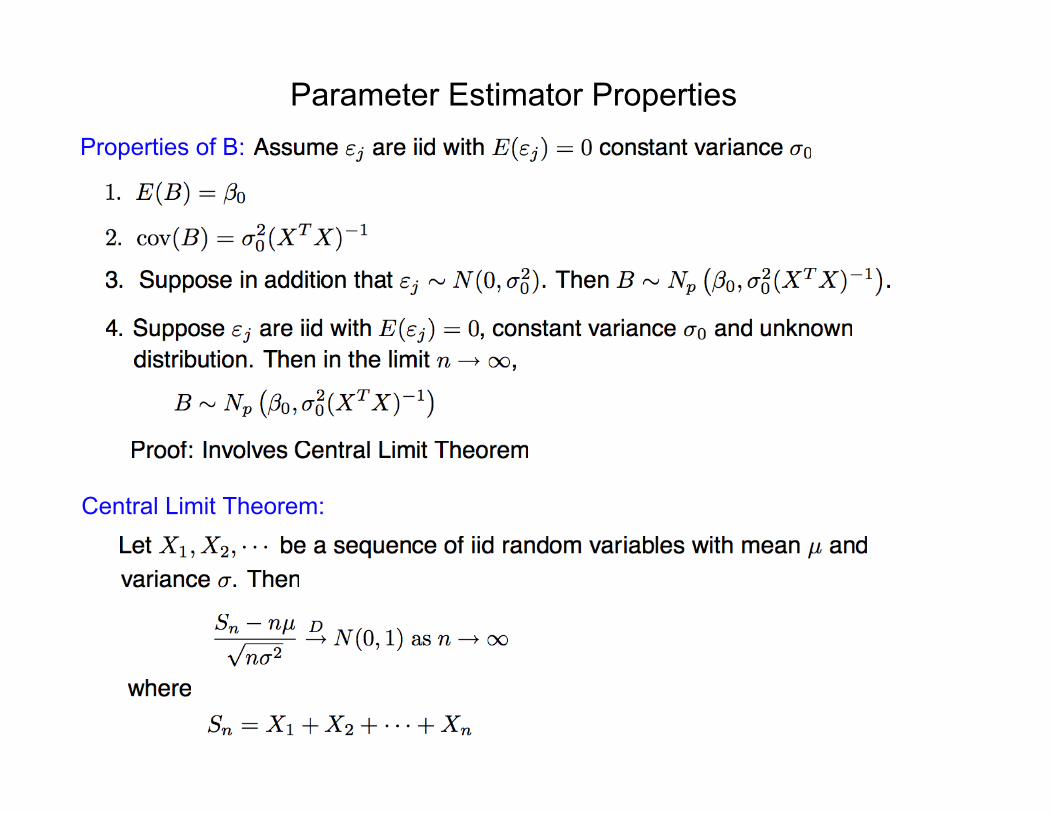
Parameter Estimator PropertiesProperties of B:
Central Limit Theorem:
ExampleExample: Consider the height-weight data from the 1975 World Almanac and Bookof Facts
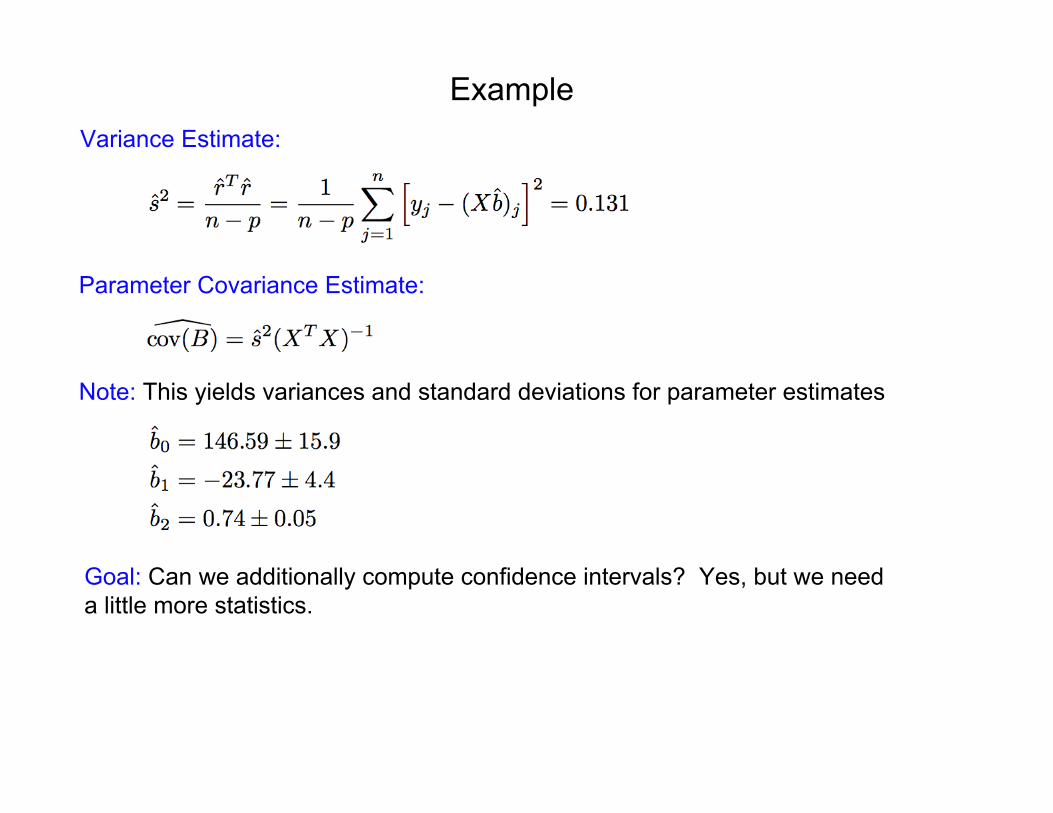
Note: This yields variances and standard deviations for parameter estimates
Goal: Can we additionally compute confidence intervals? Yes, but we needa little more statistics.
Example
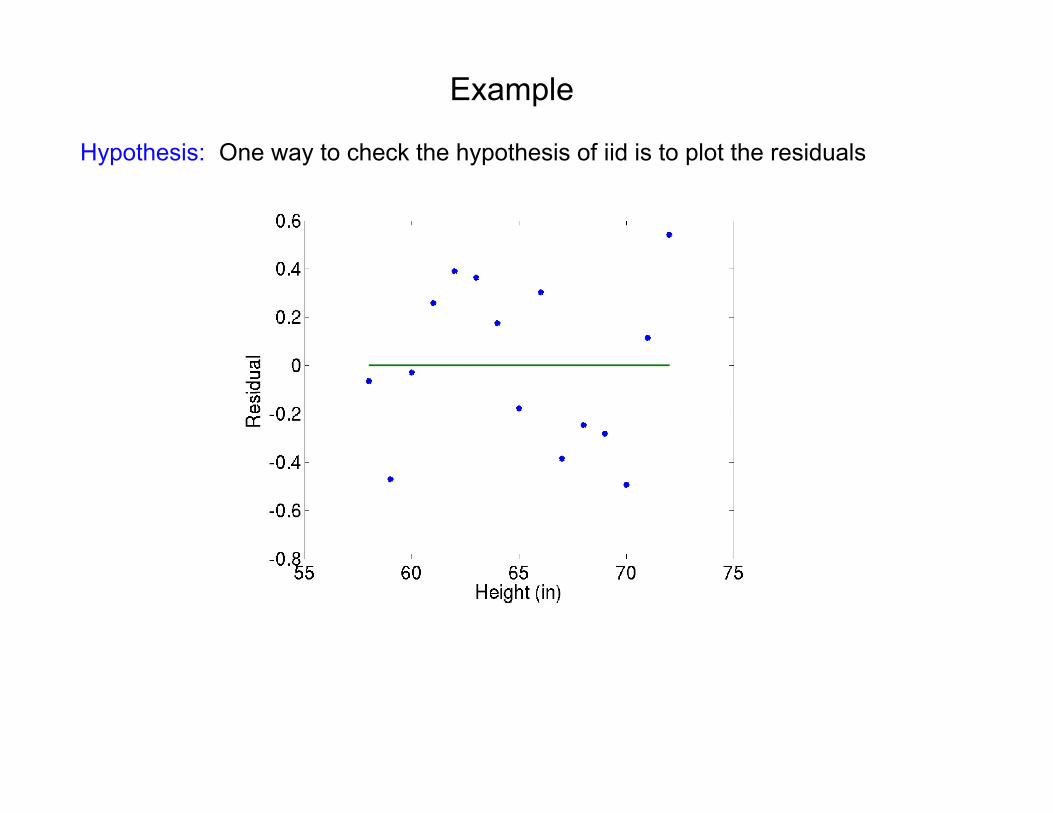
Hypothesis: One way to check the hypothesis of iid is to plot the residuals
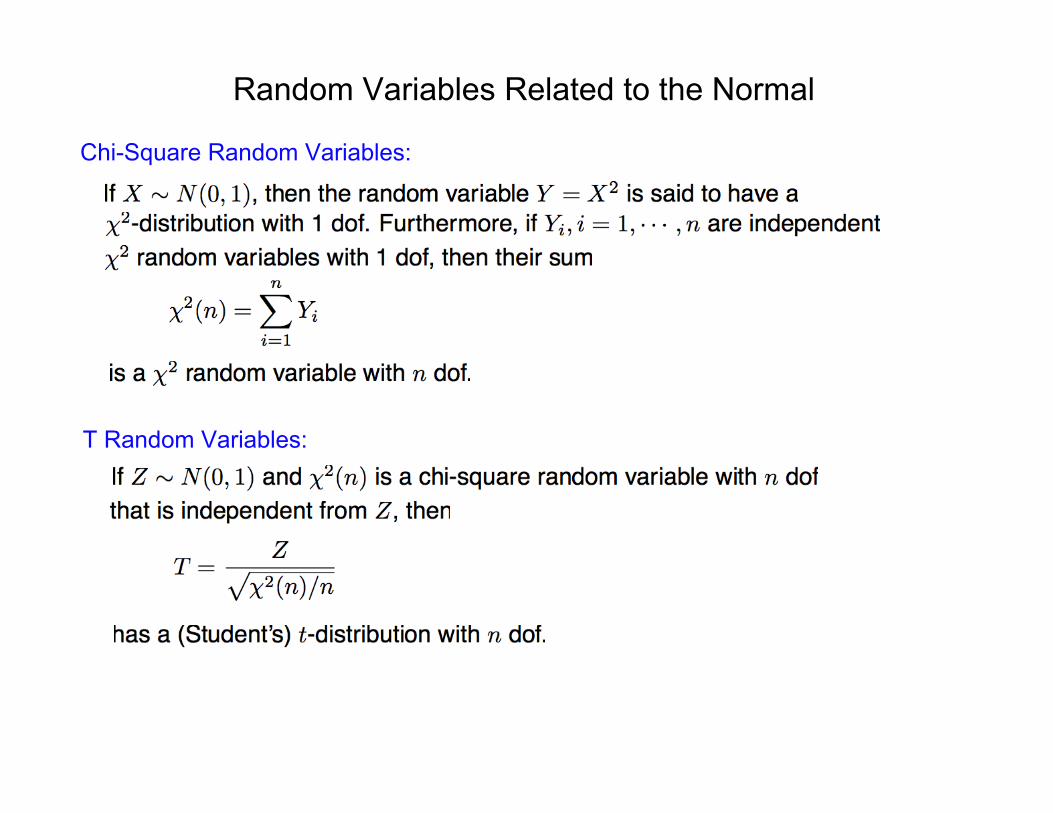
Random Variables Related to the Normal
Chi-Square Random Variables:
T Random Variables:
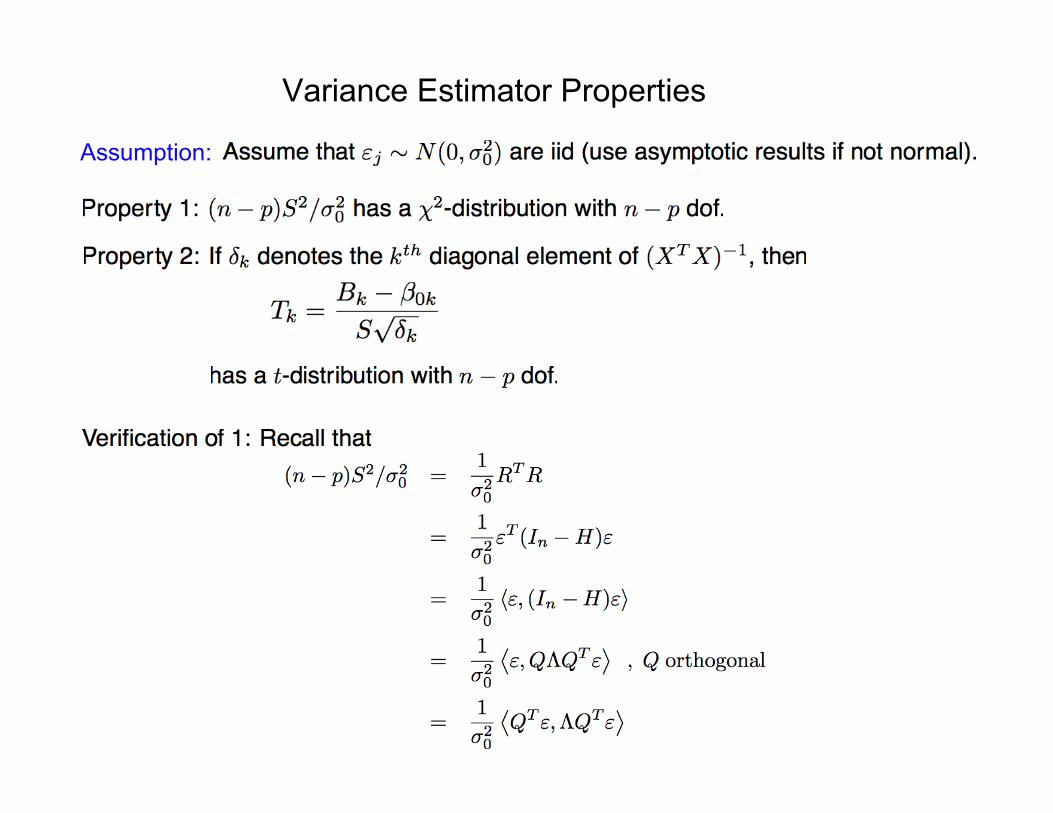
Variance Estimator Properties
Assumption:
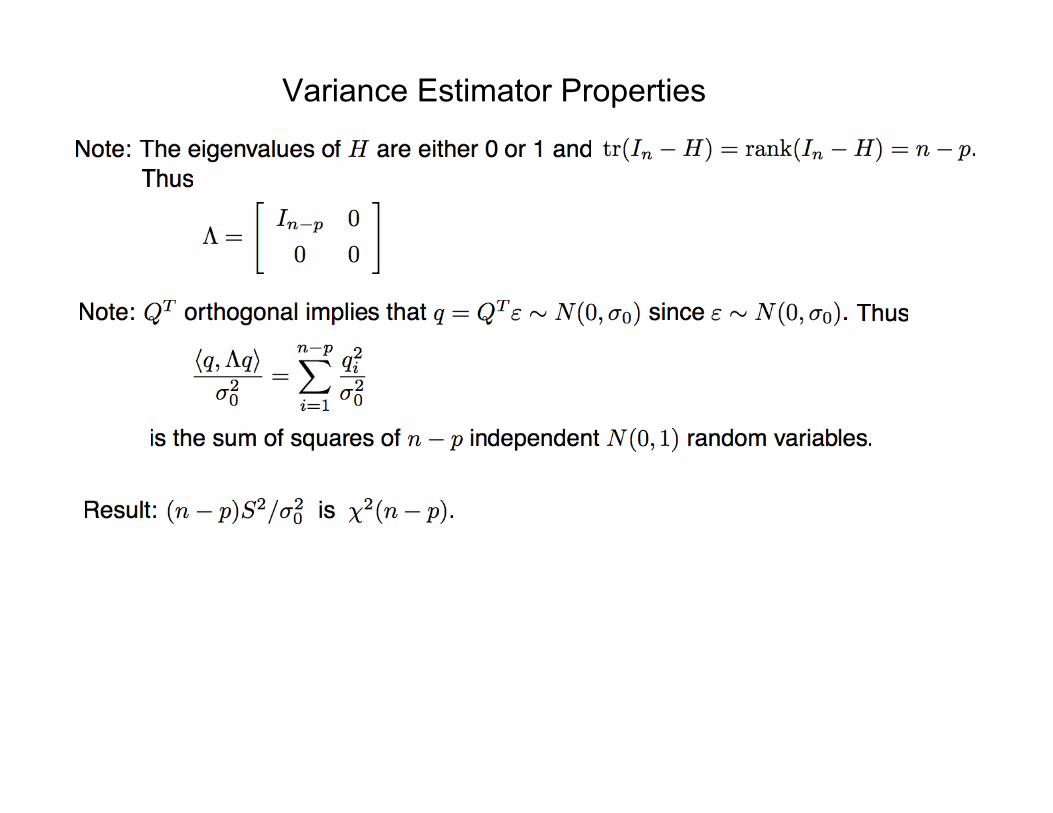
Variance Estimator Properties
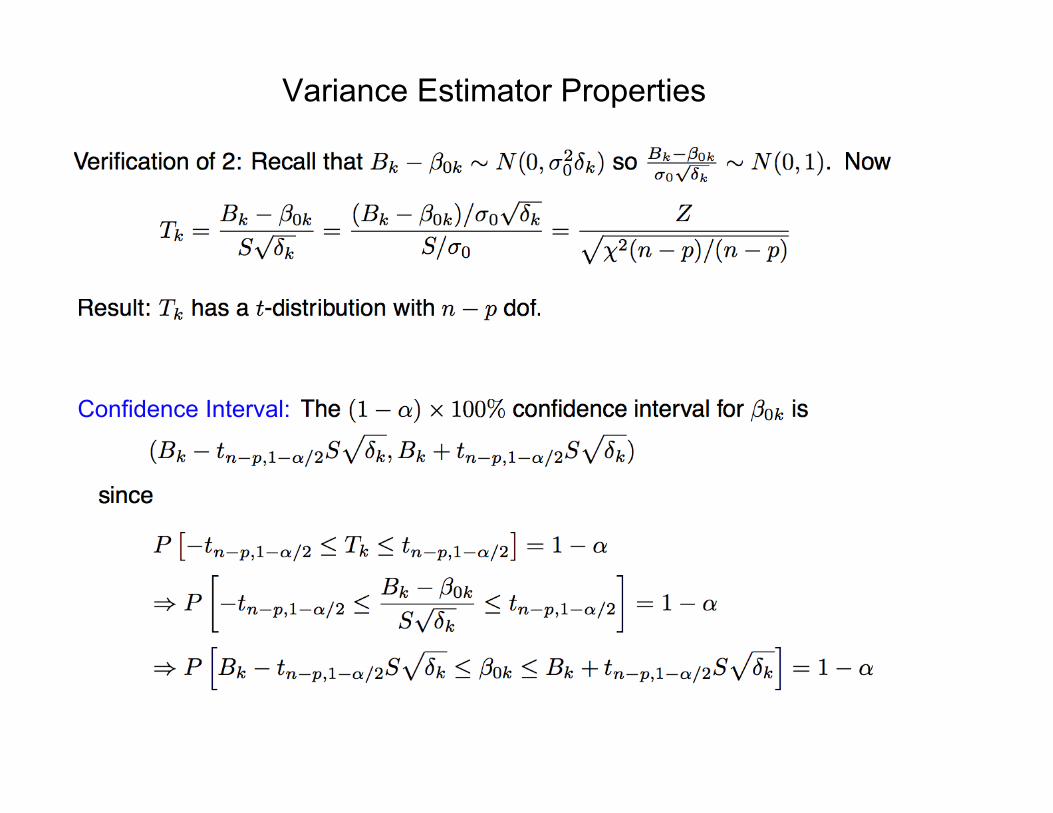
Variance Estimator Properties
Confidence Interval:
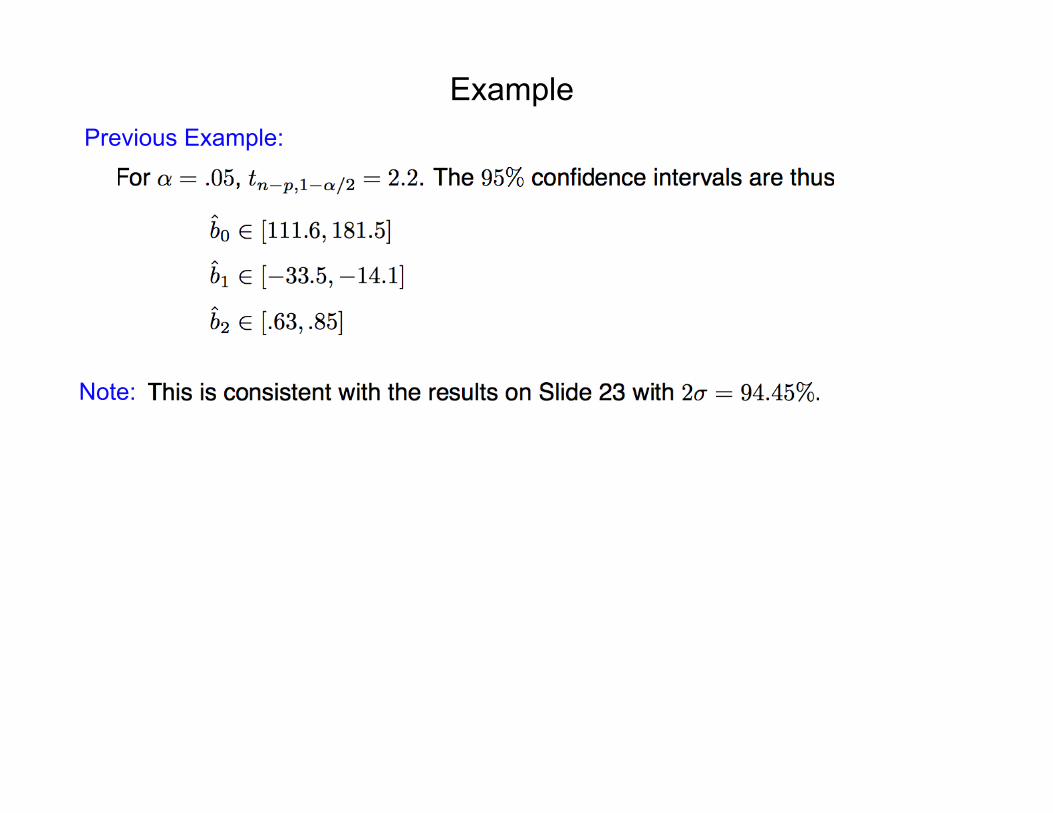
ExamplePrevious Example:
Note:
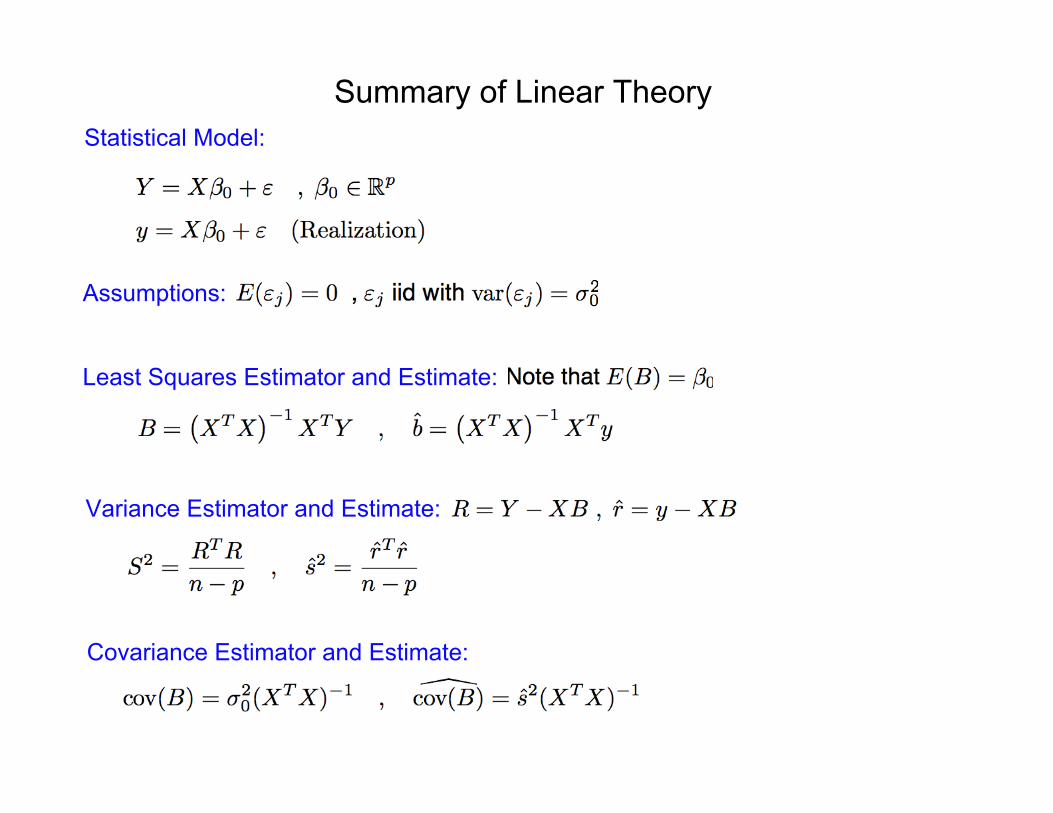
Summary of Linear TheoryStatistical Model:
Assumptions:
Covariance Estimator and Estimate:
Least Squares Estimator and Estimate:
Variance Estimator and Estimate:
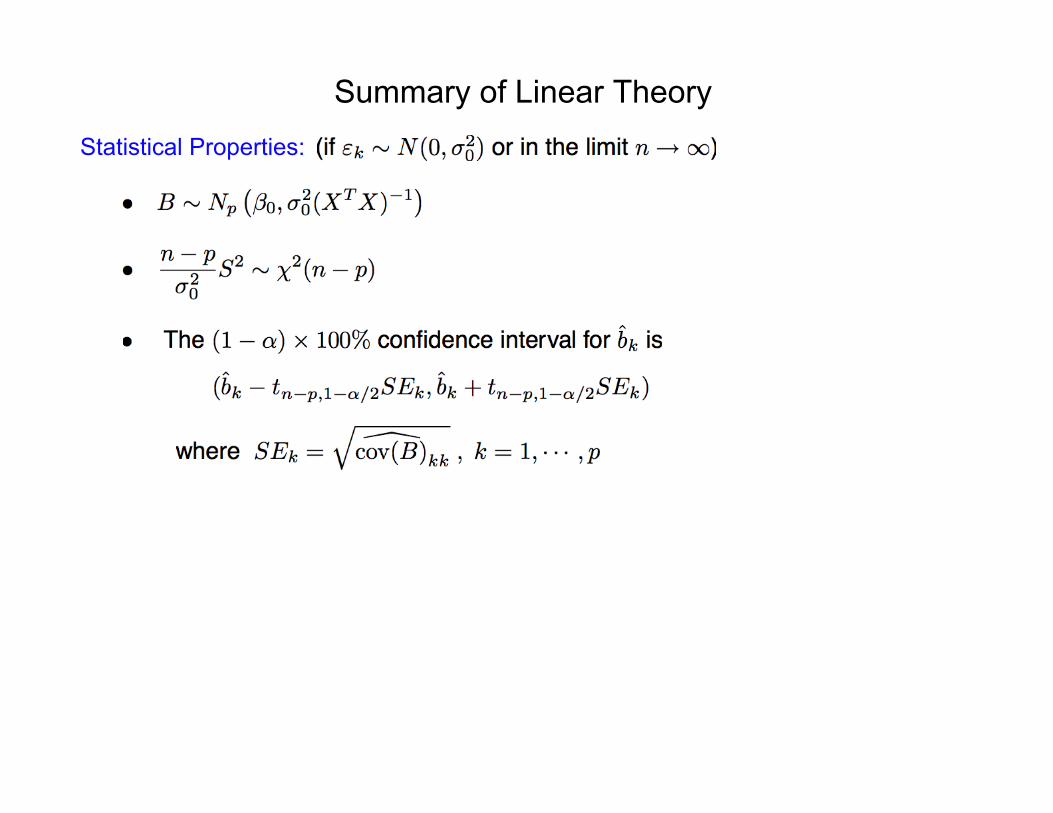
Summary of Linear TheoryStatistical Properties:
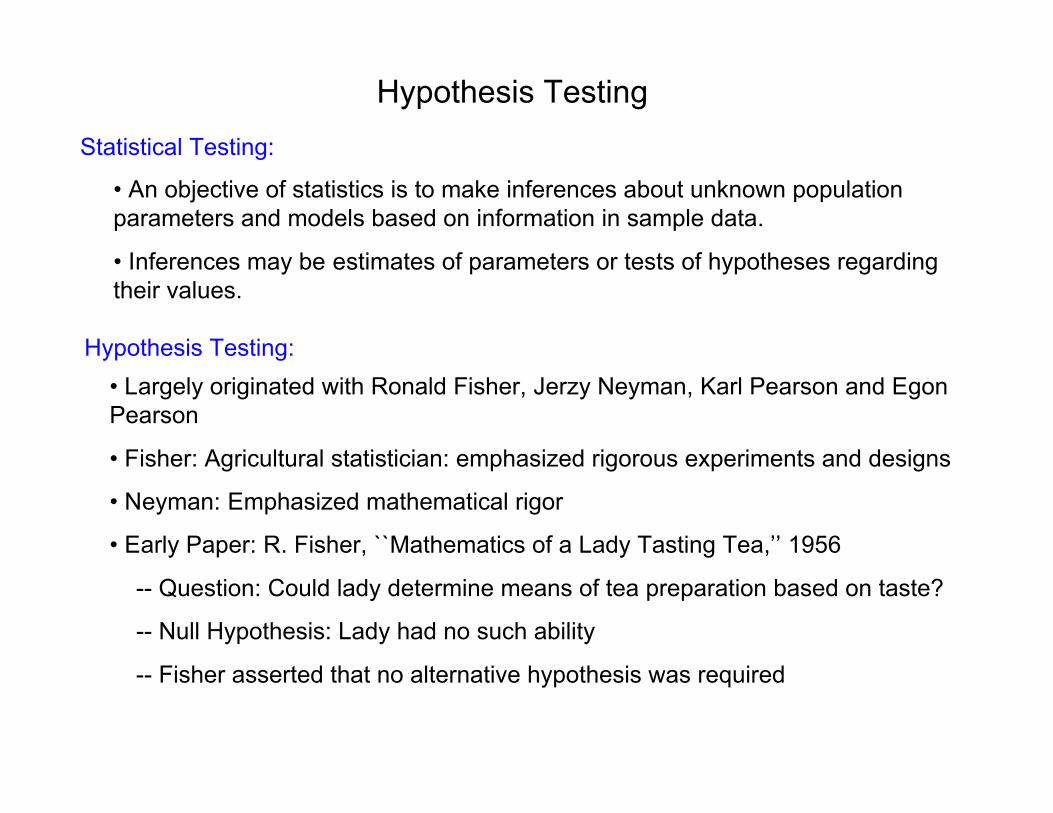
Hypothesis TestingStatistical Testing:
• An objective of statistics is to make inferences about unknown populationparameters and models based on information in sample data.
• Inferences may be estimates of parameters or tests of hypotheses regardingtheir values.
Hypothesis Testing:• Largely originated with Ronald Fisher, Jerzy Neyman, Karl Pearson and EgonPearson
• Fisher: Agricultural statistician: emphasized rigorous experiments and designs
• Neyman: Emphasized mathematical rigor
• Early Paper: R. Fisher, ``Mathematics of a Lady Tasting Tea,’’ 1956
-- Question: Could lady determine means of tea preparation based on taste?
-- Null Hypothesis: Lady had no such ability
-- Fisher asserted that no alternative hypothesis was required
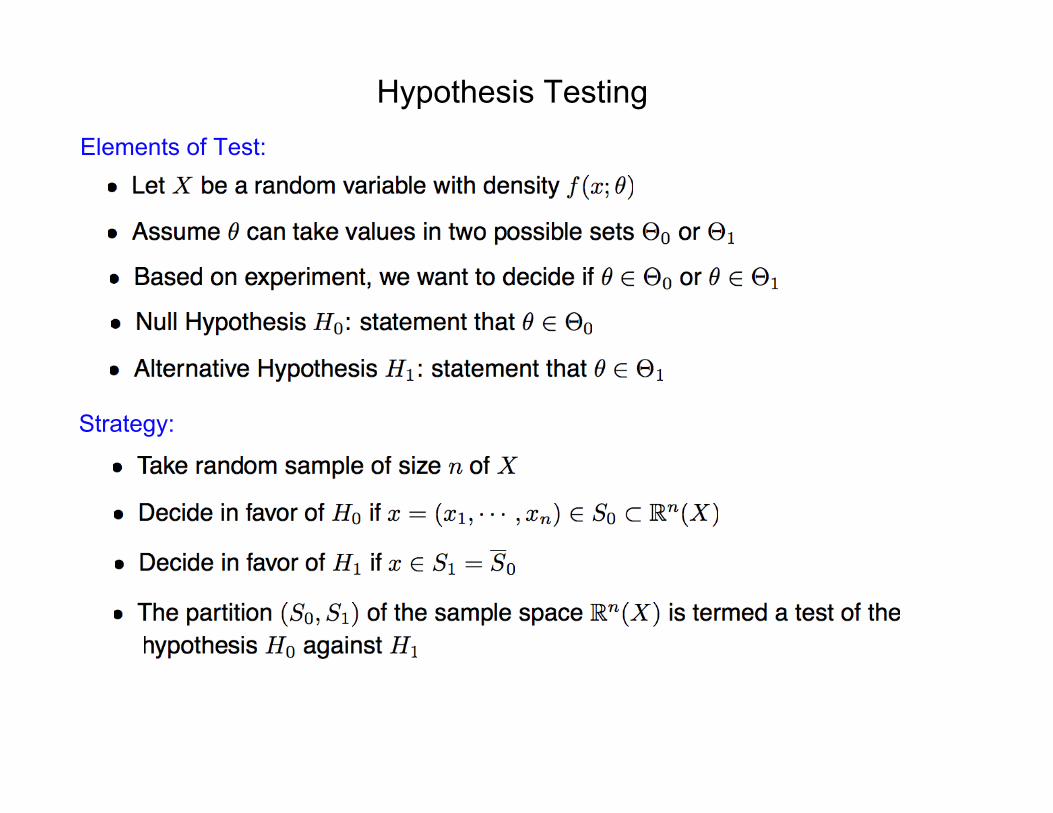
Hypothesis TestingElements of Test:
Strategy:
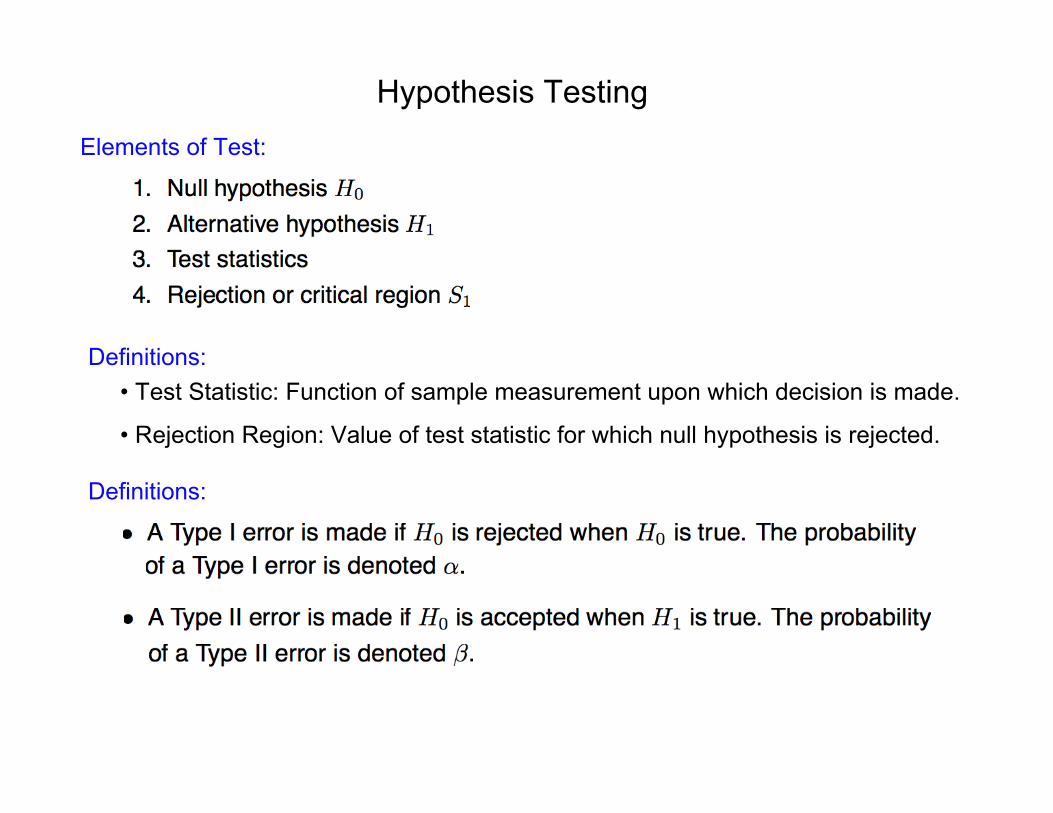
Hypothesis TestingElements of Test:
Definitions:• Test Statistic: Function of sample measurement upon which decision is made.
• Rejection Region: Value of test statistic for which null hypothesis is rejected.
Definitions:
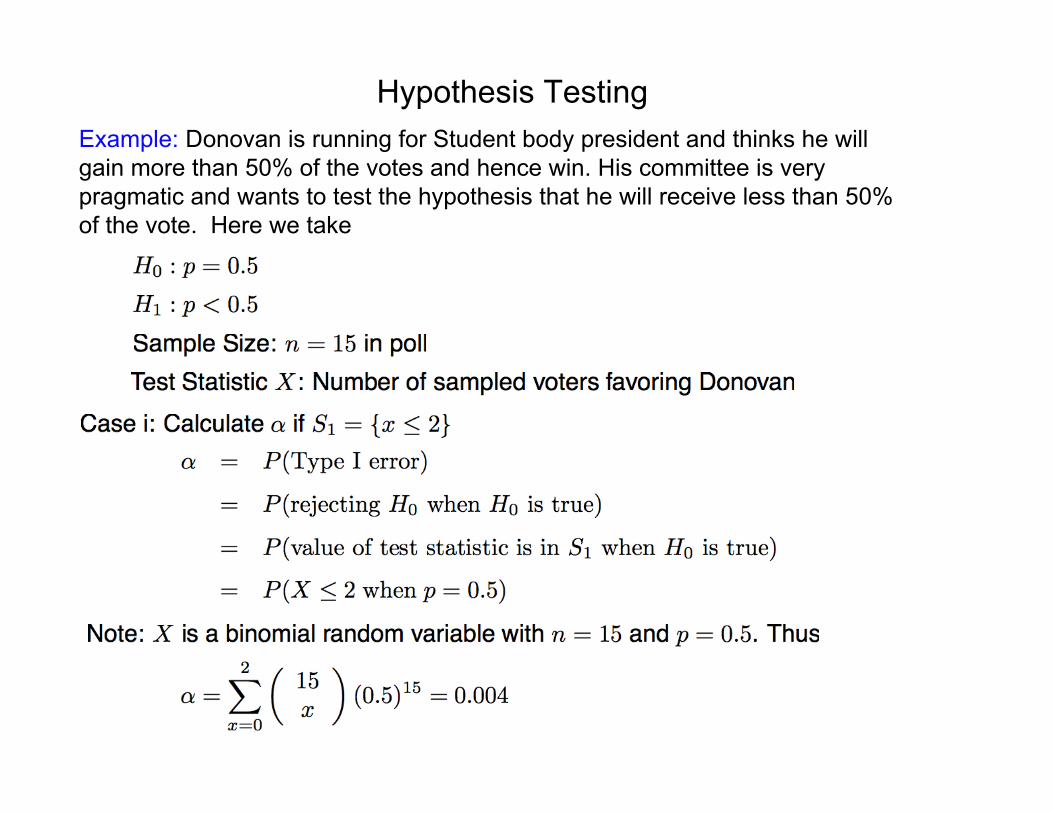
Hypothesis TestingExample: Donovan is running for Student body president and thinks he willgain more than 50% of the votes and hence win. His committee is verypragmatic and wants to test the hypothesis that he will receive less than 50%of the vote. Here we take
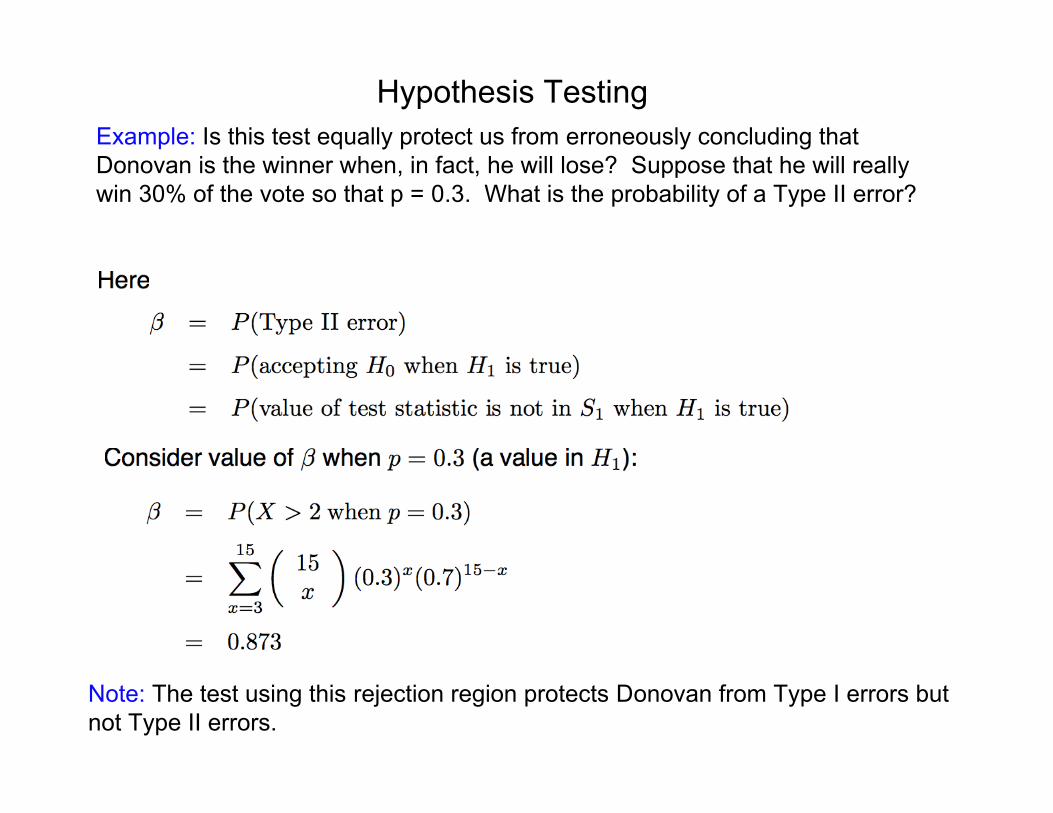
Hypothesis TestingExample: Is this test equally protect us from erroneously concluding thatDonovan is the winner when, in fact, he will lose? Suppose that he will reallywin 30% of the vote so that p = 0.3. What is the probability of a Type II error?
Note: The test using this rejection region protects Donovan from Type I errors butnot Type II errors.
Hypothesis Testing
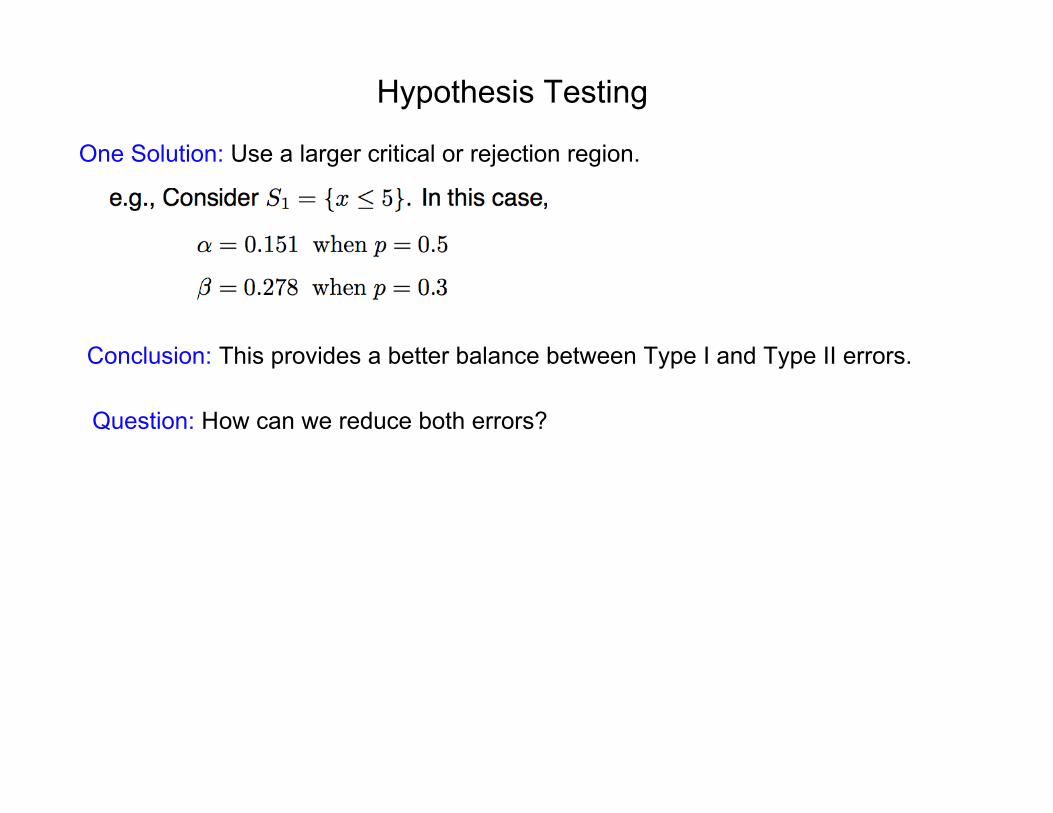
One Solution: Use a larger critical or rejection region.
Conclusion: This provides a better balance between Type I and Type II errors.