DaybyDay & Ecoquant 1 MTF stands for Mandelbrot Trend Forecasting. Prior to explaining how to utilize Mandelbrot patterns to forecast market trends, one needs to understand what the Mandelbrot set is and why it’s so fundamental to the patterns observed throughout nature. The Mandelbrot set is a geometrical pattern created by plotting iterations of points from a simple mathematical equation z = z 2 + C. The output is known as a fractal, producing very similar forms at different levels of magnification. From this simple equation, complex structures emerge. Living systems display these fractal patterns: plants, corals, and biological systems such as our blood vessels and lungs all display branching fractal patterns similar to the Mandelbrot set. Fractals have infinite representation in the world in inorganic matter as well. Snowflakes, dissimilar to each other, display fractal pattern internally. In fact, Mandelbrot pattern usage is so universal that it acquired the name, “Thumbprint of God”. Because the output of one operation becomes the input of the other, complex numbers flow in both directions, creating feedback loops that run to infinity and infinitesimally small numbers. As we magnify the pattern, more and more details emerge; you see mini Mandelbrots, almost an identical replica of the original set with perhaps subtle differences. It is hard to imagine, but it is infinitely complex.
Transcript
DaybyDay & Ecoquant
1
MTF stands for Mandelbrot Trend Forecasting. Prior to explaining how to utilize Mandelbrot patterns to
forecast market trends, one needs to understand what the Mandelbrot set is and why it’s so
fundamental to the patterns observed throughout nature.
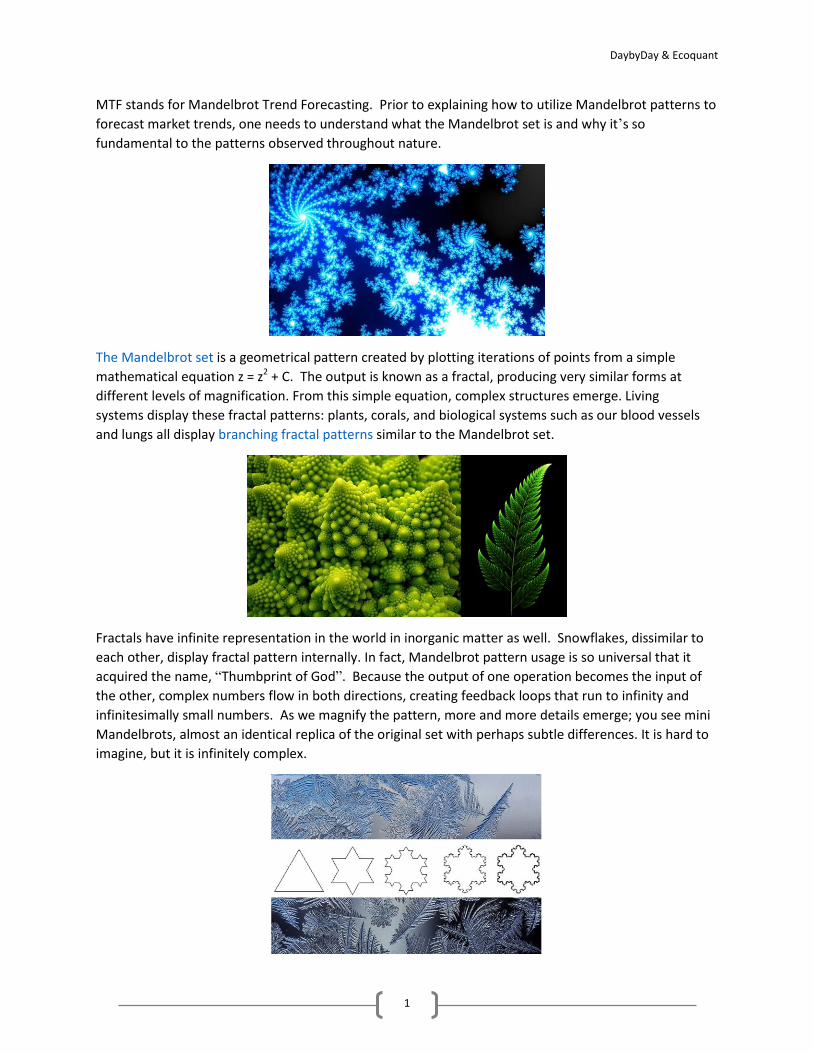
The Mandelbrot set is a geometrical pattern created by plotting iterations of points from a simple
mathematical equation z = z2 + C. The output is known as a fractal, producing very similar forms at
different levels of magnification. From this simple equation, complex structures emerge. Living
systems display these fractal patterns: plants, corals, and biological systems such as our blood vessels
and lungs all display branching fractal patterns similar to the Mandelbrot set.
Fractals have infinite representation in the world in inorganic matter as well. Snowflakes, dissimilar to
each other, display fractal pattern internally. In fact, Mandelbrot pattern usage is so universal that it
acquired the name, “Thumbprint of God”. Because the output of one operation becomes the input of
the other, complex numbers flow in both directions, creating feedback loops that run to infinity and
infinitesimally small numbers. As we magnify the pattern, more and more details emerge; you see mini
Mandelbrots, almost an identical replica of the original set with perhaps subtle differences. It is hard to
Likewise, Mandelbrot analysis fits well with stock market forecasting as market movement is inherently
fractal in nature. Similar to Mandelbrot pattern generation, market prices are a set of feedback loops
that result in complex patterns. The only difference is that the concept of structural encapsulation and
similarities that we observe in Mandelbrot sets are transformed to similarities that happen in time.
Mandelbrot sets have a repeatable and yet ever-evolving nature, therefore the resulting pattern can’t
be fully predicted. However, events and human emotions reflected in stock market fluctuations have
produced similar ripples throughout history. By paying attention to these fluctuations in the past an
astute observer can find clones of today’s pattern with striking similarity. Thus, if we encounter the
beginning of such a pattern today, what makes you think history won’t repeat itself? Yet, in
Mandelbrot forecasts, this is only the initial premise.
What often prevents a reliable forecast of price is when the pattern is governed by the Heisenberg
Uncertainty Principle , literally unpredictable like the position of electrons before measurement in the
famous double slit experiment.
However, we can be informed by the fractal nature of price; as we alter the time scale of the
observation, a signal can emerge amongst the noise. For example, the curve that seems obscured by
noise on a monthly scale could be producing a signal on the weekly scale. Similarly, what looks like signal on the hourly scale might look like noise of daily, in basically a process that in a process that is transferring information in both directions.
On magnification, the circular pattern A, B and C (below) are almost structurally identical; however, the
waveforms A, B, and C operate at different time scales. Assuming that they represent scales of ‘A’
weekly, ‘B’ daily and ‘C’ hourly, we can see that the wavelength of A is much longer than the
wavelength of B which is longer than the wavelength of C. Therefore, the contribution of waves B and C
could be perceived as Heisenberg’s noise on the weekly scale and yet, at the smaller time scale, drive
The price curve is a superimposition of an infinite number of fractal frequencies starting from extremely long ones and ending with infinitesimally short ones. Monitoring all these frequencies could, with perfect knowledge, predict a price curve at any moment in time. However, on one hand, all such knowledge is not available (as available data history is limited) and we can only rely on some subset of possible affecting frequencies. Secondly, the further we go into the forecasted model projection, the less accurate the model will be (due to lack of historical data). This is because a larger mandelbrot frequency can warp and overtake/overpower our projected price model. Therefore we believe it is safer to forecast a price model projection with a smaller percentage into the future and refresh this model continuously. The constant monitoring and upgrading of the projection pattern drastically improves its reliability. Similar patterns across several time frames have a striking ability to define a trend, its approximate beginning and end date, and highs and lows.