29
Oil Recovery and Well Performance Aditya Bansal
| Date post: | 20-Oct-2015 |
| Category: |
Documents |
| Upload: | aditya-bansal |
| View: | 106 times |
| Download: | 2 times |
Oil Recovery and Well Performance
Aditya Bansal
AgendaFundamentals of Oil RecoveryPrimary RecoverySecondary RecoveryTertiary RecoveryInflow Performance (IPR)Vogel’s IPROutflow Performance (VLP)VLP vs IPR
IntroductionRecovery of hydrocarbons from
an oil reservoir commonly occurs in several recovery stages. These are:
Primary recovery (~ 10-15% recovery)
Secondary recovery (~ 25-30% ) Tertiary recovery (Enhanced Oil
Recovery, EOR) (~ 45% recovery)
Recovery of hydrocarbons from the reservoir using the natural energy of the reservoir as a drive or use of artificial lift(pumps) at a later stage.
Reservoir drive is the force that causes the hydrocarbon to flow out of the reservoir rock into the wellbore and up to the surface.
Important Drive Mechanisms are as follows: Liberation and expansion of solution gas (Solution
Gas Drive) Free gas, if present (Gas Cap Drive) Influx of aquifer water (Water Drive)
Primary Recovery
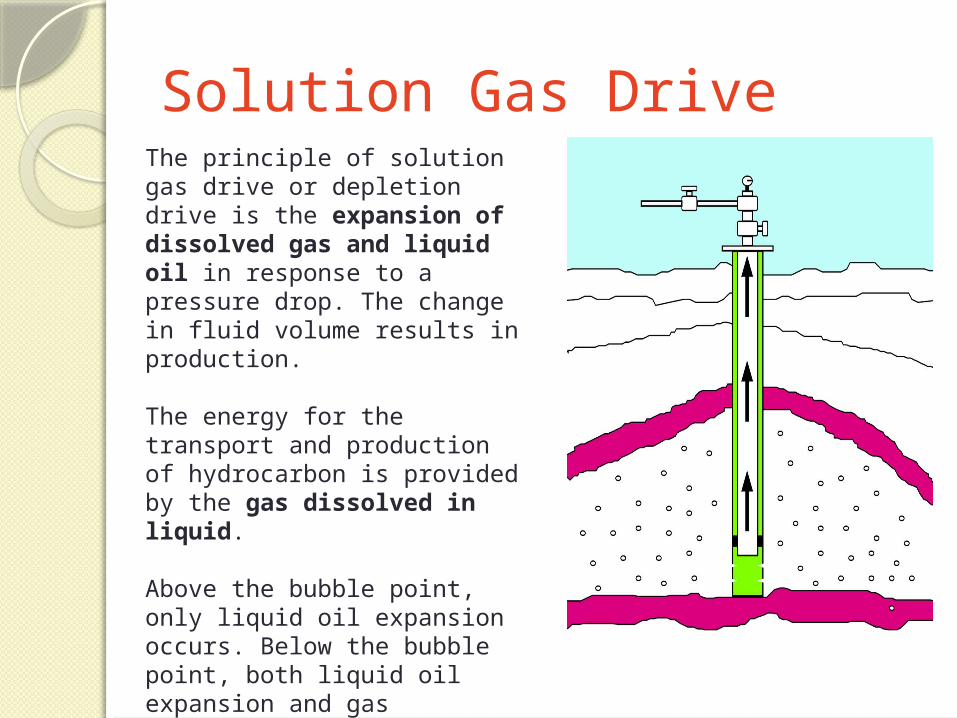
Solution Gas DriveThe principle of solution gas drive or depletion drive is the expansion of dissolved gas and liquid oil in response to a pressure drop. The change in fluid volume results in production.
The energy for the transport and production of hydrocarbon is provided by the gas dissolved in liquid.
Above the bubble point, only liquid oil expansion occurs. Below the bubble point, both liquid oil expansion and gas expansion contribute to volume change.
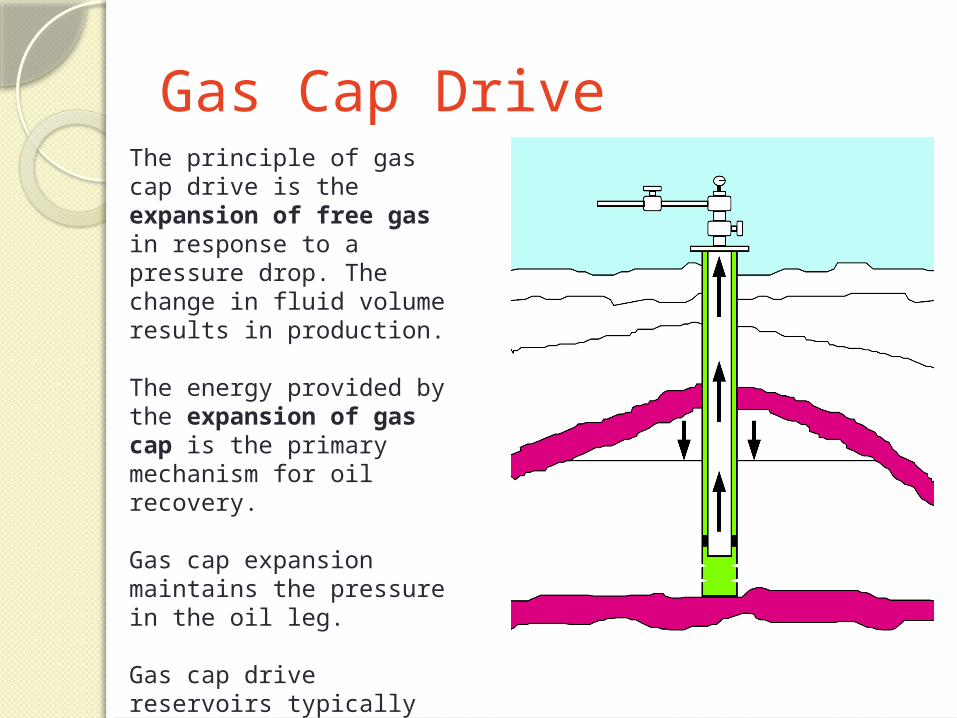
Gas Cap DriveThe principle of gas cap drive is the expansion of free gas in response to a pressure drop. The change in fluid volume results in production.
The energy provided by the expansion of gas cap is the primary mechanism for oil recovery.
Gas cap expansion maintains the pressure in the oil leg.
Gas cap drive reservoirs typically recover 20 to 40% OIIP, sometimes as high as 60%.
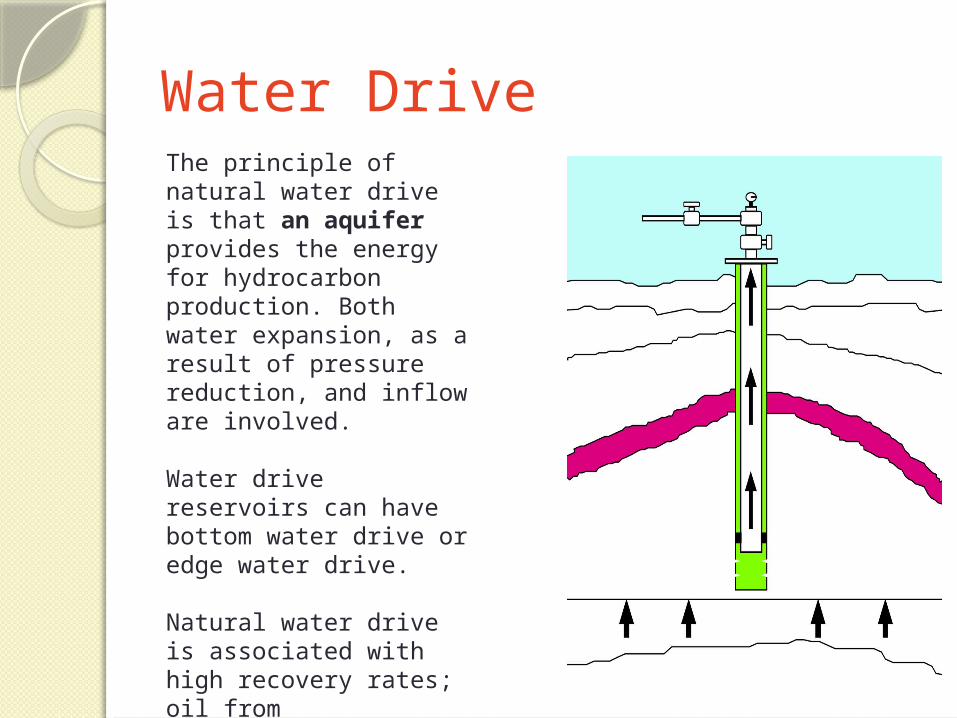
Water DriveThe principle of natural water drive is that an aquifer provides the energy for hydrocarbon production. Both water expansion, as a result of pressure reduction, and inflow are involved.
Water drive reservoirs can have bottom water drive or edge water drive.
Natural water drive is associated with high recovery rates; oil from 35-75% OIIP.
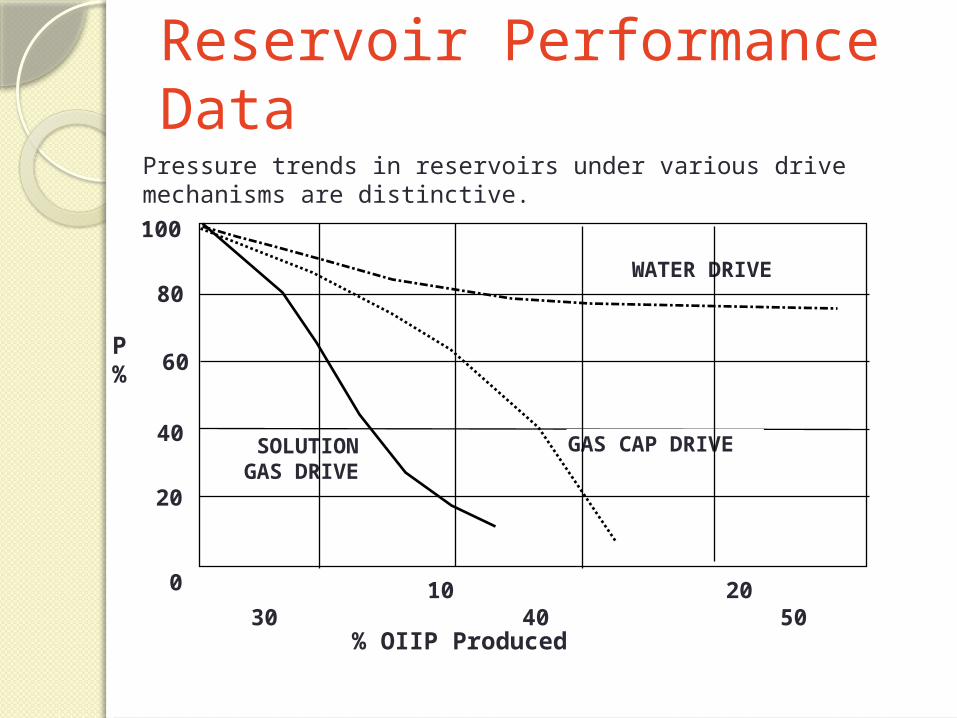
Reservoir Performance Data
GAS CAP DRIVESOLUTIONGAS DRIVE
WATER DRIVE
% OIIP Produced
P%
100
80
60
40
20
0 10 20 30 40 50
Pressure trends in reservoirs under various drive mechanisms are distinctive.
Secondary RecoverySecondary recovery is the result of human
intervention in the reservoir to improve recovery when the natural drives have diminished to unreasonably low efficiencies.
The purpose of secondary recovery is to maintain reservoir pressure and to displace hydrocarbon towards the wellbore.
Two techniques are commonly used:Water FloodingGas Flooding
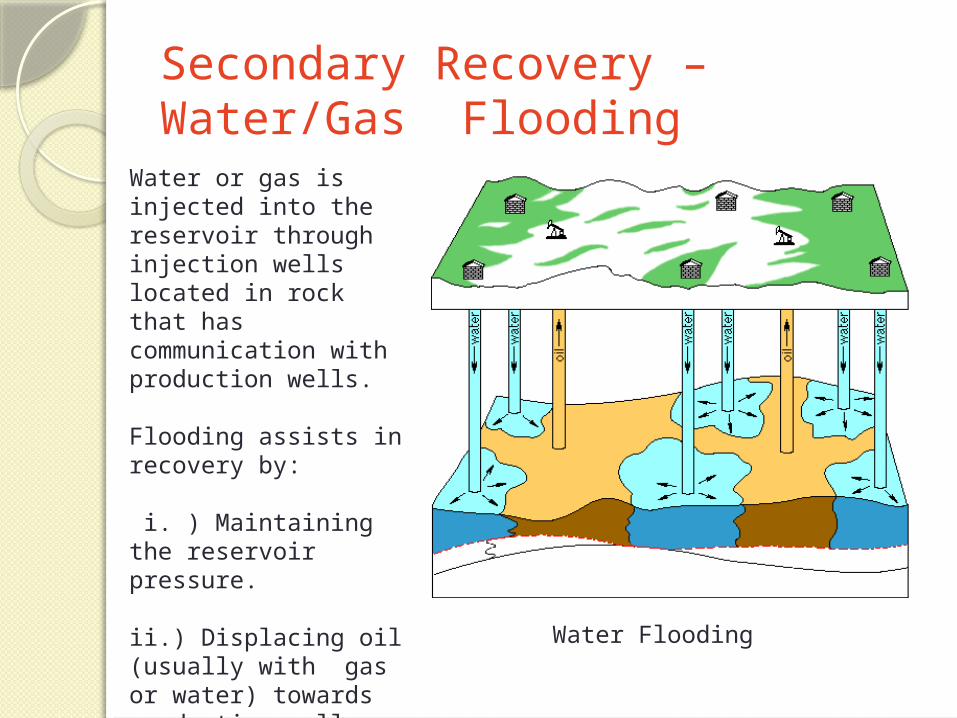
Secondary Recovery – Water/Gas Flooding
Water or gas is injected into the reservoir through injection wells located in rock that has communication with production wells.
Flooding assists in recovery by:
i. ) Maintaining the reservoir pressure.
ii.) Displacing oil (usually with gas or water) towards production wells. Water Flooding
Tertiary Recovery (EOR)Tertiary Recovery is an oil recovery
enhancement method using sophisticated techniques that alter the original properties of oil.
EOR techniques are extremely expensive, and are only used when economical.
Three techniques are commonly used:• Chemical Flooding (alkali, polymer flooding)• Thermal Recovery (steam flooding)• Miscible Displacement (CO2 injection)
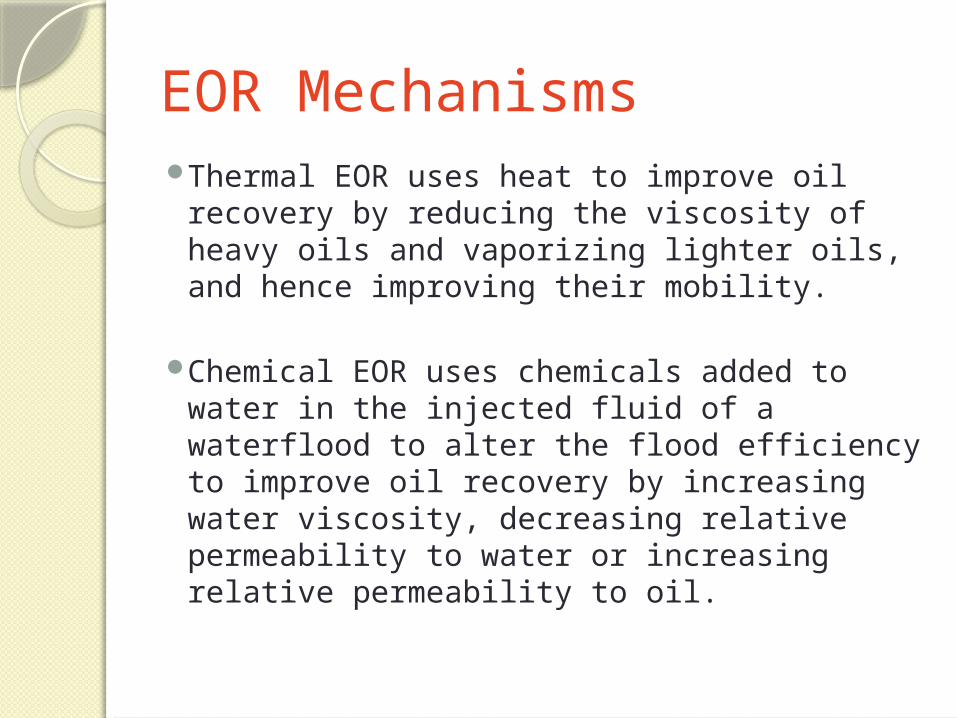
EOR MechanismsThermal EOR uses heat to improve oil
recovery by reducing the viscosity of heavy oils and vaporizing lighter oils, and hence improving their mobility.
Chemical EOR uses chemicals added to water in the injected fluid of a waterflood to alter the flood efficiency to improve oil recovery by increasing water viscosity, decreasing relative permeability to water or increasing relative permeability to oil.
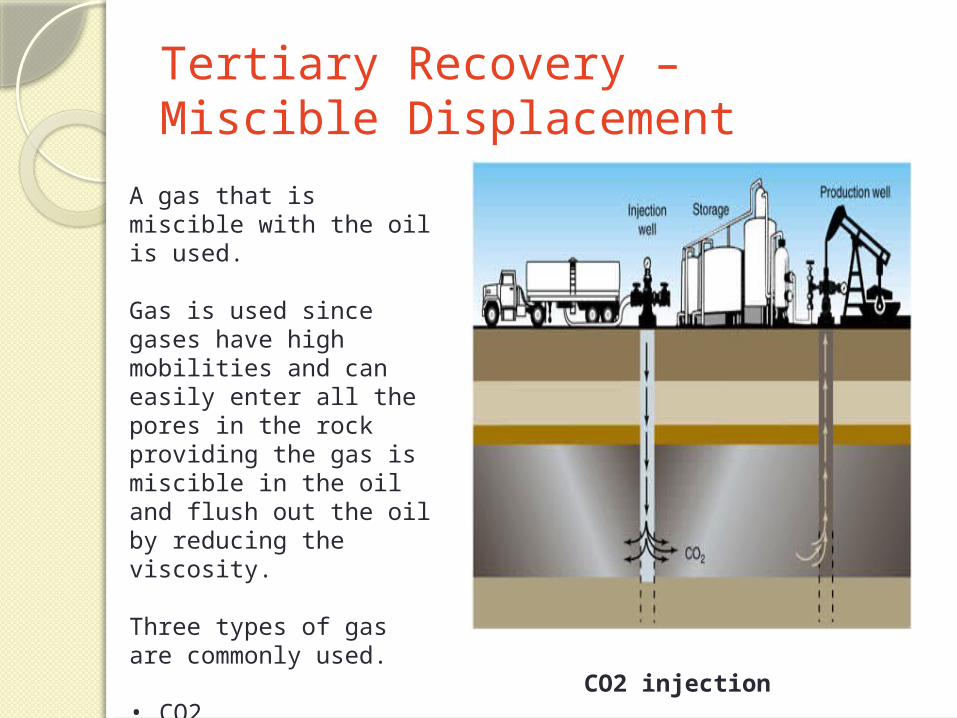
Tertiary Recovery – Miscible Displacement
CO2 injection
A gas that is miscible with the oil is used.
Gas is used since gases have high mobilities and can easily enter all the pores in the rockproviding the gas is miscible in the oil and flush out the oil by reducing the viscosity.
Three types of gas are commonly used.
• CO2• N2• Hydrocarbon gases
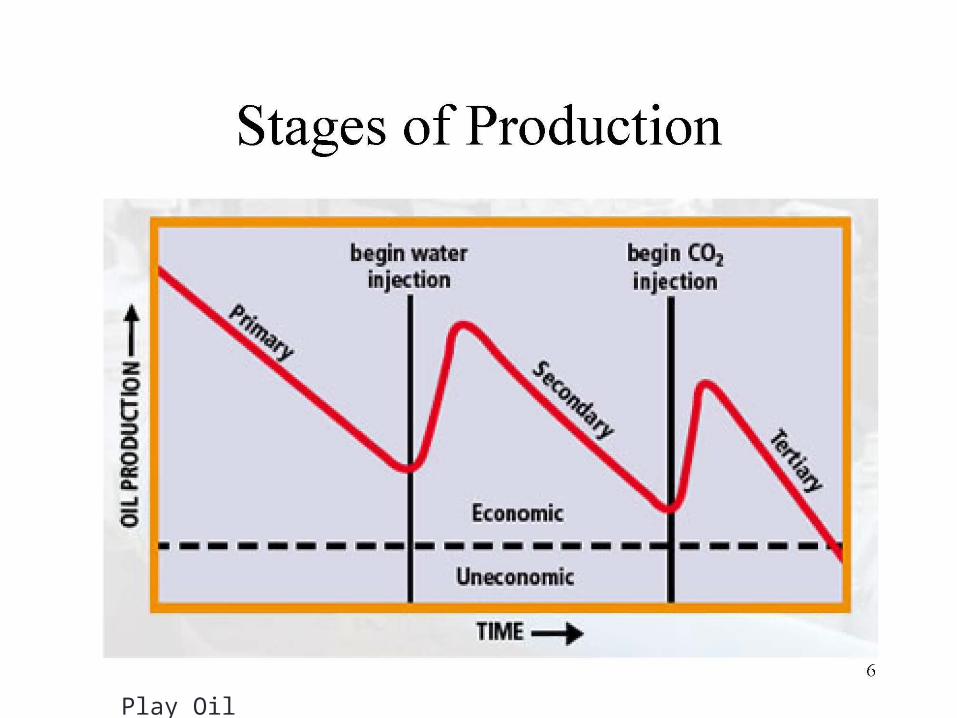
Recovery Stages
Play Oil Recovery Video
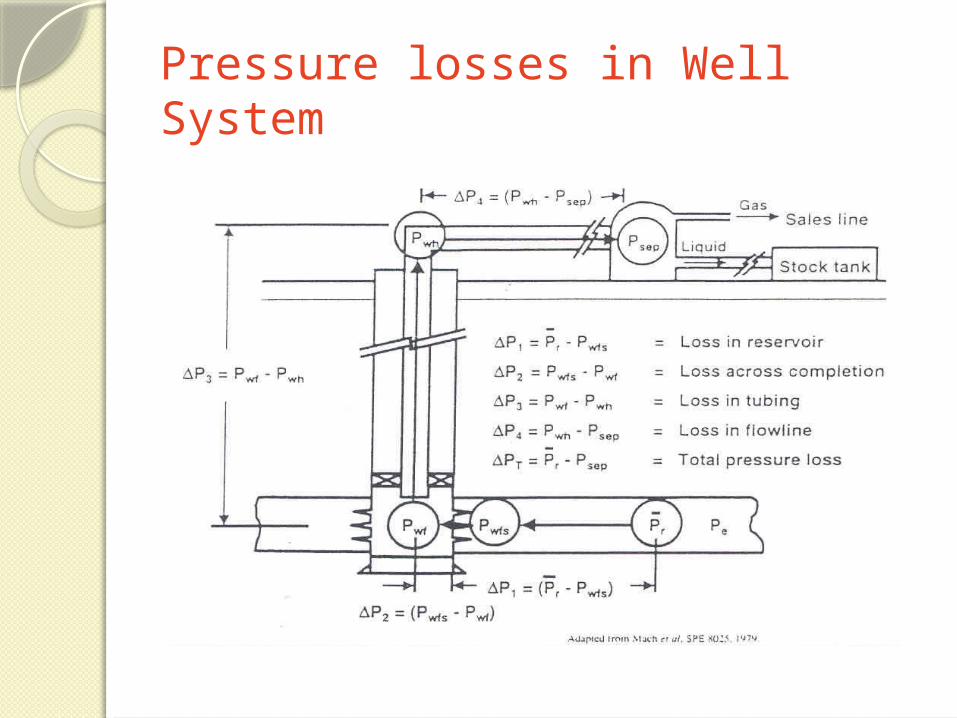
Pressure losses in Well System
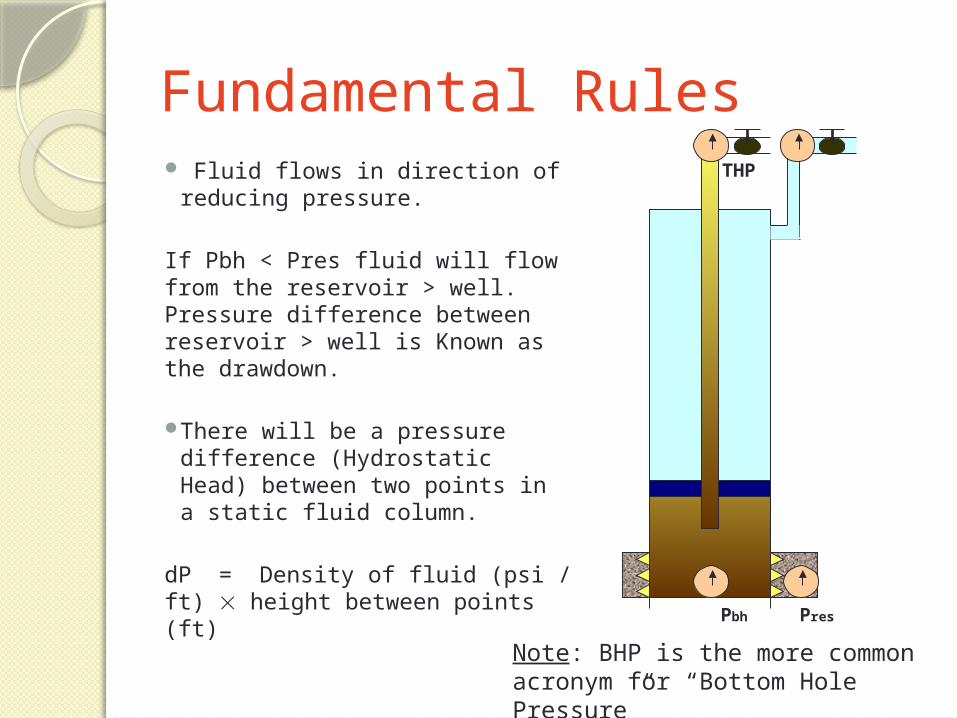
Fundamental Rules Fluid flows in direction of
reducing pressure.
If Pbh < Pres fluid will flow from the reservoir > well. Pressure difference between reservoir > well is Known as the drawdown.
There will be a pressure difference (Hydrostatic Head) between two points in a static fluid column.
dP = Density of fluid (psi / ft) height between points (ft) PresPbh
THP
Note: BHP is the more common acronym for “Bottom Hole Pressure”
Inflow Performance (IPR) The Inflow Performance of well represents the
ability of the well to give up fluids, which depends upon the reservoir drive mechanisms, reservoir pressure and permeability
Driving force is not the reservoir pressure but the draw down - the difference in pressure between the reservoir and the wellbore.
The inflow performance relationship (IPR) quantifies the flow rate(q) from a well as a function of the draw down(dP).
Concept of Productivity Index (P. I.)
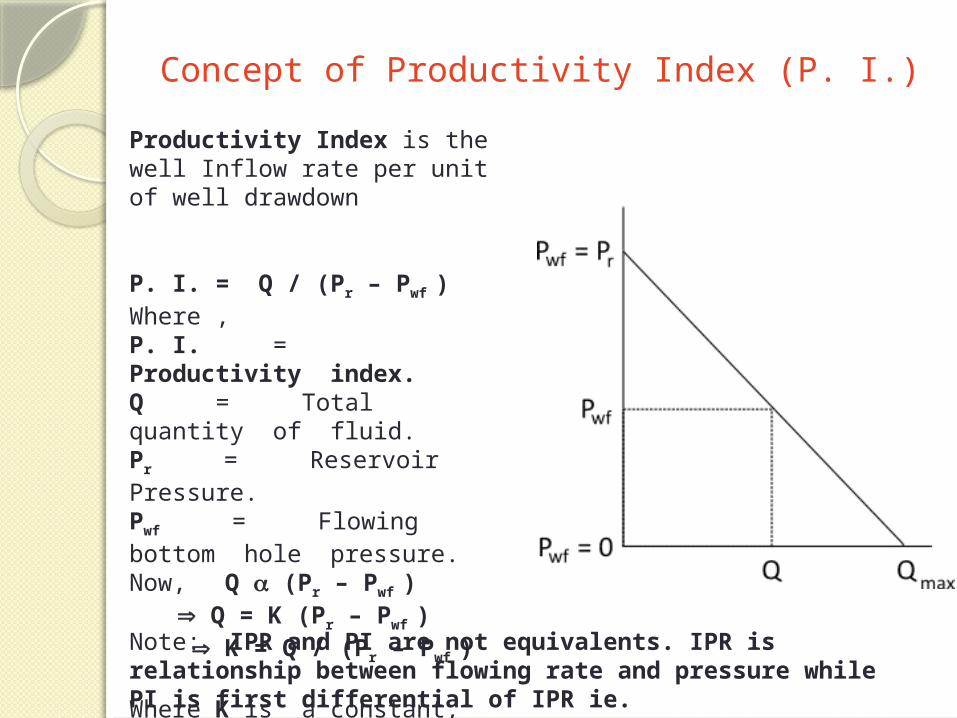
Productivity Index is the well Inflow rate per unit of well drawdown
P. I. = Q / (Pr – Pwf ) Where ,P. I. = Productivity index.Q = Total quantity of fluid.Pr = Reservoir Pressure.Pwf = Flowing bottom hole pressure.Now, Q (Pr – Pwf ) Q = K (Pr – Pwf )
K = Q / (Pr – Pwf )
Where K is a constant, known as P. I.
Note: IPR and PI are not equivalents. IPR is relationship between flowing rate and pressure while PI is first differential of IPR ie. P.I. = - (dq/dPwf)
Straight Line IPR
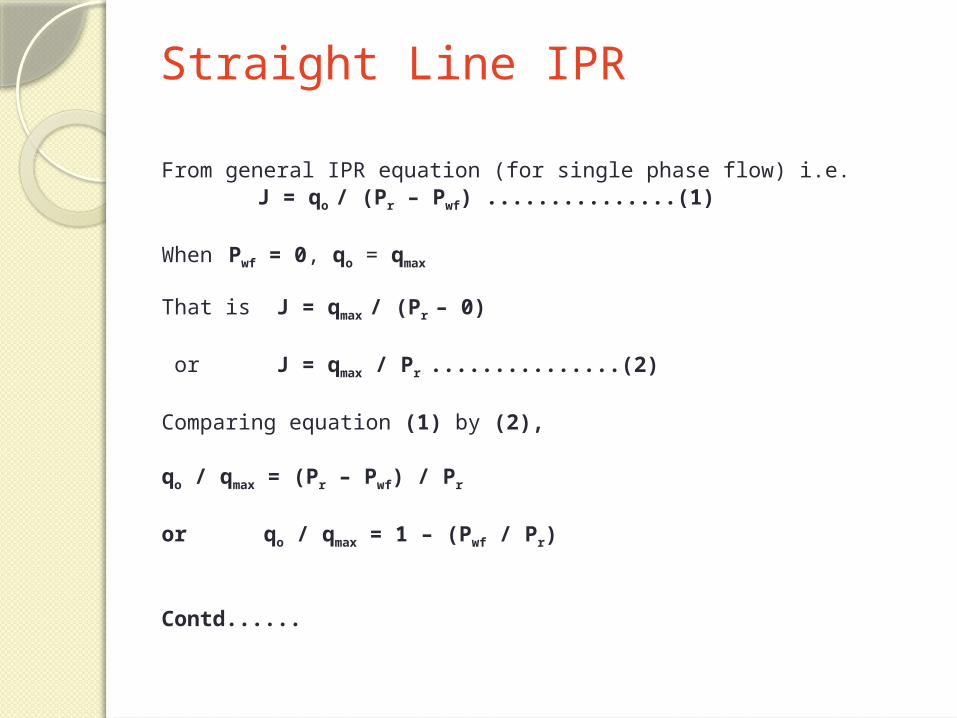
From general IPR equation (for single phase flow) i.e. J = qo / (Pr – Pwf) ...............(1)
When Pwf = 0, qo = qmax
That is J = qmax / (Pr – 0)
or J = qmax / Pr ...............(2)
Comparing equation (1) by (2),
qo / qmax = (Pr – Pwf) / Pr
or qo / qmax = 1 – (Pwf / Pr)
Contd......
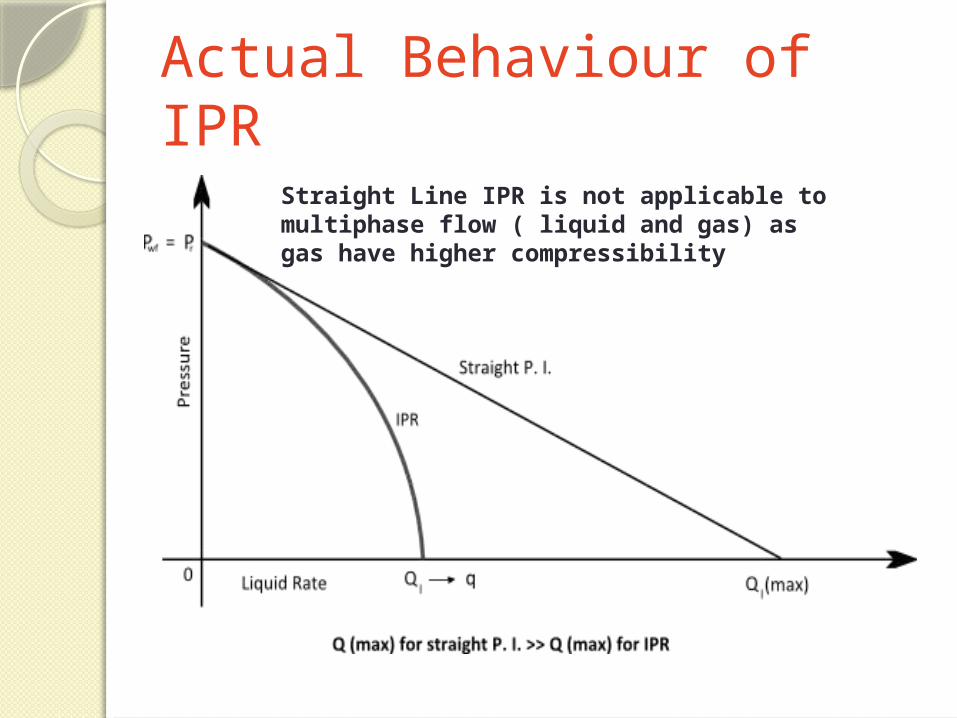
Actual Behaviour of IPR
Straight Line IPR is not applicable to multiphase flow ( liquid and gas) as gas have higher compressibility
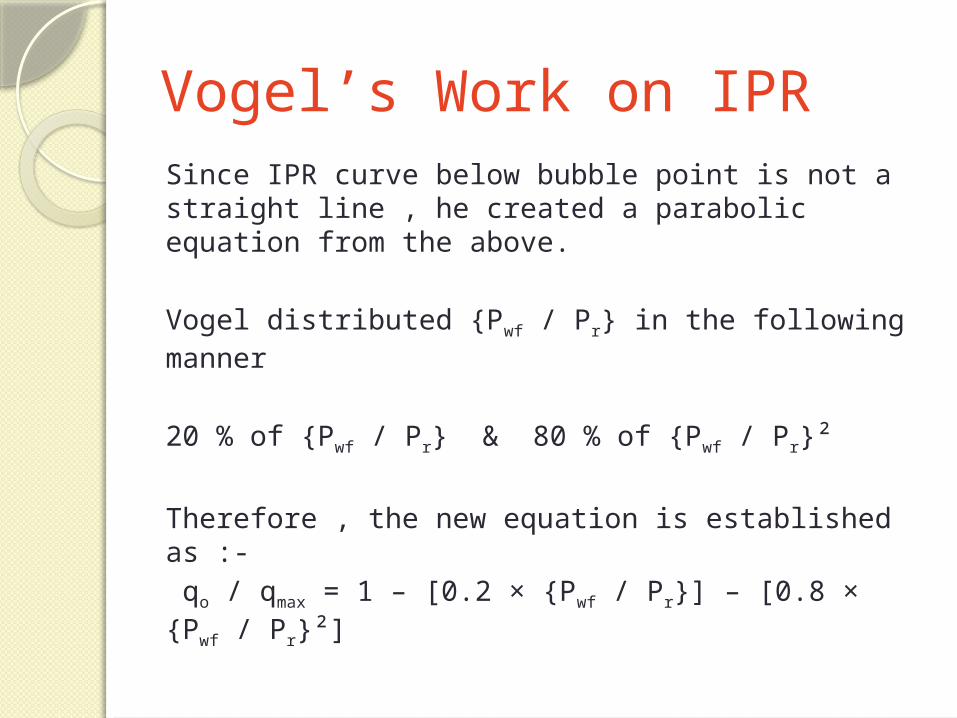
Vogel’s Work on IPRSince IPR curve below bubble point is not a straight line , he created a parabolic equation from the above.
Vogel distributed {Pwf / Pr} in the following manner
20 % of {Pwf / Pr} & 80 % of {Pwf / Pr}²
Therefore , the new equation is established as :- qo / qmax = 1 – [0.2 × {Pwf / Pr}] – [0.8 × {Pwf / Pr}²]
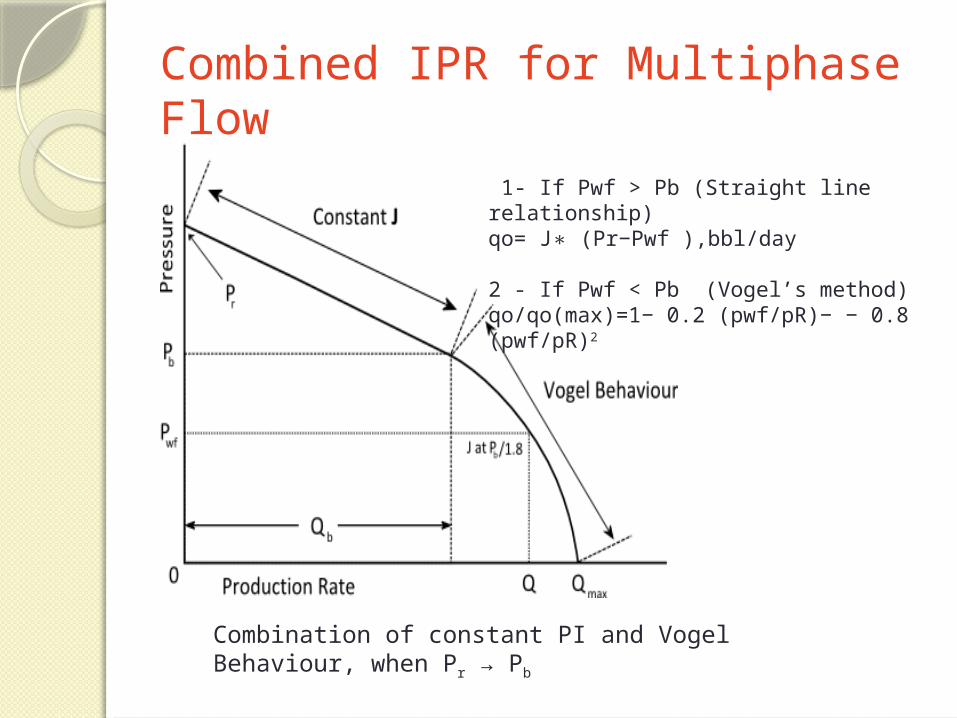
Combined IPR for Multiphase Flow
Combination of constant PI and Vogel Behaviour, when Pr → Pb
1- If Pwf > Pb (Straight line relationship) qo= J∗ (Pr−Pwf ),bbl/day
2 - If Pwf < Pb (Vogel’s method) qo/qo(max)=1− 0.2 (pwf/pR)− − 0.8 (pwf/pR)2
Use of the IPR The inflow performance relationship is useful as a
tool to monitor well performance and predict the stimulation and artificial lift requirements of a number of wells.
The IPR for a well must be known in order to size the well tubulars correctly.
Based on interpolation between wells, if the initial IPR for a well is lower than expected in a particular part of the reservoir, it may then be suspected that the formation has been badly damaged during the drilling and completion phase. Mapping the IPRs across the field may highlight this situation.
Outflow(Tubing) Performance (VLP)The outflow pressure drop required to lift a
fluid from the perforations to the wellhead and then the separator is the second factor which determines the well production.
Vertical Lift Performance Relationship (VLP), named also Outflow, describes the bottom-hole pressure as a function of flow rate. The VLP depends on many factors including fluid PVT properties, well depth, tubing size, surface pressure, water cut and GOR. It describes the flow from the bottom-hole of the well to the wellhead.
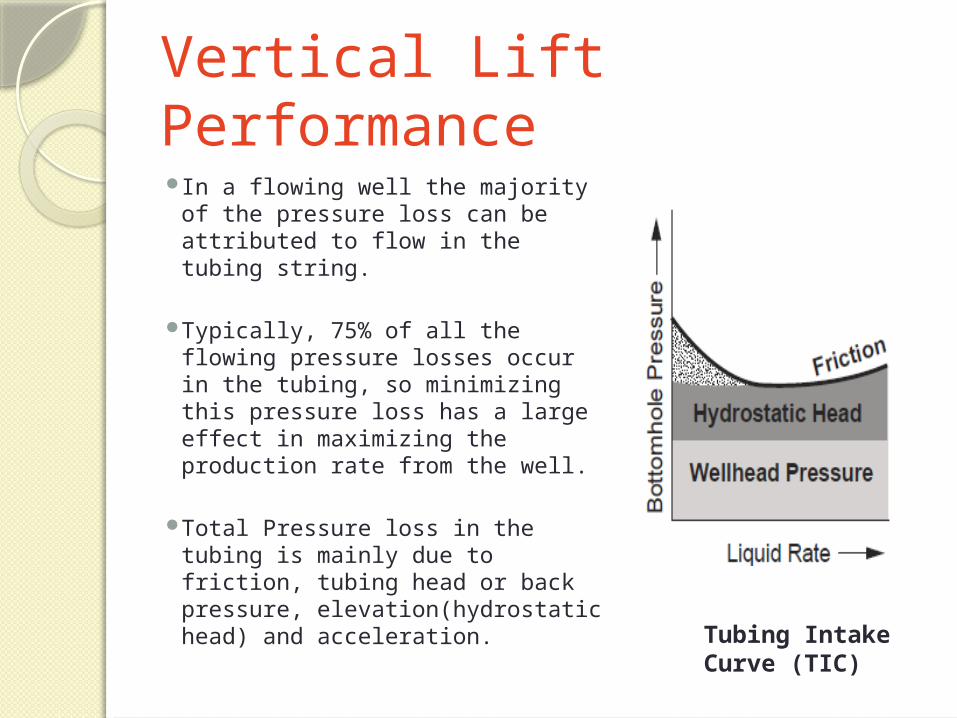
Vertical Lift Performance In a flowing well the majority of
the pressure loss can be attributed to flow in the tubing string.
Typically, 75% of all the flowing pressure losses occur in the tubing, so minimizing this pressure loss has a large effect in maximizing the production rate from the well.
Total Pressure loss in the tubing is
mainly due to friction, tubing head or back pressure, elevation(hydrostatic head) and acceleration.
Tubing Intake Curve (TIC)
VLP – IPR Matching
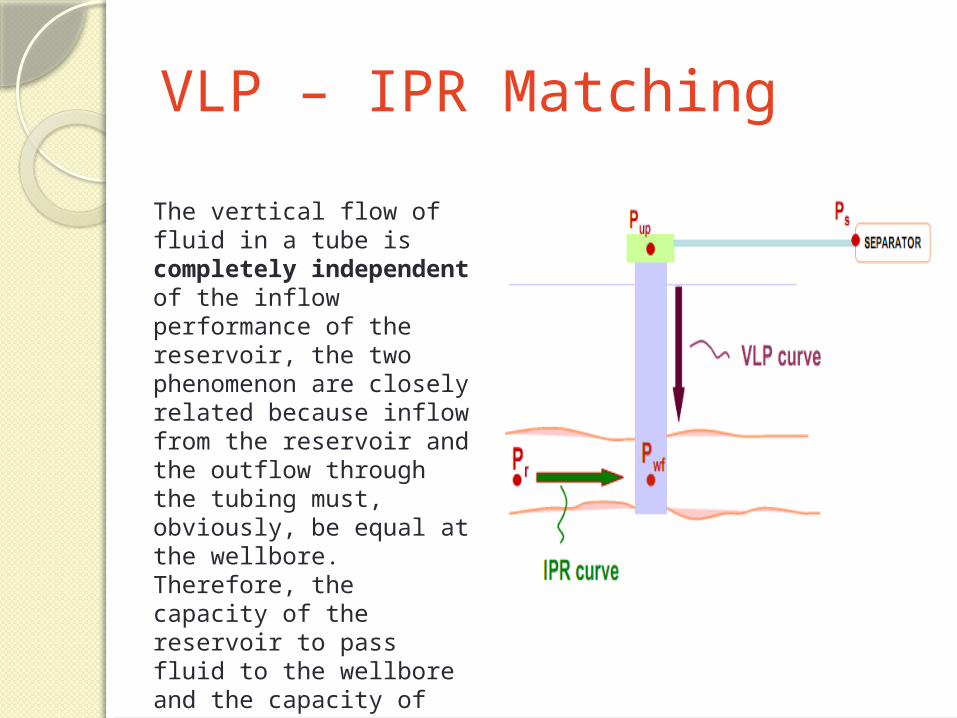
The vertical flow of fluid in a tube is completely independent of the inflow performance of the reservoir, the two phenomenon are closely related because inflow from the reservoir and the outflow through the tubing must, obviously, be equal at the wellbore. Therefore, the capacity of the reservoir to pass fluid to the wellbore and the capacity of the tubing to pass the fluid to the surface have to be matched and be operating in equilibrium
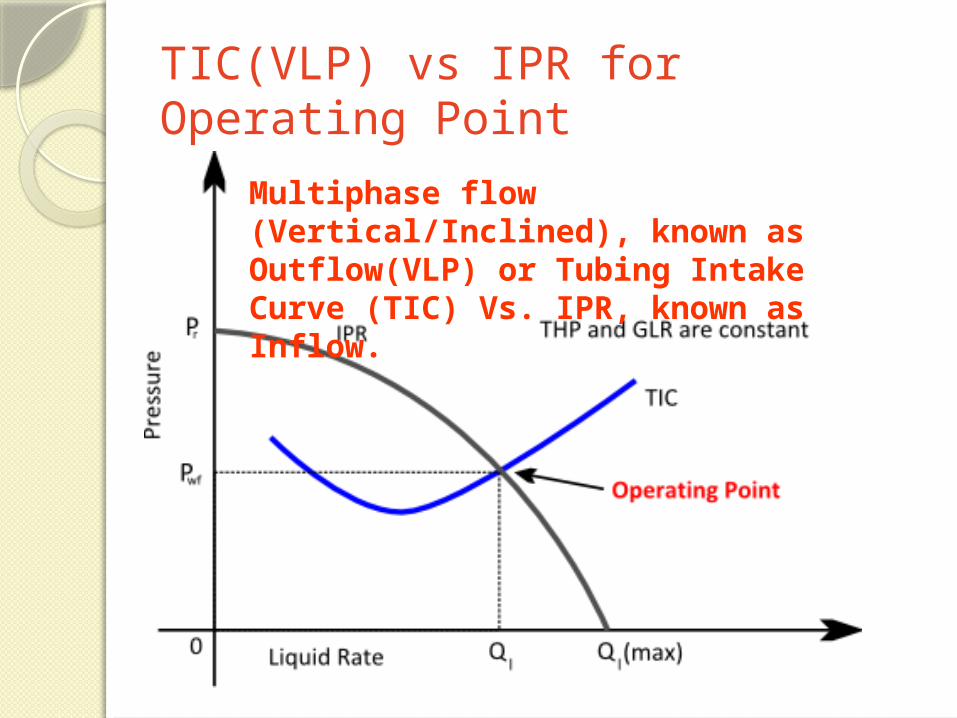
TIC(VLP) vs IPR for Operating Point
Multiphase flow (Vertical/Inclined), known as Outflow(VLP) or Tubing Intake Curve (TIC) Vs. IPR, known as Inflow.
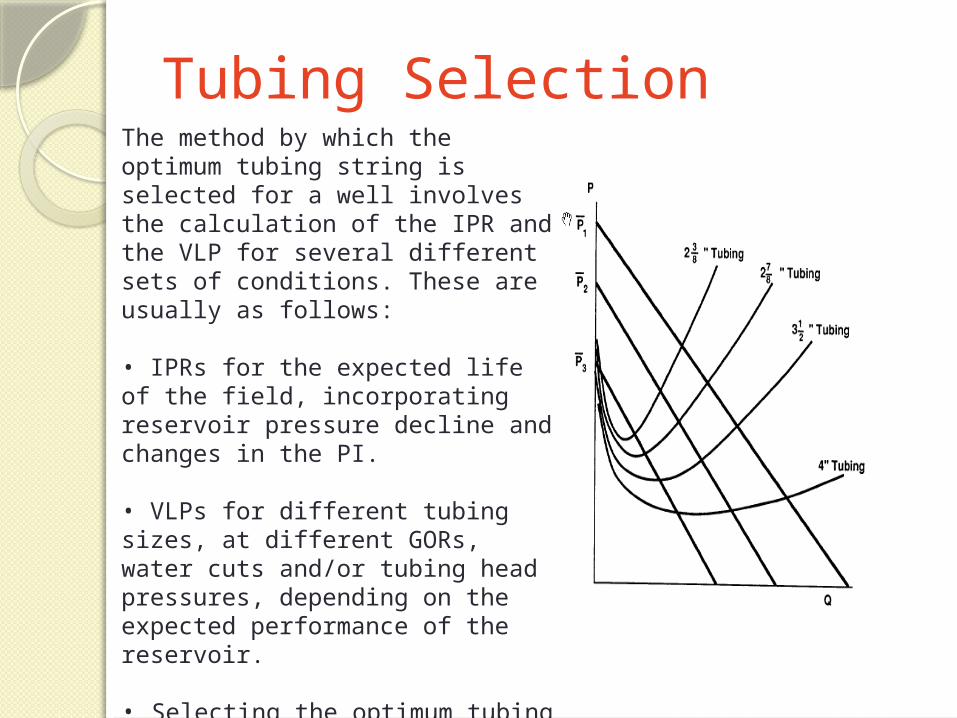
Tubing SelectionThe method by which the optimum tubing string is selected for a well involves the calculation of the IPR and the VLP for several different sets of conditions. These are usually as follows:
• IPRs for the expected life of the field, incorporating reservoir pressure decline and changes in the PI.
• VLPs for different tubing sizes, at different GORs, water cuts and/or tubing head pressures, depending on the expected performance of the reservoir.
• Selecting the optimum tubing string is based upon the tubing that will result in the highest flow rate and at the same time will be as economic as possible and available in stock.