This document is confidential and is intended solely for the use and information of the SNL Financial and the individual, group, or corporation to whom it is addressed. Fundamentals of Peer Analysis Presenter: HD Jacobs, Senior Product Expert Updated: January 2013
Transcript
This document is confidential and is intended solely for the use and information of the SNL Financial and the individual, group, or corporation to whom it is addressed.
Fundamentals of Peer Analysis
Presenter: HD Jacobs, Senior Product Expert
Updated: January 2013
2
I. Defining a Peer
II. Peer Benchmarking Metrics
III. Means of Conducting Peer Analysis
IV. Future of Peer Analysis
V. Peer Analysis Best Practices
Agenda
3
What is a Peer?
4
Defining a Peer
Def
inin
g a
Peer
What is a peer?
Anglo-French, peir, Old French, per, and Latin, pār, meaning equal.
Merriam-Webster defines a peer as one that is of equal standing with another; one belonging to the same societal group especially based on age, grade or status
In the banking industry, what once was a simple term has gone through an evolution of meaning and adaptation.
A peer that once was a bank down the street is now an institution determined by size, location, business mix, and a combination of a multitude of other measurements
5
Defining a Peer Group
Def
inin
g a
Peer
Gro
up
Defining a peer group?
Banks across similar markets of operation
Banks of similar size – include some that are the same size as your bank, some slightly smaller as well as the size your institution aspires to be
Depending upon the type of analysis, it is also important to look at a variety of performance metrics to see how your bank stacks up relative to the competition
Peer groups should be limited to 10-20 peers at most for a meaningful analysis
Rather than defining peers based on asset size and geography – a more innovative and realistic approach is to define peers based on operating strategy, lending practices, funding strategy, earnings strength, etc.
6
Defining a Peer Group: StellarOne Bank
Trad
itio
nal
Def
init
ion
of
a Pe
er G
rou
p: S
tella
rOn
e B
ank
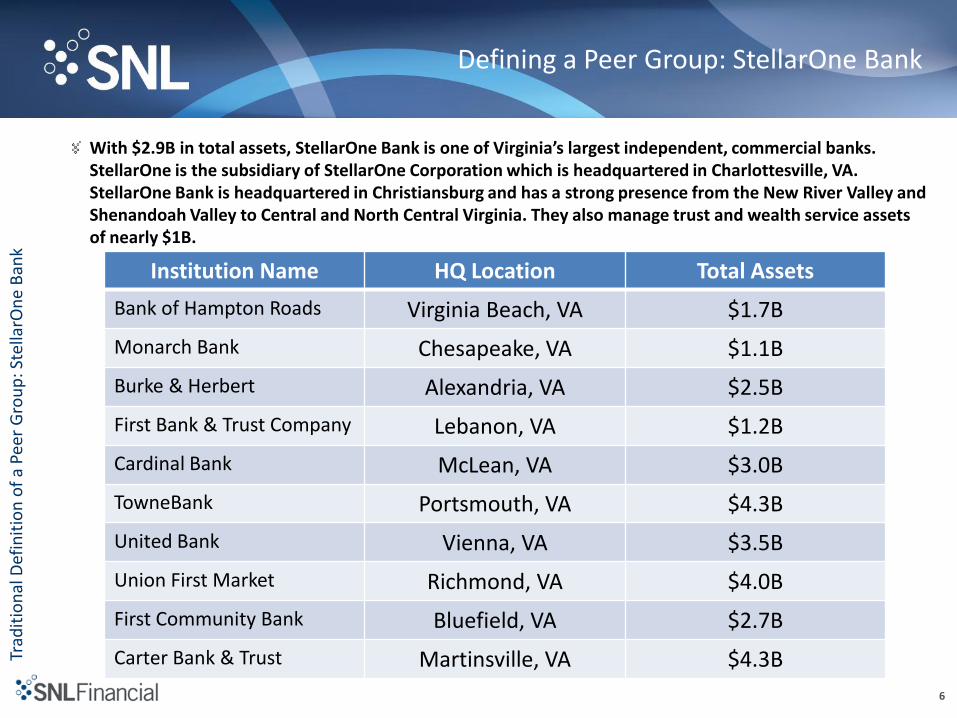
With $2.9B in total assets, StellarOne Bank is one of Virginia’s largest independent, commercial banks. StellarOne is the subsidiary of StellarOne Corporation which is headquartered in Charlottesville, VA. StellarOne Bank is headquartered in Christiansburg and has a strong presence from the New River Valley and Shenandoah Valley to Central and North Central Virginia. They also manage trust and wealth service assets of nearly $1B.
Institution Name HQ Location Total Assets
Bank of Hampton Roads Virginia Beach, VA $1.7B
Monarch Bank Chesapeake, VA $1.1B
Burke & Herbert Alexandria, VA $2.5B
First Bank & Trust Company Lebanon, VA $1.2B
Cardinal Bank McLean, VA $3.0B
TowneBank Portsmouth, VA $4.3B
United Bank Vienna, VA $3.5B
Union First Market Richmond, VA $4.0B
First Community Bank Bluefield, VA $2.7B
Carter Bank & Trust Martinsville, VA $4.3B
7
Redefining a Peer Group: StellarOne Bank
Red
efin
ing
a Pe
er G
rou
p: S
tella
rOn
e B
ank
Institution Name HQ Location Total Assets Deposit Mix/Loan Mix
StellarOne Bank Christiansburg, VA $2.9B 63% MMDA/30% Time Deps/0.25% Brokered 24% Cl-end 1-4/12% Rev 1-4/9% Const & Land/1.3% Consumer/7.89% C&I/39% CRE
Bank of Hampton Roads Virginia Beach, VA $1.7B 26.7% MMDA & Savings/18.2% C&I
Monarch Bank Chesapeake, VA $1.1B 37.8% MMDA & Sav/20% Brokered Deposits/46.5% Cl-end 1-4
Burke & Herbert Alexandria, VA $2.5B 69.9% MMDA & Sav/6.4% Rev 1-4/25.3% Cl-end 1-4
First Bank & Trust Company
Lebanon, VA $1.2B 55.8% MMDA & Savings/1.6% Rev 1-4
Cardinal Bank McLean, VA $3.0B 49% MMDA & Sav/4.8% Rev 1-4 Fam/42.9% Cl-end 1-4
TowneBank Portsmouth, VA $4.3B 71.4% MMDA & Sav/18.6% Const & Land Dev
United Bank Vienna, VA $3.5B 45.6% Transaction Accts/21.6% MMDA & Sav
Union First Market Richmond, VA $4.0B 57.4% MMDA & Sav/8.1% Consumer
First Community Bank Bluefield, VA $2.7B 44.1% MMDA & Sav/6.1% Const & Land/4.6% Consumer
Carter Bank & Trust Martinsville, VA $4.3B 19.59% MMDA & Sav/0% Rev 1-4 Fam
8
Redefined Peer Group: StellarOne Bank
Red
efin
ed P
eer
Gro
up
: Ste
llarO
ne
Ban
k
If we were to re-evaluate our chosen peers for StellarOne Bank to focus on those most like StellarOne from a loan composition and deposit composition standpoint, you will notice our peer group has changed and we have introduced new players into our peer group analysis.
Institution Name HQ Location Total Assets
American National Bank & Trust
Danville, VA $1.3B
Virginia National Bank Charlottesville, VA $474M
TowneBank Portsmouth, VA $4.3B
Union First Market Bank Richmond, VA $4.0B
Central Virginia Bank Powhatan, VA $385M
Chesapeake Bank Kilmarnock, VA $629M
EVB Tappahannock, VA $1.0B
Valley Bank Roanoke, VA $784M
Burke & Herbert Bank & Trust
Alexandria, VA $2.5B
National Bank of Blacksburg Blacksburg, VA $1.0B
9
Peer Benchmarking Metrics
10
Peer Benchmarking Metrics
Peer
Ben
chm
arki
ng
Met
rics
Peer Benchmarking Categories
Capital Adequacy
Asset Quality
Profitability
Liquidity
Loan Mix and Deposit Mix – Interest Rates
Sensitivity to Interest Rate Risk and Market Risk
11
Peer Benchmarking Metrics: Capital Adequacy
Peer
Ben
chm
arki
ng
Met
rics
: Cap
ital
Ad
equ
acy
Capital Adequacy
The cushion of equity and liquidity reserves needed to survive stress situations your institution may be facing that lead to losses or reductions of assets
Aspects to consider:
Composition and quality of capital
Quantity and quality of earnings to increase capital
Access to government programs and access to capital markets
Key Capital Ratios and Metrics
Tier 1 Risk Based Capital Ratio (Tier 1 Risk Based Capital / Risk Weighted Assets)
Tier 1 capital is seen as a metric of a bank’s ability to sustain losses and track how much risk you are taking on (dollars held to dollars loaned out)
Leverage Ratio (Tier 1 Risk Based Capital / Average Assets)
Measure of balance sheet or economic leverage
Internal Growth Rate of Capital (Previous Period Net Income – Cash Dividends / Previous Period End Total Equity)
Measure capital strength, resilience, and bank’s ability to earn it’s way out of trouble through its profits from operations
12
Peer Benchmarking Metrics: Capital Adequacy
Peer
Ben
chm
arki
ng
Met
rics
: Cap
ital
Ad
equ
acy
Capital Adequacy
Tier 1 Common Risk Based Capital Ratio
Ratio introduced during the Supervisory Capital Assessment Programs (SCAP) in the government’s stress tests in May 2009
Tier 1 common capital is the highest form of loss absorbing capital.
Future of Capital Adequacy Assessments
Common Equity Tier 1 Capital Ratio
Under the new Basel III rules Common Equity Tier 1 Capital, aka CET1, was created
CET1 includes common equity as defined under GAAP and does not include any other type of non-common equity under GAAP. New adjustments introduced.
Revised Risk Weighted Assets is denominator – increase in risk-weighted assets for 1-4 family loans based upon LTV, High Volatility Commercial Real Estate, and Past Due Loan Exposures
13
Peer Benchmarking Metrics: Asset Quality
Peer
Ben
chm
arki
ng
Met
rics
: Ass
et Q
ual
ity
Asset Quality
Credit Quality of your bank’s earning assets, the bulk of which comprises your loan portfolio, but will also include your investment portfolio (i.e. fixed income securities) and off-balance sheet items
Aspects to consider:
Degree to which your loans are performing relative to other banks in your market and the likelihood that your loans will continue to perform.
Loan Loss Reserves that you have set aside relative to other banks in your market with similar asset quality ratios.
In assessing your risk profile relative to your peers, it is important to take into account the management strategy (i.e. aggressive expansion vs. conservative) and the market environment (booming economy vs. recession).
CRE concentrations – overconcentration at Florida banks led to the demise of many banks during the recession. Assess how many banks in your market have Commercial Real Estate Loans / Total Risk Based Capital less than 300% as outlined in the FDIC’s Guidance on CRE concentrations.
14
Peer Benchmarking Metrics: Asset Quality
Peer
Ben
chm
arki
ng
Met
rics
: Ass
et Q
ual
ity
Asset Quality
Key Asset Quality Ratios and Metrics
Nonperforming Loans/ Loans
Nonperforming Assets/ Total Assets
Nonperforming Assets + Loans 90 days or more past due / Loan Loss Reserves + Tangible Equity
We also recommend looking at the adjusted ratios which net out delinquent government guaranteed loans and OREO covered by loss-sharing agreements with the FDIC.
Loan Loss Reserves / Nonperforming Loans
See how your reserve coverage compares to peers in your market
Concerns if this dips below 100%
Net Chargeoffs / Average Loans
OREO / Loans and Restructured Loans / Loans
Lagging indicators behind Nonperforming Loans
When these ratios peak – recovery is likely under way
15
Peer Benchmarking Metrics: Profitability
Peer
Ben
chm
arki
ng
Met
rics
: Pro
fita
bili
ty
Profitability
Earnings refer to both profits and profitability, with an emphasis on profitability
Important to identify banks with strong earnings capacity and high profitability
Generate Revenue
Earn way out of trouble by building up capital
Understand how others are continuing to invest in and grow their franchise
Key Profitability Ratios and Metrics
ROAA
ROAE
ROACE
Net Income available to Common (Net Income – Preferred Stock Dividends)/ Average Common Equity
Important to adjust for S-Corps if your institution is, for U.S. federal tax income purposes, either an S corporation or a “qualifying subchapter S subsidiary” as defined by the IRS
16
Peer Benchmarking Metrics: Profitability
Peer
Ben
chm
arki
ng
Met
rics
: Pro
fita
bili
ty
Profitability
Key Profitability Ratios and Metrics
Net Interest Margin
Yield and Cost
Rates on deposit, mortgage and consumer loan products
Understanding fluctuations in earning assets & interest bearing liabilities to help maximize Net Interest Income
Margins under pressure for several quarters
Who is capitalizing on the low-rate environment to juice mortgage production?
Efficiency Ratio
Non-interest expenses / Net Interest Income (FTE) and Non-Interest Income
What’s driving a peer’s ratio? Are you utilizing your resources for maximum production?
Aspects to Consider
Volume of problem assets
Compliance costs
Branch Consolidation – trimming expenses
Median Efficiency Ratio for the industry as of 2012Q3 was 70.6%
Lowest Efficiency Ratio in 1997 at 61%
17
Peer Benchmarking Metrics: Profitability
Peer
Ben
chm
arki
ng
Met
rics
: Pro
fita
bili
ty
Profitability
Noninterest Income/ Operating Revenue
Diversified revenue streams of banks in comparison to your institution
Reliance on service charges on deposits declining
Service charges for deposits fell from 27% to 17% among banks greater than $10B in assets
Service charges for deposits fell from 34% to 24% for banks with less than $10B in assets
18
Peer Benchmarking Metrics: Liquidity
Peer
Ben
chm
arki
ng
Met
rics
: Liq
uid
ity
Liquidity
Ability of your bank to access liquid funds (i.e. cash or cash equivalents – US Treasury Bills or money market securities) to meet current needs for such funds.
For example, acute need can arise if depositors panic and seek to withdraw their funds
Aspects to consider:
Do the banks in your market increase their dependence on non-core/volatile sources of funding such as large time deposits and brokered deposits to fund significant loan growth?
FHLB Advances funding growth?
Composition of funding sources, on/off-balance sheet, securitizations
Funding Stability – deposits, cash and short term assets, commercial paper
19
Peer Benchmarking Metrics: Liquidity
Peer
Ben
chm
arki
ng
Met
rics
: Liq
uid
ity
Liquidity
Key Liquidity Ratios and Metrics
Liquidity Ratio
Ability to pay off short-term debt obligations
Higher liquidity ratios – higher margin of safety to meet current liabilities
Liquid Assets/ Total Assets
Cash and Balances Due from Depository Institutions, Securities, Fed Fund & Repos, Trading Account Assets
Net out pledged securities
On Hand Liquidity/ Total Liabilities
Interest-bearing balances + Total Securities + Fed Funds Sold & Reverse Repos – Fed Funds Purchased & Repos – Pledged Securities / Total Liabilities
The lower your ratio relative to peers, the greater the likelihood your bank will need to sell less liquid assets or use market funding sources to meet incremental liquidity needs
Reliance on Wholesale Funding
Total Borrowings + Brokered Deposits / Total Borrowings + Total Deposits
Total funds drawn from wholesale sources – absence of local deposit funding
Who of your peers with extensive branch networks is avoiding expenses?
20
Peer Benchmarking Metrics: Loan/Deposit Mix
Peer
Ben
chm
arki
ng
Met
rics
: Lo
an/D
epo
sit
Mix
Loan/Deposit Mix
Important to define your peers based on lending practices and funding practices similar to your bank
Competitive pricing
Once you determine those that offer similar products in your market the next step is understanding how your pricing across those products differs or aligns with your competition
Understanding fluctuations and earnings assets & interest bearing liabilities as well as accurate view of competitive pricing = maximize Net Interest Income and margins
Flexibility of pricing strategy relative to competition
Promotional Rates and Specials
Loan / Deposit Ratio
Assessment of a bank’s liquidity and lending capacity
Reached lowest level – Aggregate as of 2012Q3 was 72.14%
Shifts in lending practices
Pricing – In line or out of line with market
21
Peer Benchmarking Metrics: Loan/Deposit Mix
Peer
Ben
chm
arki
ng
Met
rics
: Lo
an/D
epo
sit
Mix
Loan/Deposit Ratio
22
Peer Benchmarking Metrics: Loan/Deposit Mix
Peer
Ben
chm
arki
ng
Met
rics
: Lo
an/D
epo
sit
Mix
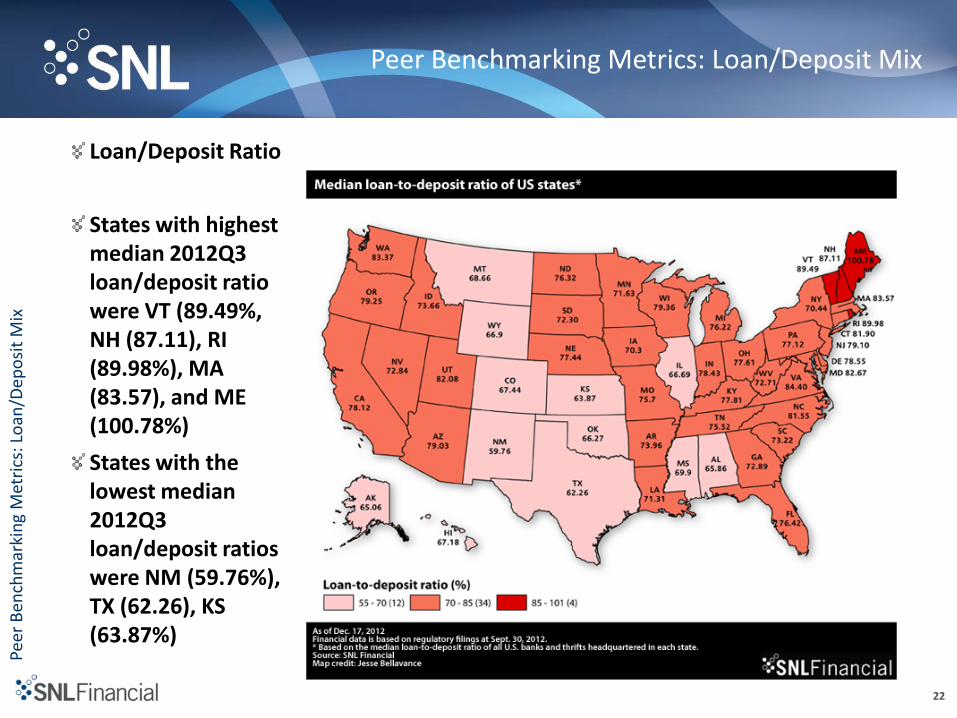
Loan/Deposit Ratio
States with highest median 2012Q3 loan/deposit ratio were VT (89.49%, NH (87.11), RI (89.98%), MA (83.57), and ME (100.78%)
States with the lowest median 2012Q3 loan/deposit ratios were NM (59.76%), TX (62.26), KS (63.87%)
23
Peer Benchmarking Metrics: Sensitivity to Market Risk
Peer
Ben
chm
arki
ng
Met
rics
: Sen
siti
vity
to
Mar
ket
Ris
k
Sensitivity to Market Risk (Interest Rate Risk)
In assessing your bank’s market risk relative to peers, it is important to determine how changes in interest rates, foreign exchange rates, commodity prices, or equity prices could potentially reduce a bank’s earnings or capital.
Primary source of market risk is Interest Rate Risk
Sensitivity to changing interest rates
Mismatches in the repricing term characteristics across assets and liabilities
Gap analysis
Measure of volume of assets and liabilities subject to repricing within a given period (month, quarterly, etc.)
Assets and Liabilities classified according to their maturity and repricing characteristics (short term to long term)
Gap between rate sensitive assets and rate sensitive liabilities – identifies mismatches
Net Interest Income simulations – determine impact of 1%, 2%, or 3% change in short term interest rates on earnings
24
Peer Benchmarking Metrics: Sensitivity to Market Risk
Peer
Ben
chm
arki
ng
Met
rics
: Sen
siti
vity
to
Mar
ket
Ris
k
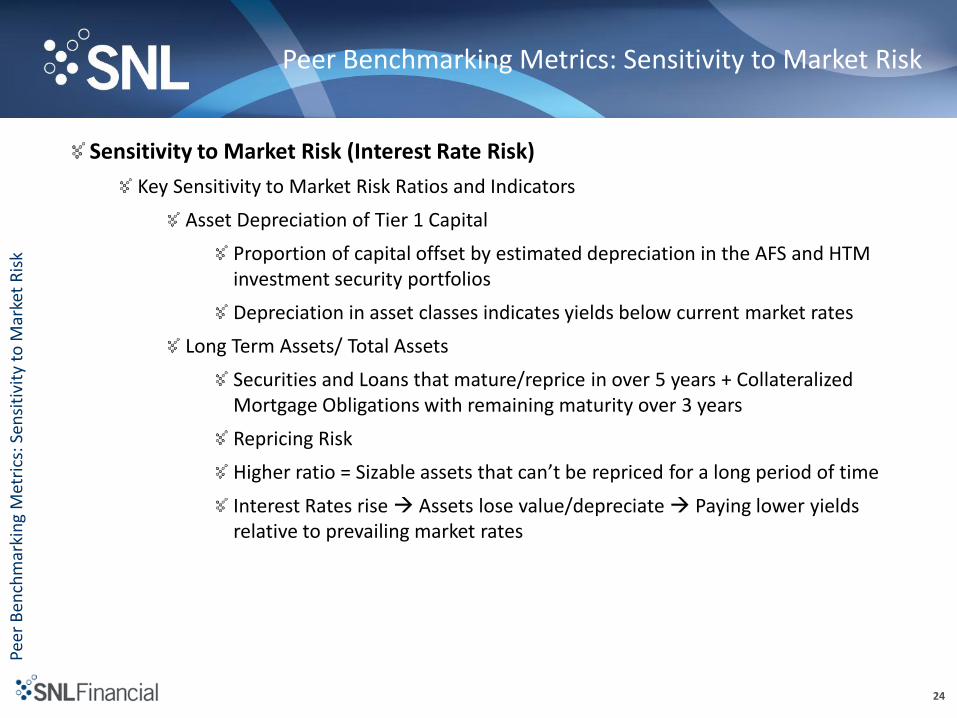
Sensitivity to Market Risk (Interest Rate Risk)
Key Sensitivity to Market Risk Ratios and Indicators
Asset Depreciation of Tier 1 Capital
Proportion of capital offset by estimated depreciation in the AFS and HTM investment security portfolios
Depreciation in asset classes indicates yields below current market rates
Long Term Assets/ Total Assets
Securities and Loans that mature/reprice in over 5 years + Collateralized Mortgage Obligations with remaining maturity over 3 years
Repricing Risk
Higher ratio = Sizable assets that can’t be repriced for a long period of time
Peer Benchmarking Metrics: Sensitivity to Market Risk
Peer
Ben
chm
arki
ng
Met
rics
: Sen
siti
vity
to
Mar
ket
Ris
k
Sensitivity to Market Risk (Interest Rate Risk)
Key Sensitivity to Market Risk Ratios and Indicators
Non-maturity Deposits / Long Term Assets
Degree that non-maturity funding sources cover LT assets
Demand Deposit Accounts, MMDA, Savings, NOW accounts
Non-maturity deposits protect against rising interest rates
Yields generally low and don’t reprice as quickly as other funding sources
Low ratio reliance on rate sensitive non-core funding
Likely to be sensitive to increases in interest rates
Residential Real Estate / Total Assets
Total 1-4 Family Loans + Residential Mortgage-backed securities at Cost Value + Structured Notes at Cost Value
Proxy for negative convexity in balance sheet due to embedded short options in mortgages, Residential MBS and structured notes
Short Options amplify interest rate risk
Compress margins in both rising and falling rate environments
26
Means of Conducting Peer Analysis
27
Means of Conducting Peer Analysis
Mea
ns
of
Co
nd
uct
ing
Peer
An
alys
is
Means of Conducting Peer Analysis
Federal Deposit Insurance Corporation (FDIC Website)
FDIC Uniform Bank Performance Report (UBPR)
State/National/Asset-Based Aggregate Analysis
FDIC Summary of Deposit Data
Office of the Comptroller of the Currency Canary Report
Investment Banks
3rd Party Data and Analytics Provider
28
Means of Conducting Peer Analysis: FDIC Website
Mea
ns
of
Co
nd
uct
ing
Peer
An
alys
is: F
DIC
Web
site
FDIC Website and FFIEC CDR
Manual process of downloading individual bank 031 and 041 call reports from the FFIEC Central Data Repository’s Public Data Distribution Website
Inputting data into Microsoft Excel Workbooks by hand
Time Consuming – Should be reallocated to revenue related activities
Potential for human error
Accuracy – not capturing restatements
Banks can go back in time and restate or amend their call report filings
Essential that you are using the most accurate data relevant to your peer analysis
Capturing data at holding company level for consolidated filers is conducted through the National Information Center (NIC) website
29
Means of Conducting Peer Analysis: FDIC UBPR
Mea
ns
of
Co
nd
uct
ing
Peer
An
alys
is: F
DIC
UB
PR
FDIC Uniform Bank Performance Report
FDIC UBPR is an analytical tool created for bank supervisory, examination, and management purposes.
Concise format
Shows impact of management decisions and economic conditions on a bank’s performance and balance sheet composition – safety and soundness
Preset group of peer banks – comparable in asset size, geography and/or tax status
Regulators also looking at the UBPR
Produced quarterly
Published 30-35 days after the date of a call report or on the call report due date
For example, March 31, Call Report is filed by banks on April 30, and UBPR will not be available until early June.
30
Means of Conducting Peer Analysis: FDIC SOD
Mea
ns
of
Co
nd
uct
ing
Peer
An
alys
is: F
DIC
SO
D
FDIC Summary of Deposit Data
FDIC Summary of Deposits (SOD) is the annual survey of branch office deposits for all FDIC-insured institutions including U.S. branches of foreign banks
Data as of June 30 of each year and released in October
Access data by :
Single institution
Institutions within geographic area
Aggregated within geographic area
Market Share analysis to determine biggest players and competitors in a defined market down to Zip Code level
Aspects to Consider:
Reliance of a Bank on a particular market relative to their total deposits
Proximity Analysis
Rate Intelligence – understanding pricing in markets down to a branch level
31
Means of Conducting Peer Analysis: OCC Canary Report
Mea
ns
of
Co
nd
uct
ing
Peer
An
alys
is: O
CC
Can
ary
Rep
ort
Office of the Comptroller of the Currency Canary Report
Set of risk measurement tools developed by the OCC to identify institutions are risk for future financial distress
Coal mine interpretation
15 financial ratios calculated and compared to OCC benchmarks
If a bank has a ratio that exceeds the benchmark – 1 is assigned
If a banks has a ratio that is below the benchmark – 0 is assigned
Zeros and Ones summed – if > 8 Institution is considered by OCC to be at a higher risk for future financial distress
3 categories: Credit Risk, Interest Rate Risk, and Liquidity Risk
Credit Risk – 6 calculated ratios provide insight into whether or not a bank is adequately protecting itself in case of adverse developments in credit quality
i.e. composition and growth of the loan portfolio
Interest Rate Risk – 4 calculated ratios provide insight in exposure/impact of changing interest rates
i.e. Long-Term Assets/Assets and Residential RE assets capture level of repricing risk
Liquidity Risk – 5 ratios provide insight into funding structure and ability to meet debt requirements in near term as well as reliance on higher cost borrowings that are credit and price sensitive
i.e. Noncore funding dependence and reliance on wholsesale funding
32
Means of Conducting Peer Analysis: Investment Banks
Mea
ns
of
Co
nd
uct
ing
Peer
An
alys
is: I
nve
stm
ent
Ban
ks
Investment Banks
Reliance on investment banks for peer reports
No cost directly associated with peer reports
Lack element of hands-on customization
Not dynamic
Lots of back and forth to define a peer group
Time consuming
May not fully understand your growth, funding and lending strategies
This could be exposed through different angles of your peer analysis
33
Means of Conducting Peer Analysis: 3rd Party Data and Analytics Provider
Mea
ns
of
Co
nd
uct
ing
Peer
An
alys
is: 3
rd P
arty
An
alyt
ics
Pro
vid
er
3rd Party Data and Analytics Provider
Evaluate the offerings of different providers
Fixed Peer Groups vs. Element of Customization
Level of Access Variations – Pay by user vs. Enterprise-wide access
Niche focus vs. Broad Coverage
Complete package – Peer Analysis, Market Analysis, M&A, News, etc.
Compatibility with in-house data
Level of support and training
34
Future of Peer Analysis
35
Future of Peer Analysis
Futu
re o
f Pe
er A
nal
ysis
Future of Peer Analysis
SNL Peer Analytics
SNL Performance Analytics
SNL UBPR Template with Directional Shading
Regulatory Developments
Dodd-Frank
Basel III
Financial Accounting Standards Board
36
Future of Peer Analysis: SNL Peer Analytics
Futu
re o
f Pe
er A
nal
ysis
: SN
L Pe
er A
nal
ytic
s
SNL Peer Analytics
Interactive platform – easy to use, save time, and better leverage internal resources
Fine-tune your balance and improve performance with peer benchmarking
Comparisons against bank and credit union peers
Pre-defined Regional, State, UBPR-like and asset
based peer groups and custom peer groups
“Comparability Score”
Default peer logic that has been fully vetted
by industry experts – logic is fully customizable
Build custom reports with over 10,000 financial
and market data points, including UBPR metrics
Easily build customized peer charts and
export presentation-ready graphics to PDF
or Microsoft Excel.
37
Future of Peer Analysis: SNL Performance Analytics
Futu
re o
f Pe
er A
nal
ysis
: SN
L Pe
rfo
rman
ce A
nal
ytic
s
SNL Performance Analytics
Provides in-depth understanding of the factors driving ROAE for US banks and thrifts
Via tree-like structure, ROAE is broken down into detailed components such as yield on loans, cost of deposits, service charges on deposits, salary expenses, provision for loan losses and several other revenue and expense drivers
Easily see how your bank is performing relative to a custom peer group as well as industry aggregates and indexes
Model “what-if” scenarios to see hypothetical ROAE resulting from changes to performance drivers
38
Future of Peer Analysis: SNL UBPR Template with Directional Shading
Futu
re o
f Pe
er A
nal
ysis
: SN
L U
BP
R w
ith
Dir
ecti
on
al S
had
ing
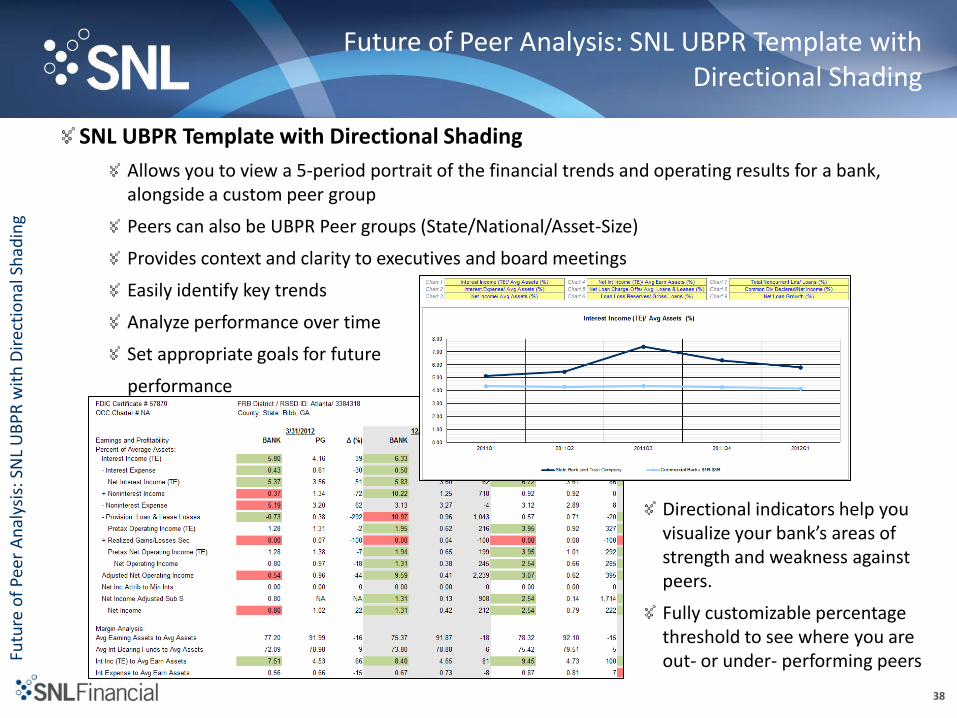
SNL UBPR Template with Directional Shading
Allows you to view a 5-period portrait of the financial trends and operating results for a bank, alongside a custom peer group
Peers can also be UBPR Peer groups (State/National/Asset-Size)
Provides context and clarity to executives and board meetings
Easily identify key trends
Analyze performance over time
Set appropriate goals for future
performance
Directional indicators help you visualize your bank’s areas of strength and weakness against peers.
Fully customizable percentage threshold to see where you are out- or under- performing peers
39
Future of Peer Analysis: Regulatory Developments
Futu
re o
f Pe
er A
nal
ysis
: Reg
ula
tory
Dev
elo
pm
ents
Regulatory Developments
Need access to data on the fly surrounding new regulation
Build reports quickly to keep board members well informed
Recent Regulatory Developments to Consider:
Basel III
Dodd-Frank Act and Elimination of the Office of Thrift Supervision
FASB Proposal around Loan Loss Reserves
Office of the Comptroller of the Currency Guidance on TDRs
40
Future of Peer Analysis: Regulatory Developments
Futu
re o
f Pe
er A
nal
ysis
: Reg
ula
tory
Dev
elo
pm
ents
Regulatory Developments
Basel III Regulation
Basel III is a global regulatory standard on bank capital adequacy that strengthens bank capital requirements and introduces new regulatory requirements on liquidity and leverage.
New capital measure called “Common Equity Tier 1 Capital” was introduced
New Adjusted Risk Weighted Assets – increase in risk-weighted assets for 1-4 Family Loans based on LTV of the loans, Acquisition, Development and Construction loans (HVCRE), and Past Due Loan Exposures.
Important to understand your new capital stance relative to the competition if all proposals were to be adopted
Dodd-Frank and Elimination of the OTS
2010 adoption of Dodd-Frank Act mandate
Savings Institutions began filing Call Reports
Heavier Reporting Burdens 2500 line items vs. 1500 line items
Importance of Common Regulatory Financials – metrics similar amongst call report and historical thrift financial report (TFR)
Essential for Trend Analysis
41
Future of Peer Analysis: Regulatory Developments
Futu
re o
f Pe
er A
nal
ysis
: Reg
ula
tory
Dev
elo
pm
ents
Regulatory Developments
FASB Proposal on Reserves
Financial Accounting Standards Board proposed improvements to Accounting for Credit Losses on Financial Assets on December 20
Aims at more timely recognition of credit losses and more information for investors about the reasons behind your bank’s projections
“Incurred loss” vs. “expected loss” model
Incurred Loss – requires banks to set aside money for troubled loans when losses appear probable or have begun to pile up
Issue – Difficult reads since reserve levels have swung wildly
Expected Loss – Proactive approach - requires banks to immediately project all losses on loans ( for the life of each loan) and debt securities and then set aside money to offset such losses.
Goal – Smooth out reserve levels, provide consistency, and more up-front information
Action plan in place, evaluate accounting tools and due diligence on reserve analysis
Potential for banks to have to increase their loan loss reserves by as much as 50%
42
Future of Peer Analysis: Regulatory Developments
Futu
re o
f Pe
er A
nal
ysis
: Reg
ula
tory
Dev
elo
pm
ents
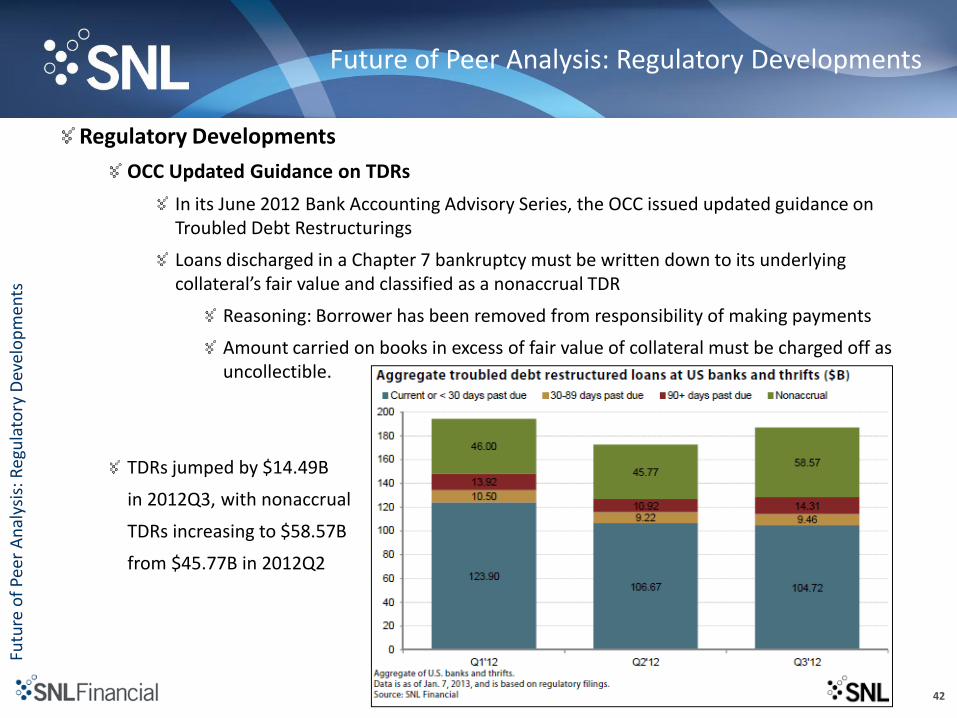
Regulatory Developments
OCC Updated Guidance on TDRs
In its June 2012 Bank Accounting Advisory Series, the OCC issued updated guidance on Troubled Debt Restructurings
Loans discharged in a Chapter 7 bankruptcy must be written down to its underlying collateral’s fair value and classified as a nonaccrual TDR
Reasoning: Borrower has been removed from responsibility of making payments
Amount carried on books in excess of fair value of collateral must be charged off as uncollectible.